Article

Influence of Tropical Cyclones on Outdoor Wind Environment in High-Rise Residential Areas in Zhejiang Province, China

1
Department of Architecture, Huzhou University, Huzhou 313000, China
2
Design School, Xi’an Jiaotong-Liverpool University, Suzhou 215123, China
3
School of Mechanical and Electrical Engineering, Suqian University, Suqian 223800, China
*
Author to whom correspondence should be addressed.
Sustainability 2022, 14(7), 3932; https://doi.org/10.3390/su14073932
Submission received: 20 February 2022 / Revised: 23 March 2022 / Accepted: 24 March 2022 / Published: 26 March 2022
(This article belongs to the Section Green Building)

Abstract

:
Tropical cyclones can cause tremendous harm to coastal areas. This research aims to explore the influence of tropical cyclones on outdoor wind environments in high-rise residential areas in the southeast coastal provinces of China, using Zhejiang Province as an example. It investigated four cities located in Zhejiang Province, including Taizhou and Wenzhou representing coastal cities, and Huzhou and Jiaxing representing inland cities, and collected data from 209 high-rise residential areas. Of these 209 samples, 131 high-rise residential areas with three typical spatial layouts (i.e., rows-style, free-style, and courtyard-style) have been selected for further studies. Numerical simulation was conducted to analyze the outdoor wind environment of these three types of high-rise residential areas, where the height of buildings was set as 26 floors (75 m), during tropical cyclones. Based on a comparison of the wind velocity at the horizontal planes of 1.5 m high and 10 m high, it was found that the spatial layouts of high-rise residential areas could mitigate the negative impact of tropical cyclones on the outdoor wind environment. Specifically, in the coastal cities, the courtyard-style layout led to a relatively small proportion of high wind speed areas (e.g., wind velocity above 14.4 m/s) in the high-rise residential areas; and in the inland cities, the free-style layout led to a relatively small proportion of high wind speed area in the high-rise residential area. In turn, to better cope with the tropical cyclones, it was suggested that the courtyard-style layout should be recommended for high-rise residential areas located in the coastal cities and the free-style layout should be recommended for high-rise residential areas located in the inland cities in coastal provinces.

1. Introduction

China is a country regularly hit by tropical cyclones (TCs) [1]. Statistically speaking, there are around 7–9 TCs that land in China every year [1,2,3]. TCs bring strong winds and heavy precipitation to coastal cities and often result in damage to the buildings, roads, urban infrastructure and landscape, and sometimes personal injury [4,5,6]. With the rapid urbanization in China and the increase in population in the southeast coastal provinces, a large number of high-rise residential communities were built in cities in Jiangsu, Zhejiang, and Fujian provinces. These high-rise buildings can further impact the wind environment around the buildings [7,8], for instance, increasing the pedestrian-level wind speed [9]. During the duration of TCs, therefore, the potential safety risk for pedestrians (especially the elderly and children) in these high-rise residential communities will be significantly increased. This paper aims to explore the influence of different spatial layouts of high-rise residential areas on the outdoor wind environment under TCs. Previous research in this field was mainly focused on field measurement. For instance, Li et al. investigated the wind environment around a high-rise building during a landfall typhoon and reported that the relationship between the turbulence intensity and gust factor could be described by a power law [10]. Wang et al. measured the wind flow on the roof of a high-rise building under typhoons and found that, when the angle between the incoming flow and the building was 45°, the impact of typhoons was relatively small [11]. Wang et al. investigated the characteristics of the wind field on the roofs of three high-rise buildings during typhoons based on field measurement and provided recommended design strategies that could mitigate the impact of turbulence on high-rise buildings in typhoon-prone areas [12]. Li et al. evaluated the serviceability of high-rise buildings during typhoons and indicated that the buildings next to the high-rise buildings played an important role in reducing the influence of typhoons [13]. The potential safety issues due to the impact of tropical cyclones on high-rise buildings have also been researched [14,15,16]. These studies provided useful evidence to inform the design of high-rise buildings in coastal cities. However, there was a lack of research on the influence of TCs on the outdoor wind environment in high-rise residential areas in coastal provinces.
This paper analyzes the typical spatial layouts of high-rise residential areas in the coastal and inland cities of Zhejiang Province and simulates the outdoor wind environment at 1.5 m and 10 m horizontal planes during TCs. It aims to explore the impact of TCs on the outdoor wind environment in these areas. It is expected that some discussions and findings would lead to spatial design guidance that could help adapt high-rise residential areas located in Zhejiang Province and other southeast coastal provinces of China to TCs.

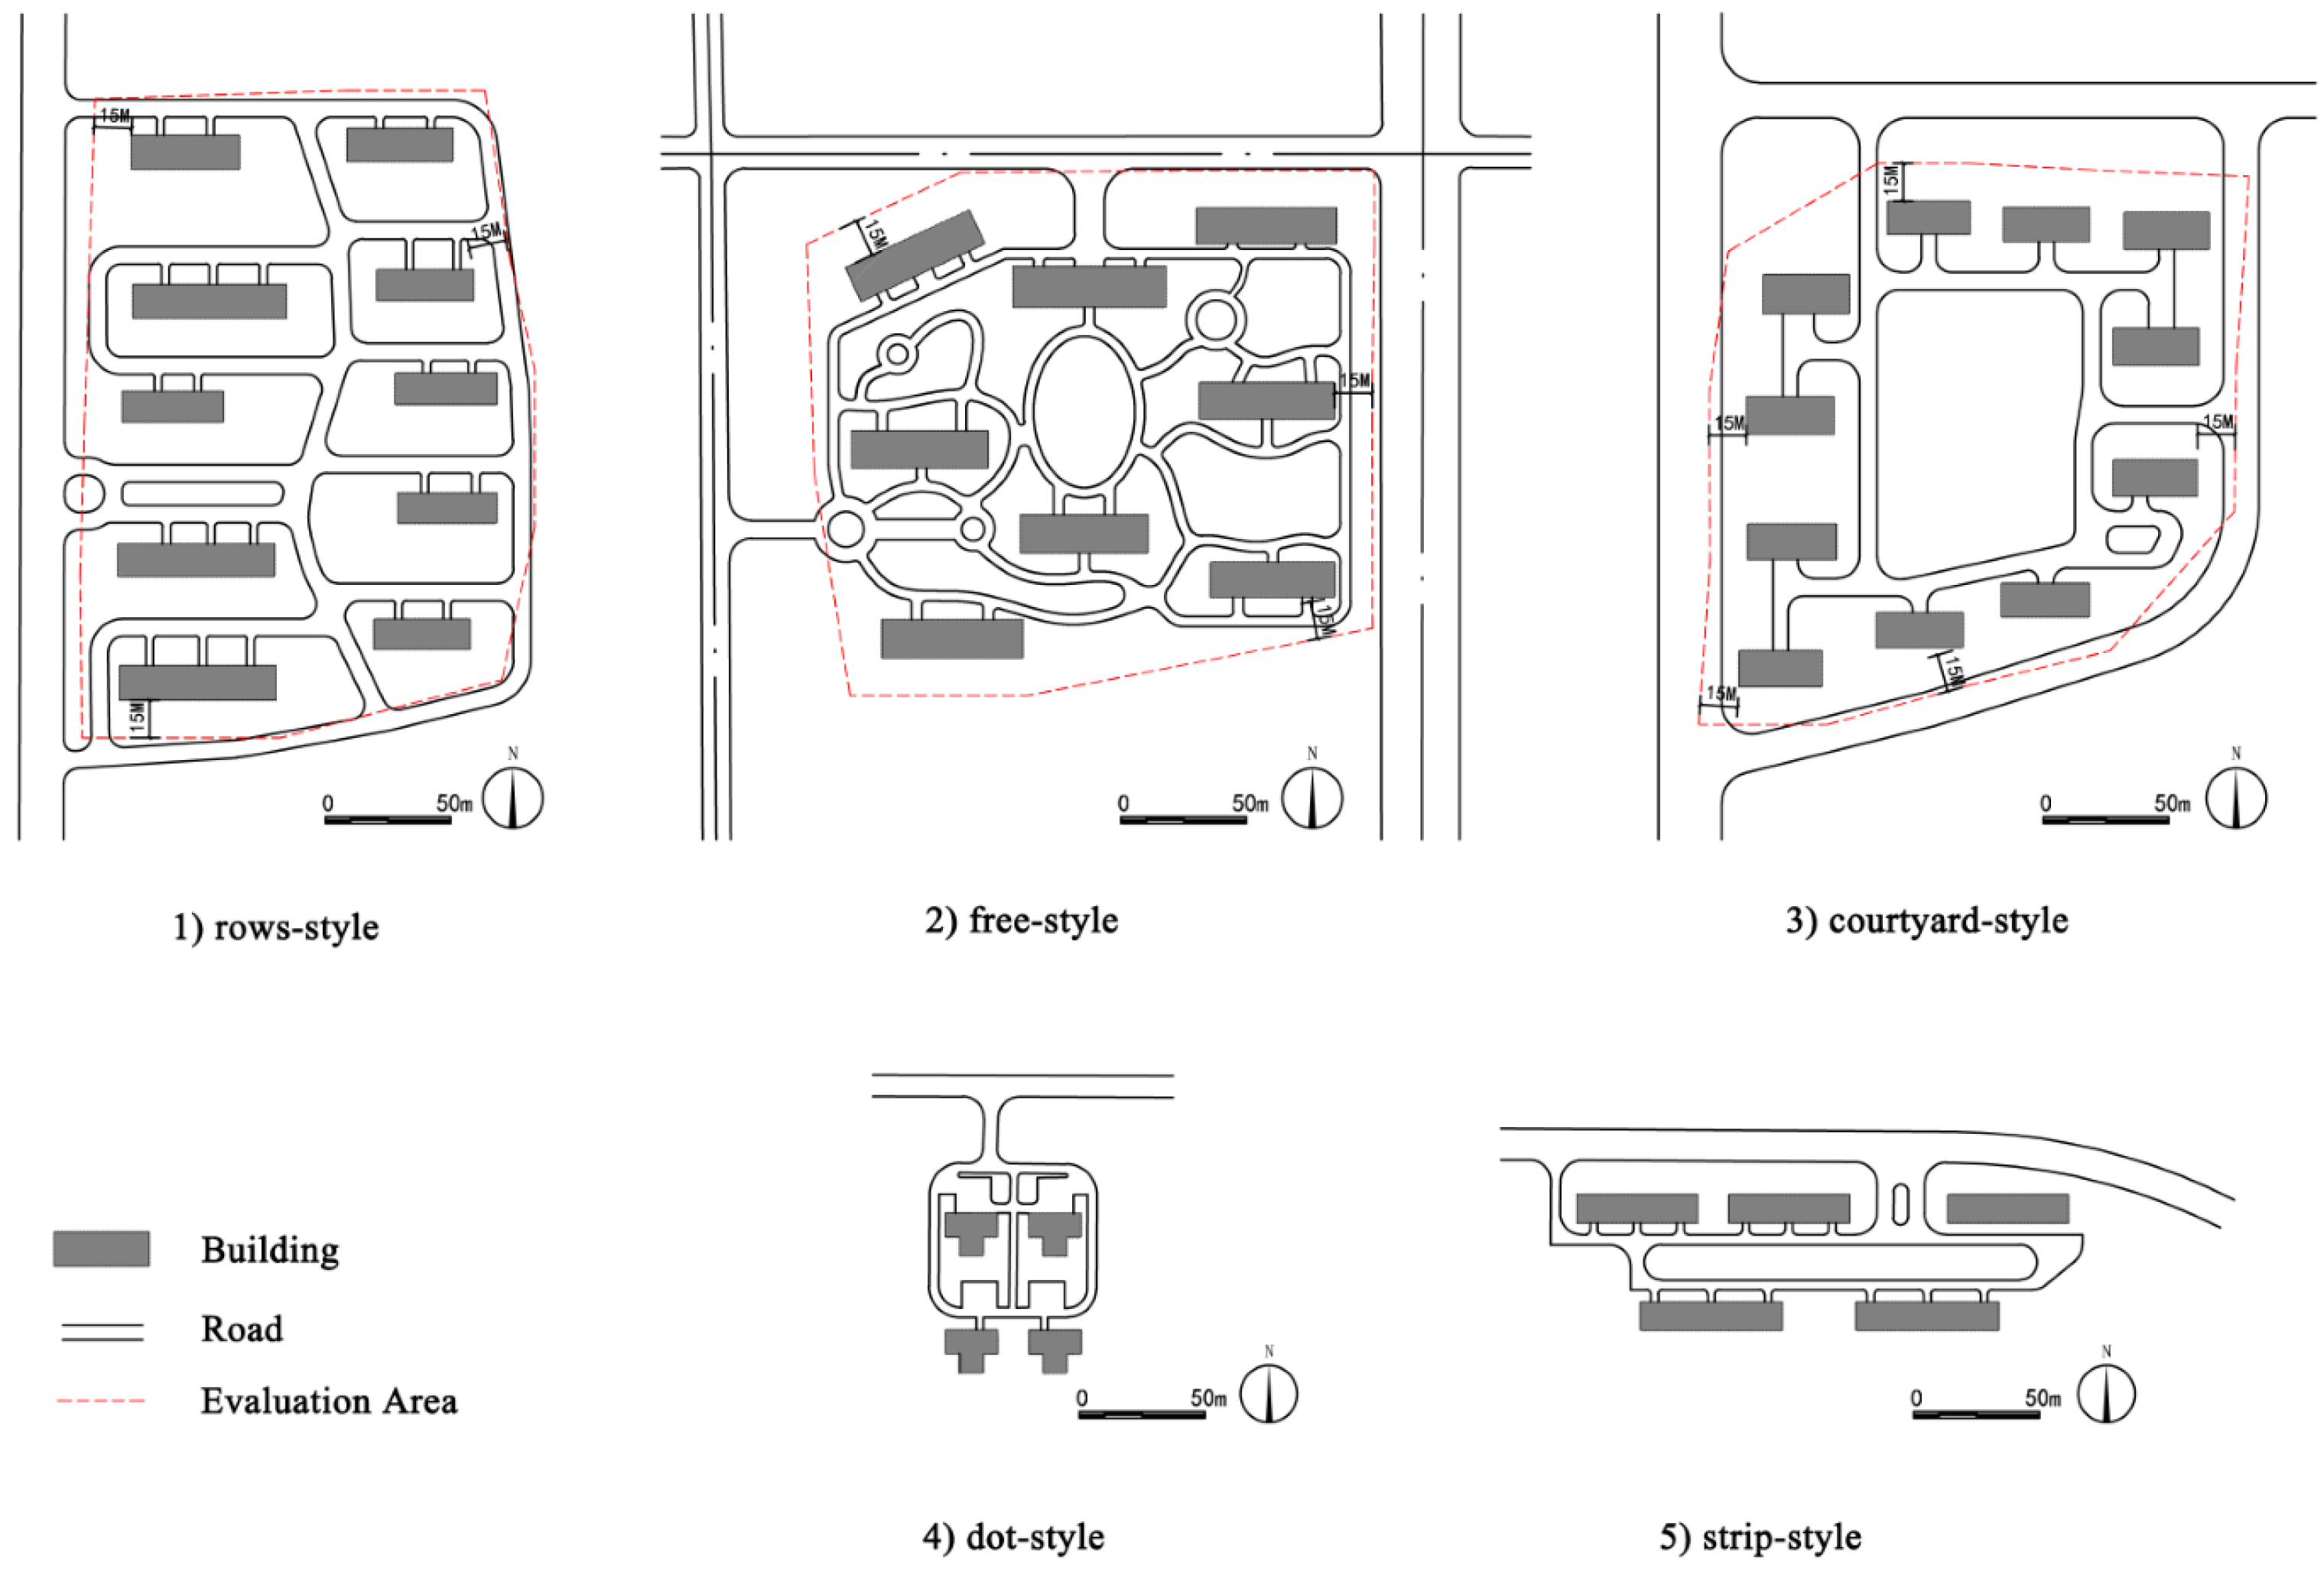
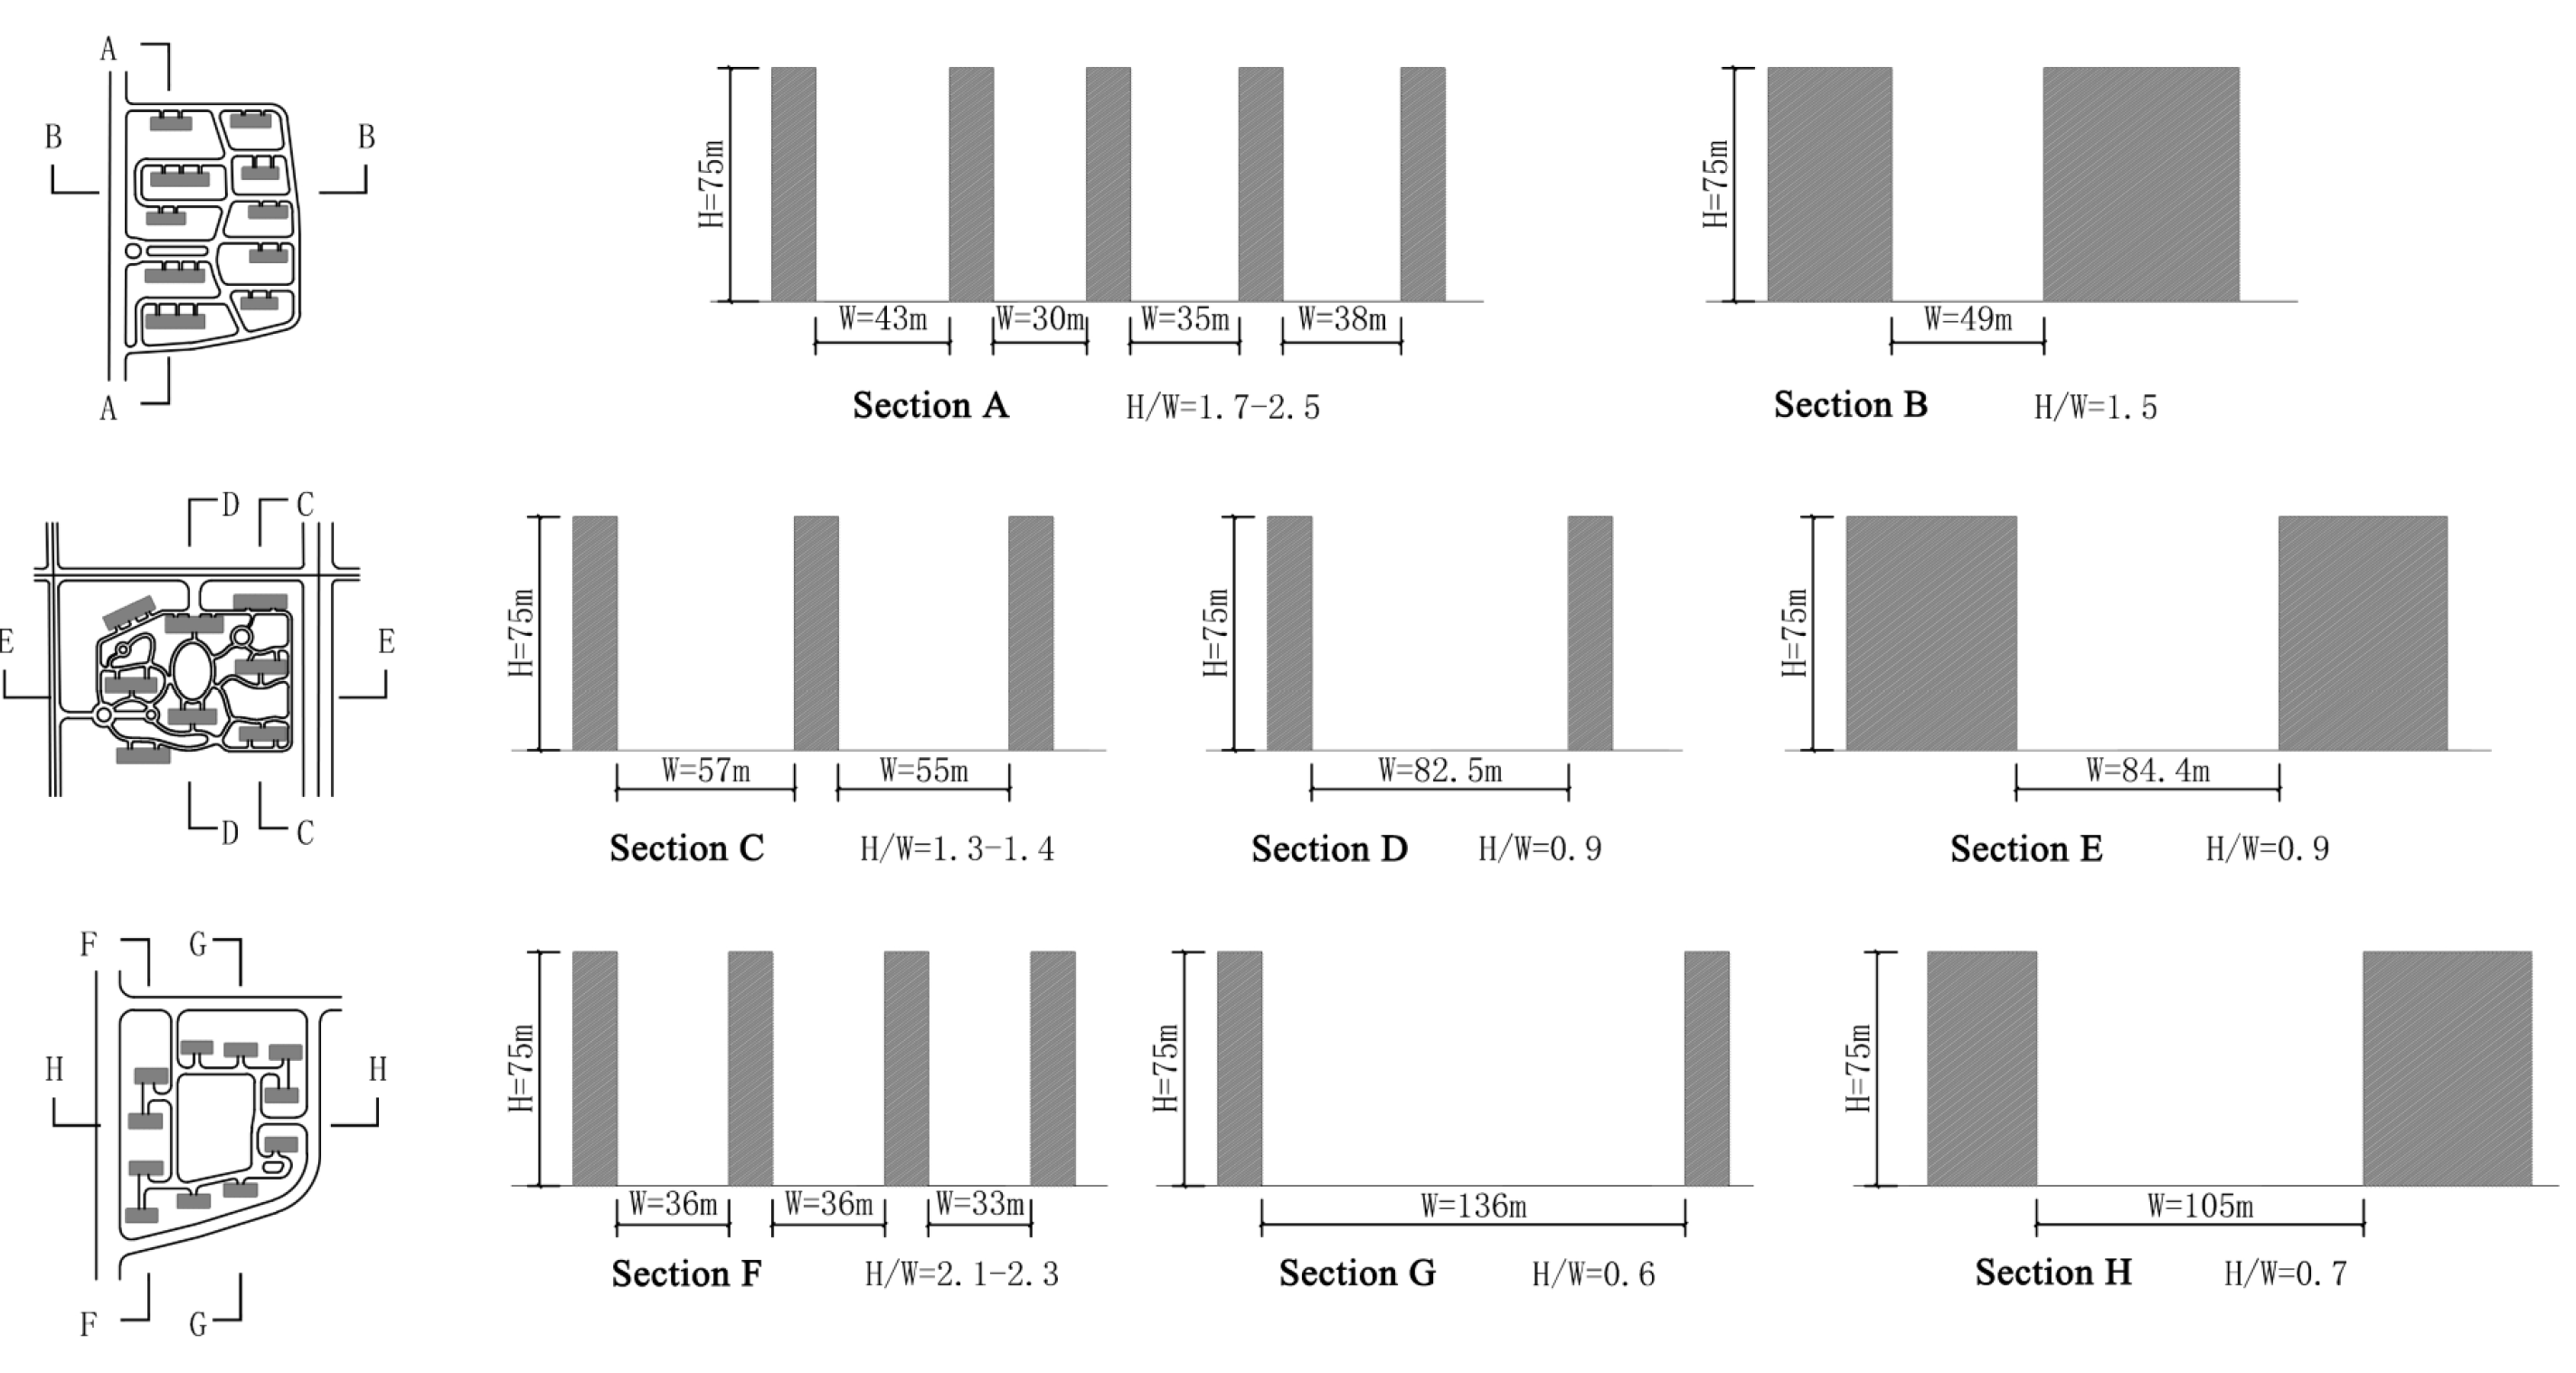
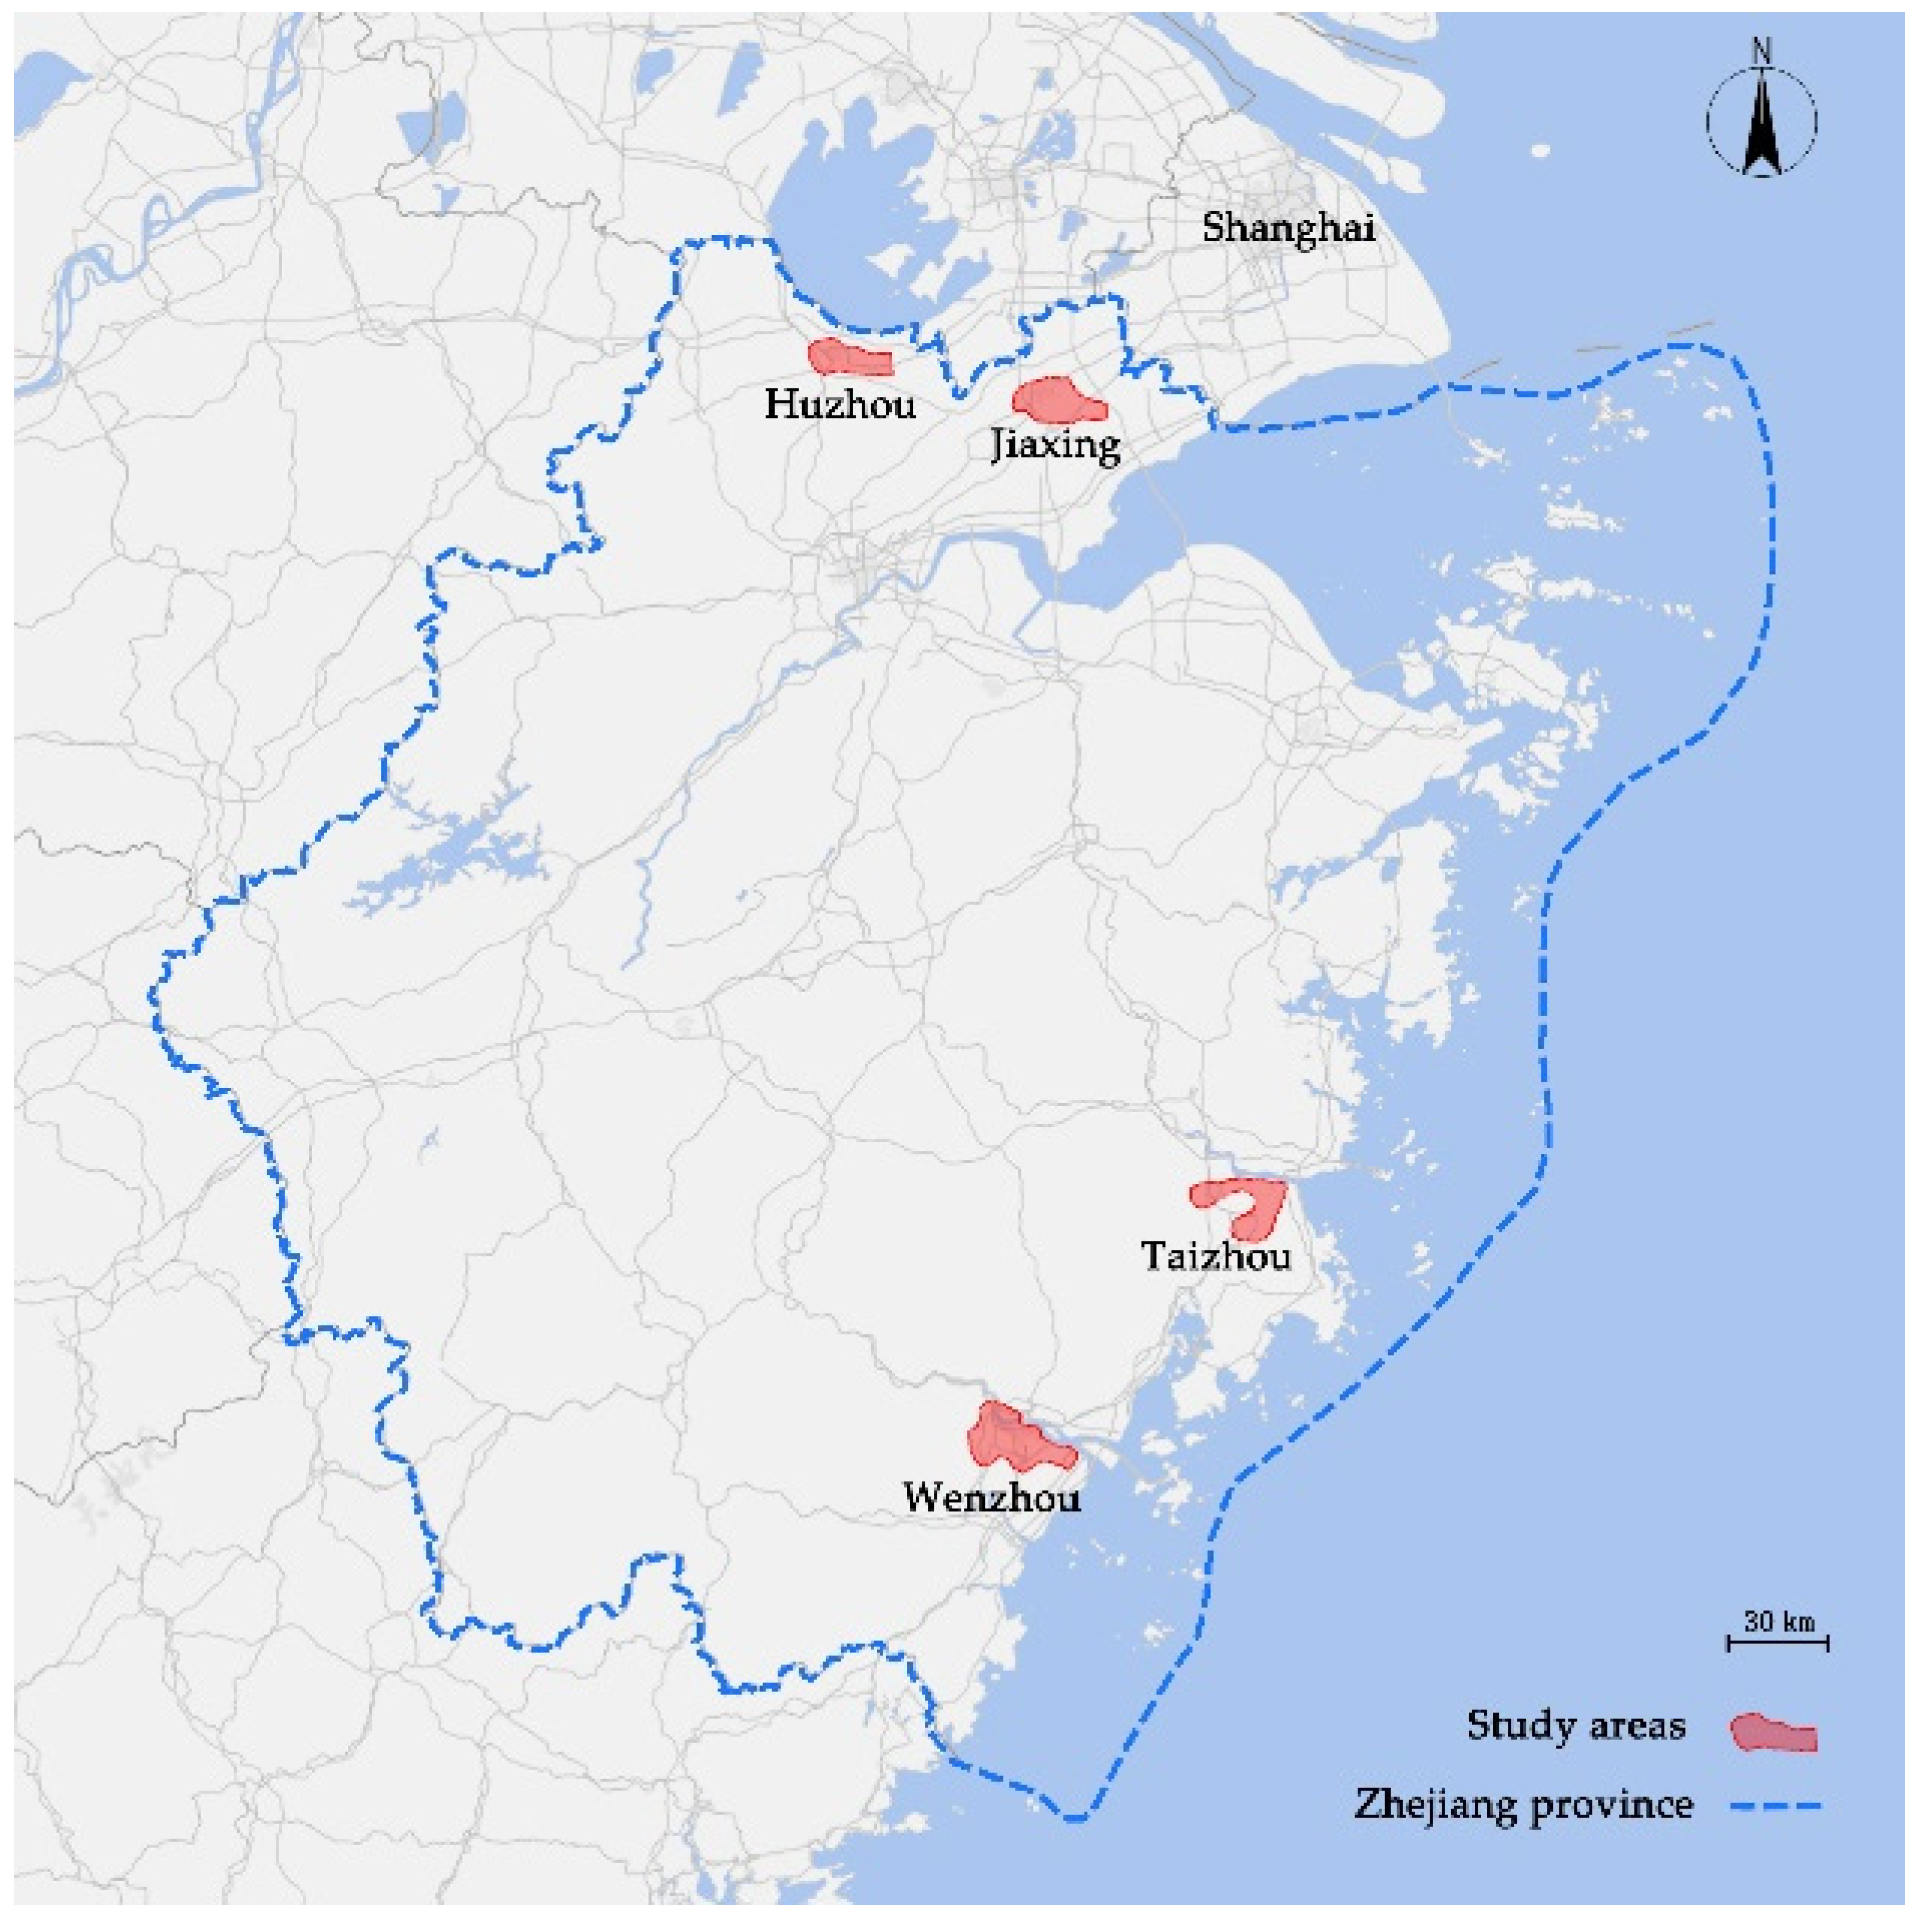
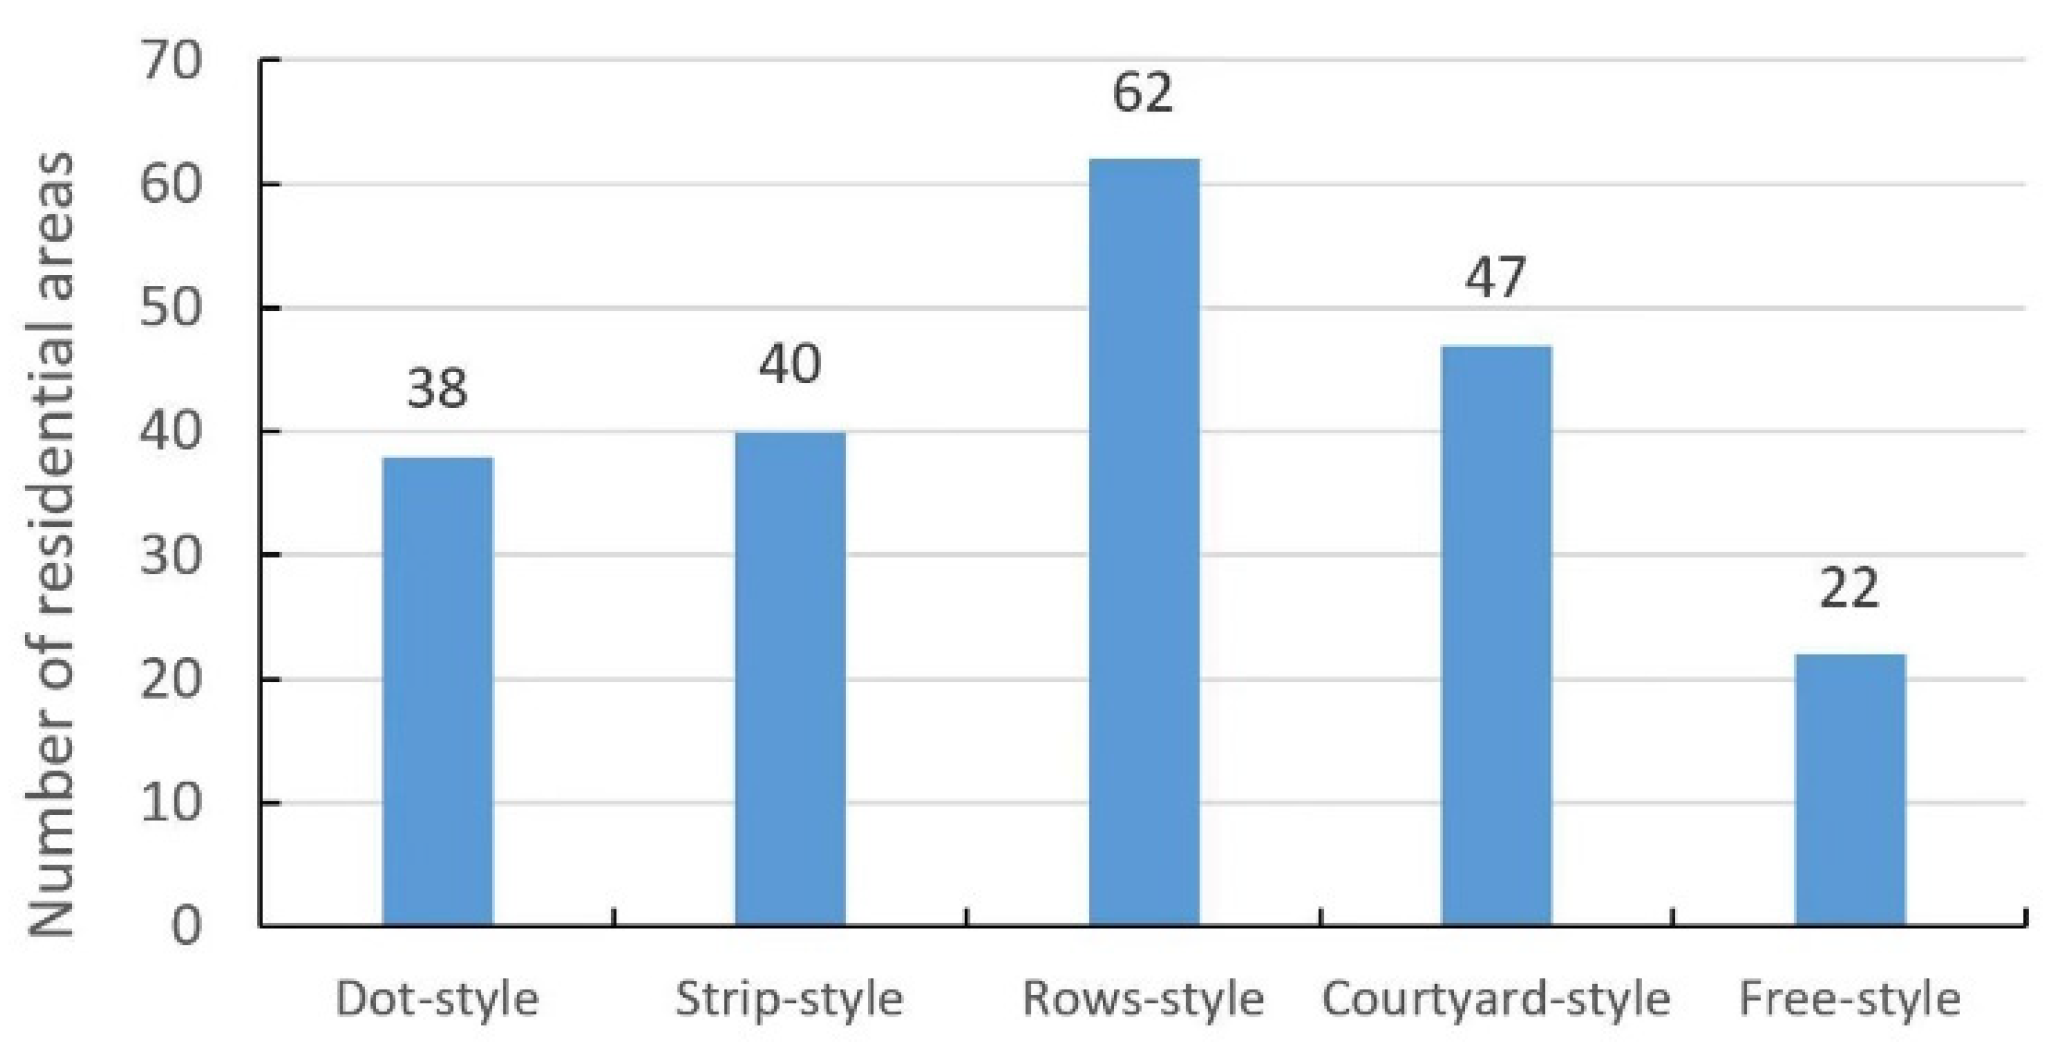
2. Investigation on High-Rise Residential Areas in Zhejiang Provinces, China

This paper investigates high-rise residential areas in four cities in Zhejiang Province, China, including two coastal cities (e.g., Taizhou and Wenzhou) and two inland cities (e.g., Huzhou and Jiaxing) (Figure 1). Two hundred and nine typical high-rise residential areas in these cities (including 31 in Taizhou, 89 in Wenzhou, 44 in Jiaxing, and 45 in Huzhou) were randomly selected for further studies. A site investigation was then conducted to collect information on these residential areas (e.g., spatial layouts, total floor numbers, etc.).
Based on the classification method from previous research, the spatial layouts of the 209 high-rise residential areas have been divided into five categories [17], which are (1) rows-style (i.e., residential buildings are arranged in rows according to a certain orientation and spacing); (2) free-style (i.e., residential buildings are freely arranged according to factors such as sunlight); (3) courtyard-style (i.e., residential buildings are designed to form an internal courtyard); (4) dot-style (i.e., residential towers are designed in a compact layout); and (5) strip-style (i.e., residential buildings have a large length–width ratio) (Figure 2).
The spatial layouts of 209 high-rise residential areas have been classified and summarized in Figure 3. Considering that the spatial layouts of dot-style and strip-style can hardly be changed in real projects under the control of ‘Standard for Urban Residential Area Planning and Design’ (e.g., floor–area ratio, green space ratio, etc.), these two types have been excluded from this study. High-rise residential areas with a rows-style layout (62 samples), a free-style layout (22 samples), and a courtyard-style layout (47 samples) have been selected for further analysis (131 samples in total). Figure 4 shows the typical building sections of these three spatial layouts.
According to the onsite observation and measurement of the building height in 131 high-rise residential areas, most buildings are 22-, 26-, or 28-floors high. To ensure that the simulation results would reflect the real situation of most of the cases, this research set the building height as 26 floors in the numerical simulation of the outdoor wind environment.

3. Methods of Numerical Simulation of Wind Environment

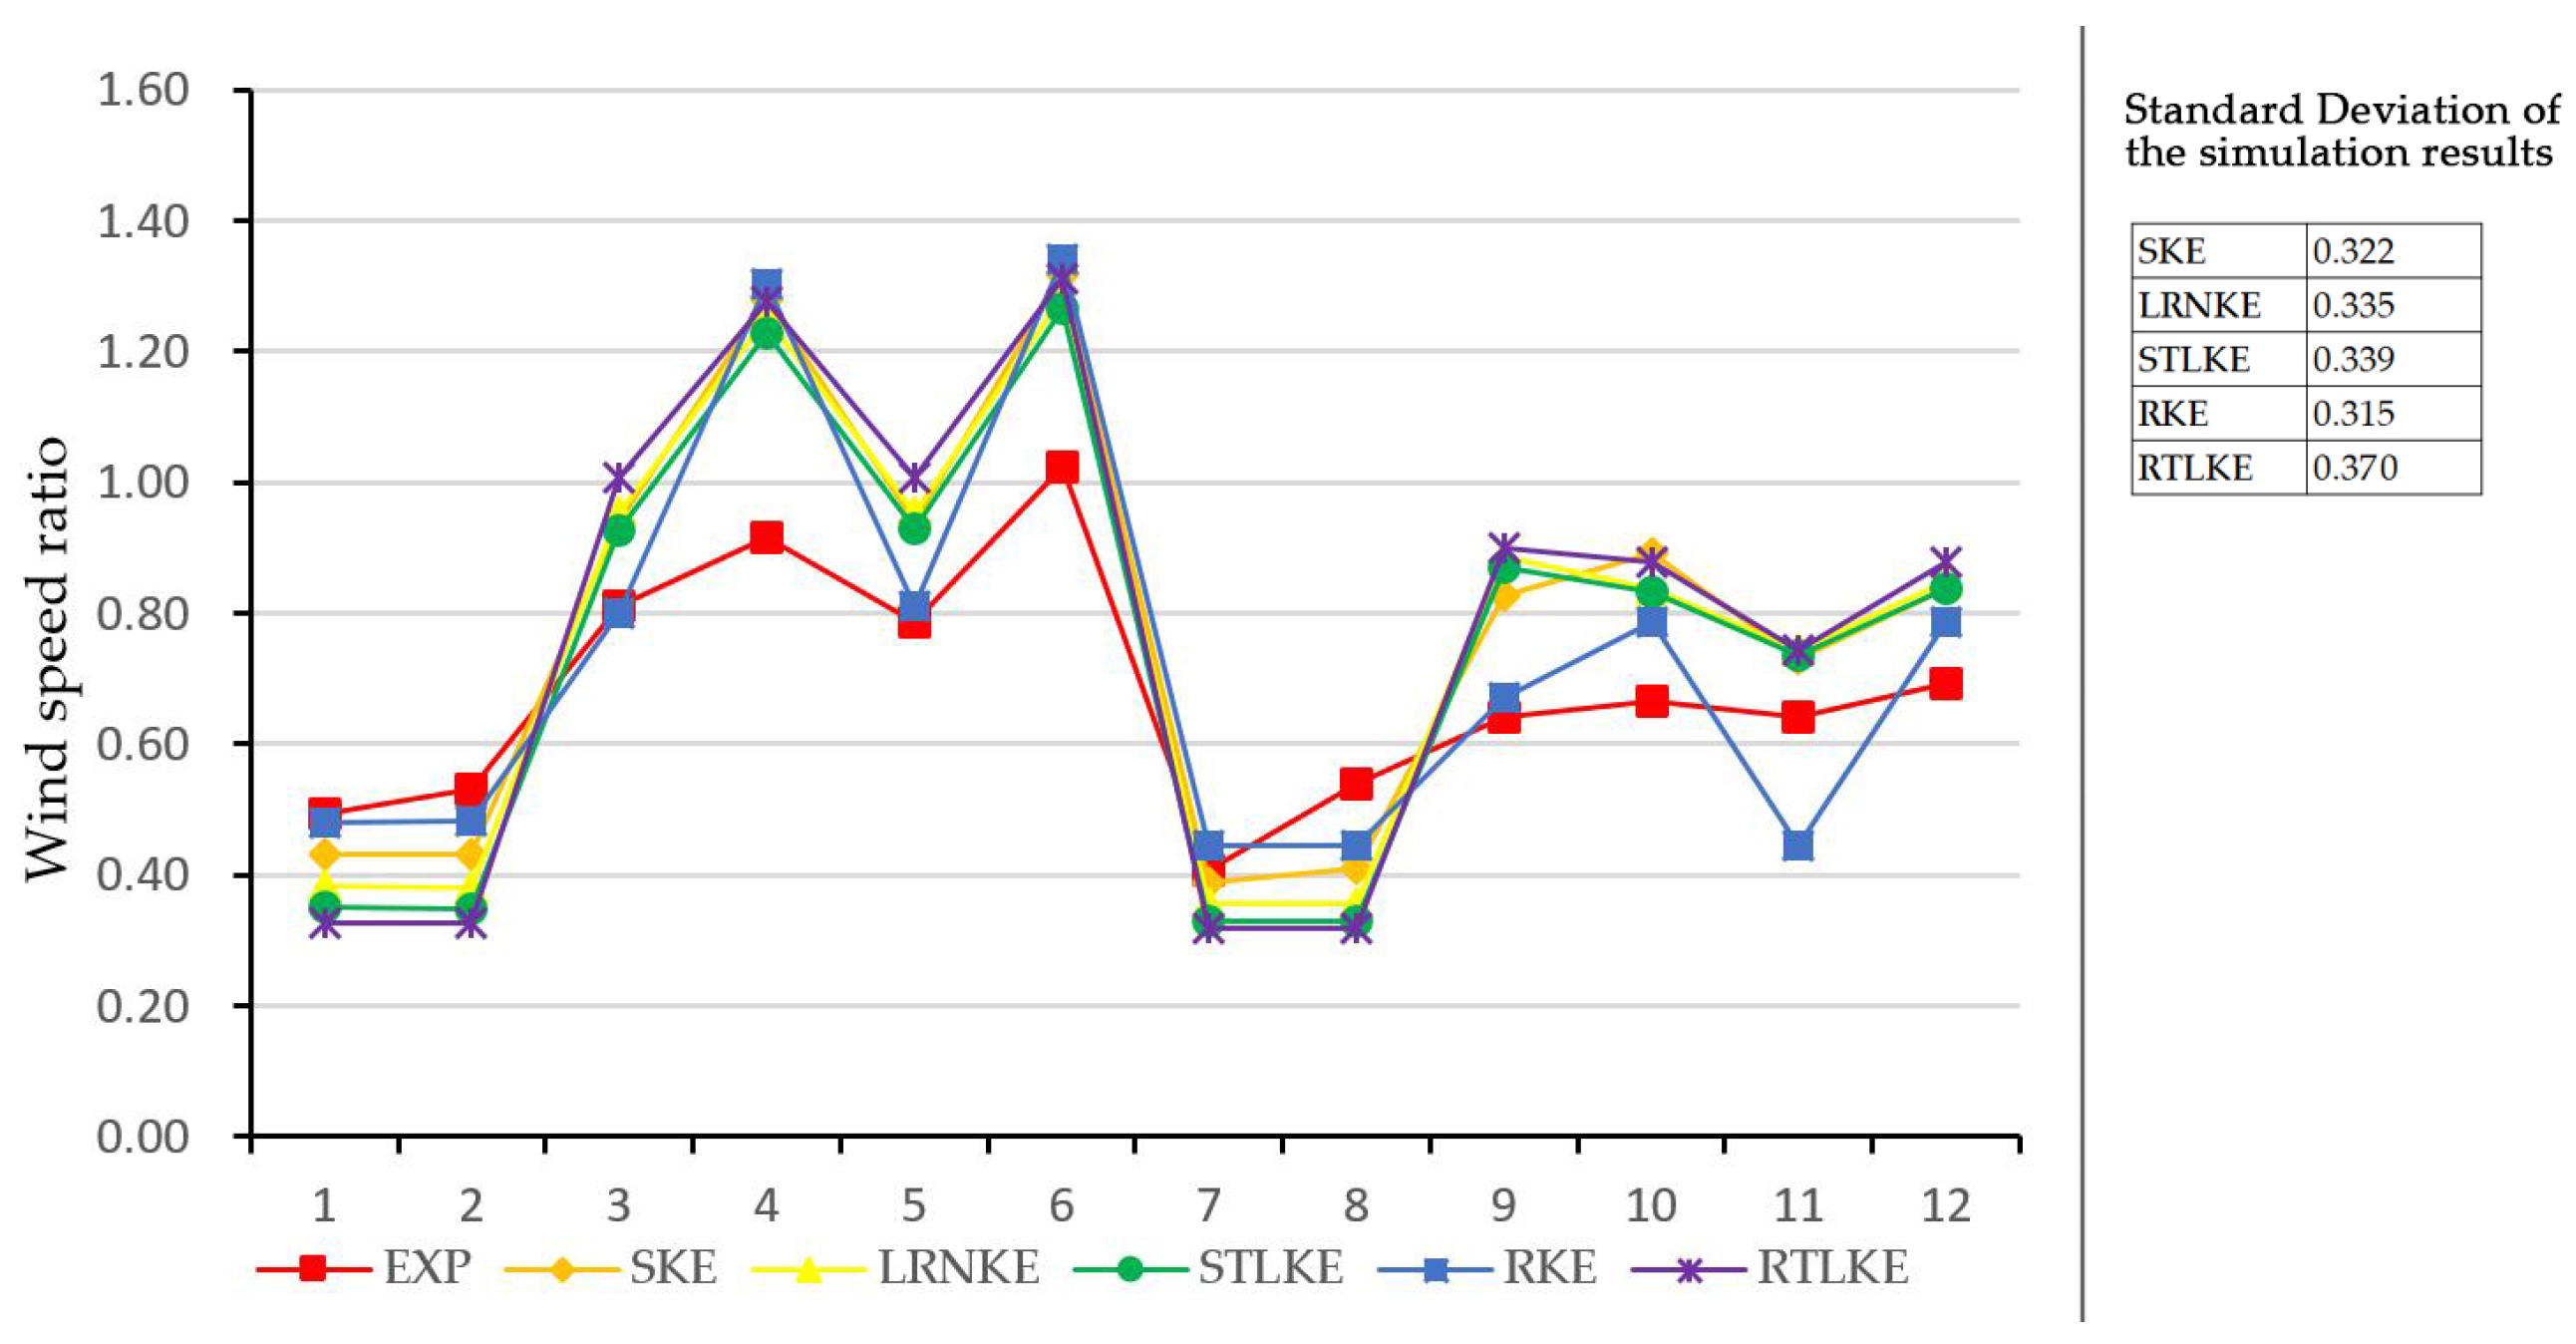
3.1. Verification of Numerical Simulation Method

Nonomura et al. conducted wind tunnel experiments on the flow field around simple building blocks and tested the wind speed ratio around the central building at different incident angles [18]. Using this benchmarking model, the Architectural Institute of Japan (AIJ) conducted a range of numerical simulation experiments and preliminarily summarized the calculation conditions for numerical simulation [19]. Using these calculation conditions, this paper compares the simulation results produced by the SKE model, standard low-Reynolds number k–ε (LRKE) model, standard two-layer k-ε (STLKE) model, realizable k–ε (RKE) model, and realizable two-layer k-ε (RTLKE) model with the results of wind tunnel experiments to identify the most appropriate model for simulating and analyzing the outdoor wind environment around high-rise residential buildings.
This paper uses the software of Star CCM+ to conduct numerical simulations. The calculation conditions refer to the AIJ experimental settings (Table 1) [19]. Twelve test points are arranged around the buildings, as shown in Figure 5.
The simulation results are shown in Figure 6. The simulation results of the five models are close to those of wind tunnel experiments (with a Standard Division less than 0.4), though the deviation becomes slightly larger when the wind speed ratio goes beyond 0.8. Among all the turbulence models, the simulation results of the RKE model are closest to those of wind tunnel experiments (SD = 0.315).

3.2. Analysis of Wind Speed Affected by Tropical Cyclones

Affected by dense urban fabrics, the wind speed in urban areas is relatively slow. Zhang tested the wind speed around high-rise buildings in Wenzhou during TCs (i.e., Matmo, Chan-hom, Trami, Dujuan, Soulik) [20]. The maximum measured average wind speeds in 10 min were 13.2 m/s in TCs Matmo, 12.8 m/s in TCs Chan-hom, 15.84 m/s in TCs Trami, 14.8 m/s in TCs Dujuan, and 16.6 m/s in TCs Soulik. To cover most TC scenarios for coastal cities, this paper set the wind speed as 15 m/s to simulate the outdoor wind environment of high-rise residential areas in coastal cities. Li et al. analyzed the characteristic distribution of surface winds associated with 51 TCs that landed in mainland China in 2008–2014 and found that there was a high frequency of 6–7 gales in inland cities (e.g., Jiaxing, Huzhou, etc.) in coastal provinces during TCs [21]. To cover most TC scenarios for inland cities, this paper set the wind speed as 12 m/s to simulate the outdoor wind environment of high-rise residential areas in inland cities of coastal provinces.

3.3. Numerical Simulation of High-Rise Residential Buildings

The numerical simulation method was applied to analyze the outdoor wind environment of high-rise residential areas with three typical layouts during TCs. The relevant settings are described in the following subsections.

3.3.1. Simplifying the Model

To facilitate numerical simulation and the subsequent comparative studies, the model of the high-rise residential area was simplified by removing temporary structures and streamlining the building types. The building height was set as 26 floors (e.g., 75 m). Figure 7 shows the results of the simplified models.

3.3.2. Setting the Computational Domain

The building coverage was less than 3% of the entire computational domain. The target building was 3H (H referred to the maximum height of the target building) away from the inflow boundary, 5H away from the side boundary, 10H away from the outflow boundary, and 5H away from the top of the area [22,23]. Since the height of the target buildings was set as 75 m in this simulation, the target buildings were located 225 m away from the inflow boundary, 750 m away from the outflow boundary, 375 m away from the side boundary, and 375 m away from the top in the computational domain.

3.3.3. Mesh Generation

Considering that polyhedral mesh could generate more accurate simulation results with a lower mesh amount and calculation time [24], this paper selected polyhedral mesh for numerical simulation. First, the base mesh size of the computational domain was set. A relatively small mesh size was used for the buildings and the areas near the buildings to make sure that each boundary had more than 10 mesh elements [22,23]. The boundary layer meshes were added to the ground and the buildings [22]. Mesh sensitivity analysis was conducted in Section 3.4 of this paper. According to the results of mesh sensitivity analysis, the base mesh size of the computational domain was determined to be 40 m, the relative mesh size of the high-rise residential buildings was 4% of the base mesh size, and the relative mesh size of the areas near the buildings was 20% of the base mesh size. Figure 7 shows the generated mesh. The entire computational domain was divided into around 0.6 million mesh.

3.3.4. The Physical Model

The gas in the computational domain was set with a steady and constant density. The RKE Model was used as the turbulence model. The simulation accuracy of this model has been verified in Section 3.1 of this paper.

3.3.5. Setting of Boundary Conditions

Inlet Boundary: The wind velocity (U) was set as 15.0 m/s (coastal cities), 12 m/s (inland cities in coastal provinces), and the wind was from the southeast (i.e., the same direction as TCs). The turbulent kinetic energy (k) and turbulent energy dissipation rate (ε) could be calculated [22].
Outlet Boundary: The gradient of each flow parameter (U, k, ε) along the streamline direction was 0.
Building surface boundary: The smooth wall condition was selected, and the parameters were set with default values.
Ground boundary: The rough wall condition was selected, and the parameters were set with default values.
Side boundary and Top boundary: The smooth wall condition was selected, and the parameters were set with default values.
The above conditions were set in numerical simulation, and the evaluation area of each residential area was set as the space between buildings, including 15 m setbacks (i.e., the red dot line in Figure 3). The evaluation area of each layout was approximately 3.71 Ha. The wind environment at the horizontal planes of 1.5 m and 10 m high was analyzed and evaluated; 1.5 m was the height for pedestrians to participate in outdoor activities and 10 m was the maximum height of outdoor structures and trees. Since the space with a height of more than 10 m had nothing to do with people’s outdoor activities, it was not taken into account in this paper.
Based on previous research on a comfortable wind environment [25,26,27], Soligo et al. summarized the preferable wind speed for different human activities (e.g., sitting, standing, walking, etc.) and indicated that people would feel uncomfortable if the wind speed was higher than 5 m/s (18 km/h) and the frequency was higher than 20%, and the wind would result in a potential safety risk, especially for the elderly and children, if its speed was higher than 14.4 m/s (52 km/h) with a frequency higher than 0.1% [28].
Since this research focuses on the impact of TCs on the outdoor wind environment, the default field functions in the software were used to analyze the areas with a wind speed higher than 14.4 m/s and to calculate the ratio of the high wind speed area to the evaluation area.

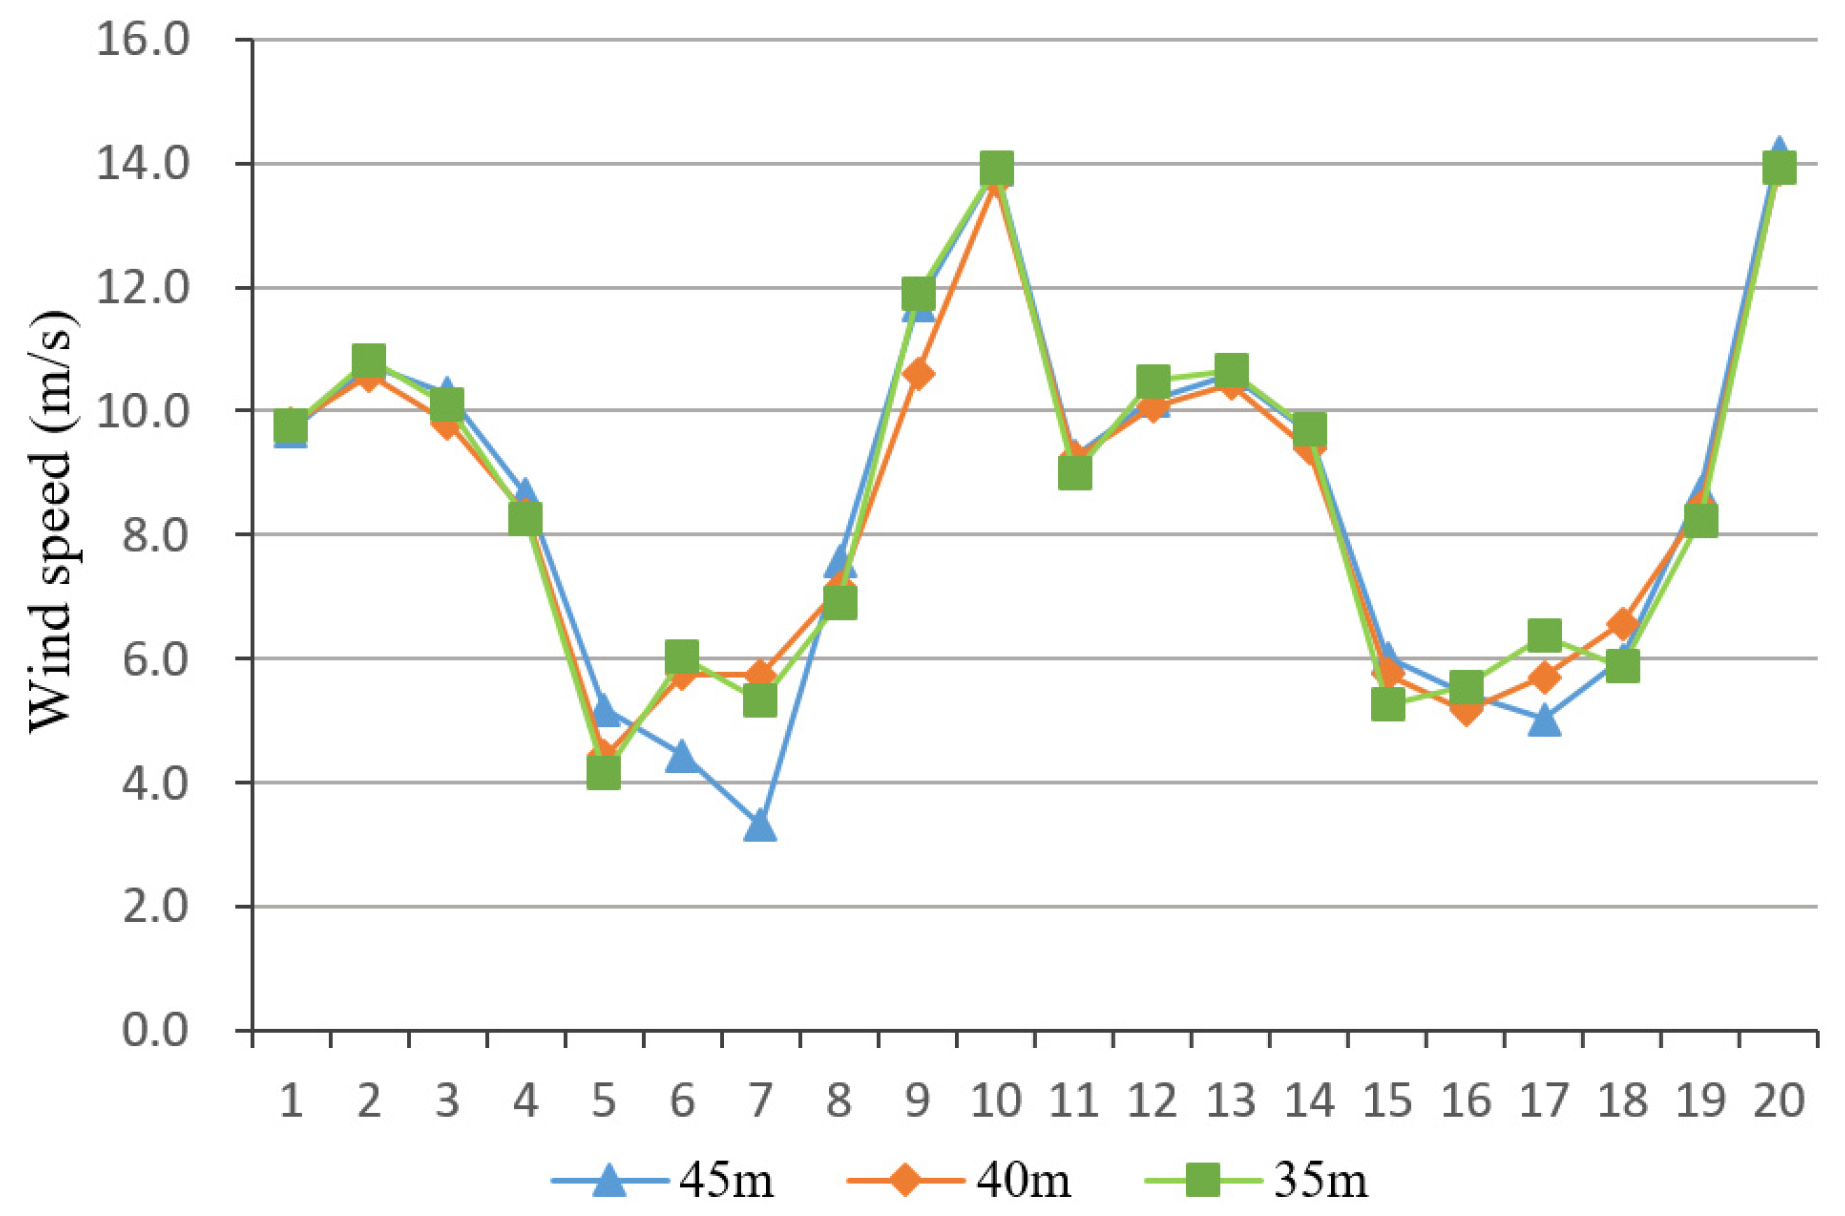
3.4. Mesh Sensitivity Analysis

Referring to previous research [22,23], the base mesh sizes were set to 45 m, 40 m, and 35 m, and the relative mesh size of the high-rise residential building was 4% of the base mesh size and the relative mesh size in the areas near the buildings was 20% of the base mesh size. The simulation conditions were described in Section 3.3 of this paper. The residential area with a rows-style layout was used to test the mesh sensitivity. Twenty test points were arranged along a straight line at a height of 1.5 m above the ground (Figure 7a). The comparative results of wind speed values at 20 test points under three sizes of mesh were shown in Figure 8. Comparing the wind speed variation lines of 45 m and 40 m in the figure, the deviation of wind speed values of some test points was slightly different. Comparing the wind speed variation lines of 40 m and 35 m in the figure, the data were relatively consistent and there was no significant difference. Therefore, the 40 m mesh was selected as the base mesh for numerical simulations in this paper (See in Supplementary Material).

4. Results

4.1. Results of Numerical Simulation of Wind Environment in Coastal Cities

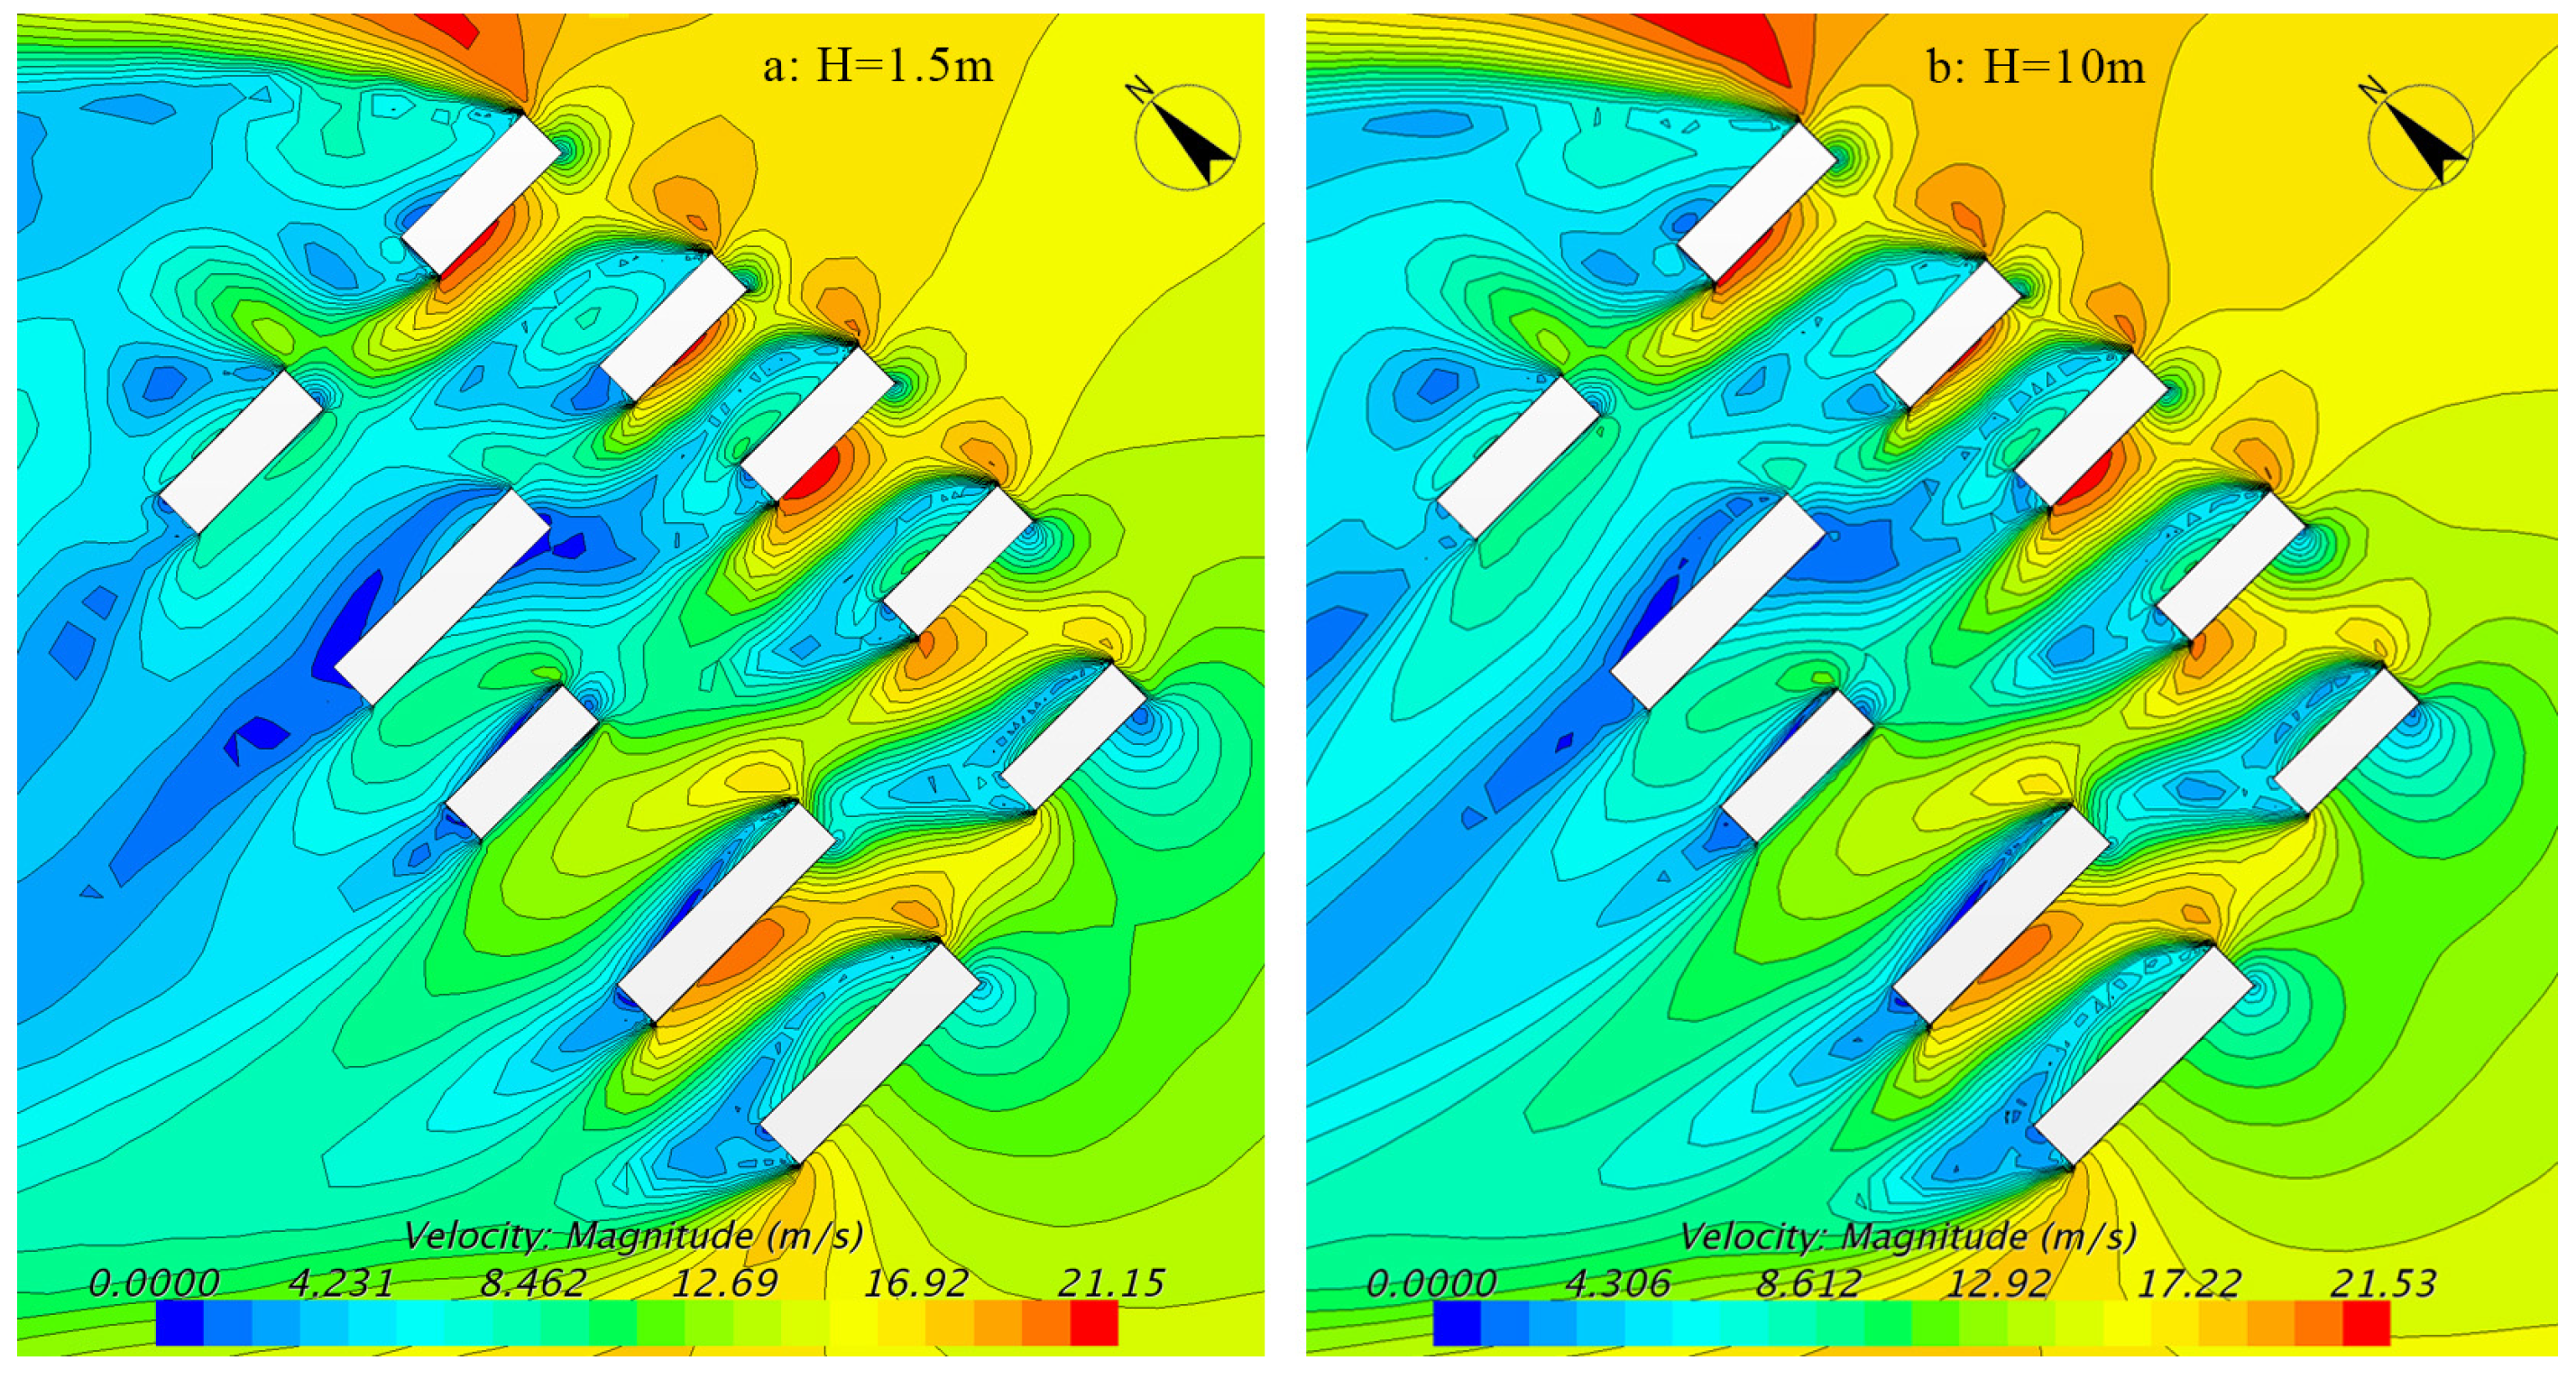
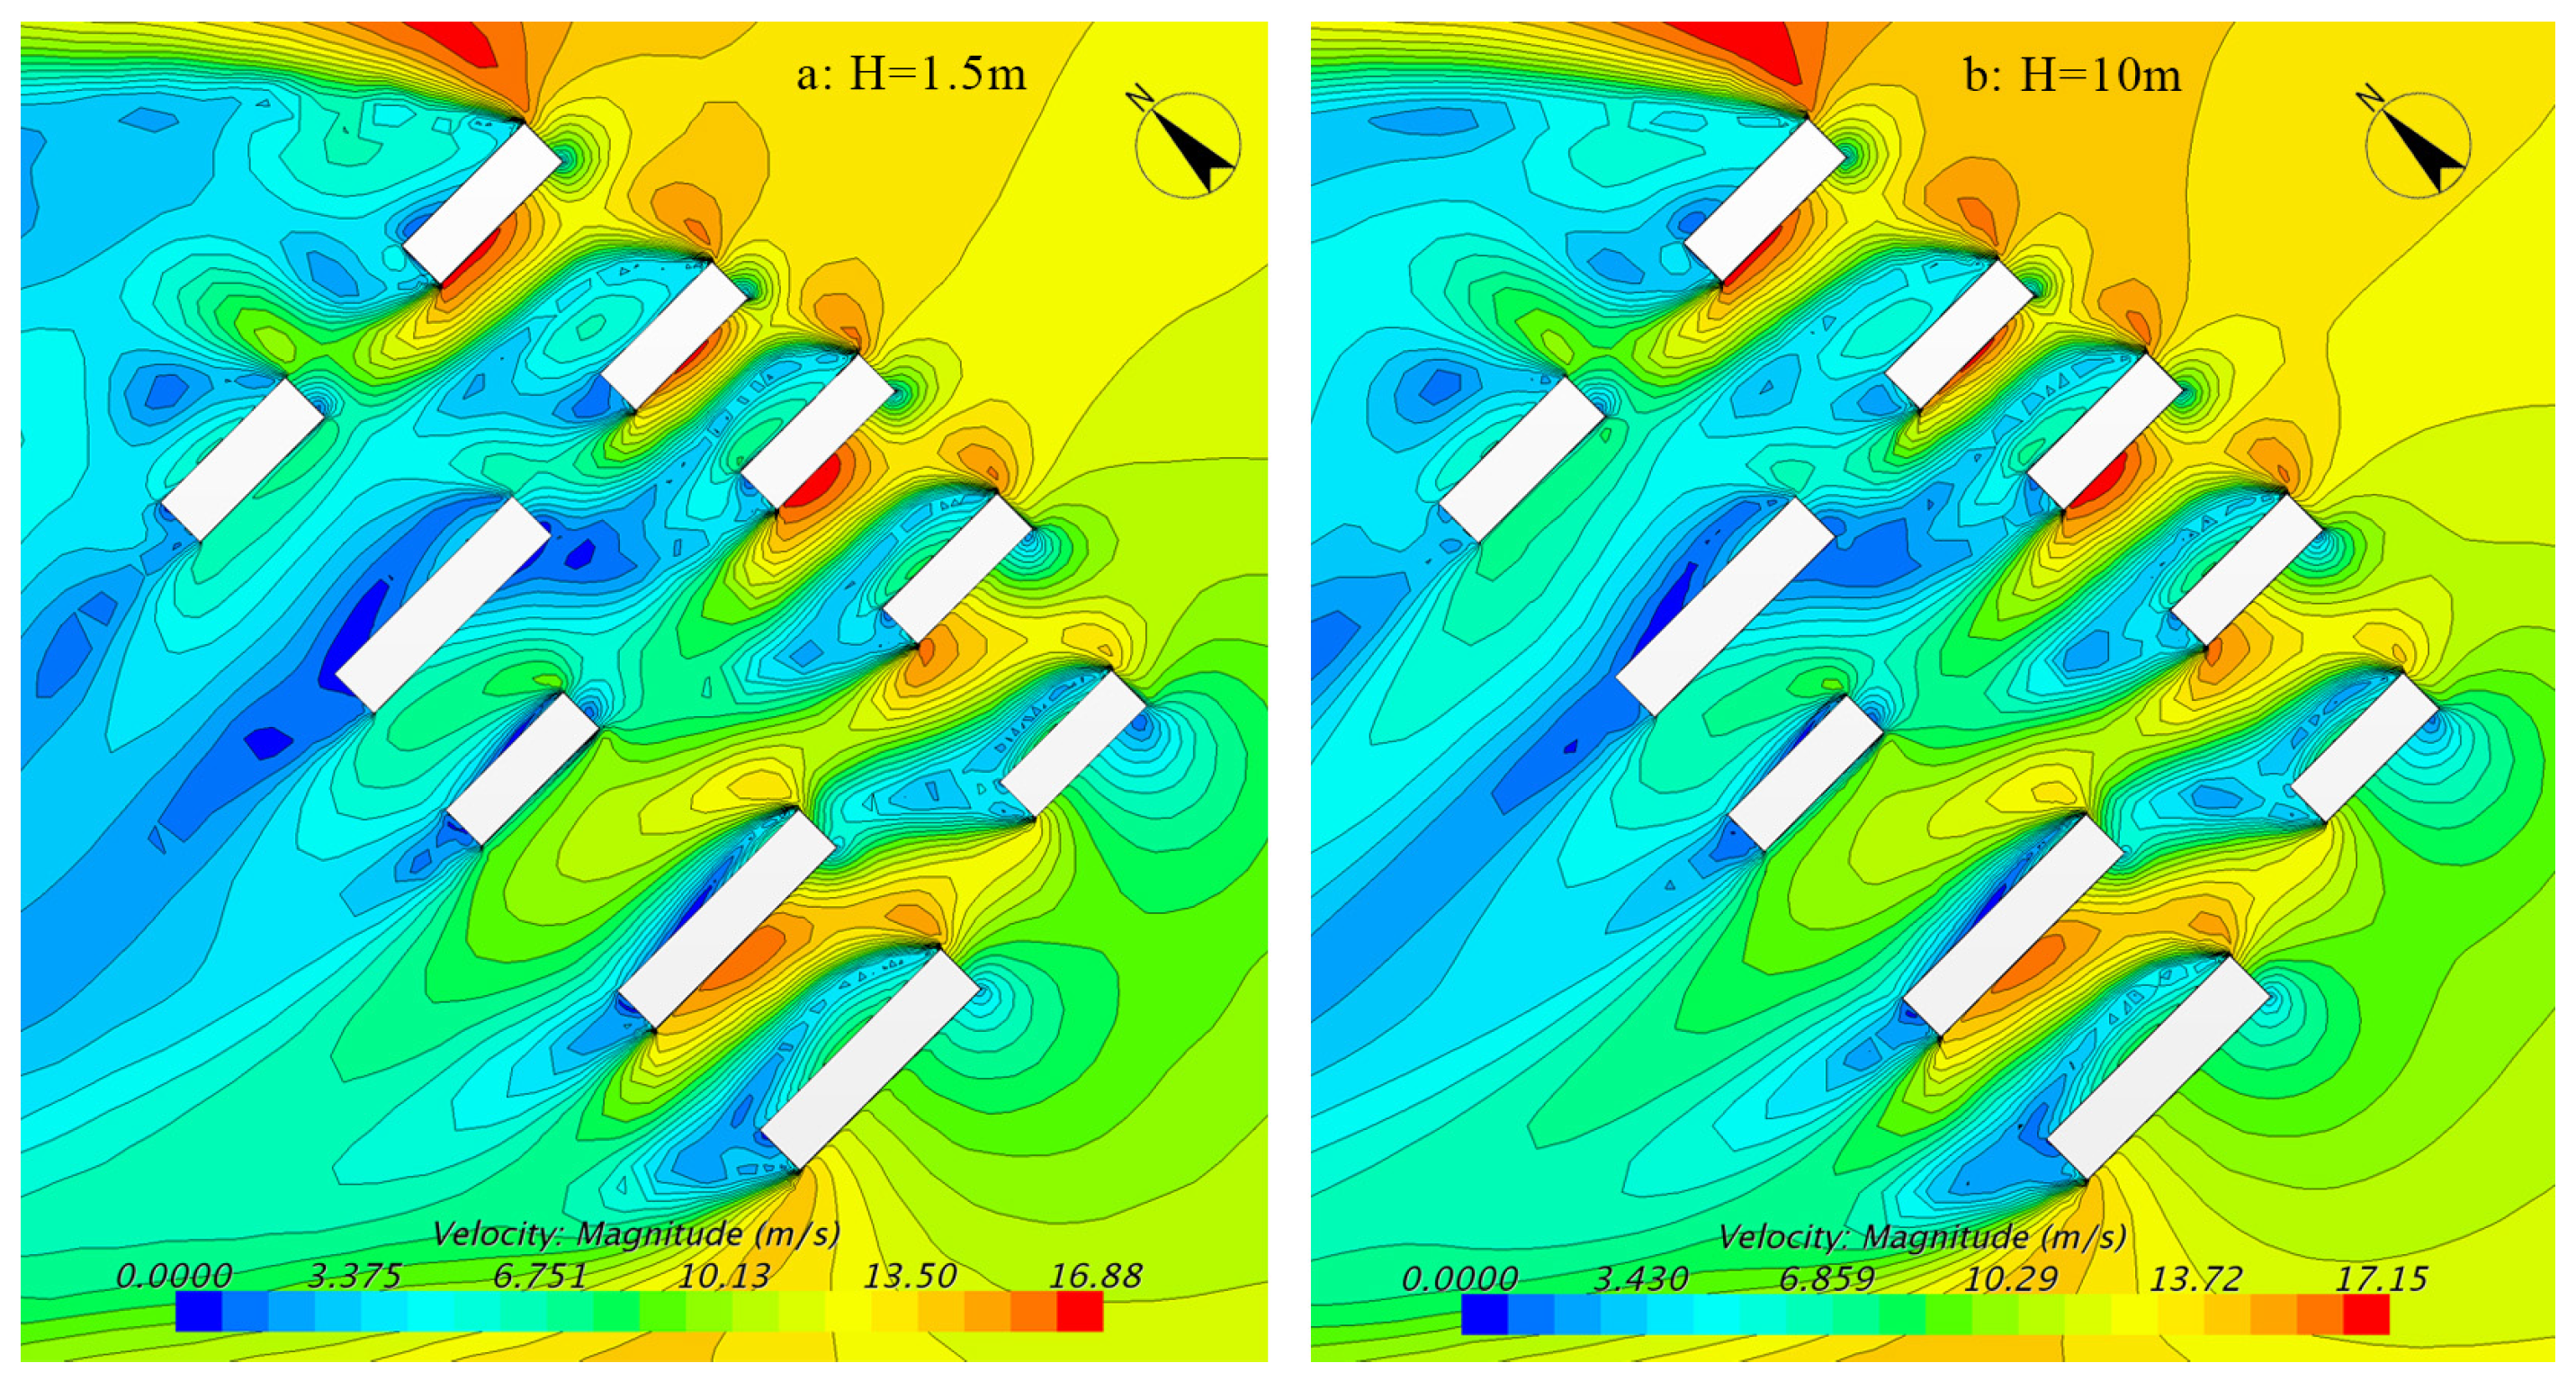
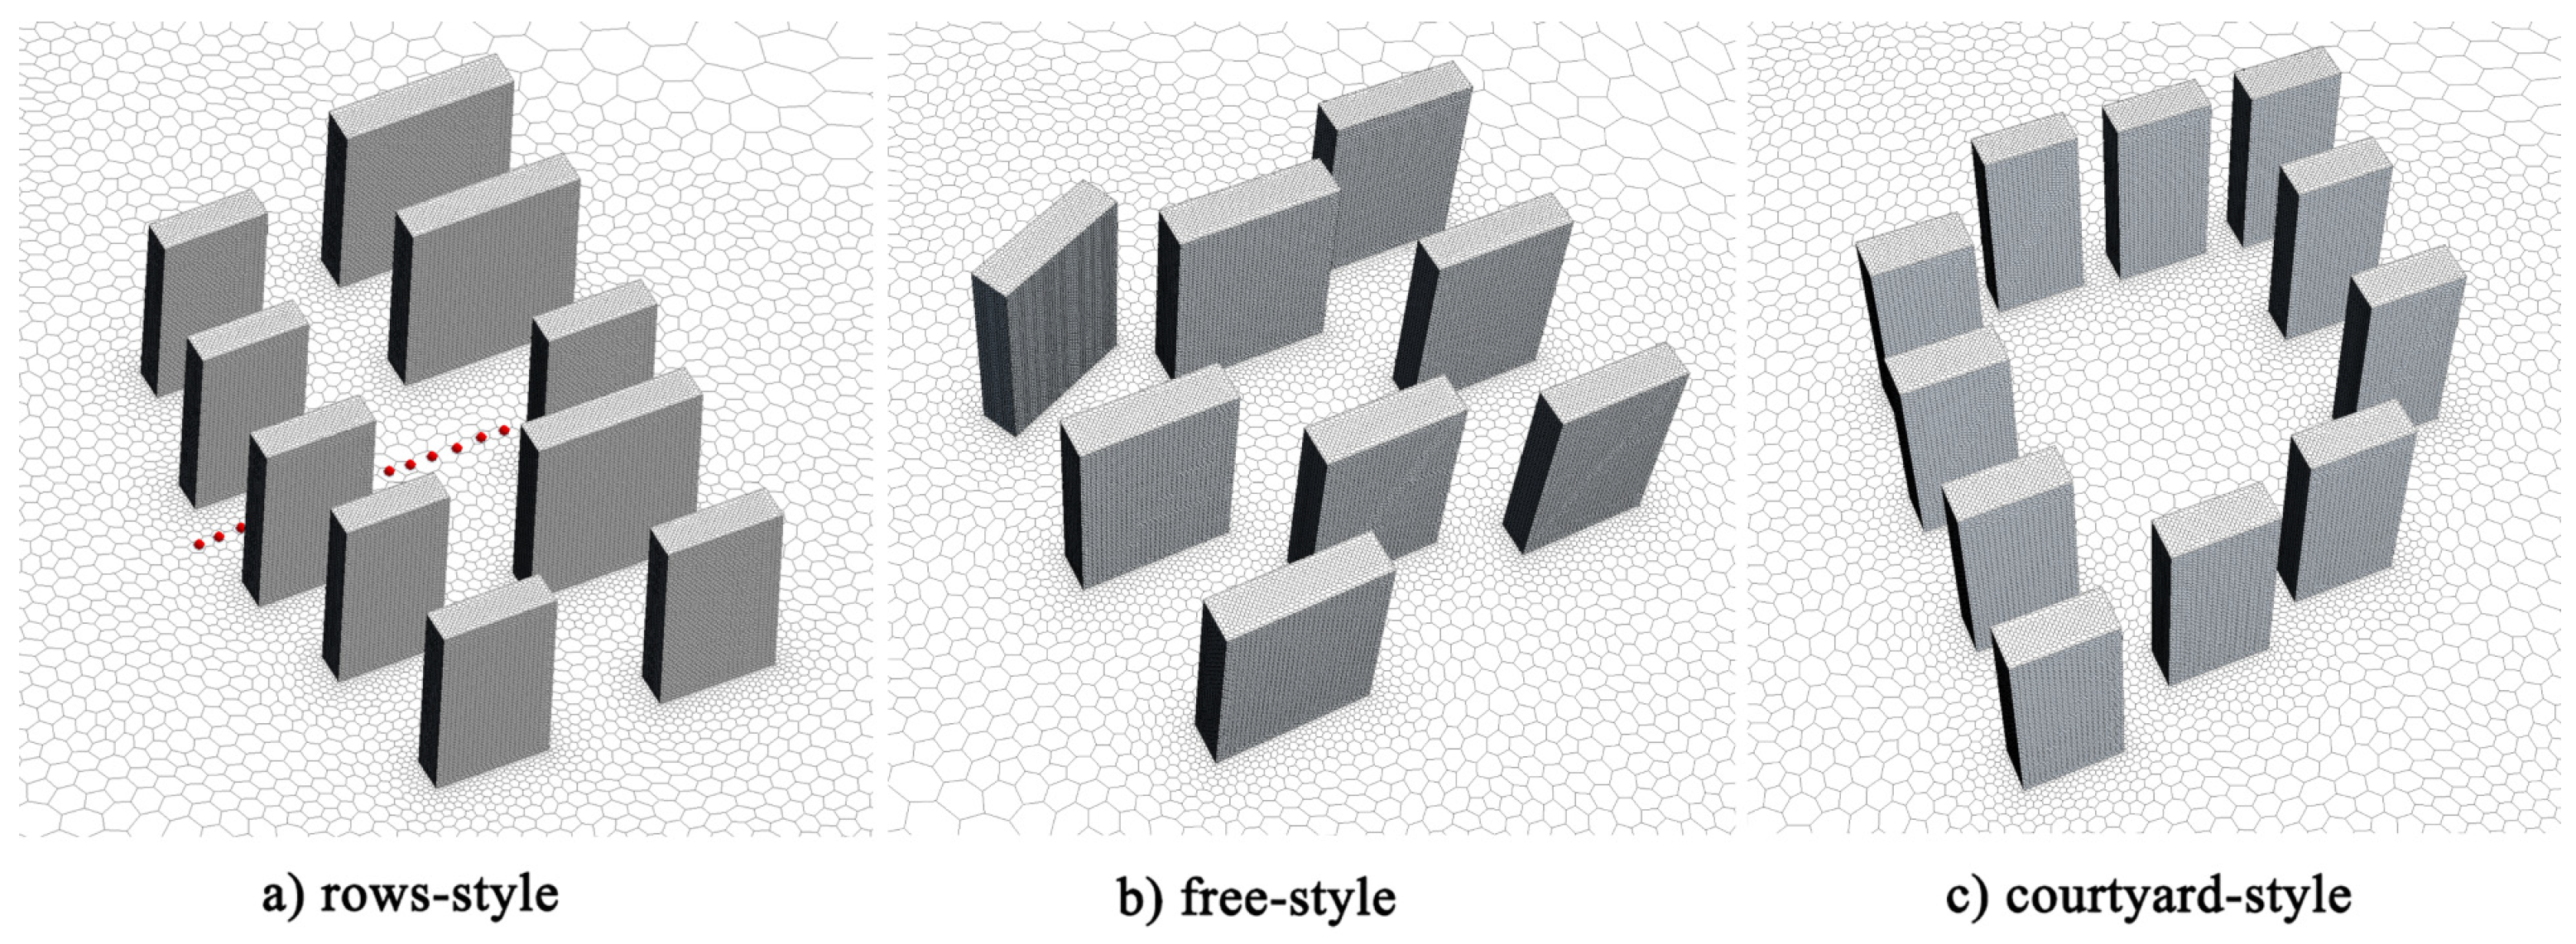
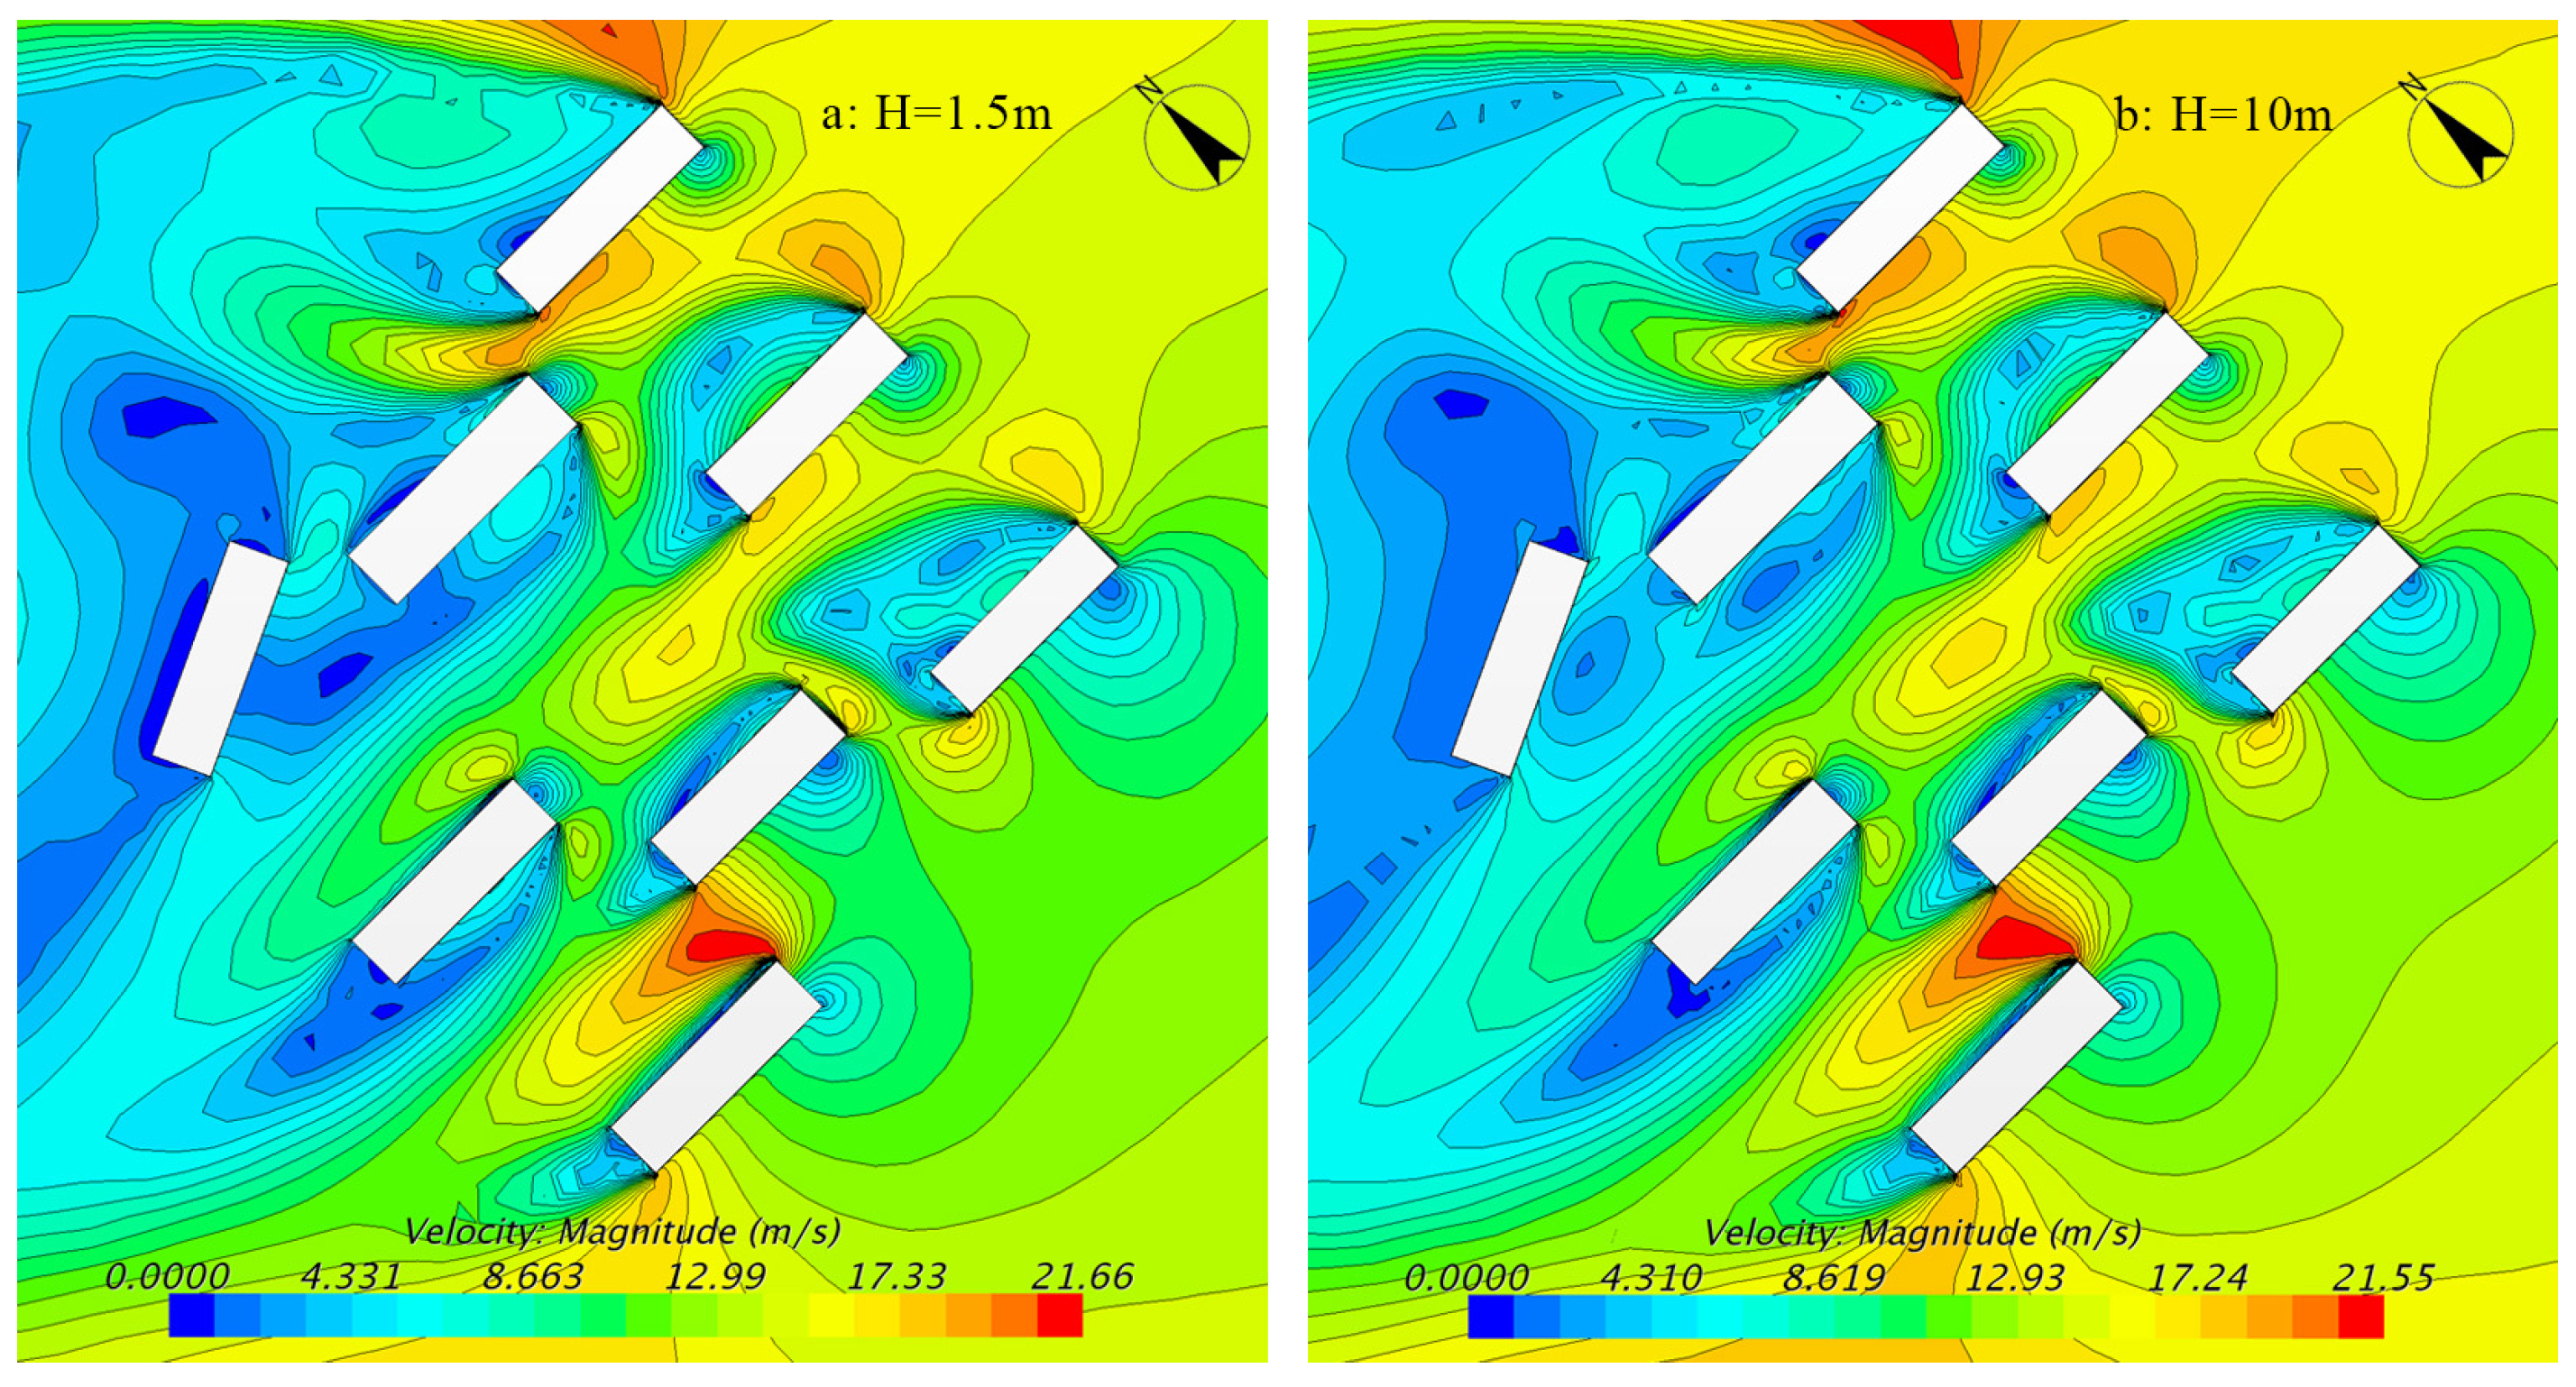
4.1.1. High-Rise Residential Areas with a Rows-Style Layout

Figure 9a shows the cloud chart regarding wind velocity at a height of 1.5 m. The maximum wind velocity in the area was 21.15 m/s. The area with a wind velocity of higher than 14.4 m/s accounted for approximately 19.3% of the total evaluation area. Figure 9b shows the cloud chart regarding wind velocity at a height of 10 m. The maximum wind velocity in the area was 21.53 m/s. The area with a wind velocity of higher than 14.4 m/s accounted for approximately 21.5% of the total evaluation area.

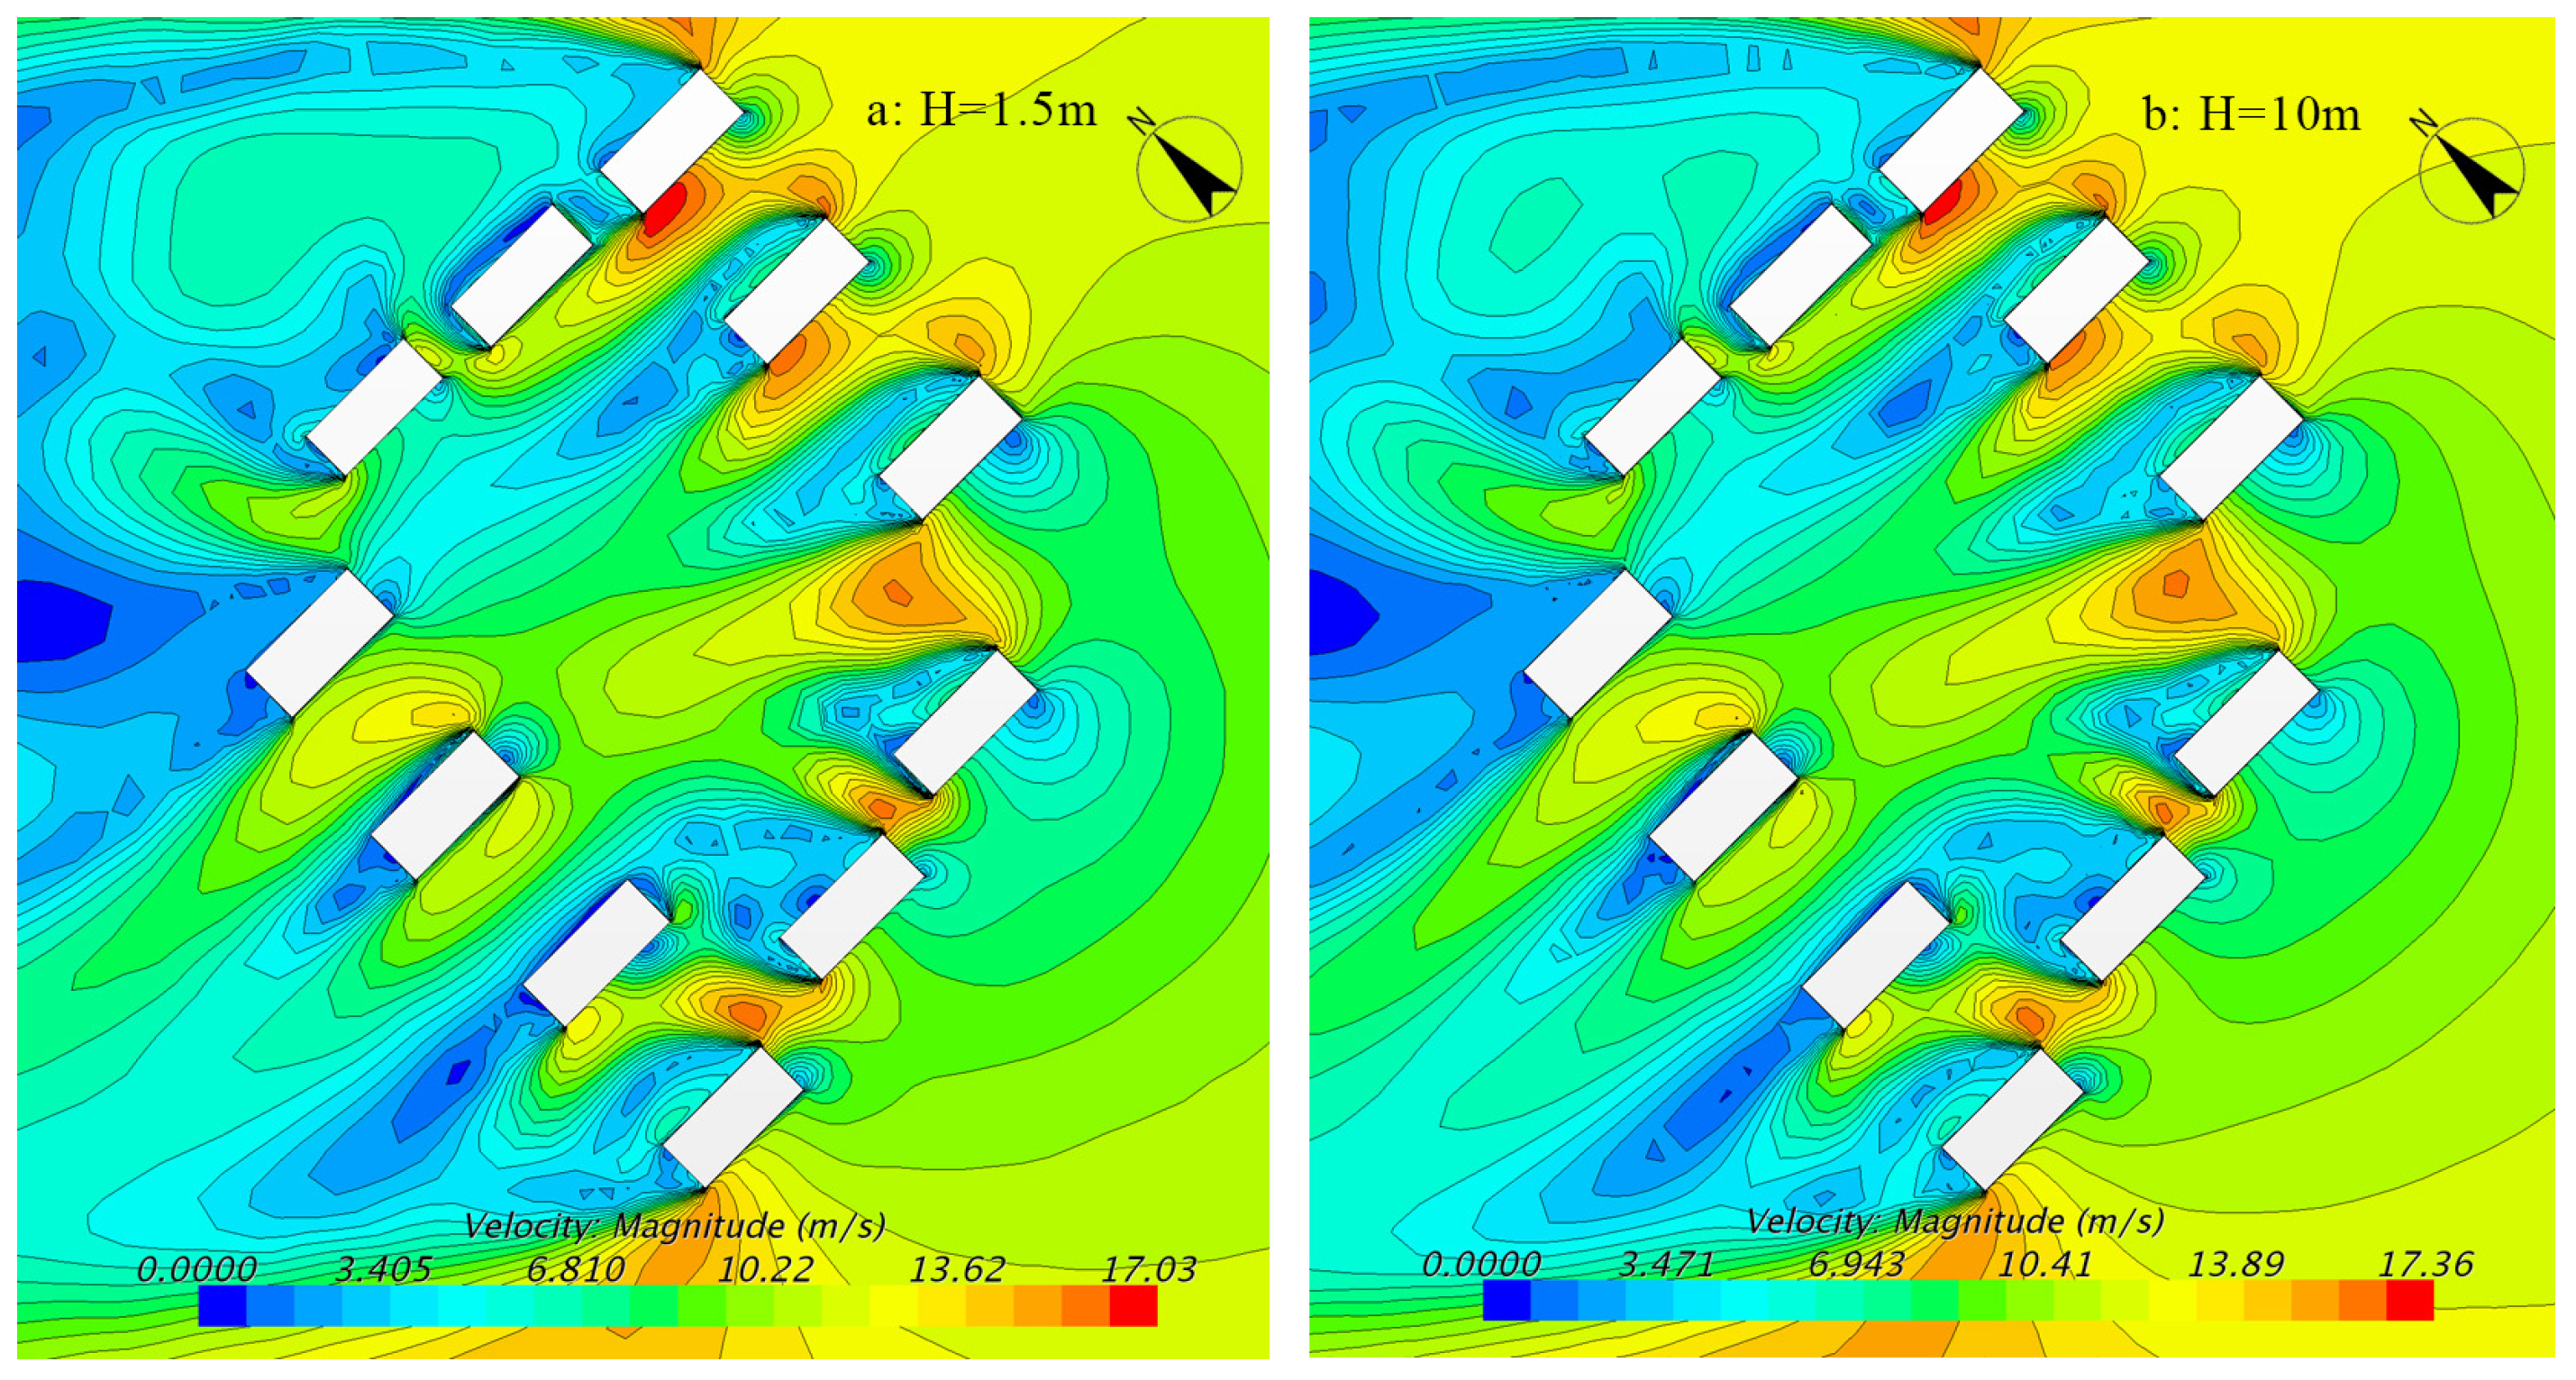
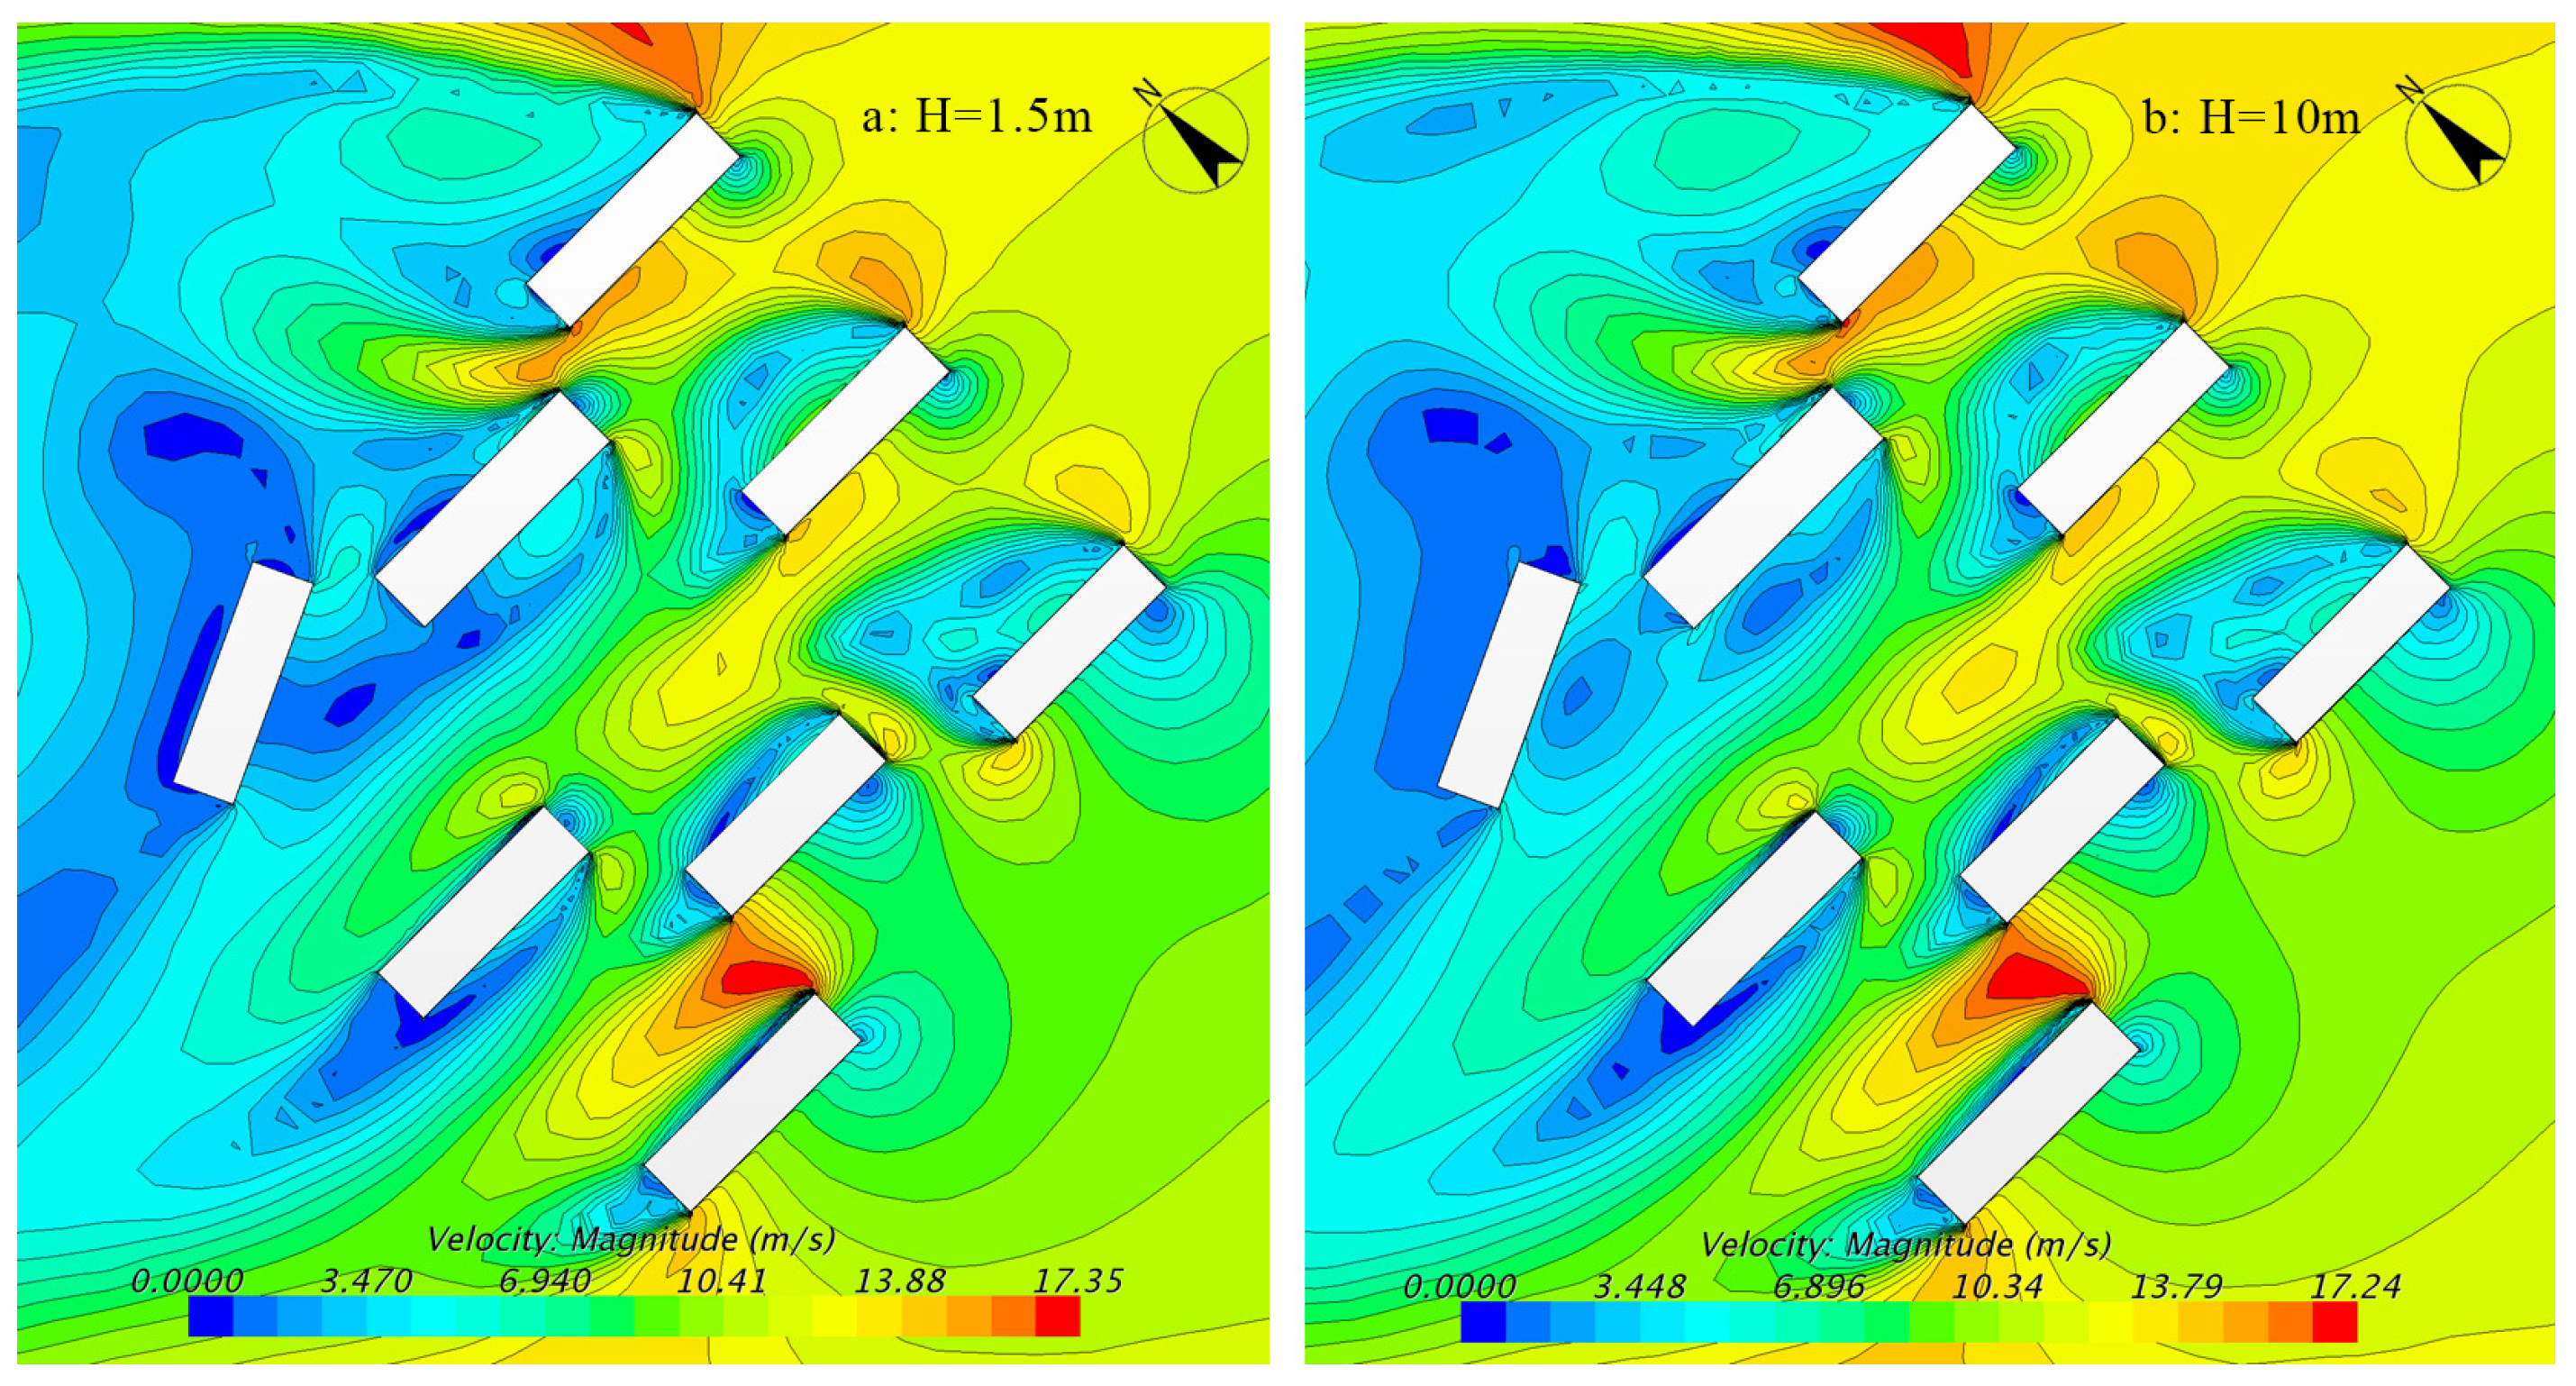
4.1.2. High-Rise Residential Buildings with a Free-Style Layout

Figure 10a shows the cloud chart regarding wind velocity at a height of 1.5 m. The maximum wind velocity in the area was 21.66 m/s. The area with a wind velocity of higher than 14.4 m/s accounted for approximately 20.0% of the total evaluation area. Figure 10b shows the cloud chart regarding wind velocity at a height of 10 m. The maximum wind velocity in the area was 21.55 m/s. The area with a wind velocity of higher than 14.4 m/s accounted for approximately 23.6% of the total evaluation area.

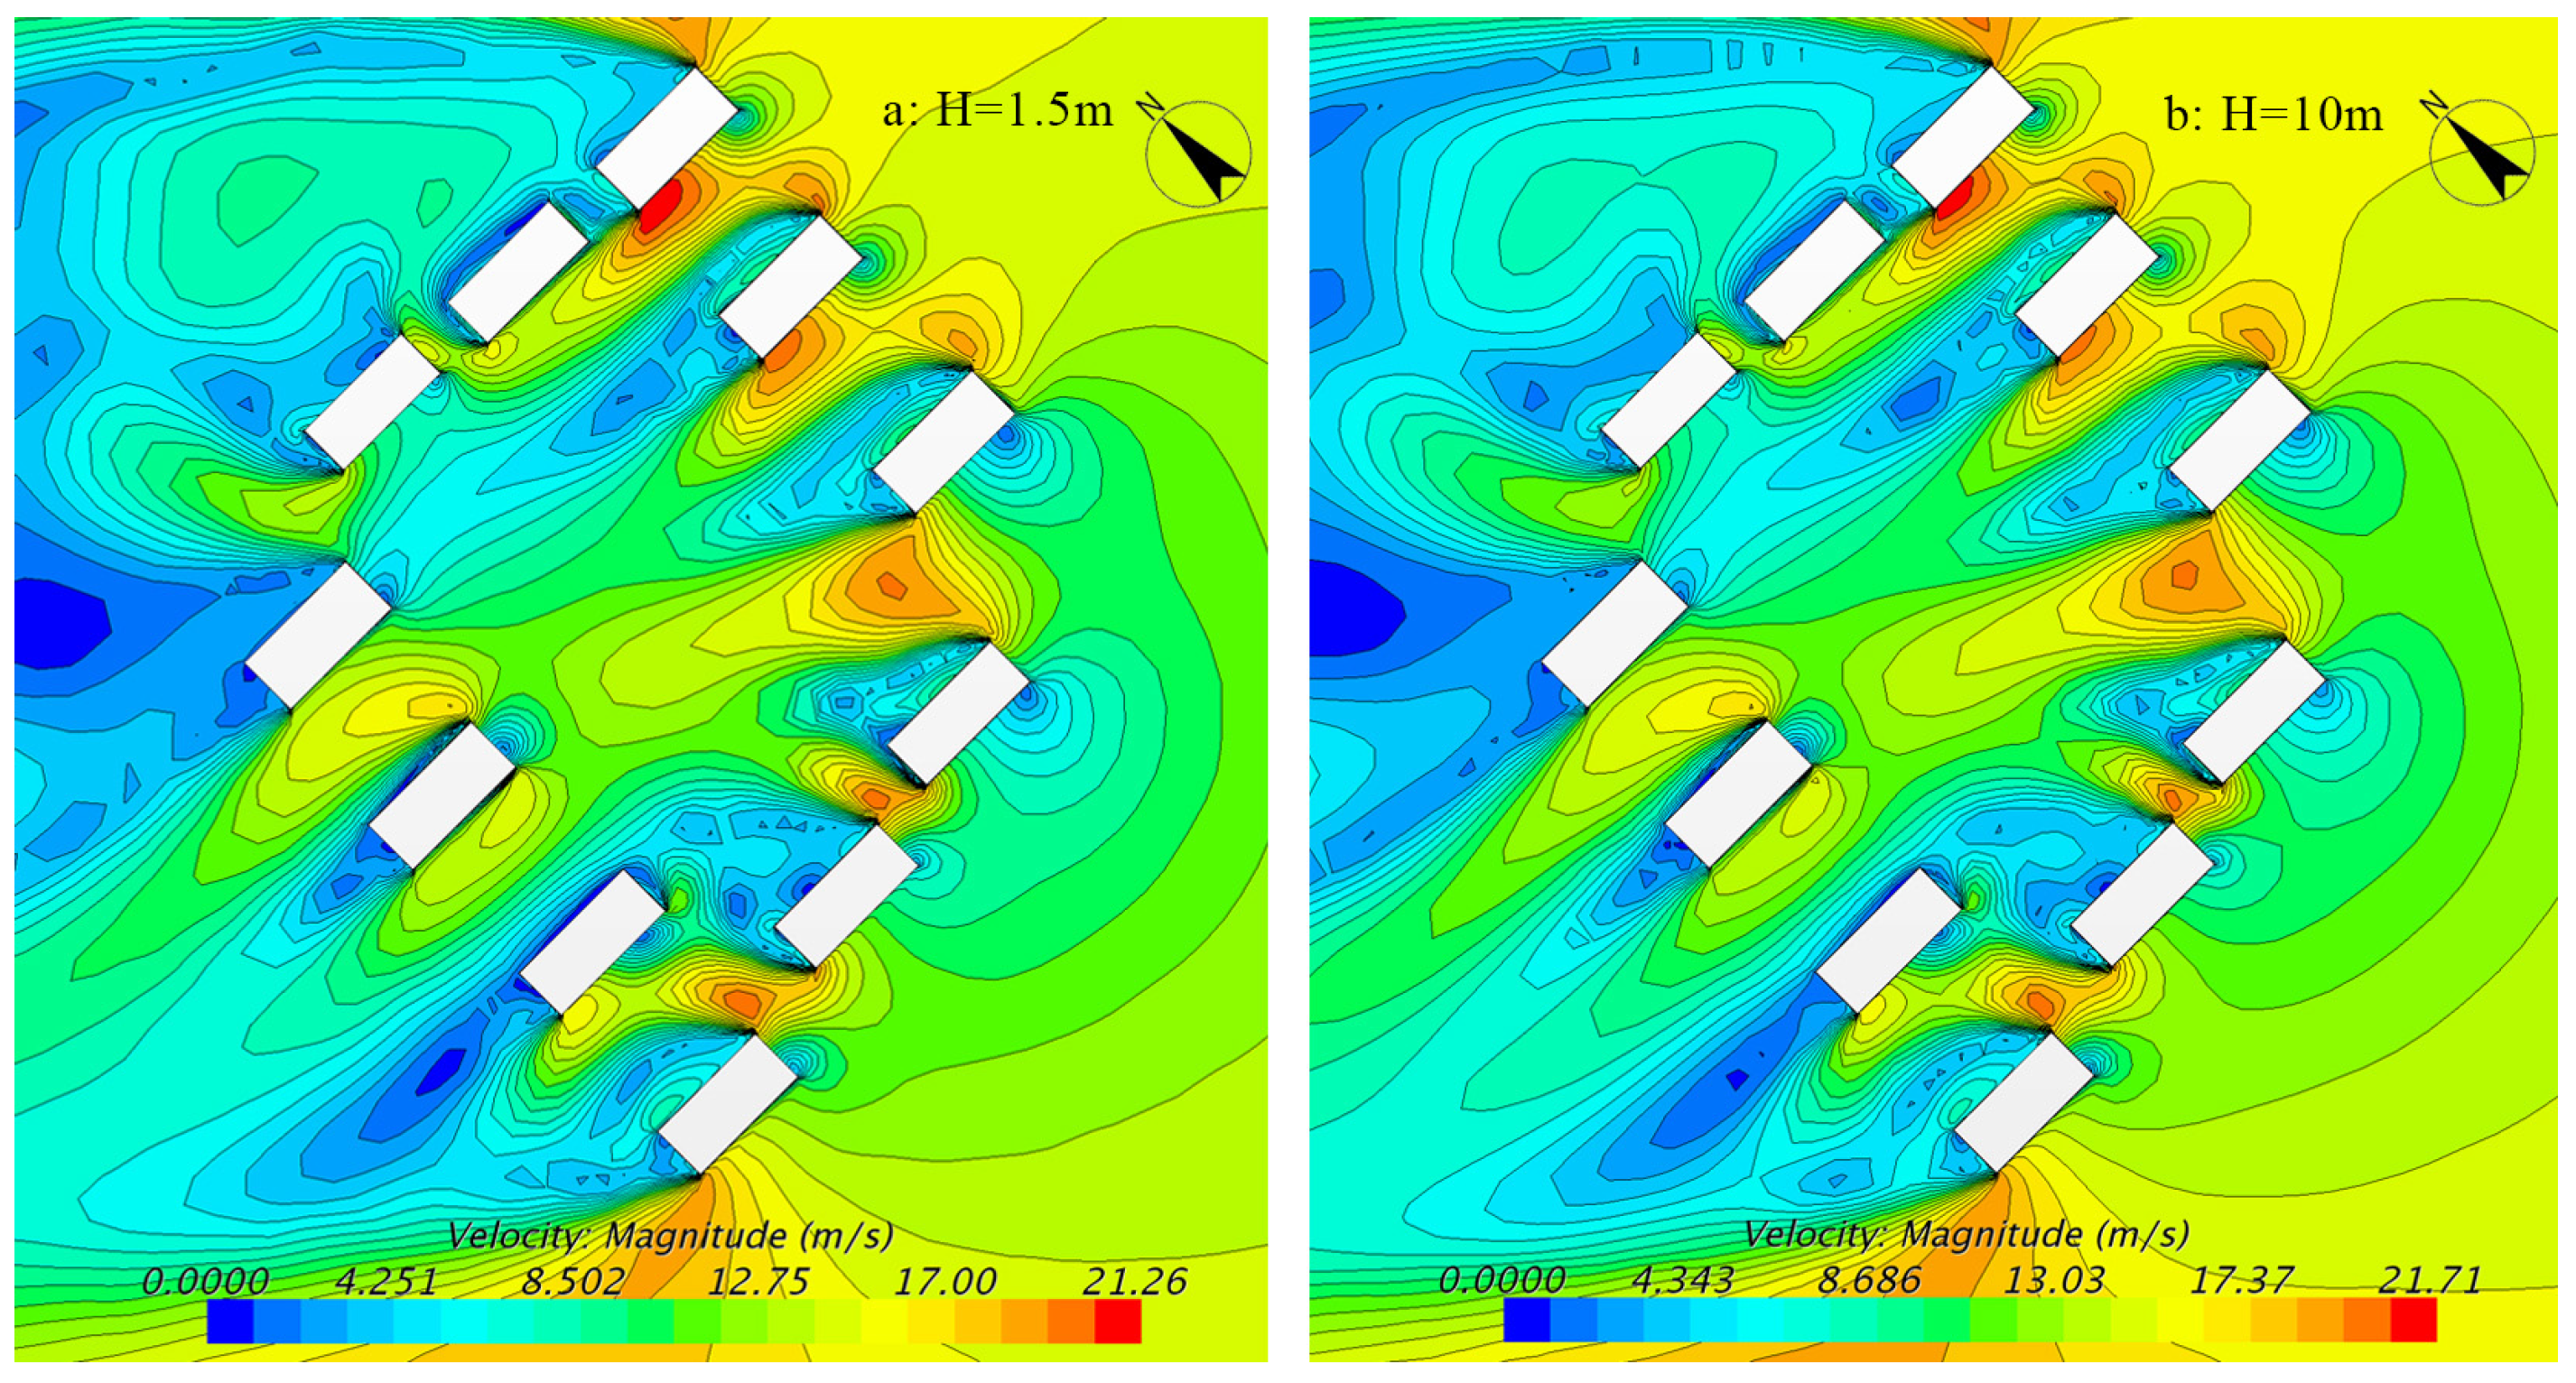
4.1.3. High-Rise Residential Buildings with a Courtyard-Style Layout

Figure 11a shows the cloud chart regarding wind velocity at a height of 1.5 m. The maximum wind velocity in the area was 21.26 m/s. The area with a wind velocity of higher than 14.4 m/s accounted for approximately 16.6% of the total evaluation area. Figure 11b shows the cloud chart regarding wind velocity at a height of 10 m. The maximum wind velocity in the area was 21.71 m/s. The area with a wind velocity of higher than 14.4 m/s accounted for approximately 19.2% of the total evaluation area.
Further discussion on the wind environment of three spatial layouts in coastal cities, including the maximum wind speed, the proportion of areas with wind speed higher than 14.4 m/s, and the area with high wind speed, can be found in Table 2 and Table 3.

4.2. Results of Numerical Simulation of Wind Environment in Inland Cities of Coastal Provinces

4.2.1. High-Rise Residential Areas with a Rows-Style Layout

Figure 12a shows the cloud chart regarding wind velocity at a height of 1.5 m. The maximum wind velocity in the area was 16.88 m/s. The area with a wind velocity of higher than 14.4 m/s accounted for approximately 4.4% of the total evaluation area. Figure 12b shows the cloud chart regarding wind velocity at a height of 10 m. The maximum wind velocity in the area was 17.15 m/s. The area with a wind velocity of higher than 14.4 m/s accounted for approximately 5.4% of the total evaluation area.

4.2.2. High-Rise Residential Buildings with a Free-Style Layout

Figure 13a shows the cloud chart regarding wind velocity at a height of 1.5 m. The maximum wind velocity in the area was 17.35 m/s. The area with a wind velocity of higher than 14.4 m/s accounted for approximately 3.5% of the total evaluation area. Figure 13b shows the cloud chart regarding wind velocity at a height of 10 m. The maximum wind velocity in the area was 17.24 m/s. The area with a wind velocity of higher than 14.4 m/s accounted for approximately 4.2% of the total evaluation area.

4.2.3. High-Rise Residential Buildings with a Courtyard-Style Layout

Figure 14a shows the cloud chart regarding wind velocity at a height of 1.5 m. The maximum wind velocity in the area was 17.03 m/s. The area with a wind velocity of higher than 14.4 m/s accounted for approximately 4.2% of the total evaluation area. Figure 14b shows the cloud chart regarding wind velocity at a height of 10 m. The maximum wind velocity in the area was17.36 m/s. The area with a wind velocity of higher than 14.4 m/s accounted for approximately 4.9% of the total evaluation area.
Further discussion on the wind environment of three layouts in inland cities, including the maximum wind speed, the proportion of areas with wind speed higher than 14.4 m/s, and the area with high wind speed areas, can be found in Table 4 and Table 5.

5. Discussion

Based on a comparison of the cloud charts regarding wind velocity in high-rise residential areas with three typical spatial layouts under TCs, it was found that the high wind speed areas under the rows-style layout were mainly concentrated in the space between two parallel buildings, and the wider the building, the larger the high wind speed area. The high wind speed areas under the free-style layout were mainly located between the gables of two nearby high-rise buildings. The high wind speed areas under the courtyard-style layout were relatively scattered, with no specific distribution pattern identified. To summarize, the high wind speed area is likely to appear between the gables of two close high-rise buildings or between two parallel high-rise slab-type apartment buildings, and the longer the length of the slab-type buildings, the bigger the high wind speed areas.
The wind environment at the horizontal plane with a height of 1.5 m in high-rise residential areas of coastal cities with the three typical spatial layouts are shown in Table 2. The maximum wind speed appears in the high-rise residential area with a free-style layout, which is approximately 21.66 m/s. The high-rise residential area with a freestyle layout has the largest proportion of high wind speed area (over 14.4 m/s) in the evaluation area, which is 20.0%. In addition, the high-rise residential area with a courtyard-style layout has the smallest proportion of high wind speed area, which is 16.6%. For a residential area of approximately 3.71 Ha, the area with a high wind speed in the free-style layout is 1280 m2 larger than that in the courtyard-style layout. As a result, more interventions would be required in high-rise residential areas with a free-style layout to mitigate the negative impact of TCs. To conclude, to achieve a relatively good outdoor wind environment at 1.5 m high for high-rise residential areas located in coastal cities, the courtyard-style layout is recommended.
The wind environment at the horizontal plane with a height of 10 m in high-rise residential areas in coastal cities with the three typical spatial layouts is shown in Table 3. The maximum wind speeds of the three layouts are similar, with 21.53 m/s for the rows-style layout, 21.55 m/s for the freestyle layout, and 21.71 m/s for the courtyard-style layout. The high-rise residential area with a free-style layout has the largest proportion of high wind speed area (over 14.4 m/s) in the evaluation area, which is 23.6%, and the high-rise residential area with a courtyard-style layout has the smallest proportion of high wind speed area, which is 19.2%. For a residential area of approximately 3.71 Ha, the area with a high wind speed in the free-style layout is 1650 m2 larger than that in the courtyard-style layout. As a result, more interventions would be required in high-rise residential areas with a free-style layout to mitigate the negative impact of TCs. To conclude, to achieve a relatively good outdoor wind environment at 10 m high for high-rise residential areas located in coastal cities, the courtyard-style layout is recommended.
As indicated by the comparison of the wind environments of high-rise residential areas in coastal cities at the horizontal planes of 1.5 m and 10 m high, the ratio of high wind speed area to the total evaluation area was relatively small in the courtyard-style layout, implying a better performance in response to TCs.
The wind environment at the horizontal plane of 1.5 m high in high-rise residential areas in inland cities of coastal provinces with the three typical layouts is shown in Table 4. The maximum wind speeds of the three layouts were different, with 16.88 m/s for rows-style, 17.35 m/s, for freestyle, and 17.03 m/s for courtyard-style layouts. The high-rise residential area with a rows-style layout has the largest proportion of high wind speed area (over 14.4 m/s) in the evaluation area, which is 4.4%, and the high-rise residential area with a free-style layout has the smallest proportion of high wind speed area, which is 3.5%. For a residential area of approximately 3.71 Ha, the area with a high wind speed in the rows-style layout is 320 m2 larger than that in the free-style layout. As a result, more interventions would be required in high-rise residential areas with a rows-style layout to mitigate the negative impact of TCs. To conclude, to achieve a relatively good outdoor wind environment at 1.5 m high for high-rise residential areas located in inland cities of coastal provinces, the free-style layout is recommended.
The wind environment at the horizontal plane of 10 m high in high-rise residential areas in inland cities of coastal provinces with the three typical layouts is shown in Table 5. The maximum wind speed appears in the high-rise residential with a courtyard layout, which is approximately 17.36 m/s. The rows-style layout has the largest proportion of high wind speed area (over 14.4 m/s) in the evaluation area, which is 5.4%, and the smallest proportion is the high-rise residential area with a free-style layout, which is 4.2%. For a residential area of approximately 3.71 Ha, the area with a high wind speed in the rows-style layout is 430 m2 larger than that in the free-style layout. As a result, more interventions would be required in high-rise residential areas with a rows-style layout to mitigate the negative impact of TCs. To conclude, to achieve a relatively good outdoor wind environment at 10 m high for high-rise residential areas located in inland cities of coastal provinces, the free-style layout is recommended.
As indicated by the comparison of the wind environments of high-rise residential areas in inland cities of coastal provinces at the horizontal planes of 1.5 m and 10 m high, the ratio of the high wind speed area to the total evaluation area was relatively small in the free-style layout, implying a better performance in response to TCs.
Previous research on the impact of different spatial layouts of residential areas on the outdoor wind environment was mainly focused on typical climate conditions. For instance, Hong et al. analyzed the impact of different building layout patterns on the outdoor wind environment in summers [29]. Jin et al. analyzed the impact of different building layouts on the outdoor wind environment in severe cold regions of China [30]. Meanwhile, there is a lack of research on the impact of spatial layouts of residential areas on the outdoor wind environment under an extreme climate such as TCs. This paper investigated the outdoor wind environment of high-rise residential areas under TCs. Based on the analysis of the impact of different spatial layouts on the area with a high wind speed under TCs, it is found that the courtyard-style layout is recommended for high-rise residential areas located in coastal cities, and the free-style layout is recommended for high-rise residential areas located in inland cities of coastal provinces. To mitigate the potential risks in residential areas with high wind speeds under TCs, the following actions have been suggested: (1) Do not allocate outdoor activity space (e.g., children’s playgrounds, fitness areas, etc.) in these areas, (2) add lawn and shrubs and reduce tall trees, and (3) reduce unnecessary decorations on the building façade and use high-strength glass for the windows facing the areas with high wind speeds.

6. Conclusions

In this study, an investigation was carried out among 131 high-rise residential areas in Zhejiang Province, China, including three typical spatial layouts: The rows-style layout, the free-style layout, and the courtyard-style layout.
When TCs strikes, areas with high wind speeds are likely to appear between the gables of two close high-rise buildings or between two parallel high-rise slab-type apartment buildings. The longer the length of the slab-type building, the larger the area with a high wind speed. In areas prone to high wind speeds, human activities should be reduced as much as possible.
Based on a comparative analysis of the outdoor wind environment of high-rise residential areas at the horizontal planes of 1.5 m and 10 m high, high-rise residential areas with a courtyard-style layout in coastal cities and high-rise residential areas with a free-style layout in inland cities of coastal provinces performed better than others in coping with TCs. Hence, it was concluded that the courtyard-style layout should be recommended for high-rise residential areas in coastal cities and the free-style layout should be recommended for high-rise residential areas in inland cities of coastal provinces in future urban construction in order to minimize the negative impact of TCs.
This paper was mainly concerned with the analysis of high-frequency and high-velocity ground wind in cities in different coastal areas. Some lower-frequency and higher-velocity winds may cause more harm, which will be further researched in the future. Additionally, the verification of numerical simulation in Section 3.1 was based on previous experiments using standardized building blocks. Further studies are therefore needed to explore the difference between the numerical simulation results and the wind-tunnel experiment results for different spatial layouts in future work.

Supplementary Materials

The following supporting information can be downloaded at: https://pan.quark.cn/s/e0e13c3e1199, Investigation of high-rise residential areas and source file of numerical simulation.

Author Contributions

Conceptualization, H.Z., M.X., and B.C.; methodology, M.X.; software, H.Z.; validation, M.X. and Y.W.; formal analysis, B.C.; investigation, H.Z.; resources, H.Z.; data curation, M.X.; writing—original draft preparation, H.Z.; writing—review and editing, M.X. and B.C.; supervision, H.Z.; project administration, H.Z.; funding acquisition, H.Z. and B.C. All authors have read and agreed to the published version of the manuscript.

Funding

This research was supported by the Natural Science Foundation of Zhejiang Province, grant number LY19E080001, and by the Research Development Fund of Xi’an Jiaotong-Liverpool University, grant number RDF-20-02-19.

Institutional Review Board Statement

Not applicable.

Informed Consent Statement

Not applicable.

Data Availability Statement

Data are contained within the article or Supplementary Material.

Acknowledgments

The authors thank Kangkang Yao, Yao Qian, He Huang, Niyan Zhang, Cun Wen, and Ziyi Wang for their work in the investigation of high-rise residential areas. The authors would also like to thank the editor and anonymous reviewers for their support in improving the quality of this manuscript.

Conflicts of Interest

The authors declare no conflict of interest.

References

  1. Yin, Y.; Gemmer, M.; Luo, Y.; Wang, Y. Tropical cyclones and heavy rainfall in Fujian Province, China. Quat. Int. 2010, 226, 122–128. [Google Scholar] [CrossRef]
  2. Liu, K.; Shen, C.; Louie, K. A 1,000-Year History of Typhoon Landfalls in Guangdong, Southern China, Reconstructed from Chinese Historical Documentary Records. Ann. Assoc. Am. Geogr. 2001, 91, 453–464. [Google Scholar] [CrossRef]
  3. Fengjin, X.; Ziniu, X. Characteristics of tropical cyclones in China and their impacts analysis. Nat. Hazards 2010, 54, 827–837. [Google Scholar] [CrossRef]
  4. Vivek, G.; Srinivasa Kumar, T. Impact Assessment of Tropical Cyclone Hud Hud on Coastal Region of Visakhapatnam, Andhra Pradesh, India. ISPRS Ann. Photogramm. Remote Sens. Spat. Inf. Sci. 2015, 2, 123–130. [Google Scholar] [CrossRef] [Green Version]
  5. Xu, S.; Zhu, X.; Helmer, E.H.; Tan, X.; Tian, J.; Chen, X. The damage of urban vegetation from super typhoon is associated with landscape factors: Evidence from Sentinel-2 imagery. Int. J. Appl. Earth Obs. Geoinf. 2021, 104, 102536. [Google Scholar] [CrossRef]
  6. Yang, Q.; Gao, R.; Bai, F.; Li, T.; Tamura, Y. Damage to buildings and structures due to recent devastating wind hazards in East Asia. Nat. Hazards 2018, 92, 1321–1353. [Google Scholar] [CrossRef]
  7. Choi, E. Air ventilation in cities with dense high-rise developments. Proc. Inst. Civ. Eng. 2010, 163, 12–19. [Google Scholar] [CrossRef]
  8. Kuznetsov, S.; Butova, A.; Pospíšil, S. Influence of placement and height of high-rise buildings on wind pressure distribution and natural ventilation of low- and medium-rise buildings. Int. J. Vent. 2016, 15, 253–266. [Google Scholar] [CrossRef]
  9. Zhang, X.; Weerasuriya, A.U.; Zhang, X.; Tse, K.T.; Lu, B.; Li, C.Y.; Liu, C.H. Pedestrian wind comfort near a super-tall building with various configurations in an urban-like setting. Build. Simul. 2020, 13, 1385–1408. [Google Scholar] [CrossRef]
  10. Li, Q.; Li, X.; He, Y. Monitoring Wind Characteristics and Structural Performance of a Supertall Building during a Landfall Typhoon. J. Struct. Eng. 2016, 142, 04016097. [Google Scholar] [CrossRef]
  11. Wang, C.; Li, Z.; Hu, L.; Zhao, Z.; Luo, Q.; Hu, J.; Zhang, X. Field Research on the Wind-Induced Response of a Super High-Rise Building under Typhoon. Appl. Sci. 2019, 9, 2180. [Google Scholar] [CrossRef] [Green Version]
  12. Wang, C.; Li, Z.; Luo, Q.; Hu, L.; Zhao, Z.; Hu, J.; Zhang, X. Wind Characteristics Investigation on The Roofs of Three Adjacent High-Rise Buildings in a Coastal Area during Typhoon Meranti. Appl. Sci. 2019, 9, 367. [Google Scholar] [CrossRef] [Green Version]
  13. Li, X.; Li, Q.S. Observations of typhoon effects on a high-rise building and verification of wind tunnel predictions. J. Wind Eng. Ind. Aerodyn. 2019, 184, 174–184. [Google Scholar] [CrossRef]
  14. Yang, Z.; Sarkar, P.; Hu, H. An experimental study of a high-rise building model in tornado-like winds. J. Fluids Struct. 2011, 27, 471–486. [Google Scholar] [CrossRef]
  15. Zhang, L.; Hu, X.; Xie, Z.; Shi, B.; Zhang, L.; Wang, R. Field measurement study on time-varying characteristics of modal parameters of super high-rise buildings during super typhoon. J. Wind Eng. Ind. Aerodyn. 2020, 200, 104139. [Google Scholar] [CrossRef]
  16. Amini, M.; Memari, A.M. Performance of Residential Buildings in Hurricane Prone Coastal Regions and Lessons Learned for Damage Mitigation. In Proceedings of the 5th Residential Building Design & Construction Conference, Conference Center Hotel in State College, State College, PA, USA, 4–6 March 2020. [Google Scholar]
  17. Ma, T.; Chen, T. Classification and pedestrian-level wind environment assessment among Tianjin’s residential area based on numerical simulation. Urban Clim. 2020, 34, 100702. [Google Scholar] [CrossRef]
  18. Nonomura, Y.; Kobayashi, N.; Tominaga, Y.; Mochida, A. The cross comparison of CFD results for flow field around building models (Part 3)—Wind tunnel test for the verification of models for the flow field around building blocks. Summ. Tech. Pap. Annu. Meet. Jpn. Assoc. Wind. Eng. 2003, 95, 83–84. [Google Scholar]
  19. Mochida, A.; Tominaga, Y.; Ishida, Y.; Ishihara, T.; Uehara, K.; Kataoka, H.; Kurabuchi, T.; Kobayashi, N.; Ooka, R.; Shirasawa, T.; et al. AIJ Benchmarks for Validation of CFD Simulations Applied to Pedestrian Wind Environment around Buildings; Architectural Institute of Japan: Tokyo, Japan, 2016. [Google Scholar]
  20. Zhang, C. Experimental Research on Wind Field and Wind Effect of High-Rise Buildings under Typhoon. Doctoral Thesis, Hunan University, Changsha, China, 2018. [Google Scholar]
  21. Li, L.; Cui, X.; Wang, C.; Bai, L. Characteristic Distribution of Surface Winds Associated with Landfalling Tropical Cyclones in Mainland China. Chin. J. Atmos. Sci. 2018, 42, 96–108. [Google Scholar]
  22. Tominaga, Y.; Mochida, A.; Yoshie, R.; Kataoka, H.; Nozu, T.; Yoshikawa, M.; Shirasawa, T. AIJ guidelines for practical applications of CFD to pedestrian wind environment around buildings. J. Wind Eng. Ind. Aerodyn. 2008, 96, 1749–1761. [Google Scholar] [CrossRef]
  23. Blocken, B. Computational Fluid Dynamics for urban physics: Importance, scales, possibilities, limitations and ten tips and tricks towards accurate and reliable simulations. Build. Environ. 2015, 91, 219–245. [Google Scholar] [CrossRef] [Green Version]
  24. Sosnowski, M.; Gnatowska, R.; Grabowska, K.; Krzywanski, J.; Jamrozik, A. Numerical Analysis of Flow in Building Arrangement: Computational Domain Discretization. Appl. Sci. 2019, 9, 941. [Google Scholar] [CrossRef] [Green Version]
  25. Hunt, J.C.R.; Poulton, E.C.; Mumford, J.C. The effects of wind on people; New criteria based on wind tunnel experiments. Build. Environ. 1976, 11, 15–28. [Google Scholar] [CrossRef]
  26. Melbourne, W.H. Criteria for environmental wind conditions. J. Wind Eng. Ind. Aerodyn. 1978, 3, 241–249. [Google Scholar] [CrossRef]
  27. Murakami, S.; Iwasa, Y.; Morikawa, Y. Study on acceptable criteria for assessing wind environment at ground level based on residents’ diaries. J. Wind Eng. Ind. Aerodyn. 1986, 24, 1–18. [Google Scholar] [CrossRef]
  28. Soligo, M.J.; Irwin, P.A.; Williams, C.J.; Schuyler, G.D. A comprehensive assessment of pedestrian comfort including thermal effects. J. Wind Eng. Ind. Aerodyn. 1998, 77–78, 753–766. [Google Scholar] [CrossRef]
  29. Hong, B.; Lin, B. Numerical studies of the outdoor wind environment and thermal comfort at pedestrian level in housing blocks with different building layout patterns and trees arrangement. Renew. Energy 2015, 73, 18–27. [Google Scholar] [CrossRef]
  30. Jin, H.; Liu, Z.; Jin, Y.; Kang, J.; Liu, J. The Effects of Residential Area Building Layout on Outdoor Wind Environment at the Pedestrian Level in Severe Cold Regions of China. Sustainability 2017, 9, 2310. [Google Scholar] [CrossRef] [Green Version]
Figure 1. Location of four cities in Zhejiang Province.
Sustainability 14 03932 g001
Figure 2. Five typical spatial layouts of high-rise residential areas.
Sustainability 14 03932 g002
Figure 3. The number of residential areas with different layout forms.
Sustainability 14 03932 g003
Figure 4. Typical building sections of the three layouts (‘W’ is the distance between two residential buildings per the ‘Standard for Urban Residential Area Planning and Design’).
Sustainability 14 03932 g004
Figure 5. Generated mesh and test points.
Sustainability 14 03932 g005
Figure 6. Wind speed ratio at test points and standard deviation.
Sustainability 14 03932 g006
Figure 7. Simplified models and mesh generation.
Sustainability 14 03932 g007
Figure 8. Comparison of wind speeds at test points under three sizes of mesh.
Sustainability 14 03932 g008
Figure 9. Cloud chart regarding wind velocity in high-rise residential areas with a rows-style layout.
Sustainability 14 03932 g009
Figure 10. Cloud chart regarding wind velocity in high-rise residential areas with a free-style layout.
Sustainability 14 03932 g010
Figure 11. Cloud chart regarding wind velocity in high-rise residential areas with a courtyard-style layout.
Sustainability 14 03932 g011
Figure 12. Cloud chart regarding wind velocity in high-rise residential areas with a rows-style layout.
Sustainability 14 03932 g012
Figure 13. Cloud chart regarding wind velocity in high-rise residential areas with a free-style layout.
Sustainability 14 03932 g013
Figure 14. Cloud chart regarding wind velocity in high-rise residential areas with a courtyard-style layout.
Sustainability 14 03932 g014
Table 1. Calculation conditions of numerical simulation.
Computational domain3.0 m× 2.0 m× 1.8 m.
Inflow boundary conditionInterpolated value of wind velocity (U) and turbulent kinetic energy (k) from the experimental approaching flow, ε was calculated by assuming that Pk = ε.
Outflow boundary conditionZero-gradient condition.
Ground surface boundaryLogarithmic law with roughness length (z0 = 4.5 × 10⁻⁴ [m]).
Lateral and upper surfaces ofthe computational domainLogarithmic law for a smooth surface wall.
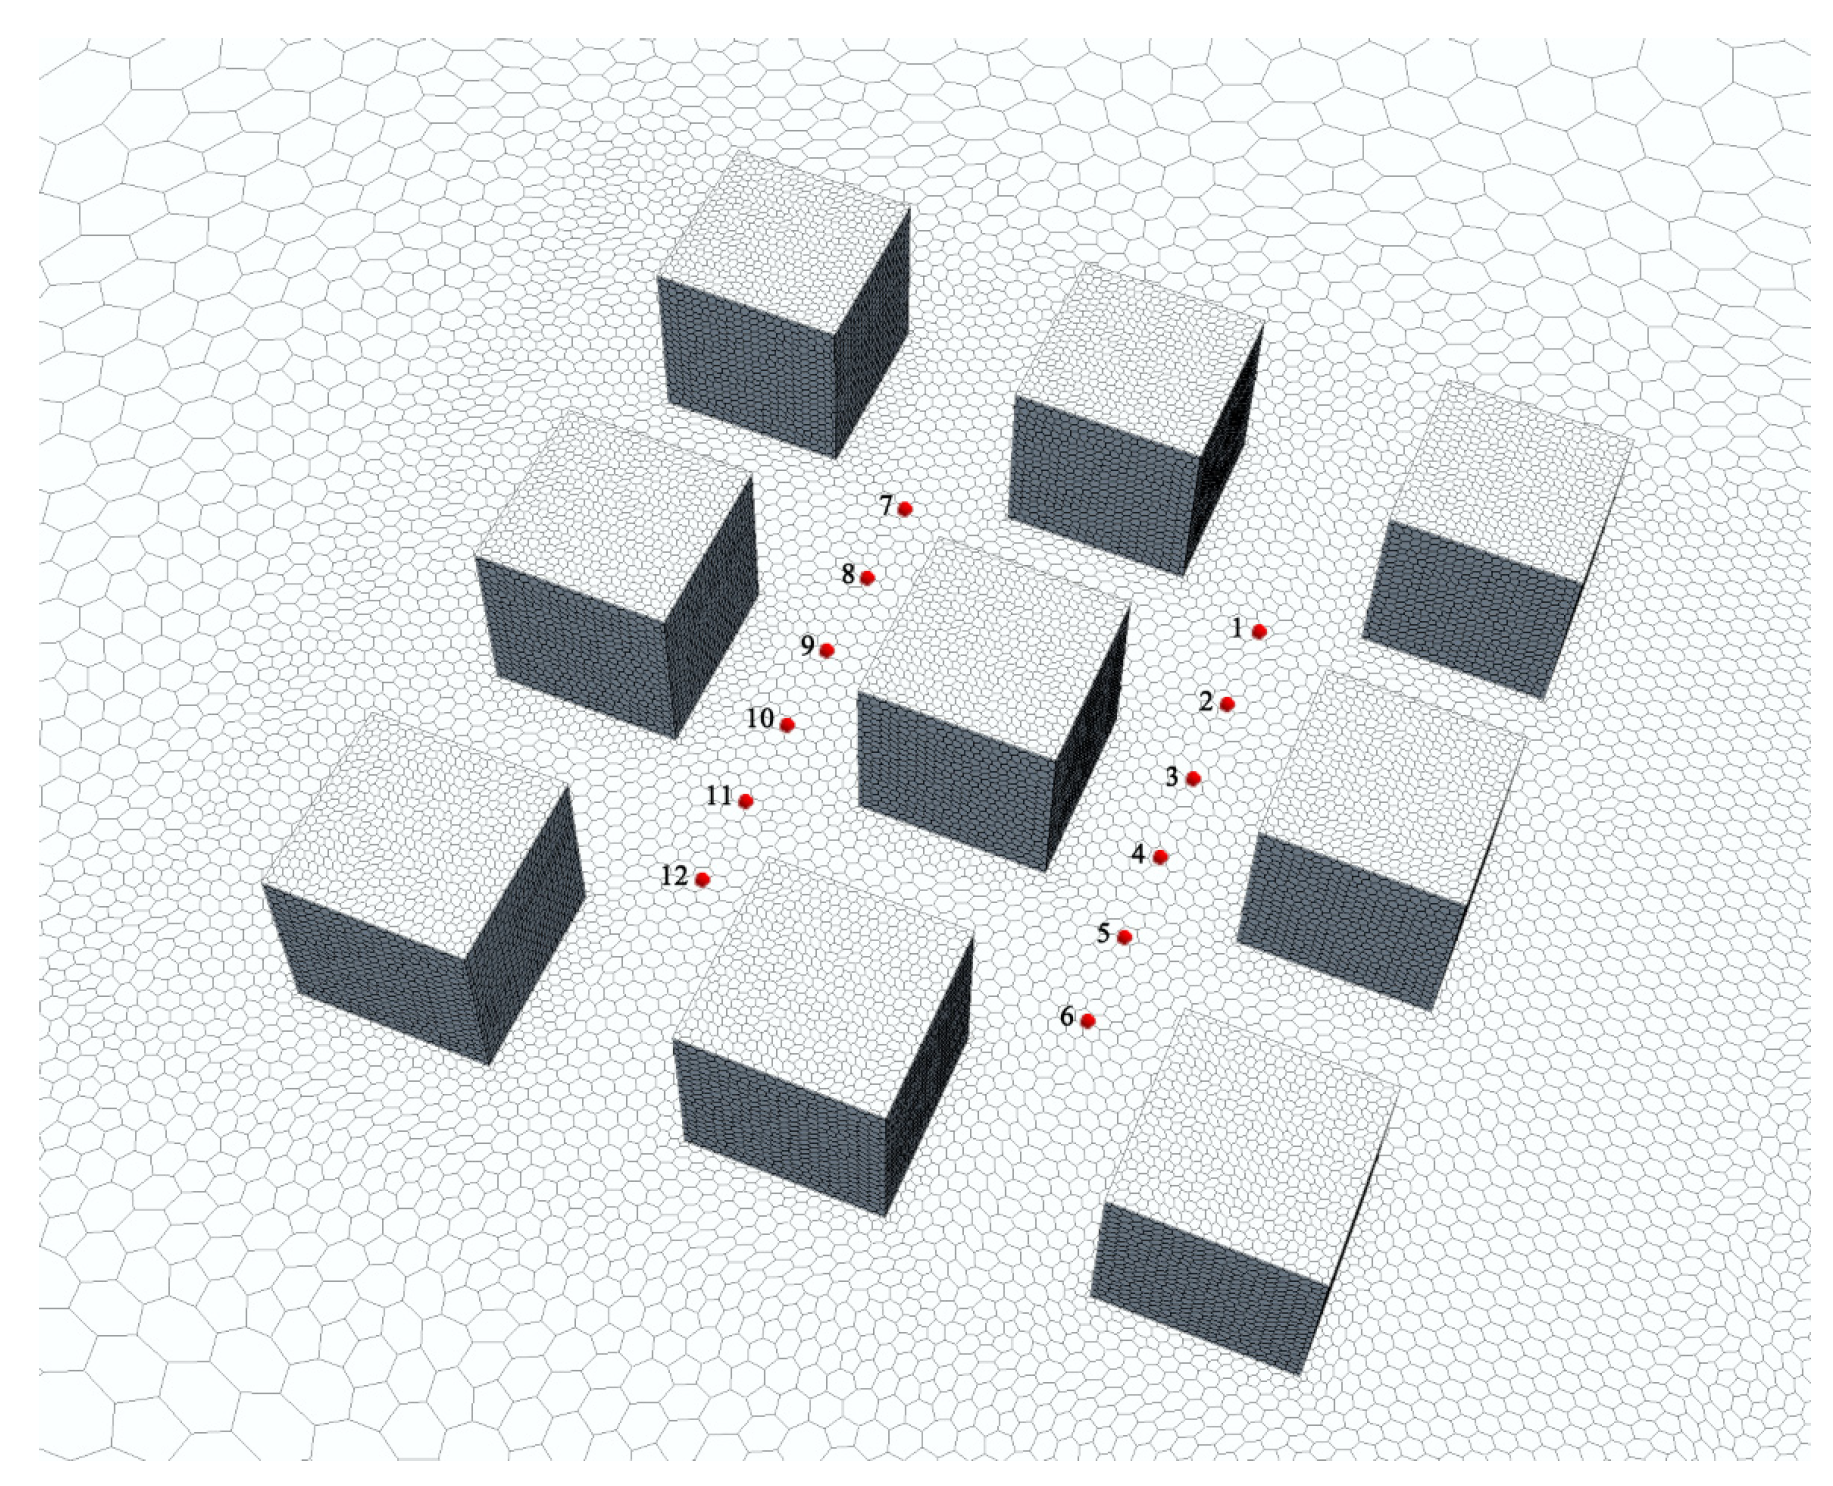
Mesh discretizationPolyhedral meshes are used. Base mesh size was 0.12 m, the relative mesh size of the building was 10% of the base mesh size, and the relative mesh size in the area near the buildings was 16% of the base mesh size. The generated mesh is shown in Figure 5.
Turbulence modelThe SKE mode, LRKE model, STLKE model, RKE model, and RTLKE model were selected.
Table 2. Comparison of wind environment at the horizontal plane with a height of 1.5 m.
Layout FormMaximum Wind SpeedProportion of Areas with Wind Speed Higher than 14.4 m/sArea with High Wind Speed
Rows-style21.15 m/s19.3%7152 m2
Freestyle21.66 m/s20.0%7426 m2
Courtyard-style21.26 m/s16.6%6146 m2
Table 3. Comparison of wind environment at the horizontal plane with a height of 10 m.
Layout FormMaximum Wind SpeedProportion of Areas with Wind Speed Higher than 14.4 m/sArea with High Wind Speed
Rows-style21.53 m/s21.5%7967 m2
Freestyle21.55 m/s23.6%8766 m2
Courtyard-style21.71 m/s19.2%7108 m2
Table 4. Comparison of wind environment at the horizontal plane with a height of 1.5m.
Layout FormMaximum Wind SpeedProportion of Areas with Wind Speed Higher than 14.4 m/sArea with High Wind Speed
Rows-style16.88 m/s4.4%1618 m2
Freestyle17.35 m/s3.5%1293 m2
Courtyard-style17.03 m/s4.2%1557 m2
Table 5. Comparison of wind environment at the horizontal plane with a height of 10 m.
Layout FormMaximum Wind SpeedProportion of Areas with Wind Speed Higher than 14.4 m/sArea with High Wind Speed
Rows-style17.15 m/s5.4%2002 m2
Freestyle17.24 m/s4.2%1566 m2
Courtyard-style17.36 m/s4.9%1806 m2
Publisher’s Note: MDPI stays neutral with regard to jurisdictional claims in published maps and institutional affiliations.

