Article

A Life Cycle Assessment of Organic and Chemical Fertilizers for Coffee Production to Evaluate Sustainability toward the Energy–Environment–Economic Nexus in Indonesia

1
Graduate School of Life and Environmental Sciences, University of Tsukuba, Tsukuba 305-8572, Japan
2
Faculty of Agricultural Industrial Technology, Universitas Padjadjaran, Sumedang 45363, Indonesia
3
Research Center for Sustainable Production System and Life Cycle Assessment, National Research and Innovation Agency, South Tangerang 15341, Indonesia
4
Faculty of Life and Environmental Sciences, University of Tsukuba, Tsukuba 305-8572, Japan
5
Laboratory of Agricultural Systems Engineering, Division of Environmental Science and Technology, Faculty/Graduate School of Agriculture, Kyoto University, Kyoto 606-8502, Japan
*
Author to whom correspondence should be addressed.
Sustainability 2022, 14(7), 3912; https://doi.org/10.3390/su14073912
Submission received: 24 February 2022 / Revised: 23 March 2022 / Accepted: 23 March 2022 / Published: 25 March 2022

Abstract

:
Coffee is an important agricultural commodity that is branded according to its environmental criteria in the global market. Therefore, Indonesia’s coffee production system needs to be investigated to meet the demand for eco-labeling, which has become a consumer preference. This study aims to assess the comprehensive sustainability evaluation of coffee production nurtured by an organic fertilizing system (OFS), chemical-organic fertilizing system (COFS), and chemical fertilizing system (CFS) that focuses on the energy–environment–economic nexus. A life cycle assessment (LCA), life cycle cost analysis (LCC), and energy analysis were performed as methods to evaluate the environmental impact, economic performance, and energy requirement analysis. The results indicated that the OFS had superior performance in two sustainability aspects: resulting in the lowest environmental damage and generating the highest economic benefit. Simultaneously, COFS shows the highest sustainability performance as it consumes the least energy. In contrast, CFS indicated the lowest sustainability performance in all aspects: highest environmental impact, lowest economic benefit, and highest energy consumption. Therefore, OFS is strongly recommended to be applied broadly, considering its environmental and economic superiority. Consequently, massive OFS application was followed by higher energy consumption. Alternatively, COFS can be considered for application due to its higher energy performance, even though it can potentially result in higher environmental damage and lower economic benefit. However, the government should explicitly provide some effort for the broad application of OFS in financial and assistance support since the shifting process needs more time to adapt.

Graphical Abstract

1. Introduction

1.1. Sustainability Issue in the Global Market Demand

The global demand for agricultural commodities has increased with rapid population growth and economic development [1]. This demand has promoted intensive agricultural practices and the development of the agriculture industry. Simultaneously, intensive agriculture substantially depletes the natural resources and causes environmental damage [2,3,4,5,6,7]. From the global market perspective, environmental issues have become popular, and sustainability guarantees product competitiveness. Due to the increased environmental awareness campaign, the high consumer preferences stimulate business pressure on sustainability concerns [8]. Sustainability issues also challenge production activities: protecting and rejuvenating the environment, promoting and recycling economically, and saving and efficiently utilizing energy [9].
The three sustainability challenges in production activity correspond to the sustainable development goals (SDGs). The SDGs are the way to achieve peace and prosperity for both humans and the earth that are expressed by 17 goals by the United Nations [10]. Eight SDGs are related to agriculture production: zero hunger, economic growth, clean water sanitation, affordable and clean energy, responsible consumption and production, climate action, life below water, and life on land. The SDGs study also reported that SDGs play a central role in producing clean and affordable energy for preserving life both in the sea and on land [11]. Following the SDGs, agricultural production activity should practice methods, processes, and technologies during production activity to protect humans, nature, and resources for the use of future generations [11]. Thus, assessing and promoting the sustainability of agricultural production in environmental, economic, and energy aspects are essential.

1.2. Coffee Production in Indonesia and its Sustainability Issue

According to the International Coffee Organization, the world coffee demand followed an upward trend, with an average increase of 1.4% per year from 2017 to 2020 [12]. Indonesia contributes 7.42% to world coffee demand and is the fourth most significant contributor, with an average annual production of 683.64 million kg y−1. This shows that Indonesia is a potential global coffee producer. Therefore, the coffee industry in Indonesia should consider sustainability concerns for natural responsibility and when competing with the global market. Indonesia’s coffee is produced by three different sectors: smallholder communities (95.45%), government companies (2.21%), and private companies (2.44%) [13]. Coffee plantations in Indonesia are predominantly managed by smallholders who apply conventional methods with massive amounts of chemical fertilizer, and only a few practiced organic systems. Massive amounts of fertilizers, pesticides, human labor, electricity, gasoline, and other materials were used during the coffee production process at the farm level. Simultaneously, the environmental damage is predicted to be severely impacted by the conventional practice of coffee production. The study also reported that production activity at the farm level is predicted to be a hotspot for GHG emissions in the coffee supply chain [14]. Shifting into more green coffee cultivation will significantly decrease the environmental damage impacted by coffee production activity. The organic cultivation system that avoids chemical substances represents the green cultivation in progress which is currently broadly practiced in agricultural production [15].
However, some studies have been conducted on coffee in recent years: the environmental study of coffee at different levels of fertilizer input and shade trees in Nicaragua and Costa Rica [14]; the identification of the carbon footprint of coffee beverages in Japan, which evaluated the carbon footprint of the coffee serving technology [16]; the study of shade tree application and its impact on the environment [17]; a cycle of participatory study in Organic coffee [18]; and the study of the environmental profile of green bean coffee in Brazil [19]. However, a specific study on coffee in Indonesia related to fertilizer management during the production of Robusta coffee without evaluating the sustainability profile has been investigated [20]. A study also reported that the coffee industry in Indonesia still provides limited financial benefits to smallholder farmers [21].
Referring to the study reports on coffee, some issues concerning coffee production in Indonesia are highlighted. First, studies on the area of coffee cultivation calculated in multiyear cultivation were limited. As coffee is a multiyear crop, it is essential to calculate the multiyear input-output system during cultivation to obtain a more precise emission result. Second, there is a lack of comprehensive information about the sustainability of coffee production in Indonesia based on fertilizer treatments. Lastly, previous studies only investigate the environmental impacts of coffee cultivation and disregard the economic and energy perspectives.

1.3. Sustainability Measurement

A comprehensive sustainability evaluation on the environment, economy, and energy aspects can be conducted using the life cycle assessment (LCA) approach [22]. In environmental evaluation, LCA specifically estimates the environmental damage over the entire life cycle of a process or product [7]. Some environmental indicators linked to the sustainability performance using an LCA approach, such as carbon footprint which is currently represented by carbon dioxide emissions [2,23,24], acidification potential (AP), eutrophication potential (EP), and global warming potential (GWP) [25,26].
However, economics is one crucial aspect in SDGs which is classified in economic growth development goals in SDGs [10]. Agriculture production activity should include economic sustainability to ensure sustainable production in the future. In coffee production, economic benefits for farmers becomes a concern of the ICO. A recent study conducted by the ICO reported that coffee farmers in selected countries are operating at a loss and that coffee growing is becoming less profitable over time [27]. Additionally, farmers are likely to consider implementing a strategy with a positive economic result. Therefore, economic performance evaluation is essential for coffee production activity. The life cycle cost (LCC) assesses all costs associated with a product’s life cycle in economic performance. The LCC can detect the direct and indirect cost factors and estimate improvements in the planned product changes [22,28,29,30]. The production cost, revenue, and profit were identified during the LCC analysis. Cost and profit were used as indicators of economic performance to determine the relative success of a farm operation in terms of its ability to meet short-term financial obligations [31].
In the energy aspect, promoting affordable and clean energy is one of the goals of SDGs. In modern production, activity was also challenged to achieve energy-saving and efficient utilization. Considering the energy goal of SDGs and energy direction of modern production, analysis of the energy aspect in coffee production is essential. According to energy analysis, the energy requirement is the basis to evaluate the efficient use of energy aspects that become principal requirements of sustainable agriculture [32]. Therefore, measuring the energy requirement can also indicate the sustainability status.
Considering SDGs for agricultural production and the current sustainability issue for coffee in global demand, it is necessary to consider three sustainability aspects comprehensively–environmental impact, economic benefits, and energy–to enhance the sustainability of coffee production. However, the comprehensive evaluation of the environmental, economic, and energy situation at the farm-level potentially has a significant impact on the effective improvement since reported as the hotspot to environmental damage during agriculture production.

1.4. Research Objective

The objective of this study was to comprehensively evaluate the sustainability assessment considering the environmental impact, economic performance, and energy requirements of coffee production nurtured by different fertilizer applications within a multiyear production period. The energy–environment–economic evaluation of coffee production can provide valuable information for all stakeholders to achieve the three sustainable production goals: rejuvenating the environment, promoting economics, and saving and effectively utilizing energy. Additionally, this study can scientifically fill the research gap in coffee production management in Indonesia. Further research is required to encourage farmers to develop a more environmentally and economically viable coffee production system. Moreover, such efforts can also provide considerable insight into the government’s decision-making process to support coffee farmers applying the green coffee production method.
This paper consists of five sections. Section 1 is the Introduction; Section 2 is Materials and Methods; Section 3 is study Results; Section 4 is the Discussion; Section 5 is the Conclusion.

2. Materials and Methods

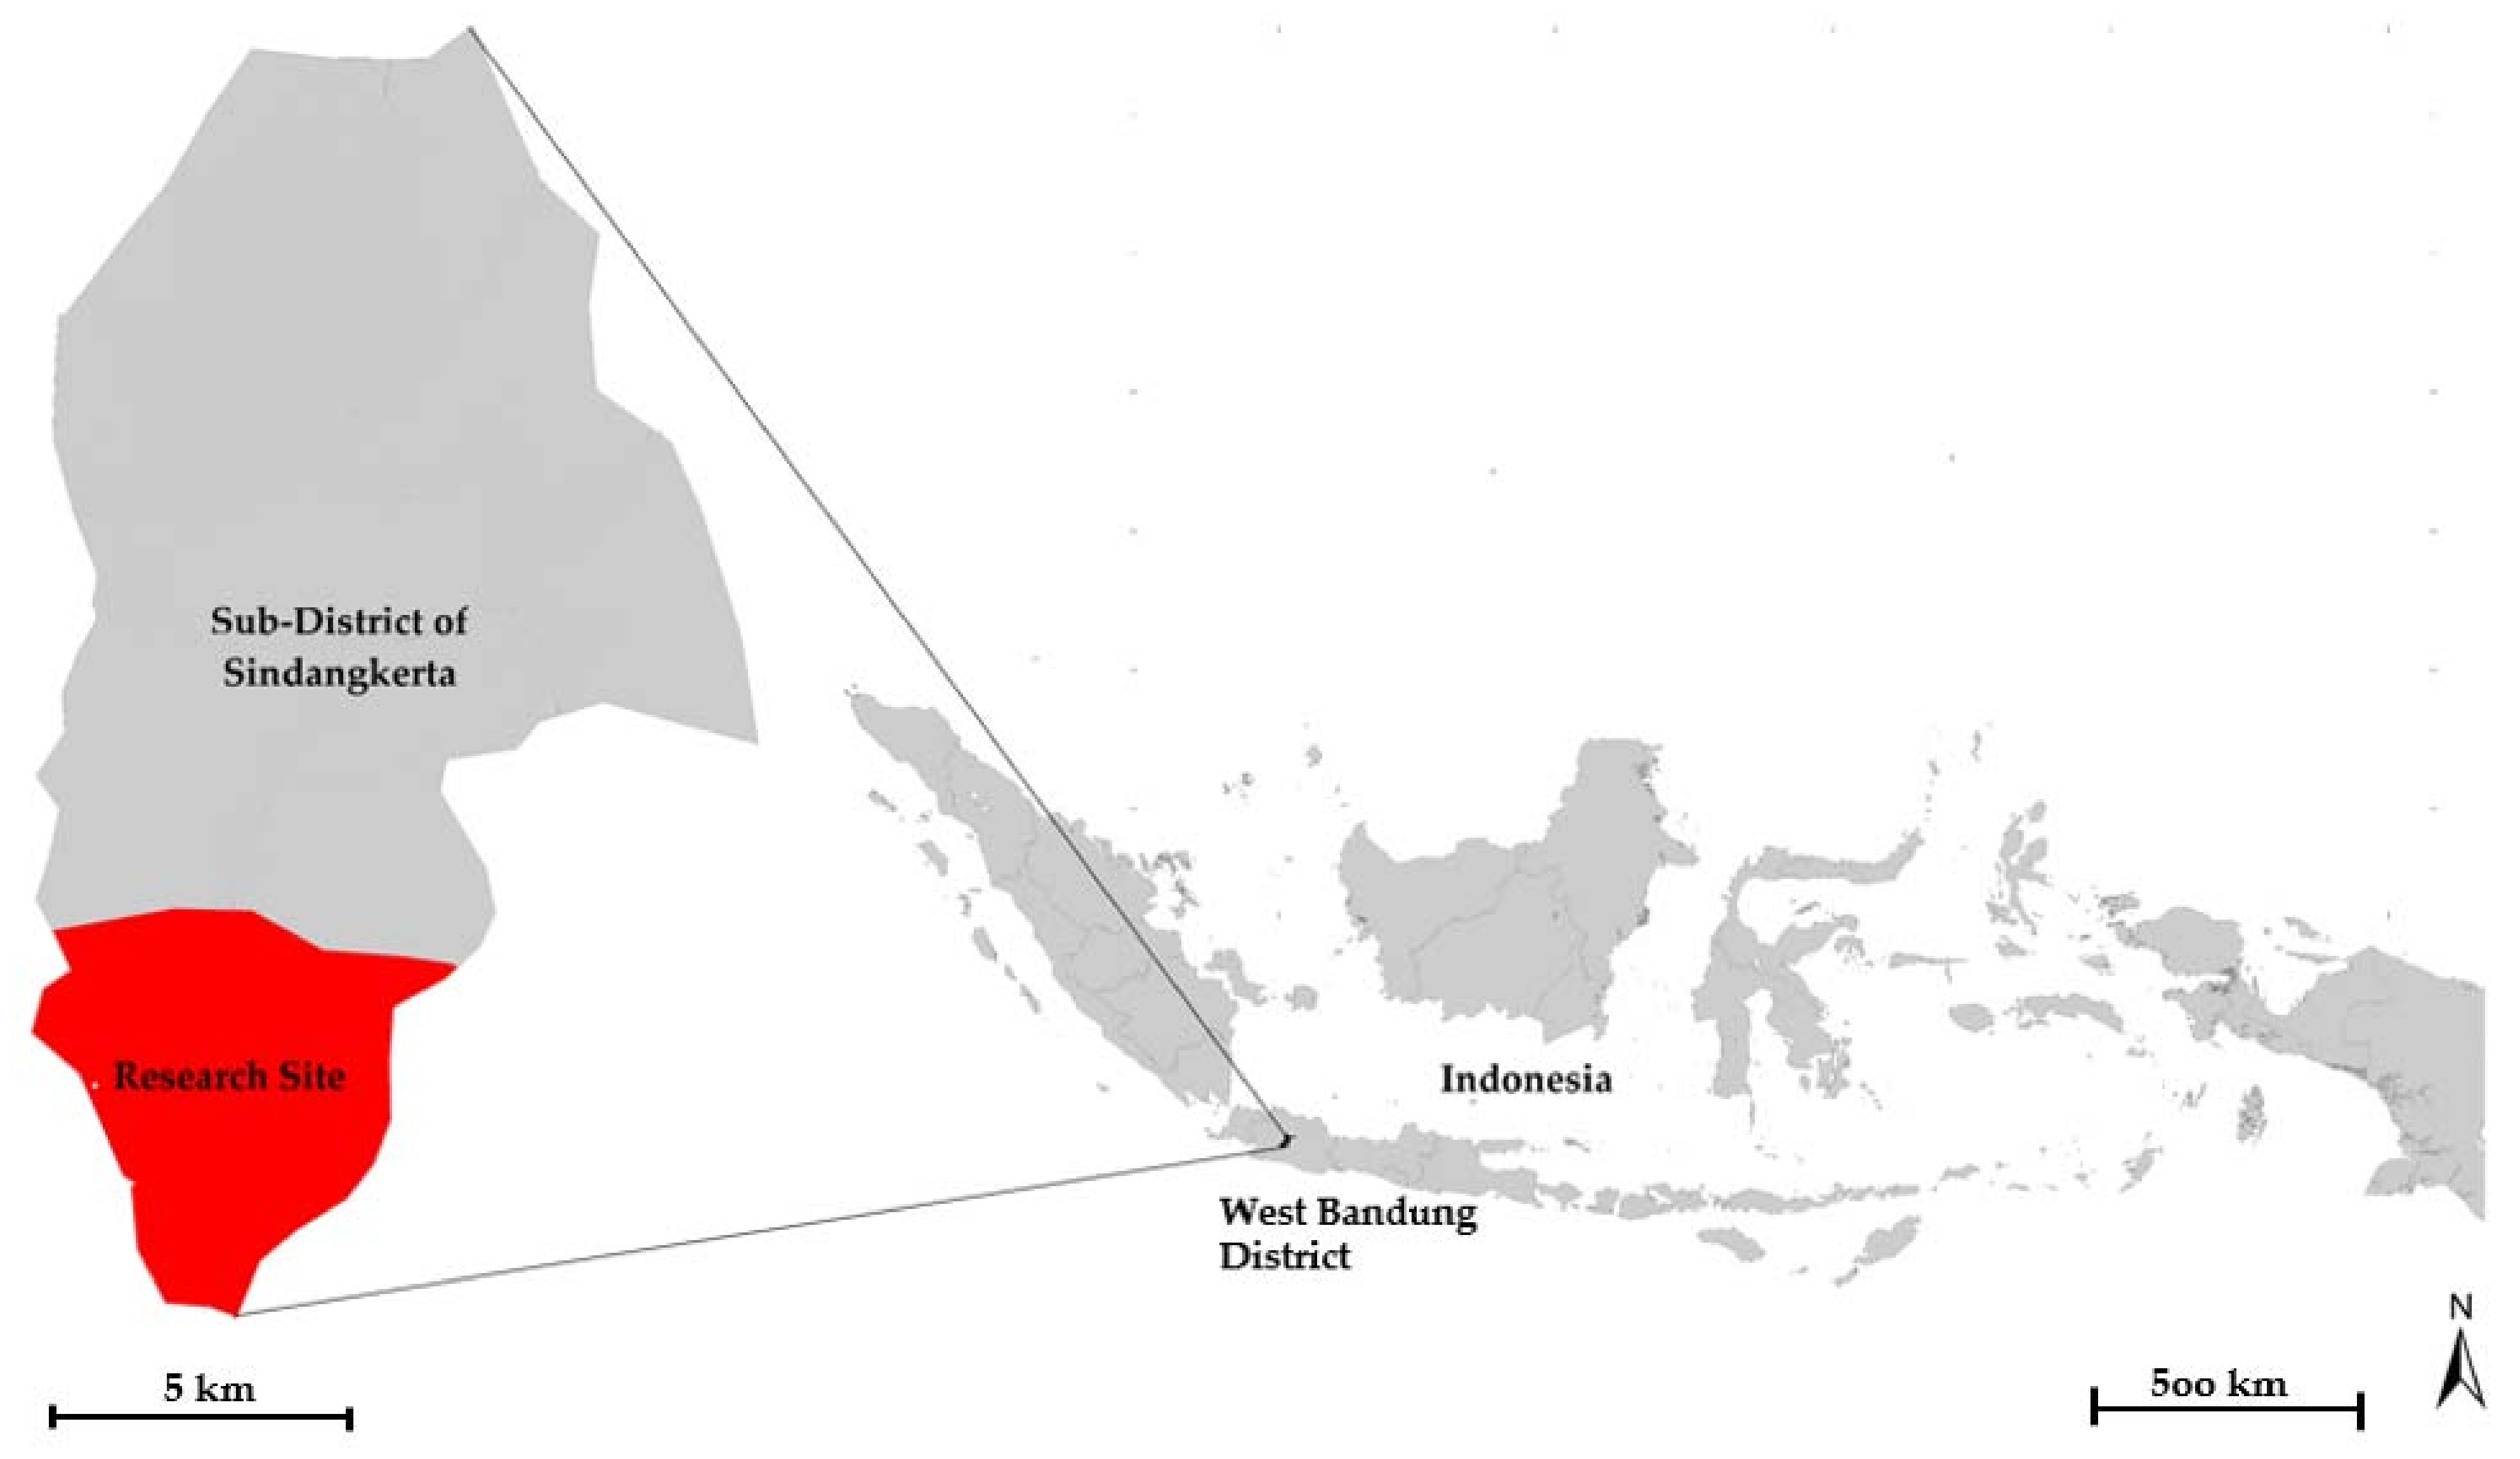
2.1. Research Location and Object Studied

This study was conducted on a farmer’s plantation, managing a small-medium coffee industry. Simultaneously, the farmer also practiced intensive maintenance coffee production. The farmer practiced some coffee cultivation systems in 480 ha of chemical-organic fertilizing systems, 25 ha of organic fertilizing systems, and 5 ha of chemical fertilizer fertilizing systems in the central arabica coffee production area sub-district of Sindangkerta, which is located in the West-Bandung District. West Bandung District is located in the specific geographical position at 6°41′–7°19′ S and 107°22′–108°5′ E with 130,577.40 ha of total area. This area is popular as the producer of many agricultural commodities due to the high soil fertility level. This area has the potential to adequately access the hydrological system for agriculture since the main watershed traverses. This region contains evergreen and moist-deciduous forest types. The climate in this location is hot and humid, with the rainfall continuously around four months in a year [33]. Specifically, the Sindangkerta sub-district is more popular with its coffee production and has become one of the coffee production centers in West Java that has produced coffee for domestic and international coffee consumption for more than two decades. The detailed information is presented in the following figure (Figure 1).
In this study, all coffee cultivation was planted in agroforestry areas. Nowadays, coffee has become more prevalent in agroforestry areas, whereas a few farmers have temporarily planted coffee in open field areas in Indonesia. Table 1 presented detailed geographical information of coffee cultivation studied.
According to this study objective, the sustainability assessment will compare the three cultivation systems based on their fertilizer applications. Farmers in Indonesia practice some plantation management systems according to their fertilizer application: organic fertilizing system (OFS), chemical-organic fertilizing system (COFS), and chemical fertilizing system (CFS). OFS is still applied in small areas, whereas the COFS is extensively applied in Indonesia. However, higher productivity has encouraged farmers to apply the COFS continuously. This condition is under some literature and experience in producing other agricultural commodities that suggest that chemical and organic fertilizers can improve production capacity [6], regardless of environmental and economic considerations.
Currently, organic coffee is produced by practicing OFS on the farm level to fulfill the demands of specialty coffee export and environmental protection. Farmers used poultry manure, compost, and liquid fertilizer as the main fertilizers in the OFS. In COFS, organic and chemical fertilizers were combined during the plantation activities. In COFS and CFS, farmers used NPK as a chemical fertilizer. However, CFS is not mainly applied to coffee plantations because of its low productivity. Moreover, the excessive use of chemical fertilizers in the long term reportedly contributes to land degradation and nutrient pollution [34]. Therefore, it seems good progress since the chemical fertilizing system provides severe environmental damage.

2.2. Work Procedure

This study is conducted in four stages. The first stage is the goal and scope definition. In this stage, the objective and the boundary system are also defined. The second stage is data collection and inventory analysis. The data is collected in the research object refers to the boundary system. The third stage is sustainability analysis which evaluates three aspects: environmental impact assessment, economic performance analysis, and energy requirement analysis. The environmental impact analysis of multiyear coffee cherry bean production is performed using the life cycle assessment (LCA) methodology according to ISO 14040:2006. LCA is defined by ISO 14040 as the compilation and evaluation of the input, output, and potential environment of a product system throughout a life cycle [35,36]. Simultaneously, this study performed the life cycle cost method to evaluate the economic performance; and energy requirement analysis is used to evaluate the energy aspect. After conducting the primary analysis in stage 3, result interpretation will be at the end of this study procedure work. Figure 2 expresses the detailed work procedure of this study.

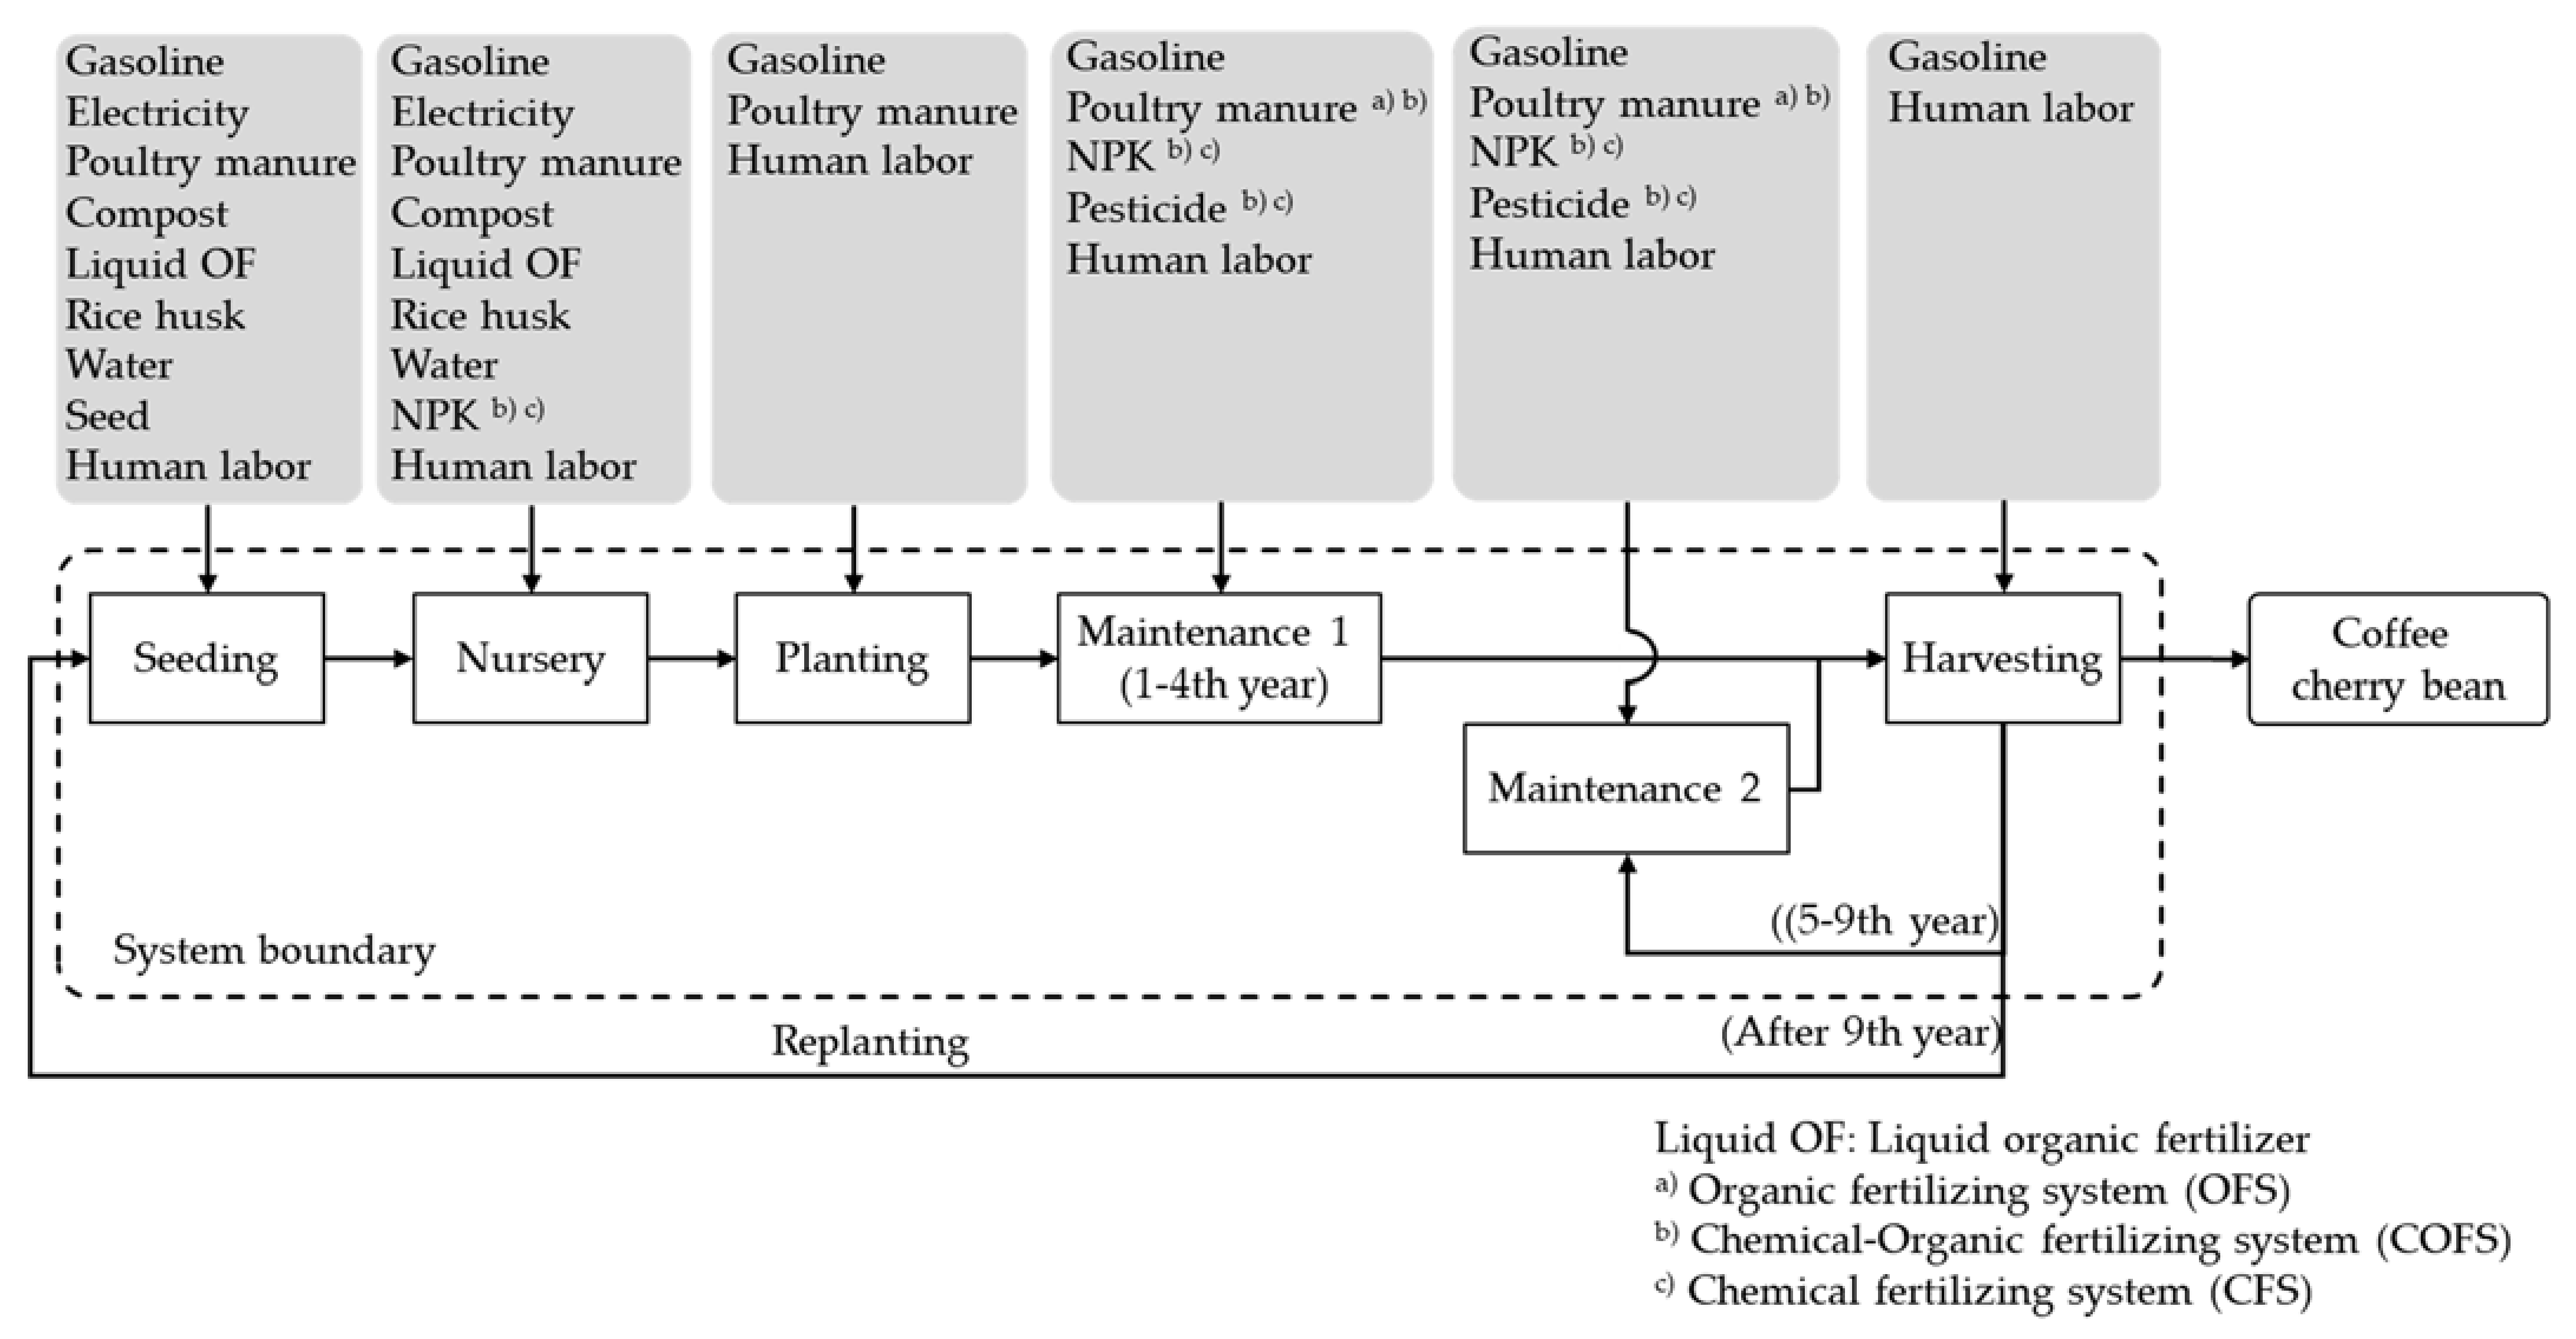
2.2.1. Goal and Scope Definition

The boundary system includes all stages of coffee plantation with multiyear production until replanting as presented in Figure 3. All necessary input-output was calculated following the research scope and boundary in a 1 ha coffee plantation. This study set four and five years as the pre-productive and productive stages, respectively. The pre-productive stage is the period before the coffee tree produces the coffee cherry beans, whereas the productive stage is when the coffee tree yields the coffee cherry bean. Coffee is categorized as an annually harvested plant with a three-month harvesting period per year. The harvesting started from the fourth year after planting and could be harvested until the ninth year of cultivation. The following figure expresses the boundary system of this study.

2.2.2. Data Collection and Life Cycle Inventory Analysis (LCI)

The data was collected by field observation, in-depth interview, and questionnaire based on the coffee farmers with the research scope and boundary. The life cycle inventory (LCI) is an essential phase in the LCA that processes data collected from the farmer. The LCI was conducted based on the material and energy requirements during coffee production. A 1 ha coffee plantation is used as the functional unit during the inventory analysis. Table 2 presented the inventory analysis result of 1 ha coffee cultivation system.
The inputs for coffee production included gasoline, electricity, fertilizer (poultry manure, compost, liquid organic fertilizer, and NPK), pesticides, rice husks, water, seeds, and labor. Gasoline is used in vehicles to transport labor and materials to the field. Electricity is required for watering during the seeding and nursery stages. Two types of fertilizers were used in this study: organic and non-organic. Compost, poultry manure, and liquid organic fertilizers were used as organic fertilizers, and NPK was used as a chemical fertilizer. Pesticides are conditionally used to control pest attacks. Chemical pesticides are applied in CFSs and COFSs, whereas organic pesticides are used in the OFS. The seed is an essential material in the first stage of plantation. Organic seeds were used in all the coffee fertilizing systems. A 1 ha coffee plantation needs 2 kg of organic seed. As the additional material, rice husk is provided as the growth medium during the seeding and nursery stages. Another vital activity during seeding and nursery is watering. The level of water used during seeding and nursery maintenance is different in each stage. As typical of conventional agricultural practice, all the physical activities in plantations are conducted by human labor. Therefore, human labor is an essential input presented by the total labor working hours during coffee production activities. As the output, the total coffee cherry production is generated by six years of harvesting. The following table expresses the inventory analysis results of the input-output system.

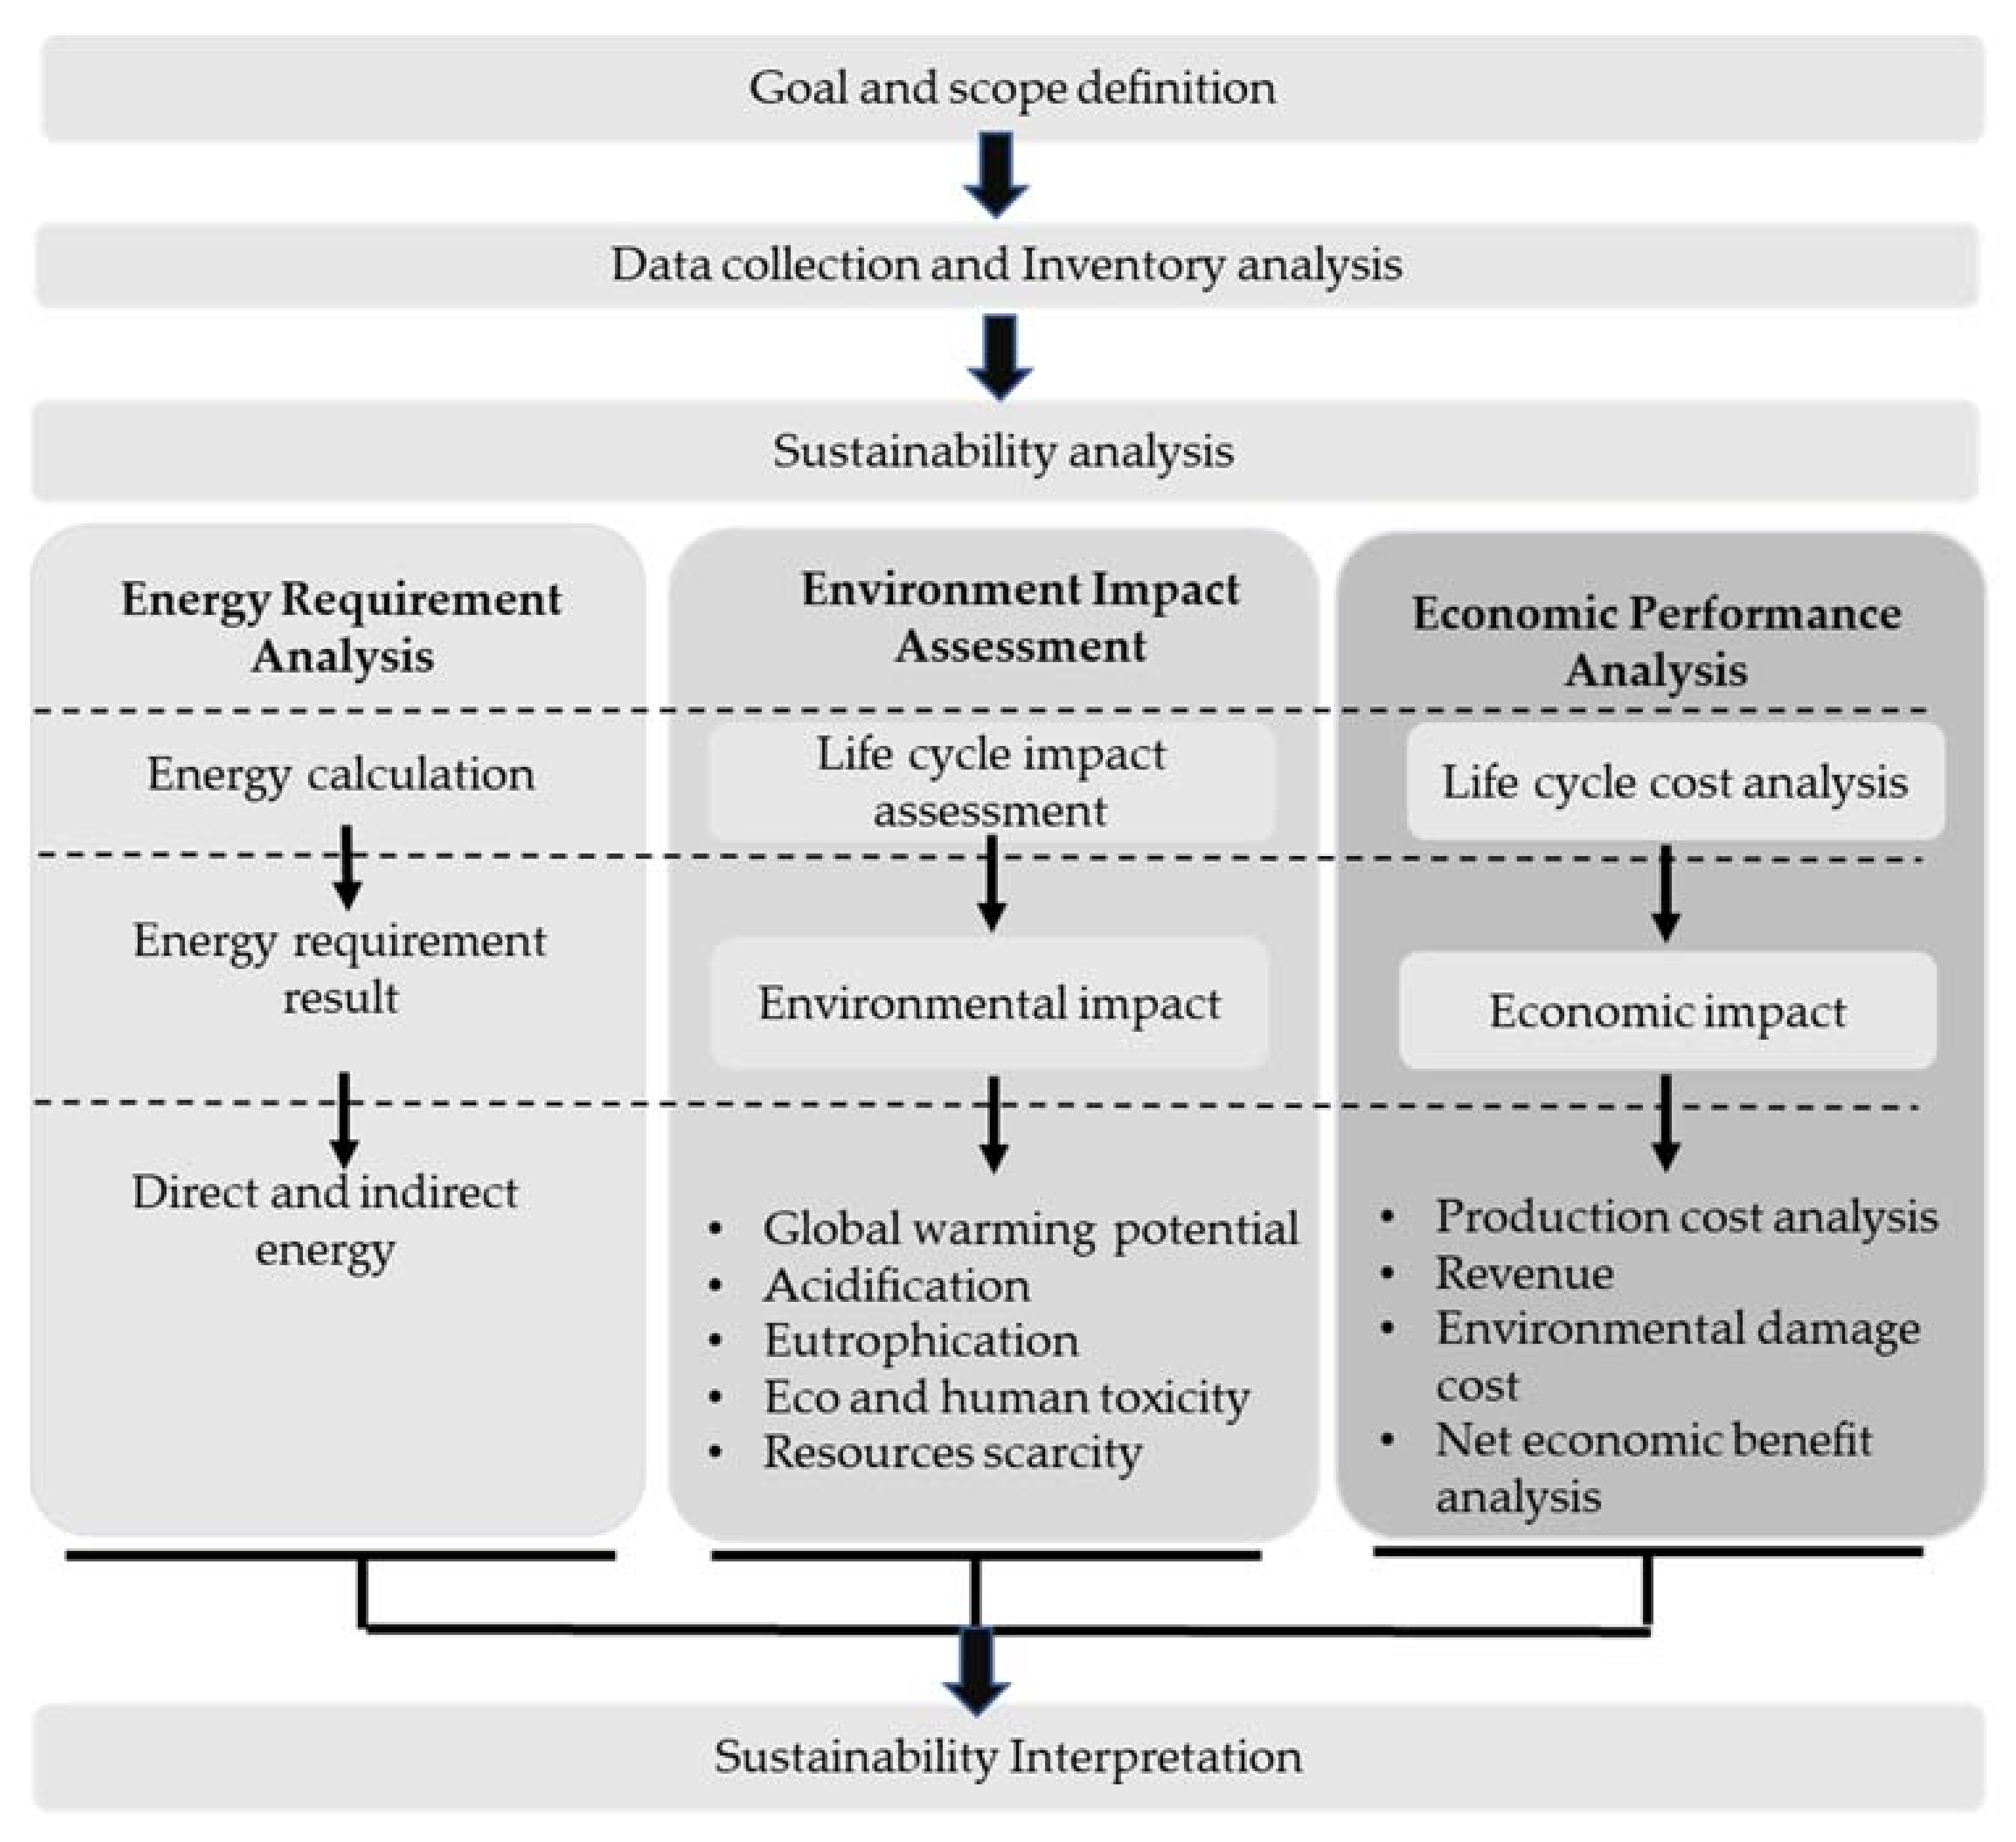
2.2.3. Sustainability Analysis

Energy Requirement Analysis

The total energy is calculated as the sum of energy required by each material and energy input during coffee production in energy requirement analysis. The energy of each input system was obtained by multiplying the input consumption (Table 2) and its energy conversion factor (Table 3). This study used the energy conversion factors from scientific literature, as presented in the following table.

Life Cycle Impact Assessment (LCIA)

The life cycle impact assessment is the main stage for assessing the environmental impact. The LCA analysis of coffee cherry bean production performed LCA methodology according to ISO 14040:2006. According to ISO 1440:2006, LCA analysis evaluates the potential environmental impact throughout a product’s life cycle [36,49]. The present study adopted the LCA methodology developed by the ReCiPe 2016 v.1.0.4 midpoint method with a hierarchy version created by RIVM, Radboud University, Norwegian University of Science and Technology, and PRé Consultant [49]. The calculation was performed using Simapro v.9.1.1.1® software with the Ecoinvent 3.7.1 database. The environmental impact on this present study considered eleven impact categories: the global warming potential (GWP), terrestrial acidification (TA), freshwater eutrophication (FE), marine eutrophication (ME), terrestrial ecotoxicity (TE), freshwater ecotoxicity (FEc), marine ecotoxicity (MEc), human carcinogenic toxicity (HCT), human non-carcinogenic toxicity (HnCT), mineral resource scarcity (MRS), and fossil resource scarcity (FRS). The environmental impact of each fertilizing system was calculated using the following equation:
E I   O F S ,   C O F S ,   C F S = k = 1 n   ( E F k × m a t e r i a l   o r   e n e r g y   i n p u t   k
The environmental impact indicators for each coffee plantation are expressed as EI (OFS, COFS, CFS). Where OFS, COFS and CFS indicate the organic fertilizing system, chemical-organic fertilizing system, and chemical fertilizing system, respectively. The sum of all emission inputs is calculated in all environmental indicators The emission per input was obtained by multiplying each emission factor (EF) by the material or energy input (n). The EF indicates the emission impact per unit input. Some studies either used EF from the literature or conducted preliminary calculations. This study conducted a preliminary calculation using SimaPro to obtain the EF and environmental impact results.

Life Cycle Cost Analysis (LCC)

The life cycle costing (LCC) study aimed to fully account for the financial costs of the environmental aspects and impacts of the life cycle [22,48]. The LCC is calculated considering all the input-output inventory costs and the environmental impact costs of the LCA. The LCA input cost is represented by all the expenses required to provide the materials and energy during the plantation. The cost of each specific input was calculated by multiplying the total input used by the standard cost of its input. The environmental impact cost is represented by the CO2 emission cost, which is calculated as the total CO2 emissions multiplied by the CO2 emission tax. This study only calculates the CO2 emission cost as the primary environmental impact cost considering Indonesia’s condition, which is still preparing to implement the CO2 tax in its environmental policy. The CO2 emission tax refers to the standard carbon tax for developing countries as the standard carbon tax for Indonesia is still unavailable. According to the OECD Taxing Energy Use (TEU) Database, Indonesia recommends using a moderate emission tax standard emission [50]. As our study considers multiyear production costs, this calculation also assumes the discount rate for the small-to medium-scale sector. Therefore, the following equation is used for the LCC calculation:
T o t a l   l i f e   c y c l e   c o s t   T L C C = P r o d u c t i o n   c o s t + E m i s s i o n   c o s t
P r o d u c t i o n   c o s t = F i x e d   c o s t + V a r i a b l e   c o s t  
E m m i s i o n   c o s t = T o t a l   p r o d u c t i o n × E m i s s i o n   t a x
The total life cycle cost (TLCC) is the total cost of the life cycle of coffee, which fully accounts for all the production and emission costs. The production cost indicates all expenses during the coffee production life cycle, which consists of a fixed cost and variable cost. A fixed cost is the initial investment cost, such as the machinery, tools, and rent for the cultivation land. The variable cost included all materials, labor, transportation, distribution, and environmental impact costs during the project’s life cycle. The emission cost is the impact of the environmental damage cost. The total production indicates the total coffee cherry bean production. This study considers the multi-year costs following the research boundary.
The economic benefit was also investigated by a subsequent economic analysis using the following equation:
N e t   p r o f i t = R e v e n u e T L C C
R e v e n u e = T o t a l   p r o d u c t i o n × s e l l i n g   p r i c e   p e r   k g
Net profit represents the potential profit generated by the farmer which is calculated by the revenue subtracted with the TLCC. All currency values are converted into USD from IDR using 14,409 IDR USD−1 [51].

2.2.4. Sustainability Interpretation

This stage explains a descriptive interpretation of the study results that compared the sustainability analysis: energy requirement, environmental impact, and economic performance on the three coffee fertilizing systems. By comparing all results, better performance in energy, environmental, and economic aspects will be provided.

3. Result

This section describes the results of the present study: energy requirement analysis, environmental impact assessment, and life cycle cost analysis of coffee production.

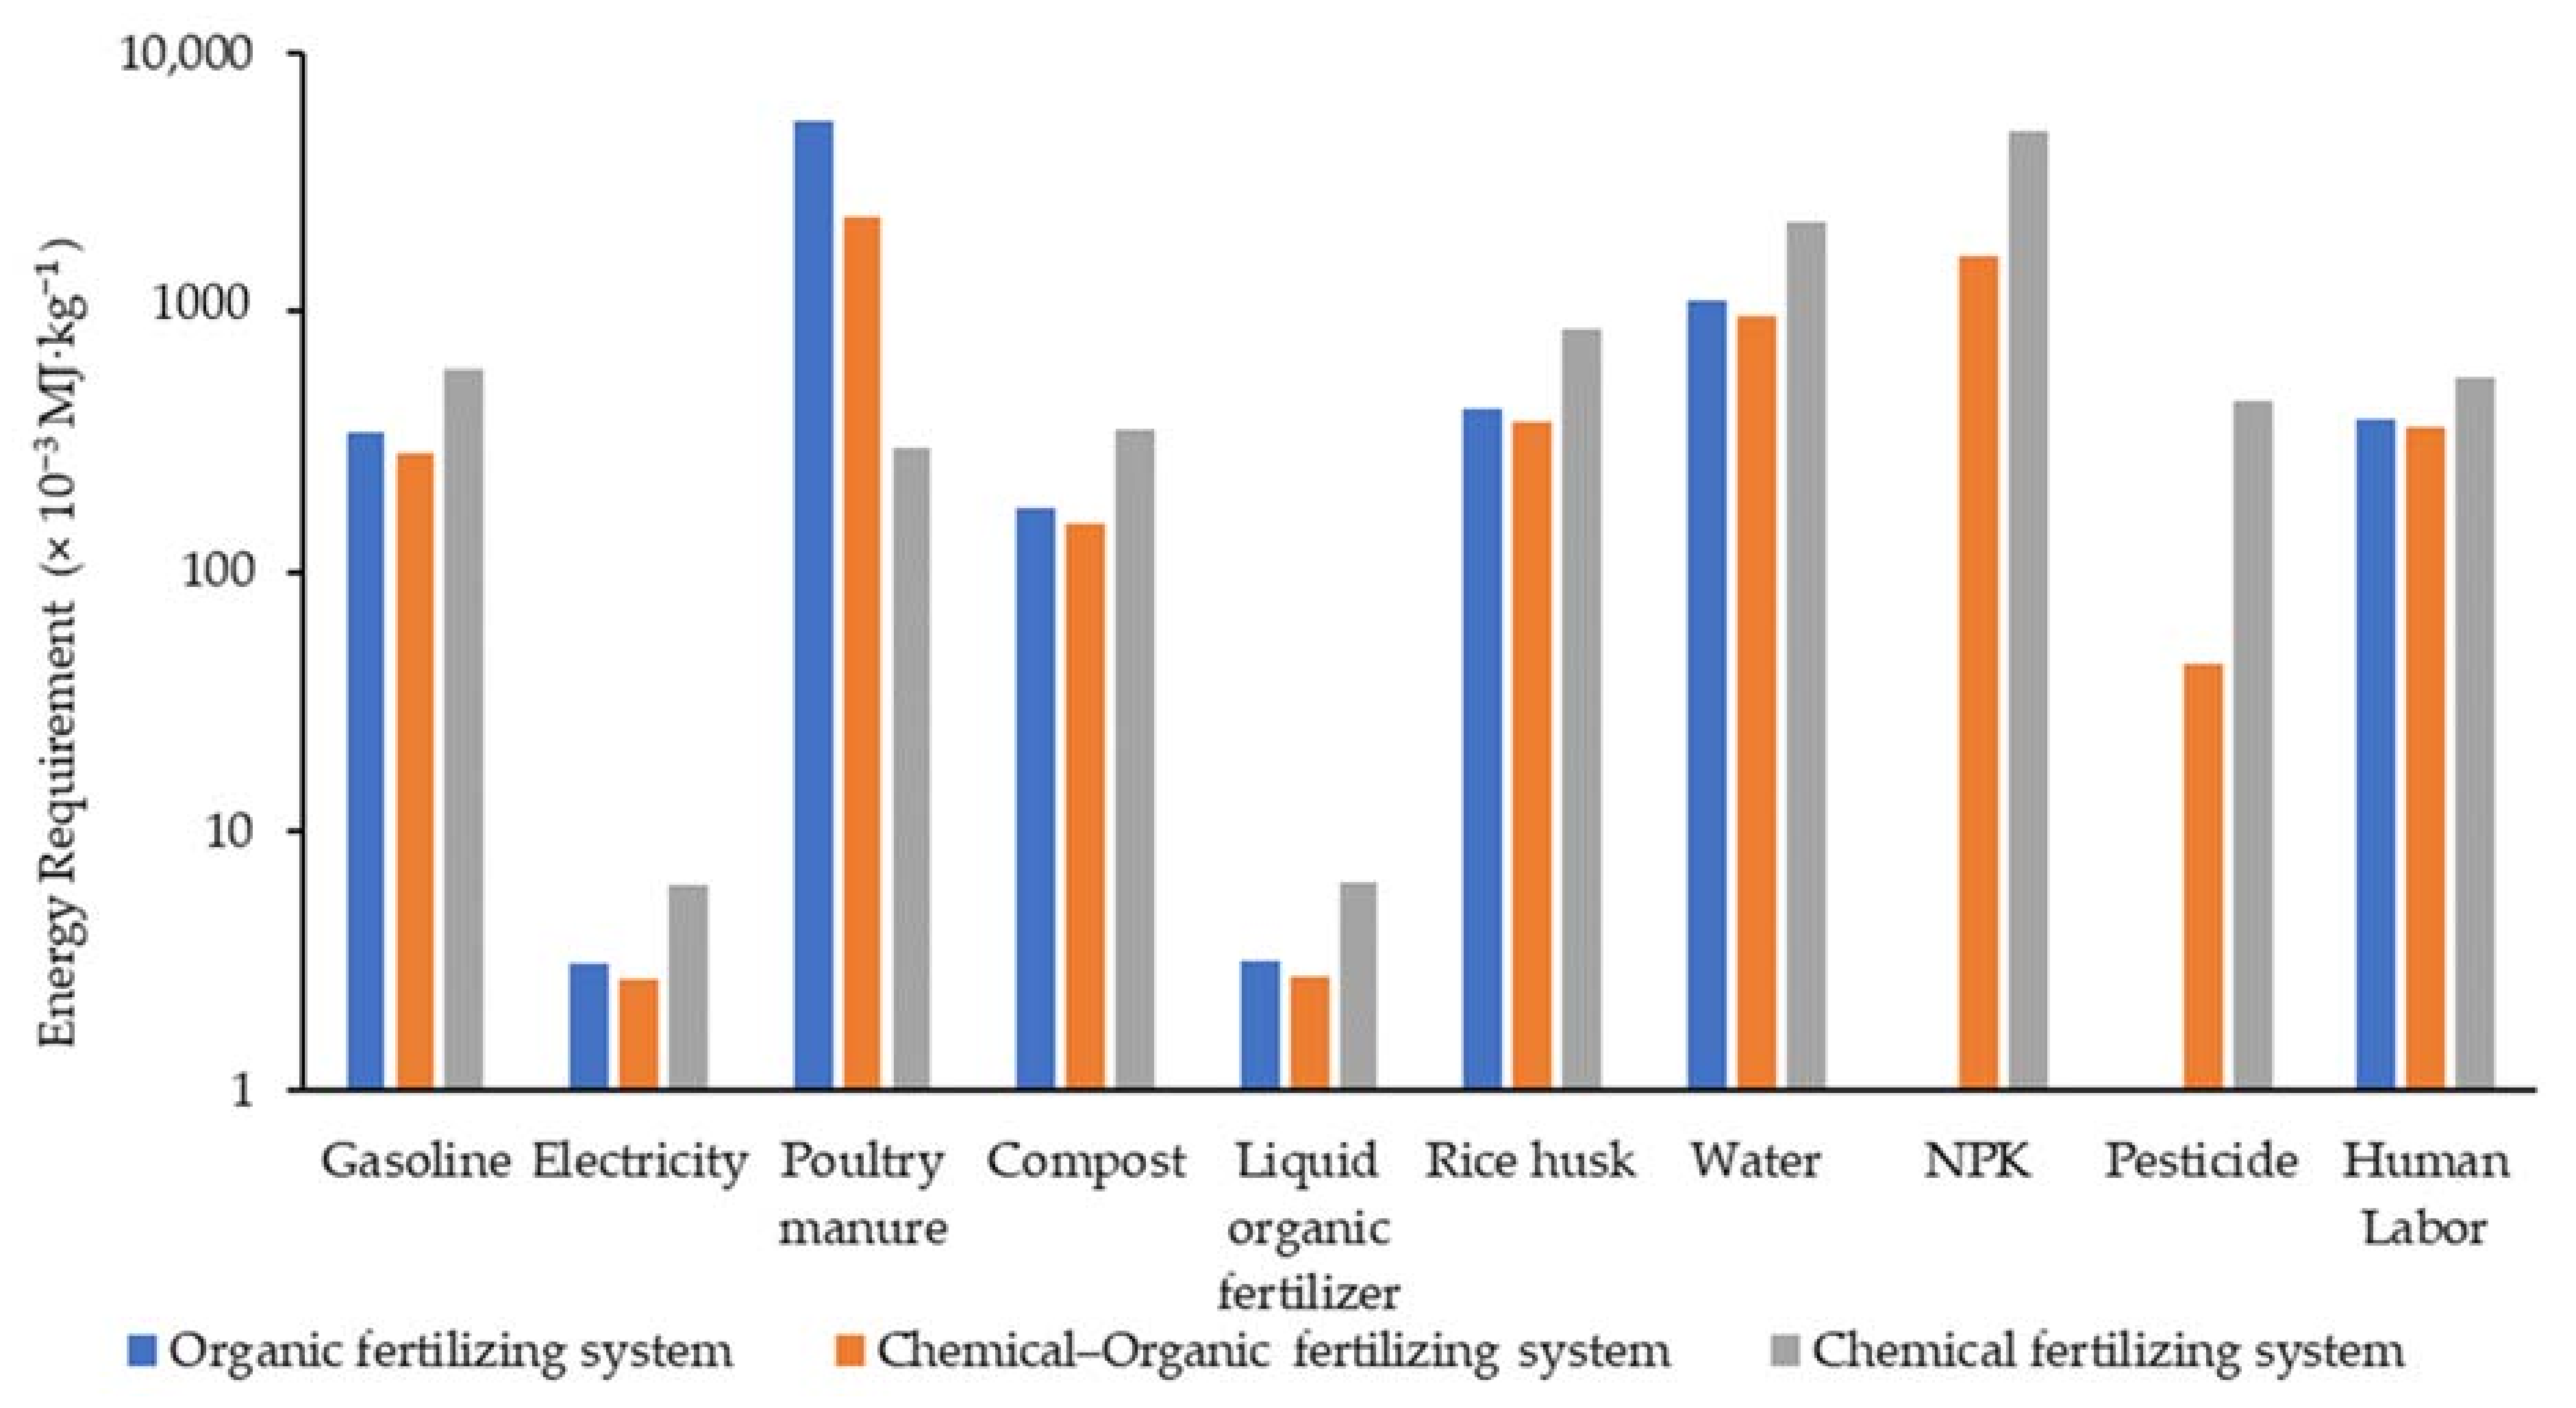
3.1. Energy Requirement Analysis

The total energy requirement for managing 1 ha of coffee plantations was dominated by OFS, followed by COFS and CFS. The total energy consumption values in OFS, COFS, and CFS are 344.31 × 10³, 304.51 × 10³, and 222.34 × 10³ MJ ha−1, respectively (Table 4). The fertilizer usage requires the highest energy, wherein manure consumes the highest energy in the OFS andCOFS, and NPK required the most energy in the CFS. Poultry manure consumed 240.77 × 10³ and 117.48 × 10³ MJ ha−1 in the OFS and COFS, respectively. In comparison, the energy consumption of NPK was 109.92 × 10³ MJ ha−1 in CFS. As presented in Table A18, water was the dominant source of energy consumption after fertilizer use, consuming 48.42 × 10³ MJ ha−1 in all the fertilizing systems. Regarding the energy requirement for labor, managing 1 ha of coffee plantations with the COFS requires the highest human labor energy at 18.15 × 10³ MJ ha−1. In contrast, the OFS requires lower energy for labor, at 17.23 × 10³ MJ ha−1. According to Table 4, the highest energy for labor is required for the harvesting activity, which is dominant in the COFS at 9.8 × 10³ MJ ha−1. Regarding the hotspot of energy requirements per stage of the coffee plantation as presented in Table A19, maintenance 2 was the dominant energy source in all coffee fertilizing systems. It consumed 185.92 × 10³, 149.76 × 10³, and 94.97 × 10³ MJ ha−1 in the OFS, COFS, and CFS, respectively. The following table presents the energy requirement for managing a 1 ha coffee plantation.
Figure 4 indicates that energy consumption for 1 kg of coffee is dominated by fertilizer application in all fertilizing systems. Specifically, manure consumed the highest energy in the OFS and COFS. In contrast, NPK predominantly used the energy in the CFS. According to Table A1, energy inputs for 1 kg of coffee cherry bean production in the CFS, OFS, and COFS were 10.35, 7.92, and 6.19 MJ kg−1, respectively. The highest energy consumption was identified in all CFS inputs. In fertilizers, poultry manure is the highest contributor to energy consumption in the OFS and COFS. The manure application required 5.47 and 3.35 MJ kg−1 in the OFS and COFS, respectively. In comparison, NPK dominantly consumed energy in the CFS which consumed 4.996 MJ kg−1. The second-largest contributor to energy consumption was water, which consumed 1.10, 0.97, and 2.20 MJ kg−1 in the OFS, COFS, and CFS, respectively. The domination of energy from fertilizer usage in coffee cherry bean production is similar to the other study in which fertilizer dominated energy consumption in all coffee plantations [32,52]. The water application on managing of 1 ha coffee plantation is at the same level in all fertilizing systems. The differences in energy use related to the water consumption on 1 kg of coffee cherry beans production are caused by the different productivities of each coffee fertilizing system. The following figure presents the energy requirement for 1 kg coffee cherry bean production.
In developing countries, agricultural production is still predominantly conducted by human labor. Therefore, it is essential to calculate the energy requirement for labor. As presented in Table A1, 1 kg of coffee cherry bean production required about 0.39, 0.36, and 0.57 MJ kg−1 in the OFS, COFS, and CFS, respectively. According to Table A3, Table A4 and Table A5, harvesting and maintenance activities are the most significant contributors to labor energy. In particular, clearing activities required higher energy than the other maintenance activities in the OFS. Simultaneously, fertilizing activity consumed the highest energy in the COFS. Although the OFS has more clearing activities, it has no significant effect on labor energy consumption because harvesting still dominates the energy consumption. The high energy required for labor indicates that the coffee production system is still conventionally conducted by human labor rather than by machinery. Electricity has the lowest energy requirement. The electricity consumption is on the watering activity. Electricity only contributed 0.038, 0.043, and 0.059% to the total energy requirements in OFS, COFS, and CFS, respectively.

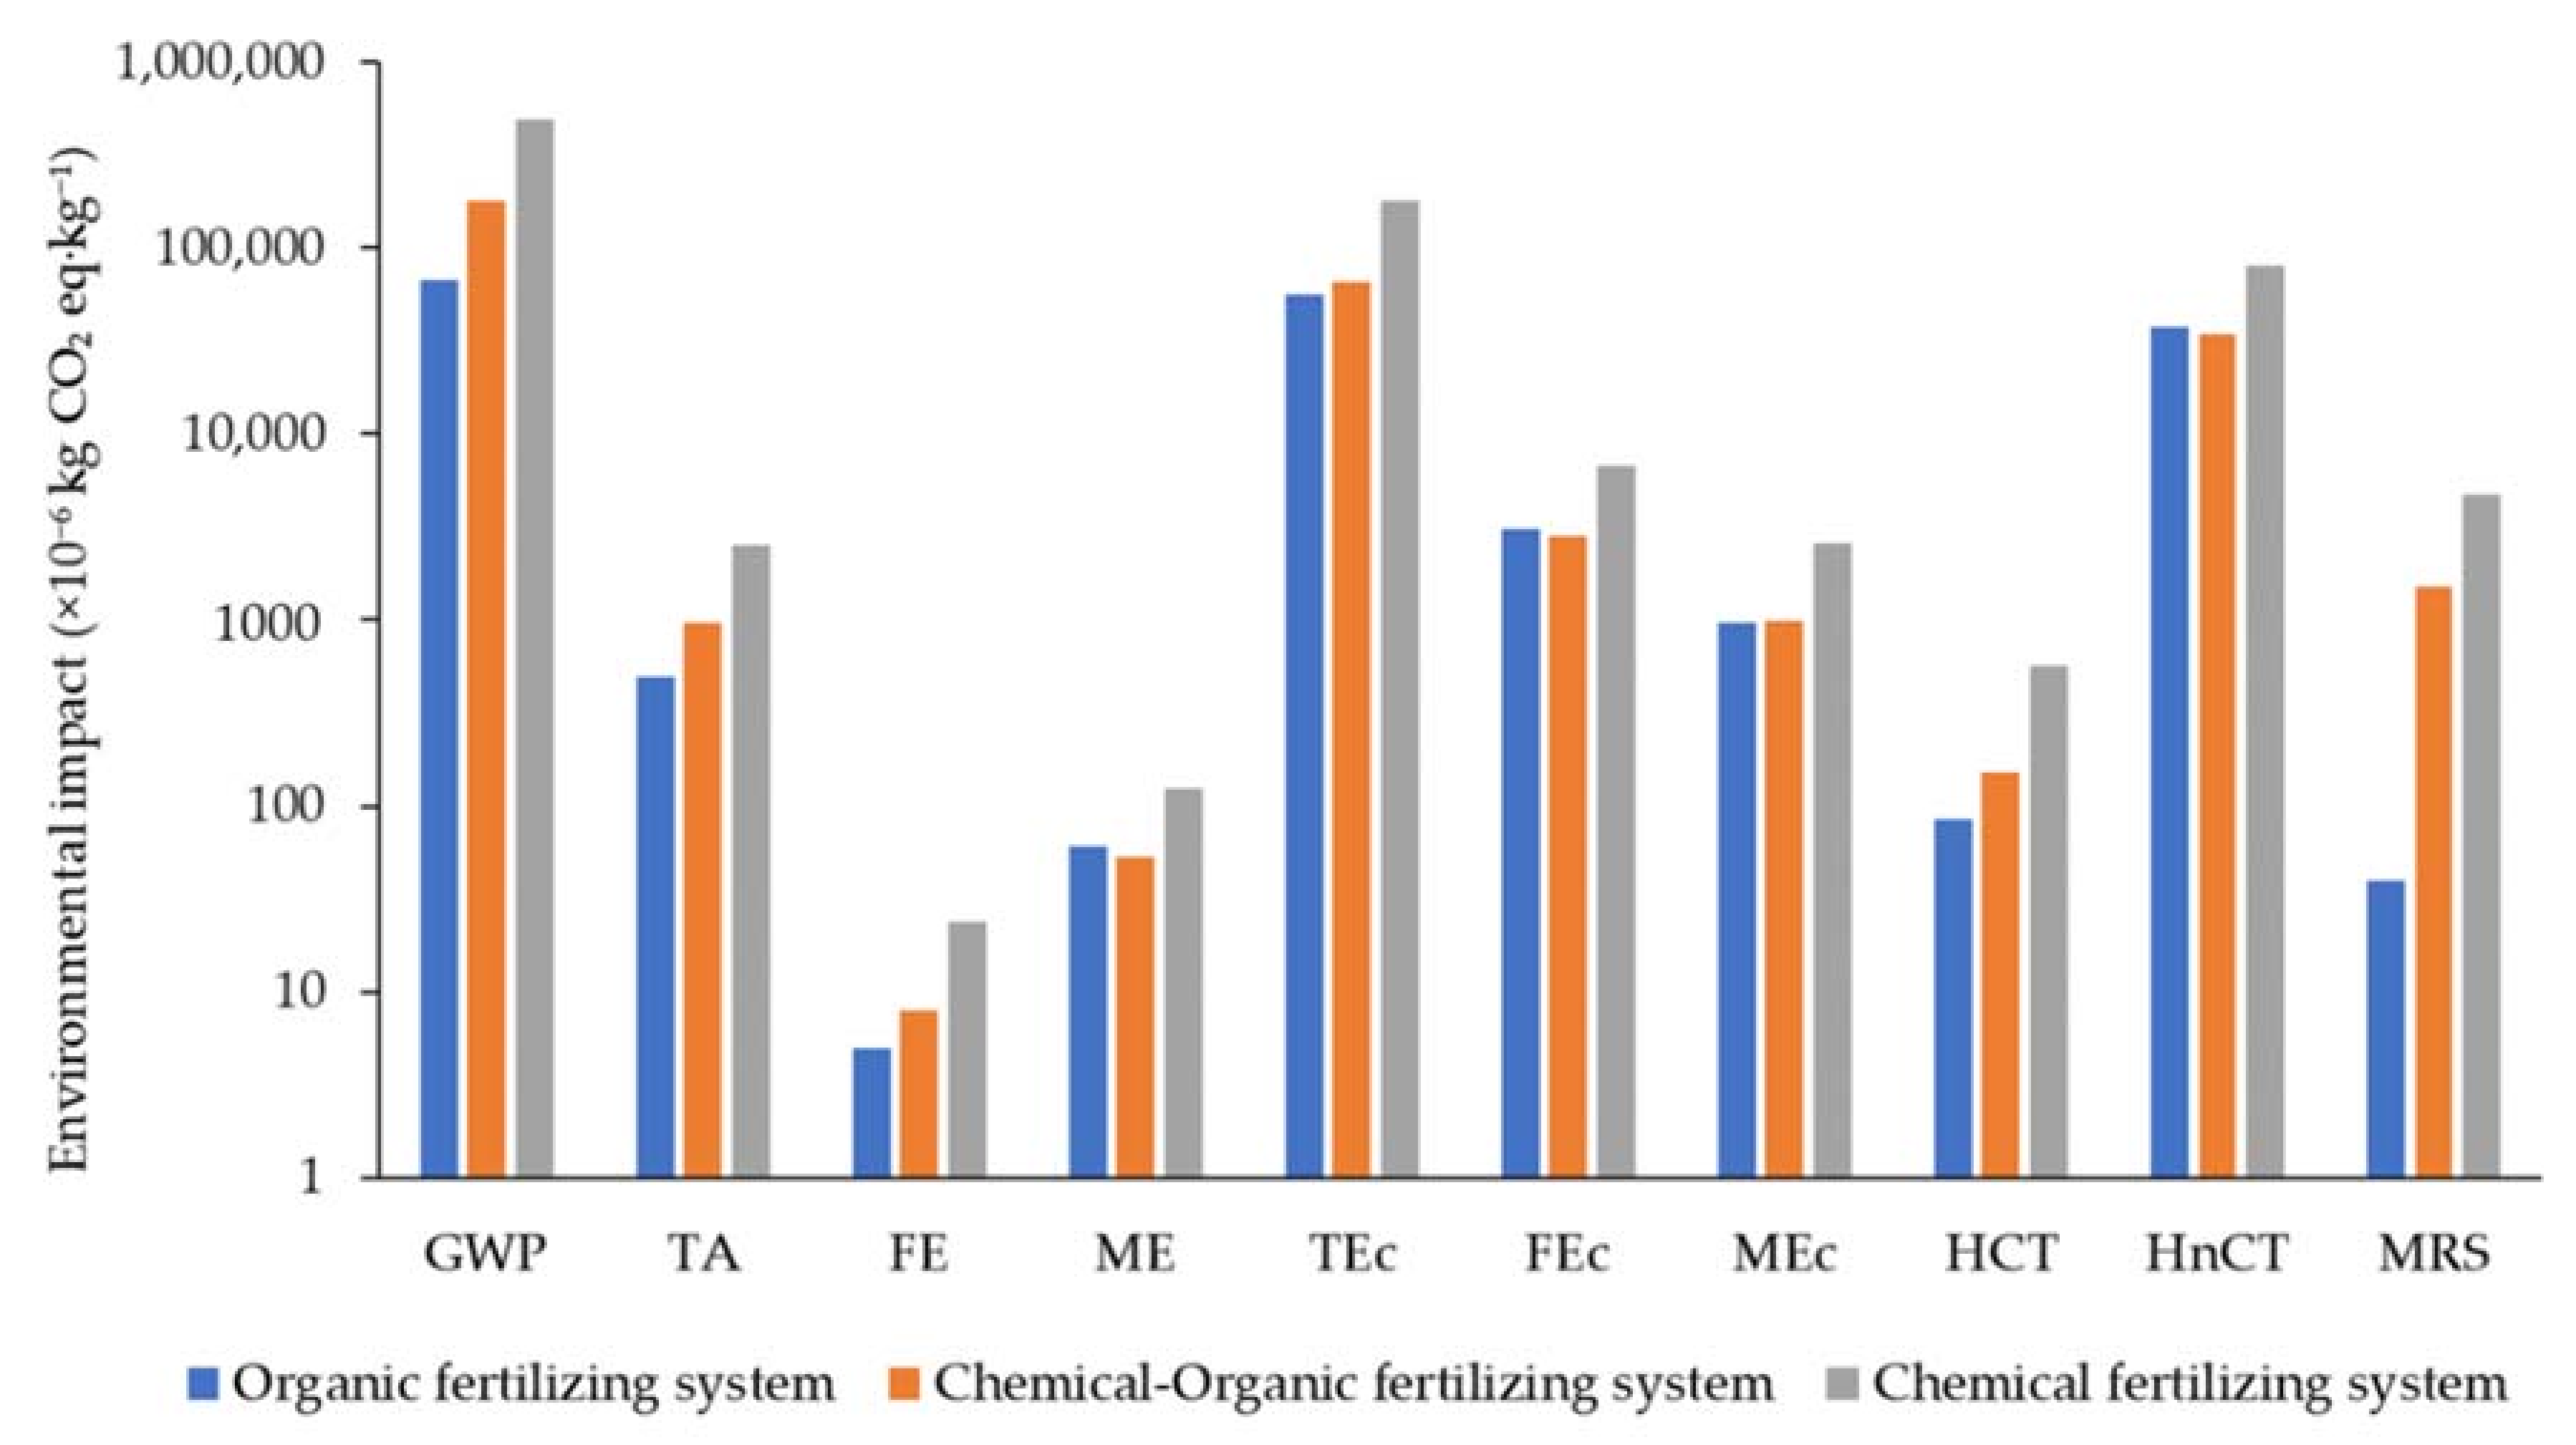
3.2. Environmental Impact Assessment and Its Contributing Factors

3.2.1. Environmental Impact

Figure 5 presents the environmental impact of 1 kg of coffee cherry bean production.
Figure 5 indicates that OFS has the lowest environmental impact in all impact categories compared to the CFS. The OFS presented the lowest impacts on the eight environmental impact categories GWP, TA, FE, TEc, MEc, HCT, MRS, and FRS compared to COFS. Simultaneously, COFS had the lowest impact in the three environmental impact categories: ME, FEc, and HnCT. In contrast, the CFS had the highest environmental impact in all impact categories. The detailed information on the environmental impact of 1 kg of coffee cherry bean production is presented in Table A2. According to Table A2, OFS is more environmentally friendly as indicated by the lowest impact, such as in GWP that emitted 0.0678 kg CO2 eq kg−1, and compared to COFS and CFS, which have a GWP impact of about 0.182 and 0.496 kg CO2 eq kg−1, respectively. Comparing OFS with COFS, seven other environmental indicators were dominant in the OFS: TA, FE, TEc, MEc, HCT, FRS, and MRS. In contrast, CFS has the highest environmental impact. Thus, shifting the COFS or CFS to the OFS system significantly reduces the environmental impact, as presented in Table A12.
The other study also presented a similar result related to environmental impacts in coffee production as presented by the following table.
According to Table 5, organic coffee plantations has the lowest environmental impact compared with chemical-organic or conventional cultivation in Indonesia and previous research in other countries [14,52]. In previous research, the impact on GWP for organic was at 0.12–0.52 kg CO2 eq kg−1 and 0.27 kg CO2 eq kg−1, while organic fertilizing system (OFS) in Indonesia has an impact at 0.068 kg CO2 eq kg−1. The lower GWP in Indonesia can potentially be affected by the boundary system that calculates all life cycle coffee production at the farm level from seeding until replanting. The higher productivity in the intensive coffee management system in this study also mainly impacted the lower GWP per kg product compared others. In this study, the farmer applied the intensive coffee cultivation management system with higher production. In the conventional system, Coffee Indonesia also has a lower environmental impact than others. A study also reported that most of the coffee farmers in Indonesia applied the lower chemical fertilizer as suggested [20]. The other study also presented a similar result related to environmental impacts in coffee production as presented by the following table.

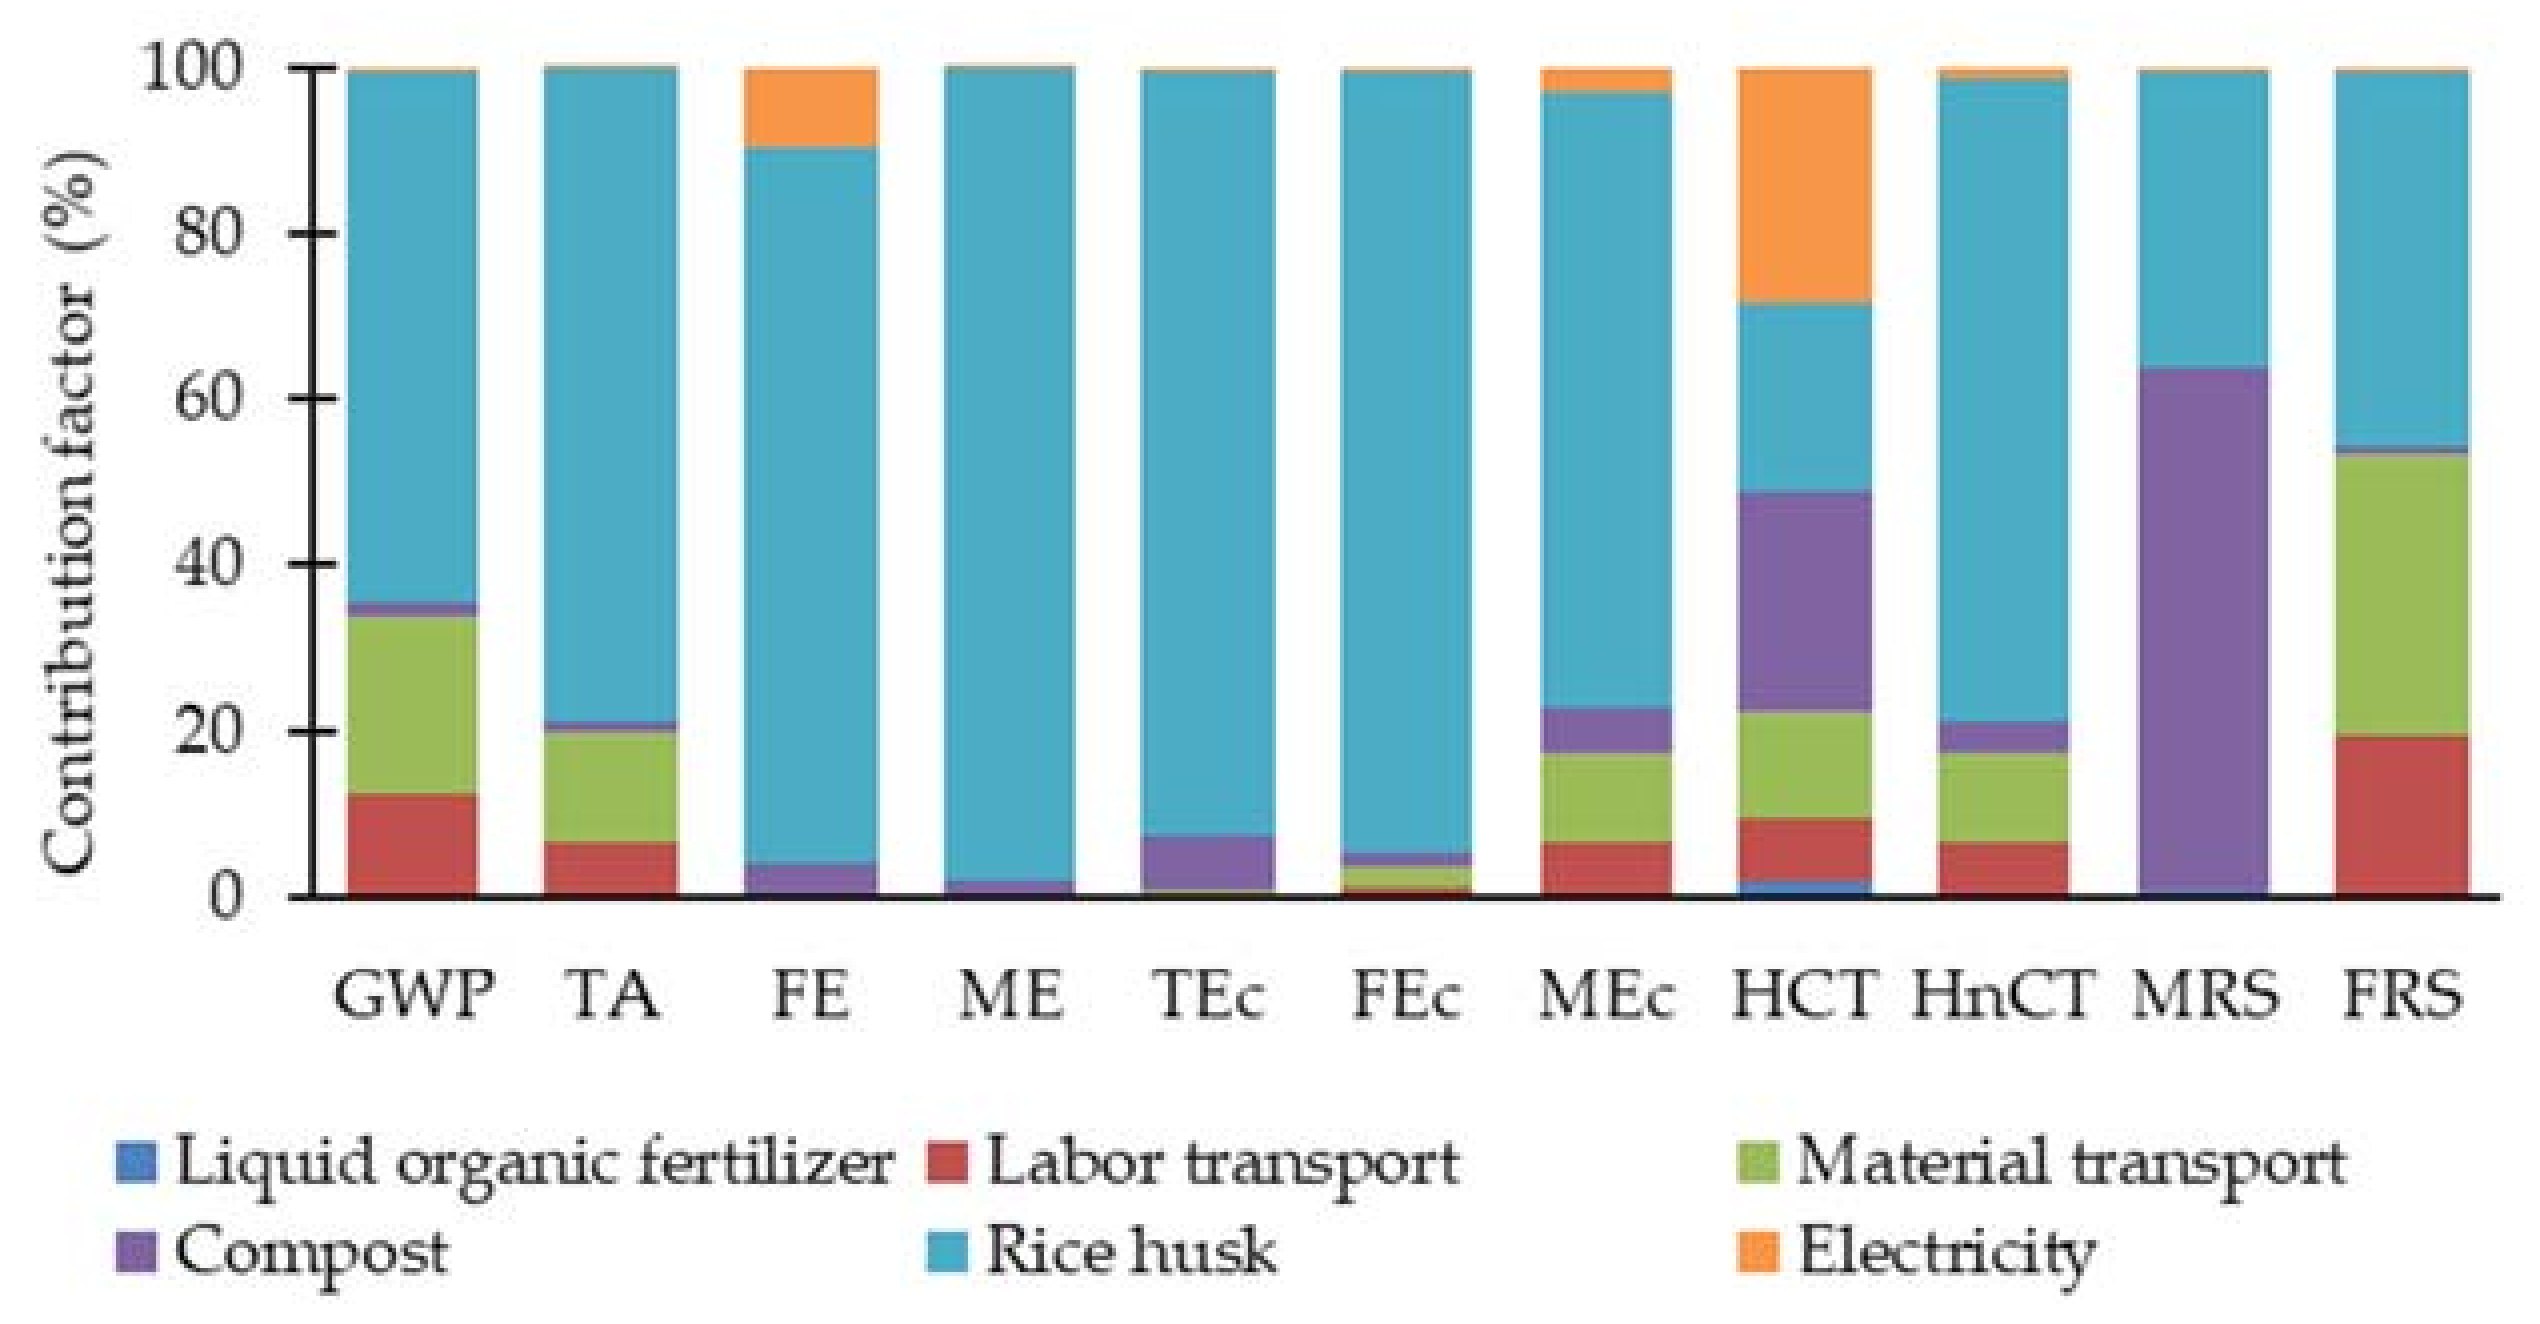
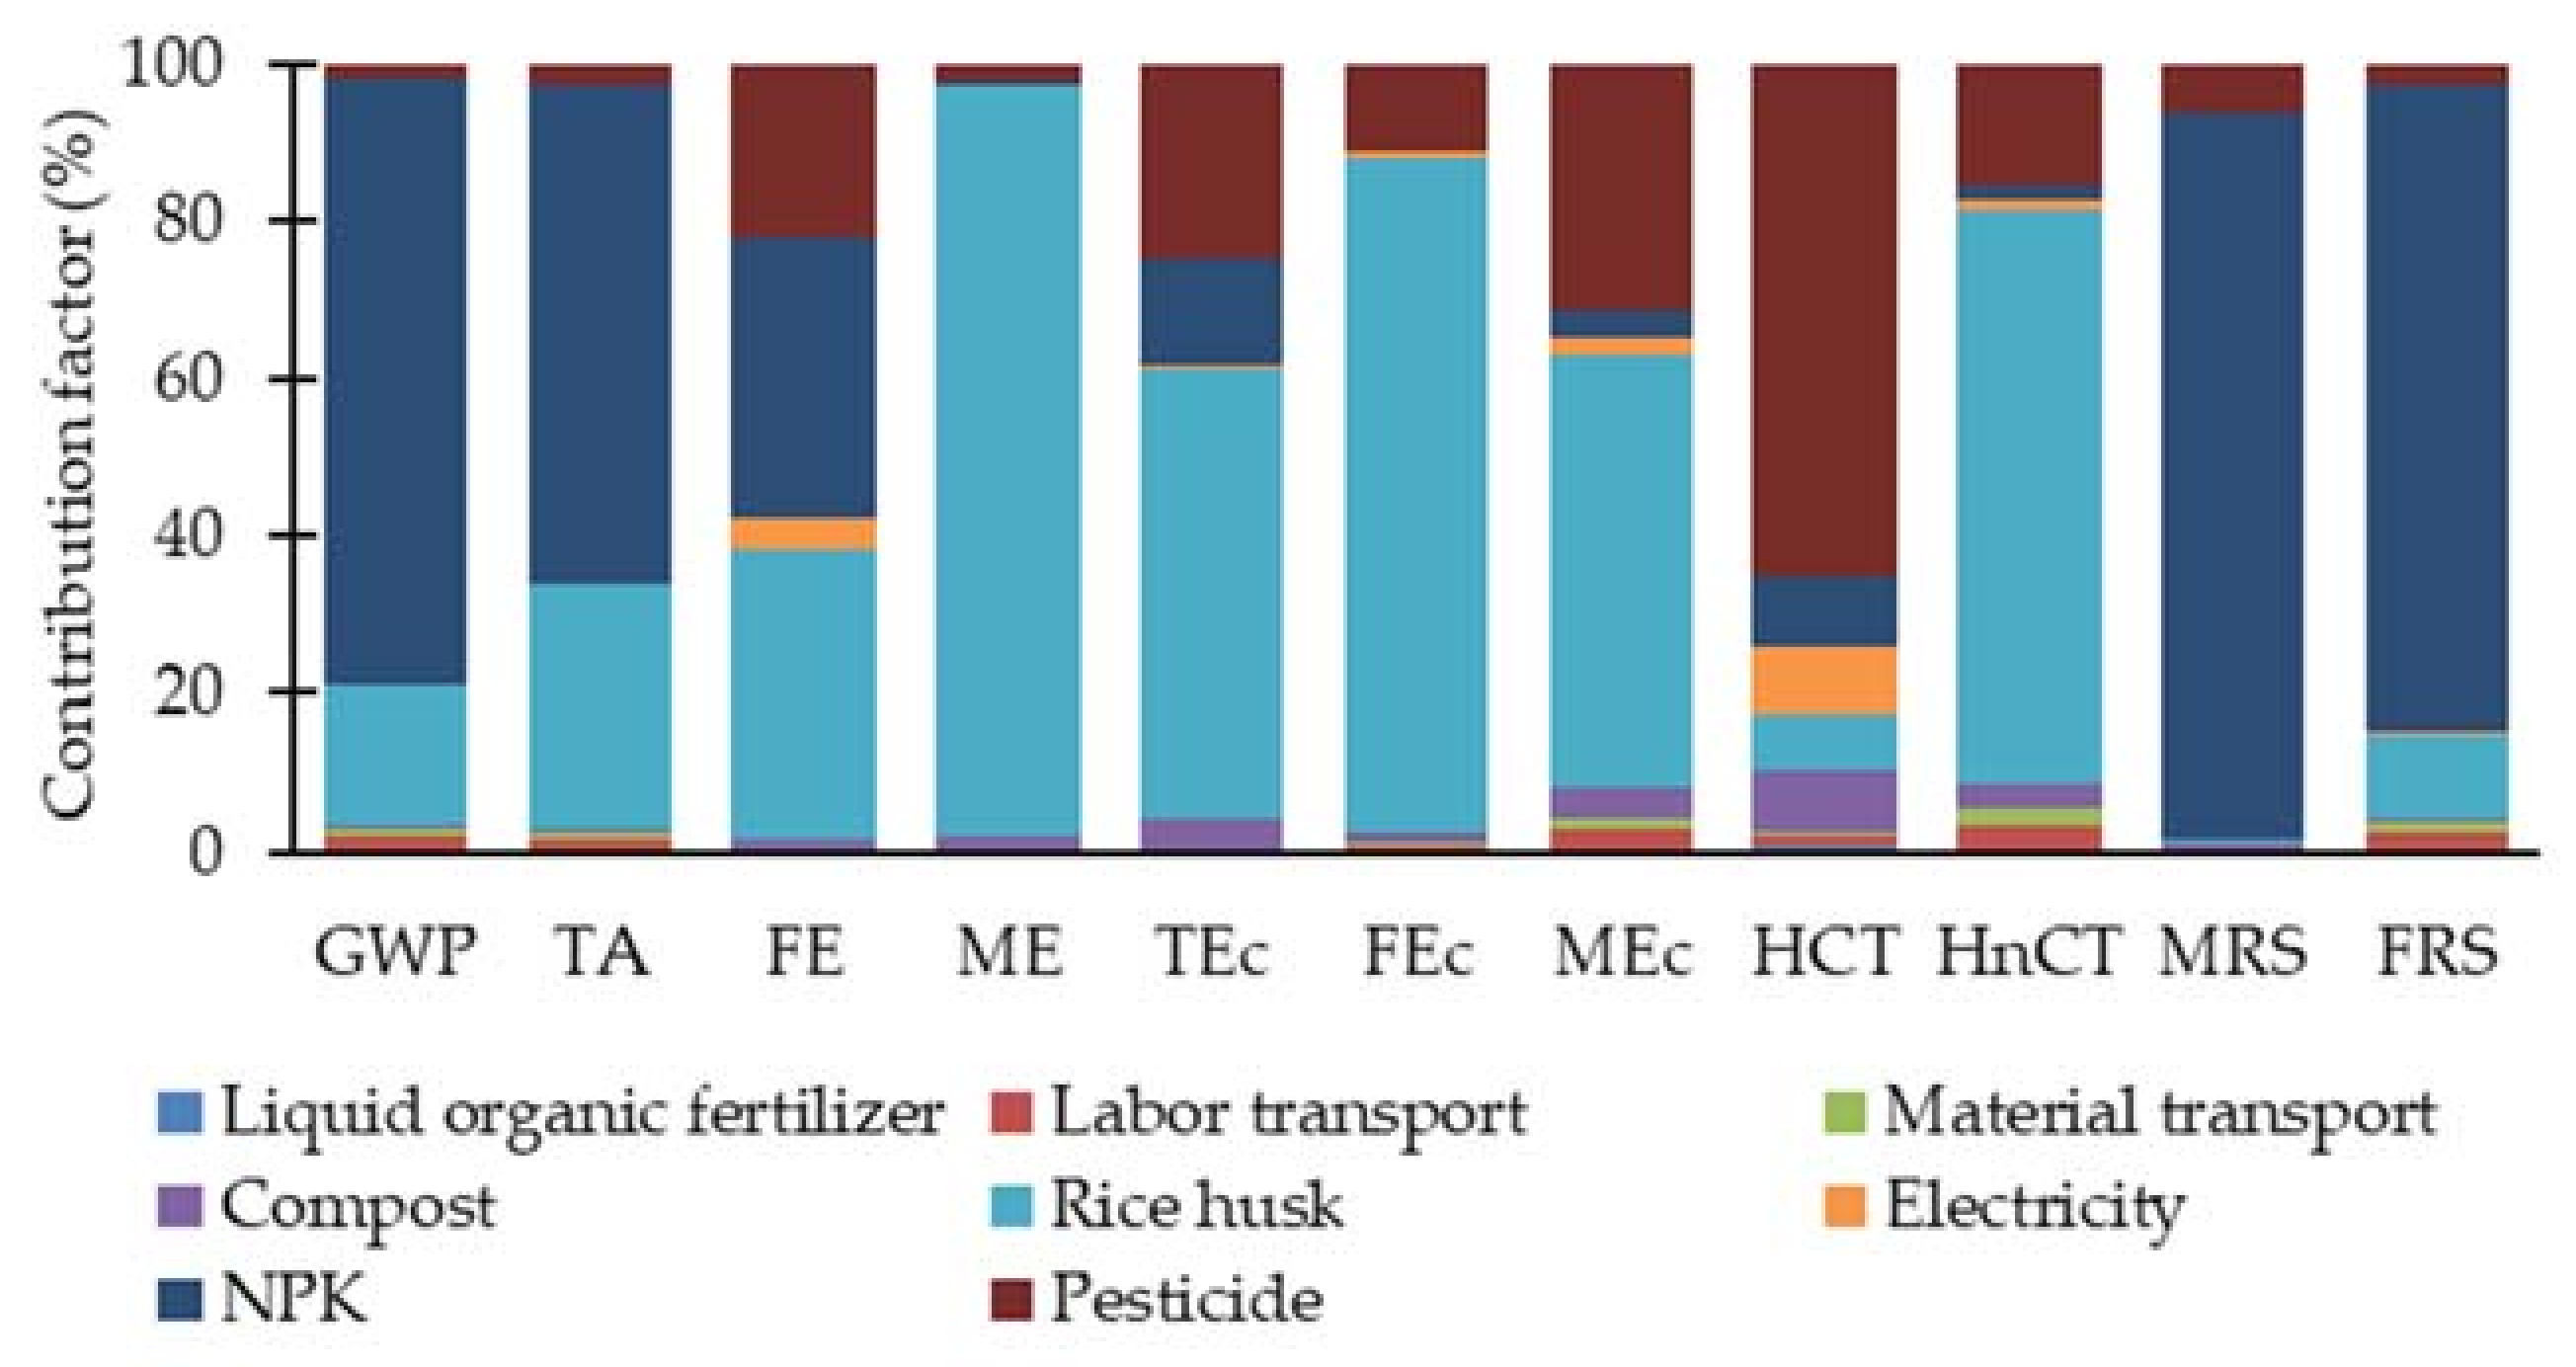
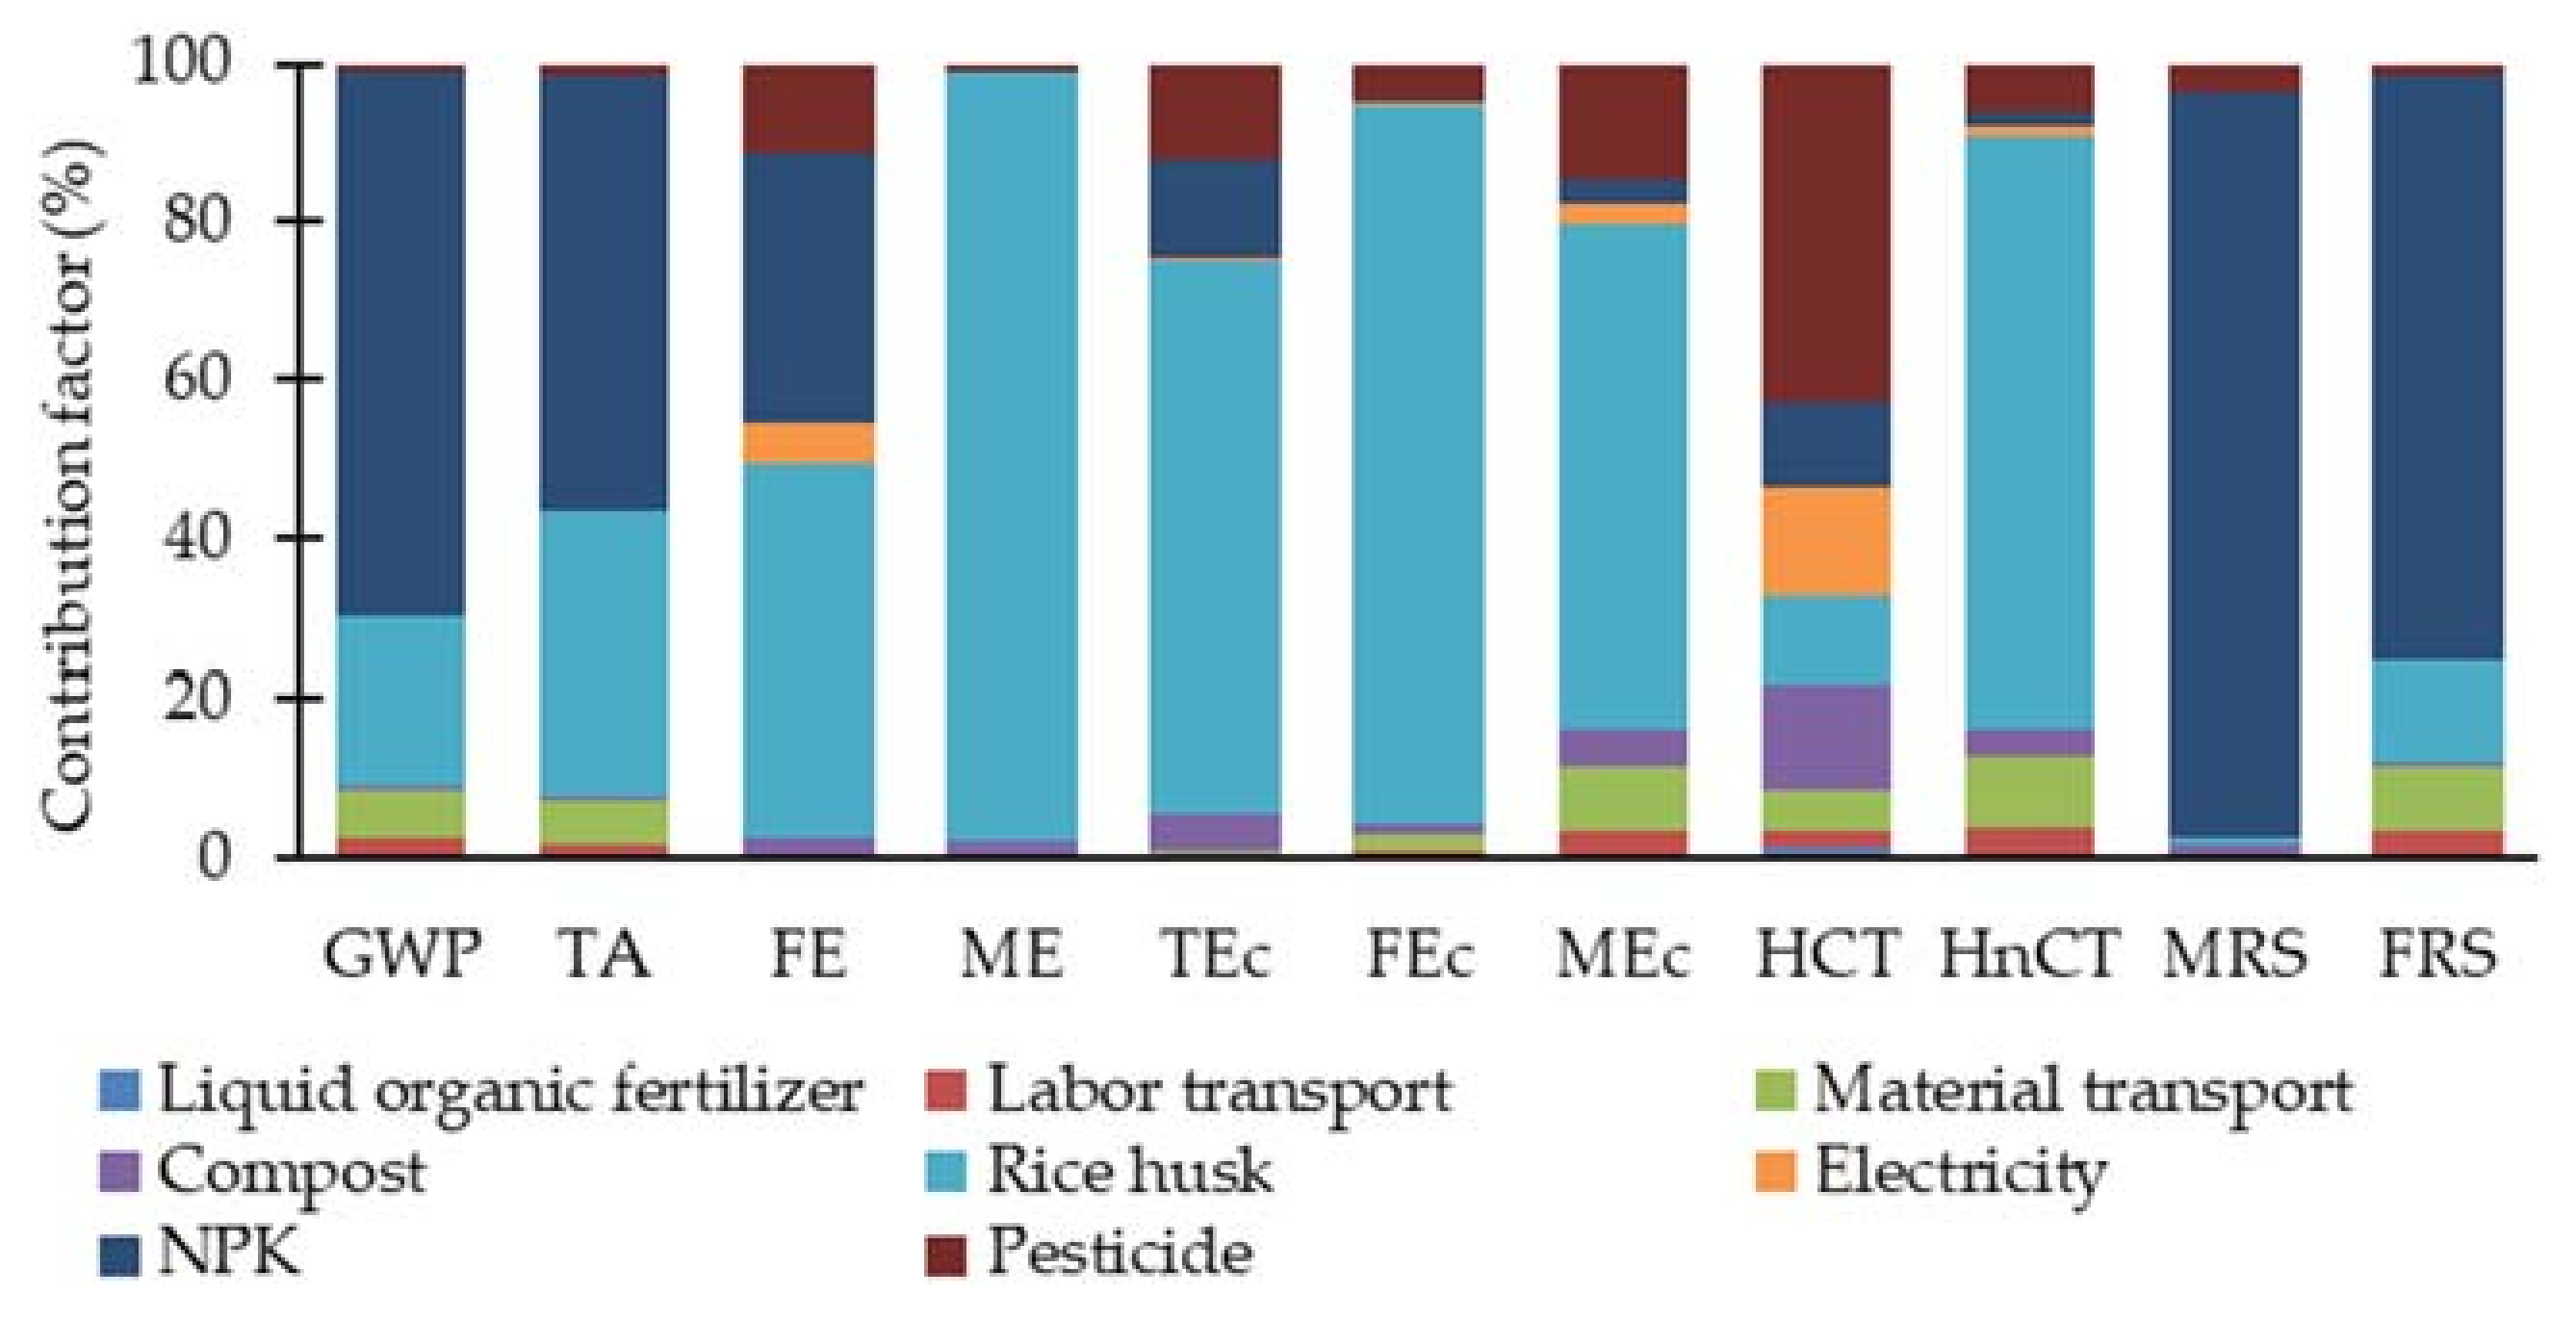
3.2.2. Contribution Factor of Environmental Impact

As presented in Figure 6, rice husk is dominantly contributed to GWP, TA, FE, ME, TEc, FEc, MEc, HTC, and FRS. The second-largest contributor to environmental damage in the OFS is gasoline, which is used for transporting materials and labor to the field. In poultry manure application, its effect on the GWP, TA, FE, ME, TEc, FEc, MEc, HTC, HnCT, FRS, and MRS was not noticeable, even though was dominantly contributed to energy consumption. In the COFS and CFS (Figure 7 and Figure 8), the use of NPK had the most significant environmental impact. The application of NPK in the COFS and CFS contributed significantly to the GWP, TA, MRS, and FRS. A similar result also presented the domination of chemical fertilizer that contributed to the environmental impact [14,52]. For comparison, the highest contributors to TEc, MEc, FEc, and HnCT were rice husk. Simultaneously, compost contributed significantly to the FE and ME. Pesticides are primarily responsible for human carcinogenic toxicity. This result indicates that the massive NPK application in COFS and CFS significantly contributes to air, land, and resource scarcity. Simultaneously, rice husk significantly deteriorates water and contributes to ecotoxicity. At the same time, pesticides are the biggest contributing factor affecting human health. The following figure shows the detailed contribution factors of 1 kg coffee cherry bean production.

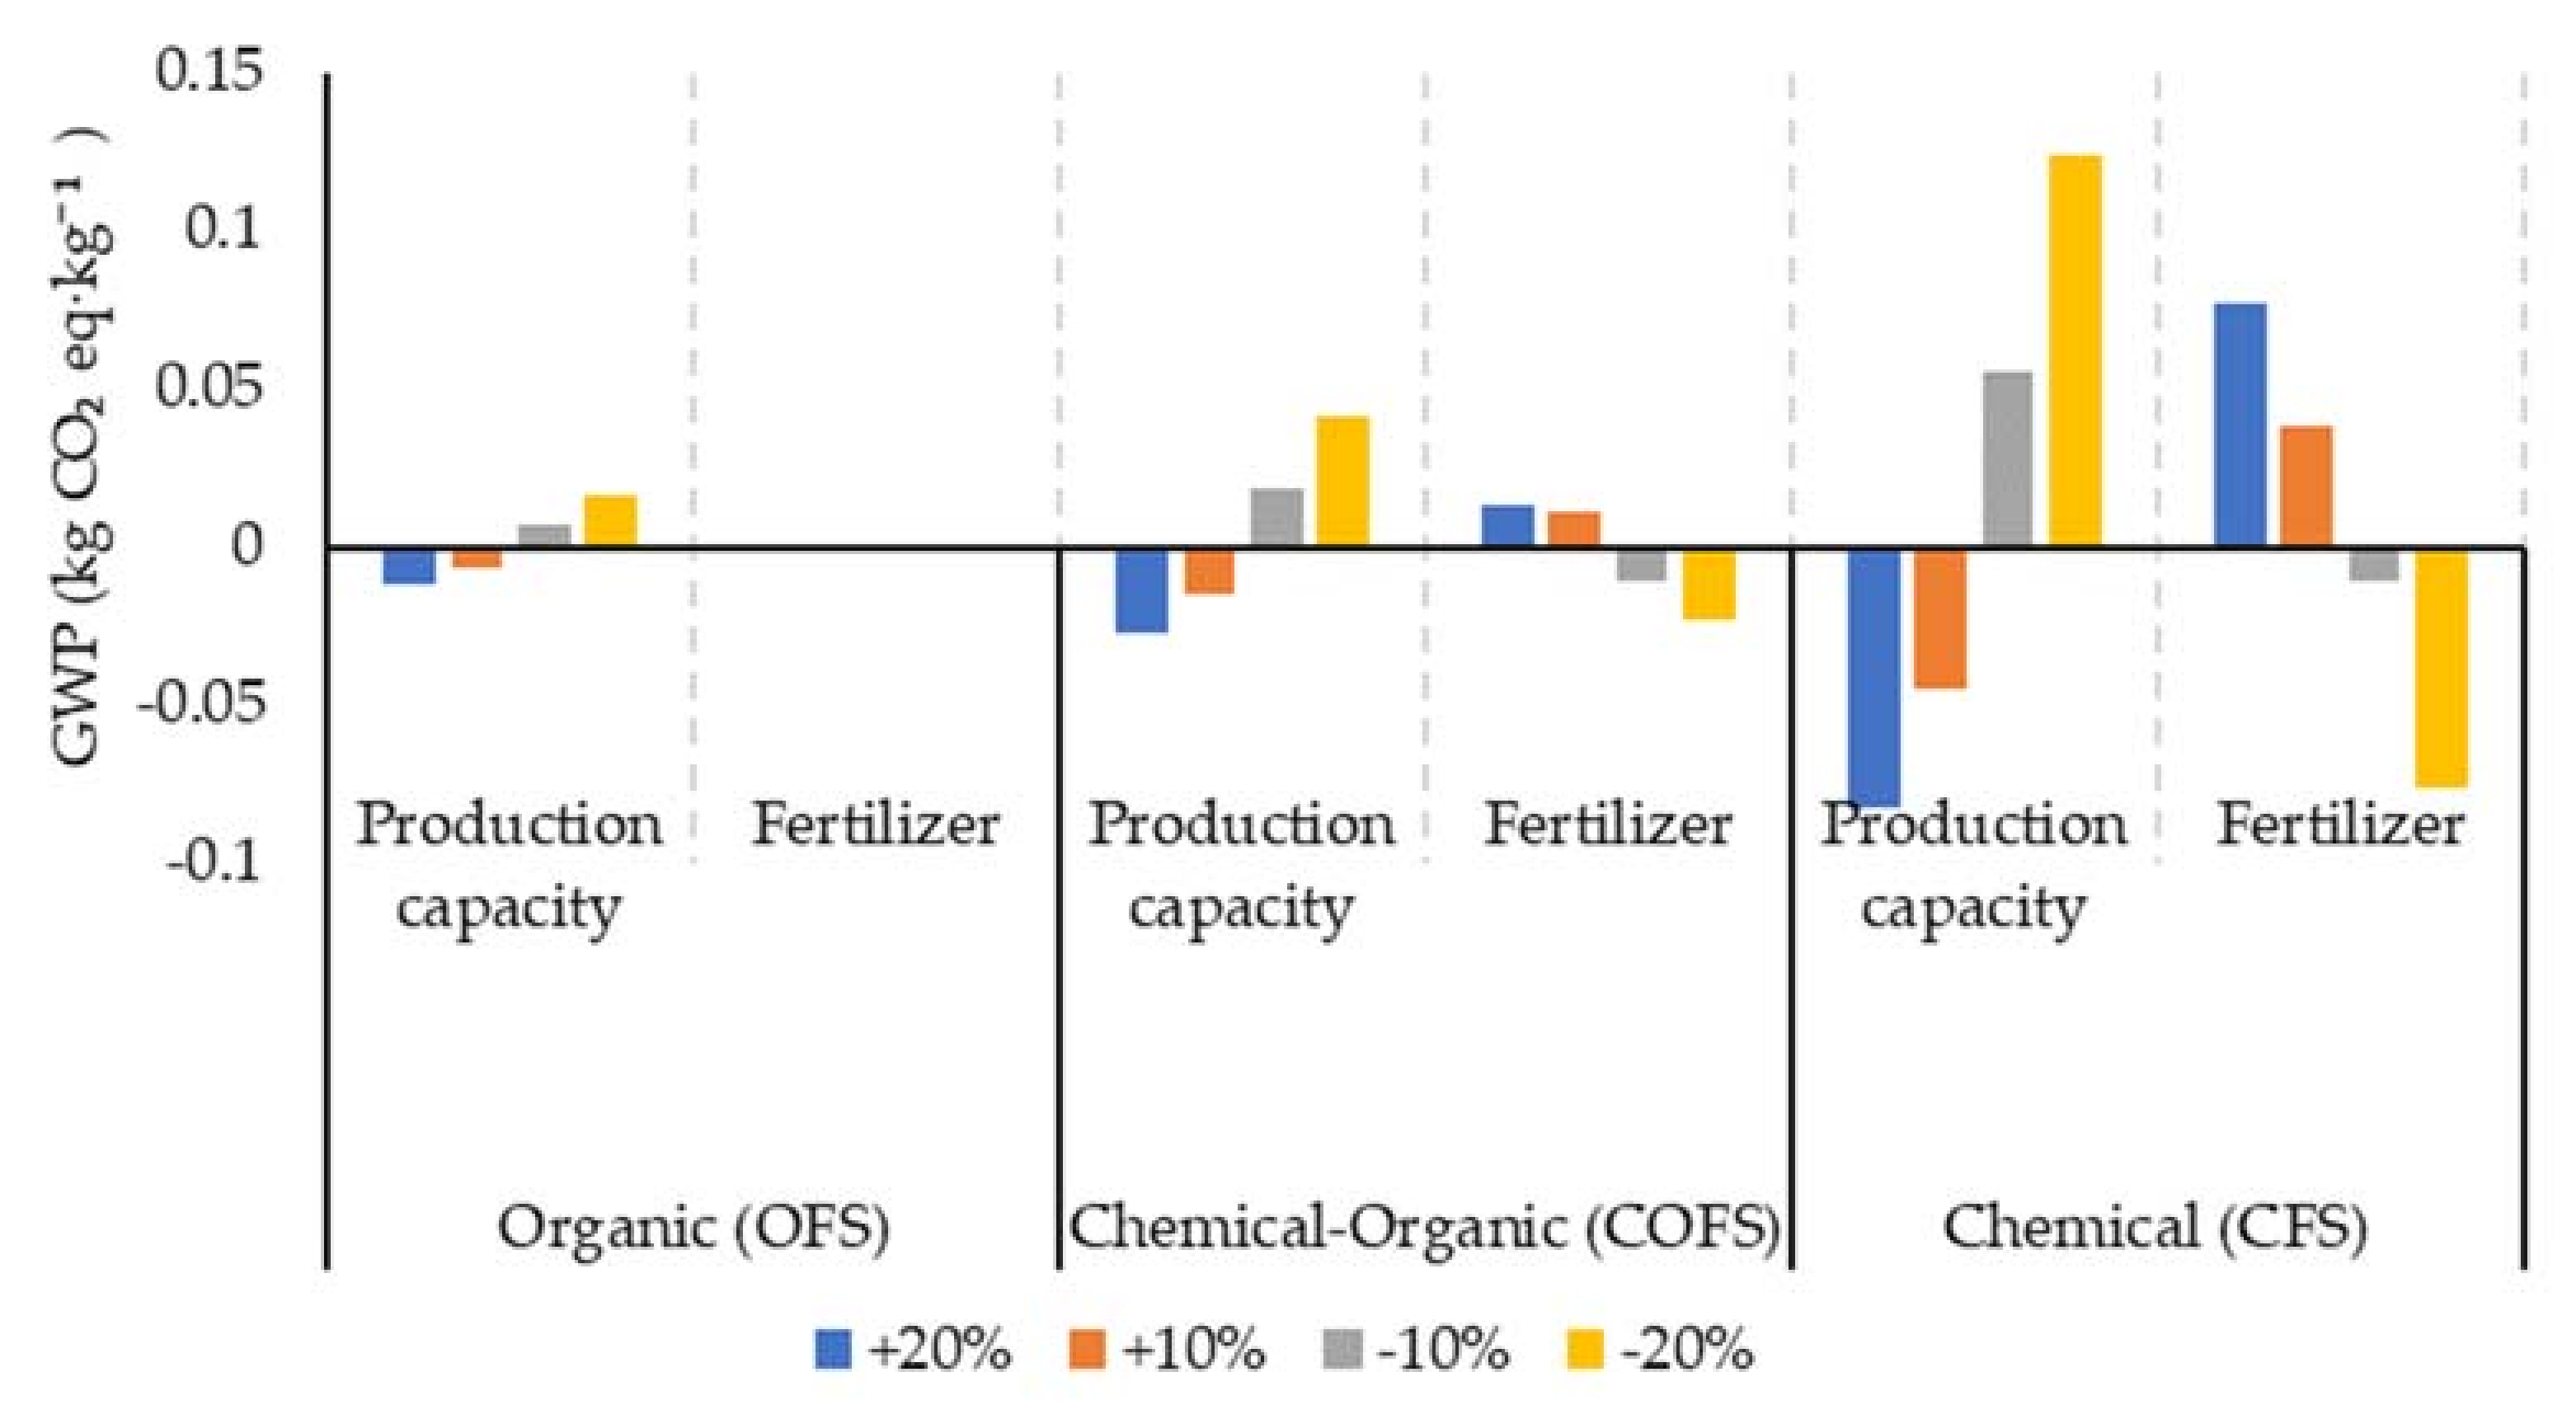
3.2.3. Sensitivity Analysis of Environmental Impact

Figuring the uncertainty on assessing the environmental impact in LCA, the sensitivity analysis is suggested. This method involves calculating different scenarios to analyze the influence of input parameters on either LCIA output result [53]. The present study also performed the environmental impact sensitivity analysis following two variable changes: the change in production capacity and fertilizer use.
As presented in Figure 9, the fertilizer input-level change scenario significantly impacts GWP on COFS and CFS. In contrast, it has no GWP impact on OFS since OFS avoided chemical fertilizer. This result indicated that the chemical fertilizer is the hotspot to the GWP. According to system-based fertilization, the change of GWP due to the change of fertilizer input level in CFS is more significant than in COFS. This result indicated that the level of fertilizer used is sensitive to the GWP impact. The higher the chemical input impacted the higher GWP, and conversely. The impact of scenario changes to GWP was identified as presented by the following figure.
This study also conducted the environmental sensitivity analysis related to production capacity change. In this scenario, the GWP change due to the change of production level in CFS dominates while the GWP impact in OFS is the lowest. This result indicated that CFS and COFS are vulnerable to the change input and output aspects. Overall, the linear result has been shown following the level change of production and fertilizer used. In this case, it was indicated that the environmental impact result follows the linear trend impact when the uncertainty has occurred in production and fertilizer application.

3.3. Life Cycle Cost Analysis

Table 6 presents the LCC analysis. Overall, OFS generates superior performance in the economic aspect, as indicated by the highest value in revenue and net profit as presented by the following figure:
According to Table 6, the result highlights that the highest production cost per hectare coffee plantation is required by COFS with total expenses of 9084 USD ha−1. For comparison, the OFS and CFS required 8936 and 6176 USD ha−1, respectively. The different results showed in production cost per 1 kg coffee cherry bean production, which is the highest required by the CFS. The highest cost in CFS is caused by its lowest productivity. More detail in production cost, the highest cost was required for human labor in all fertilizing systems. Specifically, human labor for harvesting primarily contributed to the cost. This result indicates that human labor cost is a hotspot regarding economic expenditure (Table A3, Table A4 and Table A5 and Table A13 and Table A14).
The OFS had the lowest emission cost with a significant margin compared to the other fertilizing systems in terms of emission cost. Therefore, applying the OFS to the COFS will reduce the emission cost by approximately 0.0011 USD kg−1 (62.63%), and shifting the CFS to the OFS can potentially reduce the production cost by 0.0042 USD kg−1 (86.29%). OFS is also dominantly providing the highest revenue and net profit performance. The results revealed that although the OFS generates a lower production capacity than the COFS, the OFS provides the highest profit for the farmer due to the higher selling price and lower production cost compared with the other systems. For example, a farmer earned 21,571 USD after managing a 1 ha coffee plantation as well as 0.49 USD earned from 1 kg of coffee cherry bean production. For comparison, managing a 1 ha coffee plantation nurtured by the COFS generated 20,330 USD; the CFS provided the lowest profit of 6720 USD ha−1, which is approximately 31.1% of the total profit in a hectare of the OFS. Therefore, according to the net profit result, the OFS is more profitable than the other systems. However, the current situation in farmers, is that the higher productivity resulting from COFS has attracted farmers to manage their plantations by practicing its system. Fortunately, this result finds essential information for other farmers that managing coffee using the intensive OFS will attain a higher economic benefit.

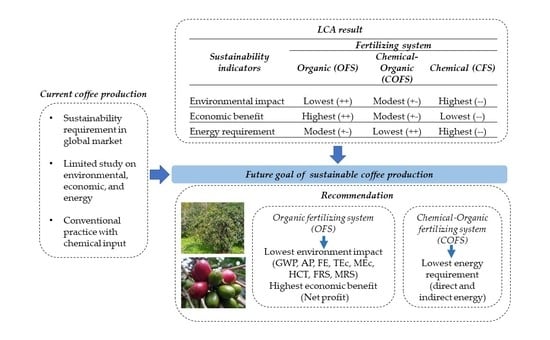
3.4. Sustainability Interpretation

Table 7 presents the three of sustainability assessment: Environmental-Economic-Energy aspect. OFS provided better performance in environmental and economic aspects. The OFS had the lowest environmental impact in eight environmental indicators compared to the CFS. Simultaneously, in economic benefit, 1 kg of organic coffee cherry beans generated the highest net profit at 0.49 USD kg−1. In energy aspect, COFS provided the high performance that consumed the lowest energy compared to OFS and CFS. Even though OFS requires more energy than the COFS, but still less than the CFS. The following table summarizes all the results of the sustainability assessment in this study.
Considering the three aspects of sustainability, OFS provided superior performance in two sustainability aspects as indicated by the lowest environmental impact and the highest economic benefit. Therefore, it indicated that OFS is more environmentally sustainable and economically viable.

4. Discussion

4.1. Energy, Environment, and Economic Hotspots and Its Strategies on Reducing the Negative Impact Factor

Identifying the hotspots in energy, environmental, and economic aspects will provide proper insights and strategies to effectively reduce energy usage, environmental damage, and production expenses. For example, the inputs of fertilizer, water, rice husk, and labor required higher energy during the coffee plantation. In particular, considering the fertilizer input, manure needs the highest energy in the OFS and COFS, whereas the NPK predominantly uses the energy in the CFS. Thus, our results highlight that fertilizer is a hotspot in terms of the energy requirements of the life cycle of coffee plantations. A similar study also revealed the most significant amount of energy contributed by fertilizer at 32–38% [52]. Therefore, Reducing the chemical input and managing the fertilizer can potentially reduce the energy used.
In environmental impact results, NPK most contributed to the environmental damage in COFS and CFS. At the same time, rice husk contributes significantly to the environmental impact in the OFS. These findings indicated that chemical fertilizer is the hotspot contributing to the environmental damage during coffee production. A similar study in agriculture commodity also reported that fertilizer mainly contributed to the environmental damage [34,52]. Therefore, some strategies can significantly reduce the environmental impact, such as reducing the NPK application, switching the chemical substances into organic ones, and substituting the rice husk with a more environmentally friendly material.
According to the net profit result, our economic analysis identified that OFS is more profitable than the other systems. In production cost, labor and fertilizer usage were the hotspots of production cost. In particular, approximately 60.7–75.88% of the labor cost is used for the harvesting activity. Manure predominantly accounted for 22.6% and 11.36% of the fertilizer cost in the OFS and COFS, respectively. Simultaneously, NPK accounted for 21.61% of the fertilizer cost in the CFS. Therefore, the following scenarios can predictively reduce the production cost: (1) reducing the labor during harvesting using appropriate technology and tools; and (2) reducing the NPK application in the COFS and CFS, and substituting it with the OFS.

4.2. Future Challenges of the Green Coffee Plantation System

Developing the green industry from the upstream to downstream in the agricultural sector is essential for promoting sustainable agriculture [27]. Thus, the business framework warrants a transformation [22]. To adopt the most environmentally and economically viable approach, coffee production must be evaluated and improved. This study suggests that practicing the OFS should be extended to sustainable coffee production in Indonesia. However, there are several challenges in implementing such green coffee plantation systems. First, most coffee farmers employed conventional practices using a large amount of chemical fertilizer and still depended on labor for all activities [13,20]. Second, most farmers practiced a low-intensity coffee management system. However, only a few farmers practiced intensive coffee plantation systems. Low maintenance in managing the plantations will inevitably result in low productivity. Lower productivity resulted in more serious environmental damage and had lower economic performance per 1 ha of coffee plantation. Third, although this research recommends that the OFS be extensively applied, the higher energy requirements for providing manure are an important challenge. Therefore, research should be conducted to determine the optimum sustainable coffee plantation management system, considering the energy requirement, environmental impact, and economic performance.

5. Conclusions

The comprehensive sustainability evaluation of coffee production systems in Indonesia was conducted considering three sustainability aspects: energy requirement, environmental impact, and economic performance. From the energy perspective, managing 1 kg of coffee cherry bean using CFS is not recommended due to its higher energy requirements. Conversely, COFS and OFS were recommended because of the lower energy consumption. Our results highlight that fertilizer is a hotspot in terms of the energy requirements of the life cycle of coffee plantations. From an environmental perspective, the OFS is recommended for managing coffee plantations. The OFS provides the lowest environmental impact compared to those managed by the COFS and CFS. Due to the lower environmental impact provided by the OFS, the potential reduction of emissions was also a significant result. Chemical fertilizer was identified as the most significant contributing factor to all emissions in the COFS and CFS and followed by the rice husk. Therefore, our result findings that NPK and rice husk are the hotspot contributing to the environmental damage during coffee production. From the economic perspective, managing 1 ha of coffee plantations nurtured by the OFS generated the highest revenue and net profit for farmers compared with those of the COFS and CFS. In terms of energy perspective, the COFS and OFS are recommended due to the lower energy consumption compared to CFS. Considering the environmental impact and economic analysis results, the OFS is recommended due to its lower impact on environmental damage and the highest net profit for farmers. The massive OFS practice will be followed by higher energy consumption. From an energy requirement perspective, COFS can be the second alternative to be applied.
This study result provided a positive implication and valuable information related to managing organic coffee cultivation (OFS) as suggested by this result. As OFS provided more benefit not only for the environmental but also to the higher economic benefit, farmers are becoming more attracted to practicing OFS which represents green coffee cultivation. As the majority of farmers are still applying COFS with a significant level of chemical substances, shifting to the OFS will significantly impact the environmental and economic sustainability of coffee production in Indonesia. Practically, this research contributed a practical method of how to reduce environmental impact through the hotspots in environmental, economic, ad energy impacts that are found in this research. The hotspots of emission, cost, and energy will help farmers reduce the negative impact on environmental, economic, and energy aspects. This research also contributes to the academic purposes of providing scientific literature to fulfill the research gap and limited information related to comprehensive sustainability assessment in Indonesia.

Author Contributions

D.M.R.: Conceptualization, Data curation, Formal analysis, Funding acquisition, Investigation, Methodology, Software, Resources, Validation, Visualization, Writing—original draft Writing—review & editing; A.S.P.: Formal analysis, Software, Supervision, and Writing—review & editing; R.I.: Supervision, Validation, Visualization, and Writing—review & editing; R.N.: Conceptualization, Methodology, Supervision, and Writing—review & editing; and T.A.: Conceptualization, methodology, Supervision, and Writing—review & editing. All authors have read and agreed to the published version of the manuscript.

Funding

This research received no external funding, but for publication, this manuscript was funded by the Indonesia Endowment Funds for Education (LPDP) as the awardee scholarship scheme facility.

Institutional Review Board Statement

Not applicable.

Informed Consent Statement

Not applicable.

Data Availability Statement

The primary data for inventory is obtained by direct survey and interview the farmer who manages all three coffee plantation systems and managed a small-medium coffee industry and farmer groups in West Bandung Regency, West Java, Indonesia.

Acknowledgments

The authors thank the Indonesia Endowment Funds for Education (LPDP) Scholarship for providing the scholarship to the author during the study at The University of Tsukuba, Japan.

Conflicts of Interest

The authors declare no conflict of interest.

Abbreviations

COFSChemical-Organic fertilizing systemkgKilogram
CFSChemical fertilizing systemLCALife cycle assessment
ddayLCCLife cycle costing
DCBDichlorobenzeneMEMarine eutrophication
EFEnergy factorMEcMarine ecotoxicity
EIEnvironmental impactMRSMineral resource scarcity
FEFreshwater eutrophicationnNumber of input system
FEcFreshwater ecotoxicityOFSOrganic fertilizing system
FRSFossil resource scarcityTATerrestrial acidification
GWPGlobal warming potentialTETerrestrial ecotoxicity
hhourTLCCTotal life cycle cost
HCTHuman carcinogenic toxicityUSDUnited States Dollar
HnCTHuman non-carcinogenic toxicityyyear
IDRIndonesia Rupiah

Appendix A

Table A1. Energy requirement for 1 kg coffee cherry bean production.
Input EnergyFertilizing System
Organic (OFS)Chemical-Organic (COFS)Chemical (CFS)
Energy Requirement (MJ kg−1)
Direct energy
Gasoline0.340.290.6
Electricity0.00310.00270.006
Indirect energy
Poultry manure5.472.350.3
Compost0.160.160.35
Liquid organic fertilizer0.0030.0030.006
Rice husk0.430.380.86
Water1.10.972.2
NPK-1.644.97
Pesticide-0.0440.455
Human Labor0.390.360.57
Total7.926.1910.35
Table A2. Environmental impact for 1 kg of coffee cherry bean.
Impact CategoryUnitFertilizing System
Organic (OFS)Chemical-Organic (COFS)Chemical (CFS)
Global warming potential (GWP)kg CO2 eq kg−10.06780.1820.496
Terrestrial acidification (TA)kg SO2 eq kg−10.00050.000960.00254
Freshwater eutrophication (FE)kg P eq kg−10.00000490.0000080.000023
Marine eutrophication (ME)kg N eq kg−10.0000590.0000530.00012
Terrestrial ecotoxicity (TEc)kg 1,4-DCB kg−10.05640.06550.1819
Freshwater ecotoxicity (FEc)kg 1,4-DCB kg−10.00310.00280.00678
Marine ecotoxicity (MEc)kg 1,4-DCB kg−10.000960.000980.0026
Human carcinogenic toxicity (HCT)kg 1,4-DCB kg−10.0000850.000150.00056
Human non-carcinogenic toxicity (HnCT)kg 1,4-DCB kg−10.03780.03450.0804
Mineral resource scarcity (MRS)kg Cu eq kg−10.0000390.001490.0046
Fossil resource scarcity (FRS)kg oil eq kg−10.0140.0430.118
Table A3. Working hour on managing 1 ha of Organic fertilizing system (OFS).
ActivitiesDetail ActivitiesWorking Days (d)Working Hour per Day (h)Total Labor (Person)Subtotal (h y−1)Total Working Hour (h)Contribution Percentage (%)
SeedingPreparation28232320.47
Maintenance421284841.23
NurseryPreparation58280801.18
Maintenance240112402403.53
PlantingPlanting30824804807.05
Subtotal at 1st year 91691613.46
Maintenance in pre-productive stageClearing682961922.82
Pruning18216320.47
Fertilizing38248961.41
Subtotal 2nd–3rd year 1603204.70
Maintenance in productive stage and harvestingClearing682965768.47
Pruning18216961.41
Fertilizing382482884.23
Harvesting2448768460867.72
Subtotal at the 4–9th year 928556881.83
Total working hour 6804100
Table A4. Working hour on managing 1 ha of Chemical-Organic fertilizing system (COFS).
ActivitiesDetail ActivitiesWorking Days (d)Working Hour per Day (h)Total Labor (Person)Sub Total (h y−1)Total Hour (h)Contribution Percentage (%)
SeedingPreparation28232320.47
Maintenance421284841.22
NurseryPreparation58280801.16
Maintenance240112402403.49
PlantingPlanting30824804806.99
Subtotal at the 1st year91691613.34
Maintenance in pre-productive stageClearing18216320.47
Pruning18216320.47
Fertilizing482641281.86
Subtotal at the 2nd–3rd year961922.8
Maintenance in productive stage and harvestingClearing18216961.4
Pruning18216961.4
Fertilizing482643845.59
harvesting2449864518475.48
Subtotal 4–9th960576083.87
Total working hour 6868100
Table A5. Working hour on managing 1 ha of Chemical fertilizing system (CFS).
ActivitiesDetail ActivitiesWorking Days (d)Working Hour per Day (h)Total Labor (Person)Sub Total (h y−1)Total Hour (h)Contribution Percentage (%)
SeedingPreparation28232320.84
Maintenance421284842.21
NurseryPreparation58280802.11
Maintenance240112402406.32
PlantingPlanting308248048012.64
Subtotal at the 1st year91691624.13
Maintenance in pre-productive stageClearing18216320.84
Pruning18216320.84
Fertilizing482641283.37
Subtotal at the 2nd–3rd year961925.06
Maintenance in productive stage and harvestingClearing18216962.53
Pruning18216962.53
Fertilizing282321925.06
Harvesting2444384230460.7
Subtotal at the 4–9th year448268870.81
Total working hour 3796100
Table A6. Environmental impact contributor factor in Organic fertilizing system (OFS).
Impact CategoryUnit (×10−6)Liquid Organic FertilizerLabor TransportMaterial TransportCompostRice HuskElectricity
GWPkg CO2 eq130.118328.014,2801,29043,071299.92
TAkg SO2 eq0.8931.9965.877.08387.101.04
FEkg P eq0.02--0.194.240.47
MEkg N eq0.140.040.071.0858.020.03
TEckg 1,4-DCB223.21149.31252.90359851,293369.36
FEckg 1,4-DCB3.4845.4176.9142.142880.0520.68
MEckg 1,4-DCB4.2961.19103.6450.78704.5327.11
HCTkg 1,4-DCB2.026.3110.6821.9819.4023.88
HnCTkg 1,4-DCB60.8324474145132828,977509.04
MRSkg Cu eq0.36--24.9014.090.16
FRSkg oil eq9.172736.94635.8125.76256.376.46
Table A7. Environmental impact contributor factor in Chemical-Organic fertilizing system (COFS).
Impact CategoryUnit
(×10−6)
NPKLiquid Organic FertilizerPesticideLabor TransportMaterial TransportCompostRice HuskElectricity
GWPkg CO2 eq125,102114.891694409210,915114638,260264.05
TAkg SO2 eq528.260.7812.7415.7250.356.29343.850.92
FEkg P eq2.720.020.91--0.163.770.41
MEkg N eq0.130.120.510.020.060.9651.530.03
TEckg 1,4-DCB7999197.10796573.36193.32319645,563325.18
FEckg 1,4-DCB2.933.07130.9622.3158.7937.43255818.20
MEckg 1,4-DCB29.543.79144.5930.0679.2245.11625.8223.87
HCTkg 1,4-DCB16.191.7865.073.108.1719.5217.2321.02
HnCTkg 1,4-DCB506.2353.71218812023168117925,740448.16
MRSkg Cu eq14120.3252.50--22.1212.510.14
FRSkg oil eq31,7468.10578.4113453544111.66555767.32
Table A8. Environmental impact contributor factor in Chemical-Organic fertilizing system (COFS).
Impact CategoryUnit (×10−6)NPKLiquid Organic FertilizerPesticideLabor TransportMaterial TransportCompostRice HuskElectricity
GWPkg CO2 eq381,541261.04962792995368260286,886599.61
TAkg SO2 eq16111.7872.3735.7224.7614.29780.872.09
FEkg P eq8.300.055.19--0.378.560.94
MEkg N eq0.390.282.880.050.032.17117.030.06
TEckg 1,4-DCB24,394447.8345,255166.7295.077257103,472738.43
FEckg 1,4-DCB8.936.98744.0850.7028.9185.01581041.34
MEckg 1,4-DCB90.088.61821.5668.3238.96102.43142154.20
HCTkg 1,4-DCB49.384.05369.727.044.0244.3439.1347.74
HnCTkg 1,4-DCB1544122.0412,43027321558267858,4551018
MRSkg Cu eq43060.73298.27--50.2328.420.33
FRSkg oil eq96,82118.40328630561743253.5812,621152.86
Table A9. Environmental impact contributor factor in Chemical-Organic fertilizing system (COFS).
Impact CategoryLiquid Organic FertilizerLabor Transport Material TransportCompostRice HuskElectricity
GWP0.1912.621.191.9163.900.44
TA0.186.4813.331.4378.370.21
FE0.48--3.7786.199.56
ME0.230.070.121.8197.710.05
TEc0.400.270.456.4491.780.66
FEc0.111.482.511.3793.850.67
MEc0.456.4310.95.3474.042.85
HCT2.397.4812.726.123.0228.3
HnCT0.166.5311.13.5477.341.36
MRS0.92--63.035.650.42
FRS0.0719.733.50.9145.200.55
Table A10. Percentage of contribution factor in Chemical-Organic fertilizing system (COFS) (%).
Impact CategoryNPKLiquid Organic FertilizerPesticideLabor TransportMaterial TransportCompostRice HuskElectricity
GWP68.890.060.932.256.010.6321.070.15
TA55.090.081.331.645.250.6635.860.10
FE34.000.2611.40--2.0647.095.18
ME0.240.230.950.040.101.7996.600.05
TEc12.210.3012.160.110.304.8869.550.50
FEc0.100.114.620.792.081.3290.340.64
MEc3.010.3914.723.068.074.5963.732.43
HCT10.651.1742.792.045.3712.8411.3313.82
HnCT1.470.166.343.499.193.4274.641.30
MRS94.160.023.50--1.480.830.01
FRS73.900.021.353.138.250.2612.940.16
Table A11. Percentage of contribution factor in Chemical fertilizing system (CFS) (%).
Impact CategoryNPKLiquid Organic FertilizerPesticideLabor TransportMaterial TransportCompostRice HuskElectricity
GWP76.890.0531.941.871.080.5217.510.12
TA63.35-2.851.4050.970.5630.70.08
FE35.450.222.15--1.5936.564.02
ME0.320.2252.340.0390.021.7695.230.047
TEc13.410.2424.890.090.053.9956.90.4
FEc0.130.110.980.750.431.2585.740.61
MEc3.450.3331.532.621.493.9354.552.08
HCT8.730.7165.391.2460.717.846.928.44
HnCT1.910.1515.433.391.933.3272.581.26
MRS91.930.0156.37--1.070.6070.007
FRS82.080.0162.782.591.470.2110.70.13
Table A12. Potential increase or decrease of applying the Organic fertilizing system (OFS).
Impact CategoryUnitPotential Decrease or IncreasePercentage Decrease or Increase (%)
OFS vs. CFSOFS vs. CFSCOFS vs. CFSOFS vs. COFSOFS vs. COFSCOFS vs. CFS
GWPkg CO2 eq−0.114−0.428−0.314−62.6−86.3−63.4
TAkg SO2 eq−0.00046−0.00204−0.00158−48.1−80.4−62.3
FEkg P eq−3.1E-06−0.000018−0.000015−38.8−78.7−65.2
MEkg N eq0.000006−0.000064−0.0000711.3−52−56.9
TEckg 1,4-DCB−0.009−0.126−0.116−13.9−69−64
FEckg 1,4-DCB0.0003−0.0037−0.00399.3−54.3−58.2
MEckg 1,4-DCB−0.00002−0.00164−0.00162−2.4−63.2−62.3
HCTkg 1,4-DCB−0.000067−0.00048−0.00041−44.4−85−73.1
HnCTkg 1,4-DCB0.0033−0.0427−0.0469.5−53.1−57.1
MRSkg Cu eq−0.0015−0.0046−0.0032−97.4−99.2−68
FRSkg oil eq−0.029−0.104−0.075−67.6−88.2−63.5
According to Table A12, the minus value indicates the shifting from organic fertilizing system to chemical fertilizing system will decrease its environment impact; and the positive value indicates the shifting from organic fertilizing system to chemical fertilizing system will increase its environment impact. The potential decrease or increase and its percentage were obtained using the Equations (A1)–(A3):
%   d e c r e a s e   o r   i n c r e a s e   O F S   v s .   C O F S =   p o t e n t i a l   r e d u c t i o n   O F S   v s .   C O F S i m p a c t   i n   C O F S × 100 %
%   d e c r e a s e   o r   i n c r e a s e   O F S   v s .   C F S = p o t e n t i a l   r e d u c t i o n   O F S   v s . C F S i m p a c t   i n   C F S × 100 %
%   d e c r e a s e   o r   i n c r e a s e   C O F S   v s .   C F S = p o t e n t i a l   r e d u c t i o n   C O F S   v s . C F S i m p a c t   i n   C F S × 100 %
Table A13. Production cost per 1 ha coffee plantation (USD).
Item of CostFertilizing System
Organic
(OFS)
Chemical-Organic
(COFS)
Chemical
(CFS)
Fixed cost
Equipment17.3517.3517.35
Device maintenance249.85249.85249.85
Variable cost
Human labor cost4577.794638.872517.92
NPK-990.641329
Rent transportation1811.411894.691728.12
Compost180.45180.45180.45
Manure2025.441031.6054.41
Polybag19.0919.0919.09
Rice Husk45.1145.1145.11
Seed10.4110.4110.41
Pesticide-6.2524.98
Total cost8936.909084.316176.69
Table A14. Production cost per 1 kg coffee cherry bean (USD kg−1) and its percentage (%).
Item of CostCost per kg (USD)Percentage (%)
Organic (OFS)Chemical-Organic (COFS)Chemical (CFS)Organic (OFS)Chemical-Organic (COFS)Chemical (CFS)
Fixed cost
Equipment0.00040.00030.00080.190.190.28
Device maintenance0.0060.0050.0112.82.754.05
Variable cost
Labor0.1040.0930.11451.2251.0640.76
NPK-0.020.06-10.921.52
Transportation0.040.040.0820.2720.8627.98
Compost0.0040.0040.0082.021.992.92
Manure0.0460.0210.00222.6611.360.88
Polybag0.00040.00040.0010.210.210.31
Rice Husk0.0010.0010.0020.50.50.73
Seed0.00020.00020.00050.120.110.17
Pesticide-0.00010.001100.070.4
Total cost0.2030.1820.28100100100
The Production cost per kilogram coffee cherry bean is obtained by Equations (A4) and (A5).
P r o d u c t i o n   c o s t   p e r   k g = c o s t   p e r   h e c t a r   c o f f e e   p r o d u c t i o n   p e r   h e c t a r × 100
C o s t   p e r c e n t a g e   p e r   i t e m   i n p u t = c o s t   p e r   i t e m   i n p u t t o t a l   l i f e   c y c l e   c o s t × 100
Table A15. Emission cost.
Fertilizing SystemsCoffee Cherry Bean Production (kg)Emission per Kilogram Coffee Cherry Bean (kg CO2 eq kg1)Emission Tax (USD t−1)Total Emission (USD ha1)
Organic (OFS)44,0000.0689.729.07
Chemical-Organic (COFS)50,0000.1829.788.42
Chemical (CFS)22,0000.4969.7106.03
Table A16. Revenue and Net profit.
Fertilizing SystemsCoffee Cherry Bean Production (kg ha−1)Selling Price (USD kg−1)Revenue (USD ha−1)Net Profit (USD ha−1)
Organic (OFS)44,0000.6930,53721,571
Chemical-Organic (COFS)50,0000.5929,49620,323
Chemical (CFS)22,0000.5912,9786695
Table A17. Percentage contribution of life cycle cost.
Item of CostFertilizing System
Organic (OFS)Chemical-Organic (COFS)Chemical (CFS)
Percentage (%)
Fixed cost
Equipment0.190.190.28
Device maintenance2.82.754.05
Variable cost
Human labor cost51.2251.0640.76
Fertilizer (NPK)-10.921.52
Rent transportation20.2720.8627.98
Compost2.021.992.92
Manure22.6611.360.88
Polybag0.210.210.31
Rice Husk0.50.50.73
Seed0.120.110.17
Pesticide-0.070.4
Total100100100
The percentage cost is calculated using the Equation (A6).
C o s t   p e r c e n t a g e   p e r   i t e m   i n p u t = c o s t   p e r   i t e m   i n p u t t o t a l   l i f e   c y c l e   c o s t × 100 %
Table A18. Cumulative energy requirement per 1 ha coffee plantation.
Input EnergyFertilizing System
Organic (OFS)Chemical-Organic (COFS)Chemical (CFS)
Energy Requirement (×103 MJ ha−1)
Direct energy
Electricity0.130.130.13
Gasoline15.1414.3213.22
Direct energy
Poultry manure240.77117.486.6
Compost7.87.87.8
Liquid organic fertilizer0.140.140.14
Rice husk18.9818.9818.98
Water48.4248.4248.42
NPK-81.91109.92
Pesticide-2.2210.01
HUman labor12.9313.17.11
Total344.31304.51222.34
Table A19. Energy requirement per stage of coffee plantation.
StageFertilizing System
Organic (OFS)Chemical-Organic (COFS)Chemical (CFS)
Energy per Hectare (×103 MJ ha−1)
Seeding2.922.922.92
Nursery76.9577.0377.11
Planting5.685.685.68
Maintenance 154.3249.4127.44
Maintenance 2185.92149.7694.97
Harvesting18.5319.7114.22
Total344.31304.51222.34

References

  1. Li, M.; Fu, Q.; Singh, V.P.; Liu, D.; Li, T.; Li, J. Sustainable management of land, water, and fertilizer for rice production considering footprint family assessment in a random environment. J. Clean. Prod. 2020, 258, 120785. [Google Scholar] [CrossRef]
  2. Al-Mansour, F.; Jejcic, V. A model calculation of the carbon footprint of agricultural products: The case of Slovenia. Energy 2017, 136, 7–15. [Google Scholar] [CrossRef]
  3. Amini, S.; Rohani, A.; Aghkhani, M.H.; Abbaspour-Fard, M.H.; Asgharipour, M.R. Sustainability assessment of rice production systems in Mazandaran Province, Iran with emergy analysis and fuzzy logic. Sustain. Energy Technol. Assess. 2020, 40, 100744. [Google Scholar] [CrossRef]
  4. Fiore, M.; Spada, A.; Contò, F.; Pellegrini, G. GHG and cattle farming: CO-assessing the emissions and economic performances in Italy. J. Clean. Prod. 2018, 172, 3704–3712. [Google Scholar] [CrossRef]
  5. Nowak, A.; Krukowski, A.; Różańska-Boczula, M. Assessment of sustainability in agriculture of the European Union countries. Agronomy 2019, 9, 890. [Google Scholar] [CrossRef] [Green Version]
  6. Troiano, S.; Novelli, V.; Geatti, P.; Marangon, F.; Ceccon, L. Assessment of the sustainability of wild rocket (Diplotaxis tenuifolia) production: Application of a multi-criteria method to different farming systems in the province of Udine. Ecol. Indic. 2019, 97, 301–310. [Google Scholar] [CrossRef]
  7. Vinyes, E.; Asin, L.; Alegre, S.; Muñoz, P.; Boschmonart, J.; Gasol, C.M. Life Cycle Assessment of apple and peach production, distribution and consumption in Mediterranean fruit sector. J. Clean. Prod. 2017, 149, 313–320. [Google Scholar] [CrossRef]
  8. Joyce, A.; Paquin, R.L. The triple layered business model canvas: A tool to design more sustainable business models. J. Clean. Prod. 2016, 135, 1474–1486. [Google Scholar] [CrossRef]
  9. Zhang, X.; Zhang, M.; Zhang, H.; Jiang, Z.; Liu, C.; Cai, W. A review on energy, environment and economic assessment in remanufacturing based on life cycle assessment method. J. Clean. Prod. 2020, 255, 120160. [Google Scholar] [CrossRef]
  10. United Nation. Sustainable Development Goals. 2015. Available online: https://sdgs.un.org/goals. (accessed on 16 March 2022).
  11. Olabi, A.G.; Obaideen, K.; Elsaid, K.; Wilberforce, T.; Sayed, E.T.; Maghrabie, H.M.; Abdelkareem, M.A. Assessment of the pre-combustion carbon capture contribution into sustainable development goals SDGs using novel indicators. Renew. Sustain. Energy Rev. 2021, 153, 111710. [Google Scholar] [CrossRef]
  12. International Coffee Organization (ICO). World Coffee Consumption. 2021. Available online: https://ico.org/prices/new-consumption-table.pdf (accessed on 1 June 2021).
  13. Widaningsih, R.; Susanti, A.A.; Musyafak, A.; Putra, R.K.; Suyati, Y. Coffee Outlook Indonesia. Agriculture Data Information Center. Indonesia Agricultural Ministre. 2020. Available online: https://epublikasi.pertanian.go.id/arsip-outlook/75-outlook-perkebunan/723-outlook-kopi-2020 (accessed on 25 December 2020).
  14. Noponen, M.R.A.; Edwards-Jones, G.; Haggar, J.P.; Soto, G.; Attarzadeh, N.; Healey, J.R. Greenhouse gas emissions in coffee grown with differing input levels under conventional and organic management. Agric. Ecosyst. Environ. 2012, 151, 6–15. [Google Scholar] [CrossRef] [Green Version]
  15. Biernat-Jarka, A.; Trębska, P. The Importance of Organic Farming in the Context of Sustainable Development of Rural Areas in Poland. Acta Sci. Pol. Oecon. 2018, 17, 39–47. [Google Scholar] [CrossRef]
  16. Hassard, H.; Couch, M.; Techa-Erawan, T.; McLellan, B. Product carbon footprint and energy analysis of alternative coffee products in Japan. J. Clean. Prod. 2014, 73, 310–321. [Google Scholar] [CrossRef] [Green Version]
  17. Acosta-Alba, I.; Boissy, J.; Chia, E.; Andrieu, N. Integrating diversity of smallholder coffee cropping systems in environmental analysis. Int. J. Life Cycle Assess. 2019, 25, 252–266. [Google Scholar] [CrossRef] [Green Version]
  18. Jiménez-Ortega, A.D.; Ibarra, A.A.; Galeana-Pizaña, J.M.; Núñez, J.M. Changes over Time Matter: A Cycle of Participatory Sustainability Assessment of Organic Coffee in Chiapas, Mexico. Sustainability 2022, 14, 2012. [Google Scholar] [CrossRef]
  19. Coltro, L.; Mourad, A.; Oliveira, P.; Baddini, J.; Kletecke, R. Environmental Profile of Brazilian Green Coffee. Int. J. Life Cycle Assess. 2006, 11, 16–21. [Google Scholar] [CrossRef]
  20. Byrareddy, V.; Kouadio, L.; Mushtaq, S.; Stone, R. Sustainable Production of Robusta Coffee under a Changing Climate: A 10-Year Monitoring of Fertilizer Management in Coffee Farms in Vietnam and Indonesia. Agronomy 2019, 9, 499. [Google Scholar] [CrossRef] [Green Version]
  21. Neilson, J.; Wright, J.; Aklimawati, L. Geographical indications and value capture in the Indonesia coffee sector. J. Rural Stud. 2018, 59, 35–48. [Google Scholar] [CrossRef]
  22. Halog, A.; Manik, Y. Life Cycle Sustainability Assessments. Encycl. Inorg. Bioinorg. Chem. 2016, 25–41. [Google Scholar] [CrossRef]
  23. Dabkienė, V.; Baležentis, T.; Štreimikienė, D. Calculation of the carbon footprint for family farms using the Farm Accountancy Data Network: A case from Lithuania. J. Clean. Prod. 2020, 262, 121509. [Google Scholar] [CrossRef]
  24. Mancini, M.S.; Galli, A.; Niccolucci, V.; Lin, D.; Bastianoni, S.; Wackernagel, M.; Marchettini, N. Ecological Footprint: Refining the carbon Footprint calculation. Ecol. Indic. 2016, 61, 390–403. [Google Scholar] [CrossRef]
  25. González-Cencerrado, A.; Ranz, J.P.; Jiménez, M.T.L.-F.; Gajardo, B.R. Assessing the environmental benefit of a new fertilizer based on activated biochar applied to cereal crops. Sci. Total Environ. 2020, 711, 134668. [Google Scholar] [CrossRef] [PubMed]
  26. Putra, A.S.; Noguchi, R.; Ahamed, T.; Nakagawa-Izumi, A.; Ohi, H. Development of integrated oil palm empty fruit bunches (EFB)-based dissolving pulp and furfural production: A consequential LCA approach. Int. J. Life Cycle Assess. 2021, 26, 175–188. [Google Scholar] [CrossRef]
  27. International Coffee Organization (ICO). New ICO Study: Assessing the Economic Sustainability of Coffee Growing. 2016. Available online: https://ico.org/show_news.asp?id=567 (accessed on 10 March 2022).
  28. Bosona, T.; Gebresenbet, G.; Dyjakon, A. Implementing life cycle cost analysis methodology for evaluating agricultural pruning-to-energy initiatives. Bioresour. Technol. Rep. 2019, 6, 54–62. [Google Scholar] [CrossRef]
  29. Swarr, T.E.; Hunkeler, D.; Klöpffer, W.; Pesonen, H.-L.; Ciroth, A.; Brent, A.; Pagan, R. Environmental life-cycle costing: A code of practice. Int. J. Life Cycle Assess. 2011, 16, 389–391. [Google Scholar] [CrossRef]
  30. Wang, H.; Oguz, E.; Jeong, B.; Zhou, P. Life cycle cost and environmental impact analysis of ship hull maintenance strategies for a short route hybrid ferry. Ocean Eng. 2018, 161, 20–28. [Google Scholar] [CrossRef] [Green Version]
  31. Kamali, F.P.; van der Linden, A.; Meuwissen, M.P.; Malafaia, G.C.; Lansink, A.G.O.; de Boer, I.J. Environmental and economic performance of beef farming systems with different feeding strategies in southern Brazil. Agric. Syst. 2016, 146, 70–79. [Google Scholar] [CrossRef]
  32. Kizilaslan, H. Input–output energy analysis of cherries production in Tokat Province of Turkey. Appl. Energy 2009, 86, 1354–1358. [Google Scholar] [CrossRef]
  33. West Bandung Regency Profile. Medium-Term Investment Program Plan of West Bandung Regency. 2015. Available online: https://sippa.ciptakarya.pu.go.id/sippa_online/ws_file/dokumen/rpi2jm/DOCCRPIJM_3a3c8d3e3b_BAB%20IIBAB%202.pdf (accessed on 17 March 2022).
  34. Guo, J.H.; Liu, X.J.; Zhang, Y.; Shen, J.L.; Han, W.X.; Zhang, W.F.; Christie, P.; Goulding, K.W.T.; Vitousek, P.M.; Zhang, F.S. Significant Acidification in Major Chinese Croplands. Science 2010, 327, 1008–1010. [Google Scholar] [CrossRef] [Green Version]
  35. ISO 14040; Environmental Management E Life Cycle Assessment-Principles and Framework. International Standard Organization: Geneva, Switzerland, 2016. Available online: https://www.iso.org/standard/37456.html?browse=tc (accessed on 22 February 2022).
  36. Vinyes, E.; Gasol, C.M.; Asin, L.; Alegre, S.; Muñoz, P. Life Cycle Assessment of multiyear peach production. J. Clean. Prod. 2015, 104, 68–79. [Google Scholar] [CrossRef] [Green Version]
  37. IOR Energy Pty Ltd-University of California, Berkeley. List of Common Conversion Factor. Available online: https://w.astro.berkeley.edu/~wright/fuel_energy.html (accessed on 25 December 2021).
  38. Kaab, A.; Sharifi, M.; Mobli, H.; Nabavi-Pelesaraei, A.; Chau, K.-W. Use of optimization techniques for energy use efficiency and environmental life cycle assessment modification in sugarcane production. Energy 2019, 181, 1298–1320. [Google Scholar] [CrossRef]
  39. Hosseinzadeh-Bandbafha, H.; Safarzadeh, D.; Ahmadi, E.; Nabavi-Pelesaraei, A.; Hosseinzadeh-Bandbafha, E. Applying data envelopment analysis to evaluation of energy efficiency and decreasing of greenhouse gas emissions of fattening farms. Energy 2017, 120, 652–662. [Google Scholar] [CrossRef]
  40. Unakitan, G.; Hurma, H.; Yilmaz, F. An analysis of energy use efficiency of canola production in Turkey. Energy 2010, 35, 3623–3627. [Google Scholar] [CrossRef]
  41. Ozkan, B.; Akcaoz, H.; Fert, C. Energy input–output analysis in Turkish agriculture. Renew. Energy 2004, 29, 39–51. [Google Scholar] [CrossRef]
  42. Avval, S.H.M.; Rafiee, S.; Sharifi, M.; Hosseinpour, S.; Notarnicola, B.; Tassielli, G.; Renzulli, P.A. Application of multi-objective genetic algorithms for optimization of energy, economics and environmental life cycle assessment in oilseed production. J. Clean. Prod. 2017, 140, 804–815. [Google Scholar] [CrossRef]
  43. Rafiee, S.; Avval, S.H.M.; Mohammadi, A. Modeling and sensitivity analysis of energy inputs for apple production in Iran. Energy 2010, 35, 3301–3306. [Google Scholar] [CrossRef]
  44. Antizar-Ladislao, B.; Irvine, G.; Lamont, E.R. Energy from Waste: Reuse of Compost Heat as a Source of Renewable Energy. Int. J. Chem. Eng. 2010, 2010, 627930. [Google Scholar] [CrossRef] [Green Version]
  45. Zea, P.; Chilpe, J.; Sánchez, D.; Chica, E.J. Energy efficiency of smallholder commercial vegetable farms in Cuenca (Ecuador). Trop. Subtrop. Agroecosyst. 2020, 23, 1–8. [Google Scholar]
  46. McLaughlin, N.B.; Hiba, A.; Wall, G.J.; King, D.J. Comparison of energy inputs for inorganic fertilizer and manure based corn production. Can. Agric. Eng. 2000, 42, 9–18. [Google Scholar]
  47. Neira, D.P.; Montiel, M.S.; Fernández, X.S. Energy Analysis of Organic Farming in Andalusia (Spain). J. Sustain. Agric. 2012, 37, 231–256. [Google Scholar] [CrossRef]
  48. Pimentel, D.; Burgess, M. An Environmental, Energetic and Economic Comparison of Organic and Conventional Farming Systems. Integr. Pest Manag. 2014, 3, 141–166. [Google Scholar] [CrossRef]
  49. Huijbregts, M.A.J.; Steinmann, Z.J.N.; Elshout, P.M.F.; Stam, G.; Verones, F.; Vieira, M.; Zijp, M.; Hollander, A.; van Zelm, R. ReCiPe2016: A harmonised life cycle impact assessment method at midpoint and endpoint level. Int. J. Life Cycle Assess. 2017, 22, 138–147. [Google Scholar] [CrossRef]
  50. OECD. Taxing Energy Use. Using Taxes for Climate Action. 2019. Available online: https://www.oecd.org/tax/tax-policy/brochure-taxing-energy-use-2019.pdf (accessed on 20 December 2021).
  51. Indonesian Bank. Statistics Economic and Finance in Indonesia. Available online: https://www.bi.go.id/en/statistic/informasi-kurs/transaksi-bi/Default.aspx. (accessed on 16 December 2021).
  52. Basavalingaiah, K.; Paramesh, V.; Parajuli, R.; Girisha, H.; Shivaprasad, M.; Vidyashree, G.; Thoma, G.; Hanumanthappa, M.; Yogesh, G.; Misra, S.D.; et al. Energy flow and life cycle impact assessment of coffee-pepper production systems: An evaluation of conventional, integrated and organic farms in India. Environ. Impact Assess. Rev. 2021, 92, 106687. [Google Scholar] [CrossRef]
  53. Guo, M.; Murphy, R. LCA data quality: Sensitivity and uncertainty analysis. Sci. Total Environ. 2012, 435–436, 230–243. [Google Scholar] [CrossRef] [PubMed]
Figure 1. Surveyed coffee plantation area in the sub-district of Sindangkerta, Bandung Barat District, West-Java, Indonesia.
Sustainability 14 03912 g001
Figure 2. Research stage.
Sustainability 14 03912 g002
Figure 3. System boundary of the three coffee fertilizing systems.
Sustainability 14 03912 g003
Figure 4. Energy requirement for 1 kg coffee cherry bean.
Sustainability 14 03912 g004
Figure 5. Environmental impact of 1 kg of cherry coffee bean production.
Sustainability 14 03912 g005
Figure 6. Contributing factors in the Organic Fertilizing System (OFS).
Sustainability 14 03912 g006
Figure 7. Contributing factors in the Chemical-Organic Fertilizing System (COFS).
Sustainability 14 03912 g007
Figure 8. Contributing factors in the Chemical Fertilizing System (CFS).
Sustainability 14 03912 g008
Figure 9. Environmental sensitivity analysis.
Sustainability 14 03912 g009
Table 1. General information of the three coffee fertilizing systems.
ParticularsUnitFertilizing System
Organic (OFS)Chemical-Organic (COFS)Chemical (CFS)
Geographical information
ElevationMSAL *1200–1300
SlopeDegree0–45
Land areaha254805
* MASL is meters above sea level.
Table 2. Inventory data of the input and output by fertilizing system.
Input and OutputUnitFertilizing System
Organic (OFS)Chemical-Organic (COFS)Chemical (CFS)
Quantity
Input
SeedingGasolineL ha−1222
ElectricitykWh ha−10.030.030.03
Poultry manurekg ha−1100100100
Compostkg ha−1100100100
Liquid organic fertilizerL ha−1888
Rice huskkg ha−1100100100
WaterL ha−1420420420
Seedkg ha−1222
Human laborh ha−1116116116
NurseryGasolineL ha−1555
ElectricitykWh ha−111.2511.2511.25
Poultry manurekg ha−1240024002400
Compostkg ha−1120012001200
Liquid organic fertilizerL ha−1969696
Rice huskkg ha−1120012001200
WaterL ha−148,00048,00048,000
NPK Sustainability 14 03912 i001kg ha−1-0.931.83
kg ha−1-0.931.83
kg ha−1-0.931.83
Human laborh ha−1320320320
PlantingGasolineL ha−1424242
Poultry manurekg ha−1250025002500
Human labor h ha−1480480480
Maintenance 1 1GasolineL ha−1262012
(Pre-productive)Poultry manurekg ha−140,00024,000-
NPK Sustainability 14 03912 i001kg ha−1-180266.43
kg ha−1-180266.43
kg ha−1-180266.43
PesticideL ha−1-312
Human laborh ha−1320192128
Maintenance 2 2GasolineL ha−1786036
(Productive)Poultry manurekg ha−1137,40060,000-
NPK Sustainability 14 03912 i001kg ha−1-750981
kg ha−1-750981
kg ha−1-750981
PesticideL ha−1-524
Human laborh ha−1960576384
Harvesting 3GasolineL ha−1288288288
Human laborh ha−1440050002200
OutputCoffee cherry beankg ha−144,00050,00022,000
1 Maintenance 1 is the maintenance activity in the pre-productive stage; 2 Maintenance 2 is that in the productive stage; and 3 Harvesting indicates the input and output for six years of harvesting.
Table 3. Energy conversion factor.
Input SystemUnitEnergy Conversion Factor (MJ Unit−1)References
GasolineL34.2[37]
ElectricitykWh11.93[38]
Human laborh1.96[39,40]
PesticideL278[40]
NPK Sustainability 14 03912 i001kg64.4[41]
kg12.44[42,43]
kg11.15[42,43]
Compostkg6[44]
Poultry manurekg1.32[45,46,47]
WaterL1[43,45]
Liquid organic fertilizerL1.32[45,46,47]
Rice huskkg14.6[48]
Table 4. Energy requirement for managing of 1 ha coffee plantation.
Stage of PlantationInput SystemFertilizing System
Organic (OFS)Chemical-Organic (COFS)Chemical (CFS)
Energy Requirement (×103 MJ ha−1)
SeedingGasoline0.0680.0680.068
Electricity0.00040.00040.0004
Poultry manure0.1320.1320.132
Compost0.60.60.6
Liquid organic fertilizer0.0110.0110.011
Rice husk1.461.461.46
Water0.420.420.42
Seed---
Human labor0.230.230.23
NurseryGasoline0.170.170.17
Electricity0.130.130.13
Poultry manure3.173.173.17
Compost7.27.27.2
Liquid organic fertilizer0.130.130.13
Rice husk17.5217.5217.52
Water484848
NPK Sustainability 14 03912 i001-0.060.12
-0.0120.023
-0.010.02
Human labor0.630.630.63
PlantingGasoline1.441.441.44
Poultry manure3.33.33.3
Human labor0.940.940.94
Maintenance 1 1Gasoline0.890.680.41
Poultry manure52.831.68-
NPK Sustainability 14 03912 i001-11.5917.16
-2.243.31
-22.97
Pesticide -0.833.34
Human labor0.630.380.25
Maintenance 2 2Gasoline2.672.051.23
Poultry manure181.3779.2-
NPK Sustainability 14 03912 i001-48.363.18
-9.3312.2
-8.3610.94
Pesticide-1.396.67
Human labor1.881.130.75
Harvesting 3Gasoline9.919.919.91
Human labor8.629.84.31
Total 344.31304.51222.34
1 Maintenance activity in pre-production stage (four years of maintenance); 2 Maintenance in productive stage (five years of maintenance); and 3 six years of harvesting.
Table 5. Comparative environmental impact evaluation with previous coffee study.
ResearchBoundaryScenarioEnvironmental Impact
(kg CO2 eq kg−1)
Martin R.A. Noponen, et al. [14]Coffee cultivation in Costa Rica and Nicaragua with average annual coffee production since the second year of productionConventional0.26–0.67
Organic0.12–0.52
Basavalingaiah, K., et al. [52]Coffee-pepper in India in generalConventional1.24
Integrated1.07
Organic0.27
This studyCoffee cultivation in Indonesia in all life cycle of coffee cultivation from seeding until replantingOrganic (OFS)0.068
Chemical-Organic (COFS)0.182
Chemical (CFS)0.496
Table 6. Life cycle cost (LCC) analysis.
IndicatorsUnitFertilizing System
Organic
(OFS)
Chemical-Organic
(COFS)
Chemical
(CFS)
Production CostUSD ha−1893690846176
USD kg−10.20310.18160.2800
Emission costUSD ha−129.0788.42106.02
USD kg−10.00060.00170.0048
RevenueUSD ha−130,53729,49612,978
USD kg−10.690.590.59
Net profitUSD ha−121,57120,3306720
USD kg−10.490.410.30
Table 7. Results of the sustainability assessment.
CategoryIndicatorsUnitFertilizing System
Organic (OFS)Chemical-Organic (COFS)Chemical (CFS)
Environmental ImpactGWPkg CO2 eq kg−10.0680.1820.496
Lowest (++)Modest (+−)Highest (−−)
TAkg SO2 eq kg−10.00050.0010.0025
Lowest (++)Modest (+−)Highest (−−)
FEkg P eq kg−10.0000050.0000080.000023
Lowest (++)Modest (+−)Highest (−−)
Meckg N eq kg−10.000060.000050.00012
Modest (+−)Lowest (++)Highest (−−)
TEckg 1,4-DCB kg−10.0560.0660.182
Lowest (++)Modest (+−)Highest (−−)
Feckg 1,4-DCB kg−10.00310.00280.0068
Modest (+−)Lowest (++)Highest (−−)
MEckg 1,4-DCB kg−10.000960.000980.0026
Lowest (++)Modest (+−)Highest (−−)
HCTkg 1,4-DCB kg−10.000080.000150.00057
Lowest (++)Modest (+−)Highest (−−)
HnCTkg 1,4-DCB kg−10.0380.0340.08
Modest (+−)Lowest (++)Highest (−−)
MRSkg 1,4-DCB kg−10.000040.00150.0047
Lowest (++)Modest (+−)Highest (−−)
FRSkg 1,4-DCB kg−10.01390.0430.1178
Lowest (++)Modest (+−)Highest (−−)
Economic benefitNet profitUSD kg−10.490.410.31
Highest (++)Modest (+−)Lowest (−−)
Energy RequirementTotal energyMJ kg−17.926.1910.35
Modest (+−)Lowest (++)Highest (−−)
Publisher’s Note: MDPI stays neutral with regard to jurisdictional claims in published maps and institutional affiliations.

