1. Introduction
Market structure and market concentration are common topics in economic analyses related to business and policy. Most often, studies are focused on the impact of seller power in markets with limited competition. As such, much of the literature has focused on the price–concentration relationship, yielding a consensus in food retailing that increased concentration is associated with higher food prices. This phenomenon is typically attributed to the application of market power [
1]. However, there are other potential economic impacts throughout the food supply chain. Our study explores the implications of retail mergers and acquisitions (M&A) on the specialty crop production sector by investigating the upstream impacts of the 2014 acquisition of Safeway by Albertsons. Understanding the direct impact of M&A to the upstream supply chain is the first step in creating more comprehensive M&A regulations that account for the welfare of producers and other upstream agents, in addition to that of consumers. The issue is timely, as market consolidation throughout food industries continues to increase rapidly, as we discuss in: ‘Background and Literature Review’.
Additionally, the COVID-19 pandemic has motivated an improved understanding of marketing channels and selling conditions for agricultural producers to better prepare the food supply chain for future shocks and disruptions. In the past year, COVID-19 has placed stress on the food supply chain. Consumer preferences have quickly fluctuated, and grocery stores have had to adapt ready-to-eat food spaces and add precautionary equipment such as Plexiglas barriers. Between the heightened need for food at home and the increased operational expenses, there has been an increase in costs for every segment of the supply chain [
2]. Seasonal employment, which is common throughout agricultural markets, often relies on migrant workers. The absence of these employees due to illness and travel restrictions has had serious implications on both food safety due to the health status of the workers, and debilitated production processes because of the loss of labor availability [
3]. Impacts such as complete shutdowns, labor scarcity, and shipment delays have threatened farmers’ abilities to deliver the necessary volume of food [
4].
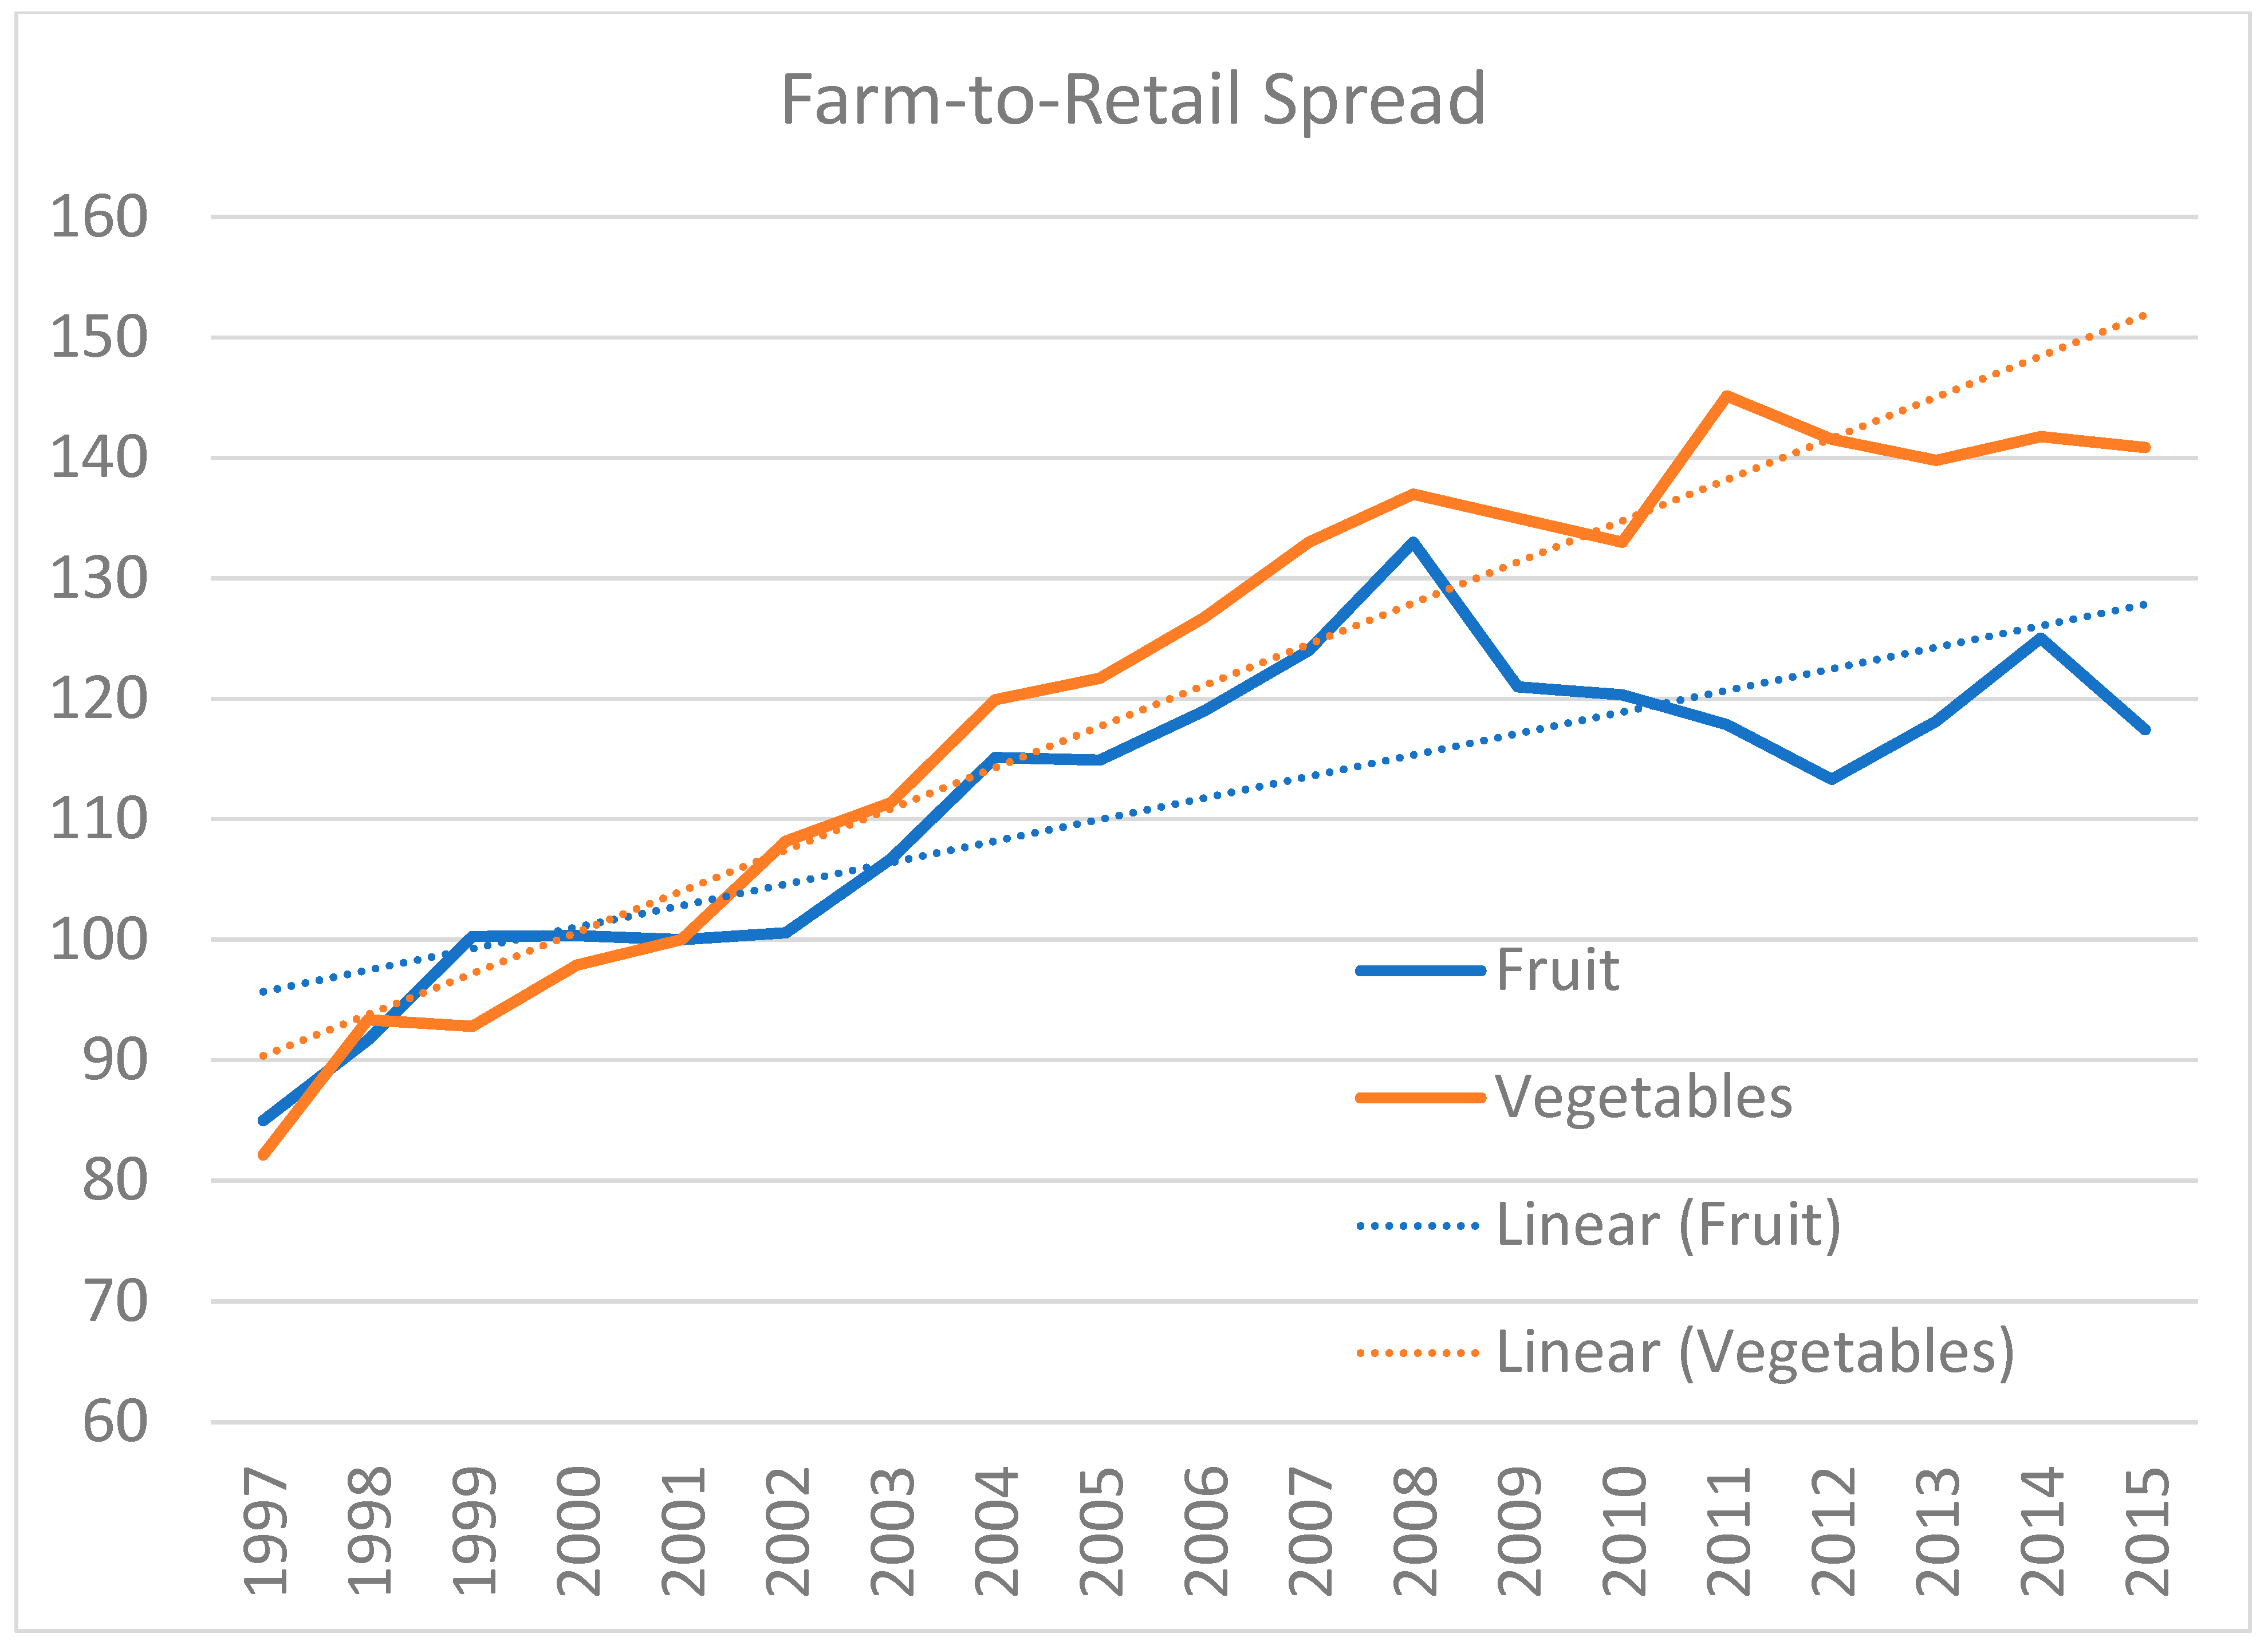
Price spreads are commonly used to gauge market conditions. Examining farm-to-retail (FTR) price spread data collected by [
5], we see that the price spread increased considerably in the years leading up to 2019.
Figure 1 shows the steady increase in the price spreads of fruit and vegetables in the last two decades, up to and including the merger of interest. Some of this increase could likely be attributed to higher operating expenses throughout the supply chain, a trend that was accelerated during the COVID-19 pandemic [
6,
7]. However, longer-term trends show a widening gap between farm and retail prices for fruits and vegetables, which may also reflect market power as applied by wholesalers and retailers. In the years immediately leading up to the 2014 merger, the FTR spread trended flat for both fruits and vegetables, though it remained much higher than it was in the 1990s. Attributing the increase in price spread in 2014 to a change in the farm supply side or the retail demand side or both is necessary to accurately assess its relevance to the presence of market power expansion [
8].
The farm share of the retail dollar also helps in illustrating the relationship between buyers and sellers. The farm share can help ascertain whether changes in the FTR spread is due to increases in the value added to foods, via processing, packaging, and advertising as examples, or to market power. When both the FTR spread and the farm share increase over the same period, this suggests that value-added processes are driving higher FTR spreads. If the farm share falls while the FTR spread rises, it might suggest that market power drives the farm price down, the retail price up, or both. If changes in consumer preferences can be eliminated as an impacting factor, market power can be identified as the leading cause of declining farm prices [
9].
The farm share for fruits and vegetables over time yields mixed evidence. The farm share for vegetables trends downward, decreasing 10% in 1997–2015. Ex ante, we can foresee that vegetable producers may be more impacted by the merger. However, while the farm share has trended up for fruit products, increasing 27% in the same period, the coefficient of variation for the farm share is twice as volatile for fruit when compared to vegetables. Since growers are adversely affected by reduced price and increased price volatility, there is evidence that the merger negatively impacts both fruit and vegetable suppliers alike [
10].
Our study was carried out in two parts. We qualitatively analyze 19 interviews with specialty crop producers in California on the topic of the 2014 Albertsons–Safeway merger and overall retail M&A activity. The Albertsons–Safeway merger is one of the largest in grocery history, as the resulting Albertsons parent company came out of the merger as the fourth largest grocery company in the U.S in 2016, with total annual sales of nearly USD 59 billion [
11]. These findings are supplemented with quantitative analysis of crop prices reported to the USDA across all states in the relevant time periods. Survey results were used to understand and identify areas of consistence and divergence among growers with respect to the impact of M&A activity on their operations. We analyze USDA crop price data to directionally investigate and validate the qualitative findings. While our study is unable to identify causal effects, we uncover clear implications of mergers for upstream producers and motivate future work on the topic.
While the perceived impacts of M&A considerably varied among the interviewed producers, the consensus was that M&A activity among buyers, retailers in this case, leads to adverse outcomes. When buyer power is concentrated to a single or only a few organizations, farm prices decrease, and transactional costs increase, becoming ungovernable in some cases. In the case of the 2014 Albertsons–Safeway merger, these effects are evident in both quantitative data and the accounts of those involved. Without a proper understanding of the economic impacts of M&A activity, the oversight and regulation of these events may fail to consider all potential harm. Our findings suggest that suppliers receive lower prices and at times, lose large accounts within the retail marketing channel.
The food supply chain and all of US agriculture have been transformed by consolidation in recent decades [
12]. This is particularly pronounced among retailers [
13]. In this section, we discuss the literature on the implications of asymmetric transactions, particularly those in which the buyer controls the balance of power. We focus specifically on agricultural producers, who are often thought to be price takers [
14]. The effects of buying power, specifically within the food supply chain, can have implications for prices received, income volatility, entry and exit, and more for producers.
Monopsonies and oligopsonies are a strong area of focus within the agrifood sector, because buyer power, in comparison to seller power, is more likely to be present in agricultural systems [
15]. Various stages and industrial segments of the specialty crop supply chain have effects on the food prices as value is added. More recent work [
16] has identified market power concentration at multiple stages, including retail stage, as a cause of fluctuations in prices for suppliers. Being the initial player in this upstream supply chain and having little control over their ability to preserve their short-term goods, farmers are forced to take a passive role in the designation of vegetable prices. The incidence of farm-level food waste during the early stage of the COVID-19 pandemic further highlighted the relevance of monopsony and oligopoly power. Many specialty crop producers sell to a small number of buyers, meaning that they are often motivated to remain selling to large retailers postmerger, regardless of the change in circumstances.
Research on farm prices indicates a linkage between prices received by growers and ranchers and the availability of local buyers. The distinctive characteristics of agricultural products, being bulky and perishable, result in obvious challenges regarding mobility and the need for proximal production facilities [
17]. Geographical factors, such as a significant decrease in transportation costs for growers located closer to processing or packing facilities, limit the flexibility of processors that the growers can work with. This increases the power of the processing plants, as growers are forced to choose between higher transportation costs or the favorable proximity of a buyer. Growers located in a region with a singular buyer on average received a payment of 6% less per pound of broilers than that of growers who were in an area with four or more buyers [
18]. Finally, a study of agricultural prices received for 117 countries revealed extensive evidence of monopsony power as a driver of price variation [
19].
Limited evidence exists for positive impacts resulting from M&A activity for upstream players. One benefit identified in the existing literature is the implications of technological innovation and efficiency improvements [
20]. The seed industry is one of the centers of innovation within the food industry due to its direct correlation to food security and socioeconomic issues [
21]. Seed biotechnology is recognized by some as having the power and potential to heavily improve the food circumstances that we face on a global scale. The severity and relevance of this topic attracts input from a multidimensional array of stakeholders. The seed industry is a notable example of a highly concentrated market because it has been historically dominated by The Big 6: BASF, Down Chemical, Bayer, Monsanto, DuPont, and Syngenta [
22].
While the advantages and disadvantages of consolidated market power in agribusiness and the food supply chain are of a polemic nature, most economic theory points to adverse pricing effects on farmers regardless of the potential for innovation that mergers may invite. The food market especially is an indispensable and yet highly uncertain market. Specialty crops are even more susceptible to volatility from external factors due to the cyclical nature of their growing patterns. Agreements between suppliers and buyers of specialty crops, even when a contract is involved, are typically on an annual basis. The fact that a buyer purchases from a specific supplier one year does not guarantee that they will purchase from that supplier the following year. The use of contracts to exercise buyer power has been addressed by several scholars. Motivators for contracting, as identified in the contracting literature, include incentive alignment, risk sharing, market power, and efficiency gains [
23]. Contracts, which allow for participants to take advantage of asymmetric information, create risks for whichever party is less informed. Once farmers have gained the experience and knowledge to advocate and negotiate for fair terms, the risk is lower [
24]. There are three mechanisms that allow for contracts to expand market power. These are restricting entry, limiting price competition, and discriminatory pricing [
15].
In looking at the behavioral impact of M&A activity, it is evident that consolidation causes retailers to reduce prices given to farmers and increase prices imposed on consumers. Evidence that shows the correlation of concentration to an increase in prices to consumers is so obvious that it was directly denounced by the American Antitrust Institute [
25]. Even in the case of merger remedies, a common policy tool utilized by the Federal Trade Commission (FTC), there is little proof of their ability to restore balance to market competition [
26]. This heightened level of power allows for retailers to largely influence the standard logistics, tracking technologies, and bargaining strategies. Walmart’s sway in the market was so powerful that it entirely shifted the industries’ distribution process from relying on wholesalers and direct deliveries from producers to regional distribution centers (RDCs) and vertical integration, allowing for them to directly control everything from procurement to transportation and the sale of the product [
27].
The 2014 acquisition of Safeway by Albertsons is especially significant due to the two organizations’ market power at the time. As of 2001, five grocery chains accounted for 40% of grocery retail sales in the United States. These were Kroger, Albertsons, Walmart, Safeway, and Ahold USA [
28]. By 2015, the top retailers’ control over the market had increased to 41–52% of sales in the United States [
27]. According to the FTC, the acquisition was predicted to lead to a highly competitive situation and increased price implications for consumers, causing the FTC to require the retail chains to sell 168 stores as a prerequisite of the merger [
29]. The operational impacts of the merger had severe repercussions for all suppliers that the two organizations purchased from, especially those that had an existing relationship with Safeway.
2. Materials and Methods
To gain clarity and insight into the connotations associated with M&A activity, we interviewed 19 specialty crop producers. While much of the accumulated empirical evidence lacks consensus on the effects of retail consolidation on farmers, there is an abundance of anecdotal testimonies that confirm M&A activity can have serious negative implications [
30]. Our discussions with specialty crop growers further support this finding. We developed a set of nine questions for each interviewee. These are available in
Appendix A. In the interest of accommodating the schedules of participants, interviewees were given the option to submit written answers, conduct the interview over the phone, or both. Our project was approved for research on human subjects by the Cal Poly Institutional Review Board, protocol number 2020-089.
Criteria set regarding participants ensured that their experience was relevant to this study. To identify potential participants, we partnered with the Western Growers Association (WGA), the trade association that represents over 600 specialty crop producers in California. Respondents comprised growers based in California that produced an extensive range of products, represented the various growing regions of the state, and were in business at the time of the 2014 acquisition. Interviews were conducted with every producer who responded to our inquiry. Approximately 5% of the available contacts to the research team via WGA completed the interview. All factors were important in ensuring that we were encompassing a wide range of perspectives, and that each participant had had ample experience regarding M&A activity of retail chains.
One of our goals is to test for evidence of findings drawn from our interviews using publicly available data. We were unable to observe farm-level microdata; therefore, we relied on publicly available data. The USDA National Agricultural Statistics Service (NASS) maintains a database of farm sector indicators organized by state, commodity, and year [
31]. Given that we only observed prices and not farm costs, revenues, and profits, we investigated if the 2014 merger was associated with lower prices received and increased price volatility. Our analysis is descriptive and directional, and is unable to attribute causality to merger activity or retailer behavior. The purpose of this section is to corroborate the main findings of the previous section and to motivate future research on the topic. The specialty crops included in the USDA database that are produced by the interviewed growers include apples, asparagus, avocados, broccoli, cauliflower, celery, dates, grapes, kiwi, pears, bell peppers, chili peppers, blueberries, and strawberries.
For all commodities included in both the USDA database and the interviews, we combined annual average prices received with annual production data, measured in hundredweight (cwt). We used the production data to weight prices received by state and year, then created weighted prices received for each commodity. We then calculated production-weighted average prices received across all commodities by state and year. This allowed for us to examine variation in prices received for 2000–2020, a period that includes the 2014 Safeway–Albertsons merger, while minimizing the impact of price changes for minimally produced or niche crops within states. We used data for the 28 U.S. states that produced at least one of the commodities of interest according to the NASS data. Any states not included in analysis do not sell any of the commodities discussed in the interviews. The average state in our usable dataset produced slightly fewer than three of the included commodities per year.
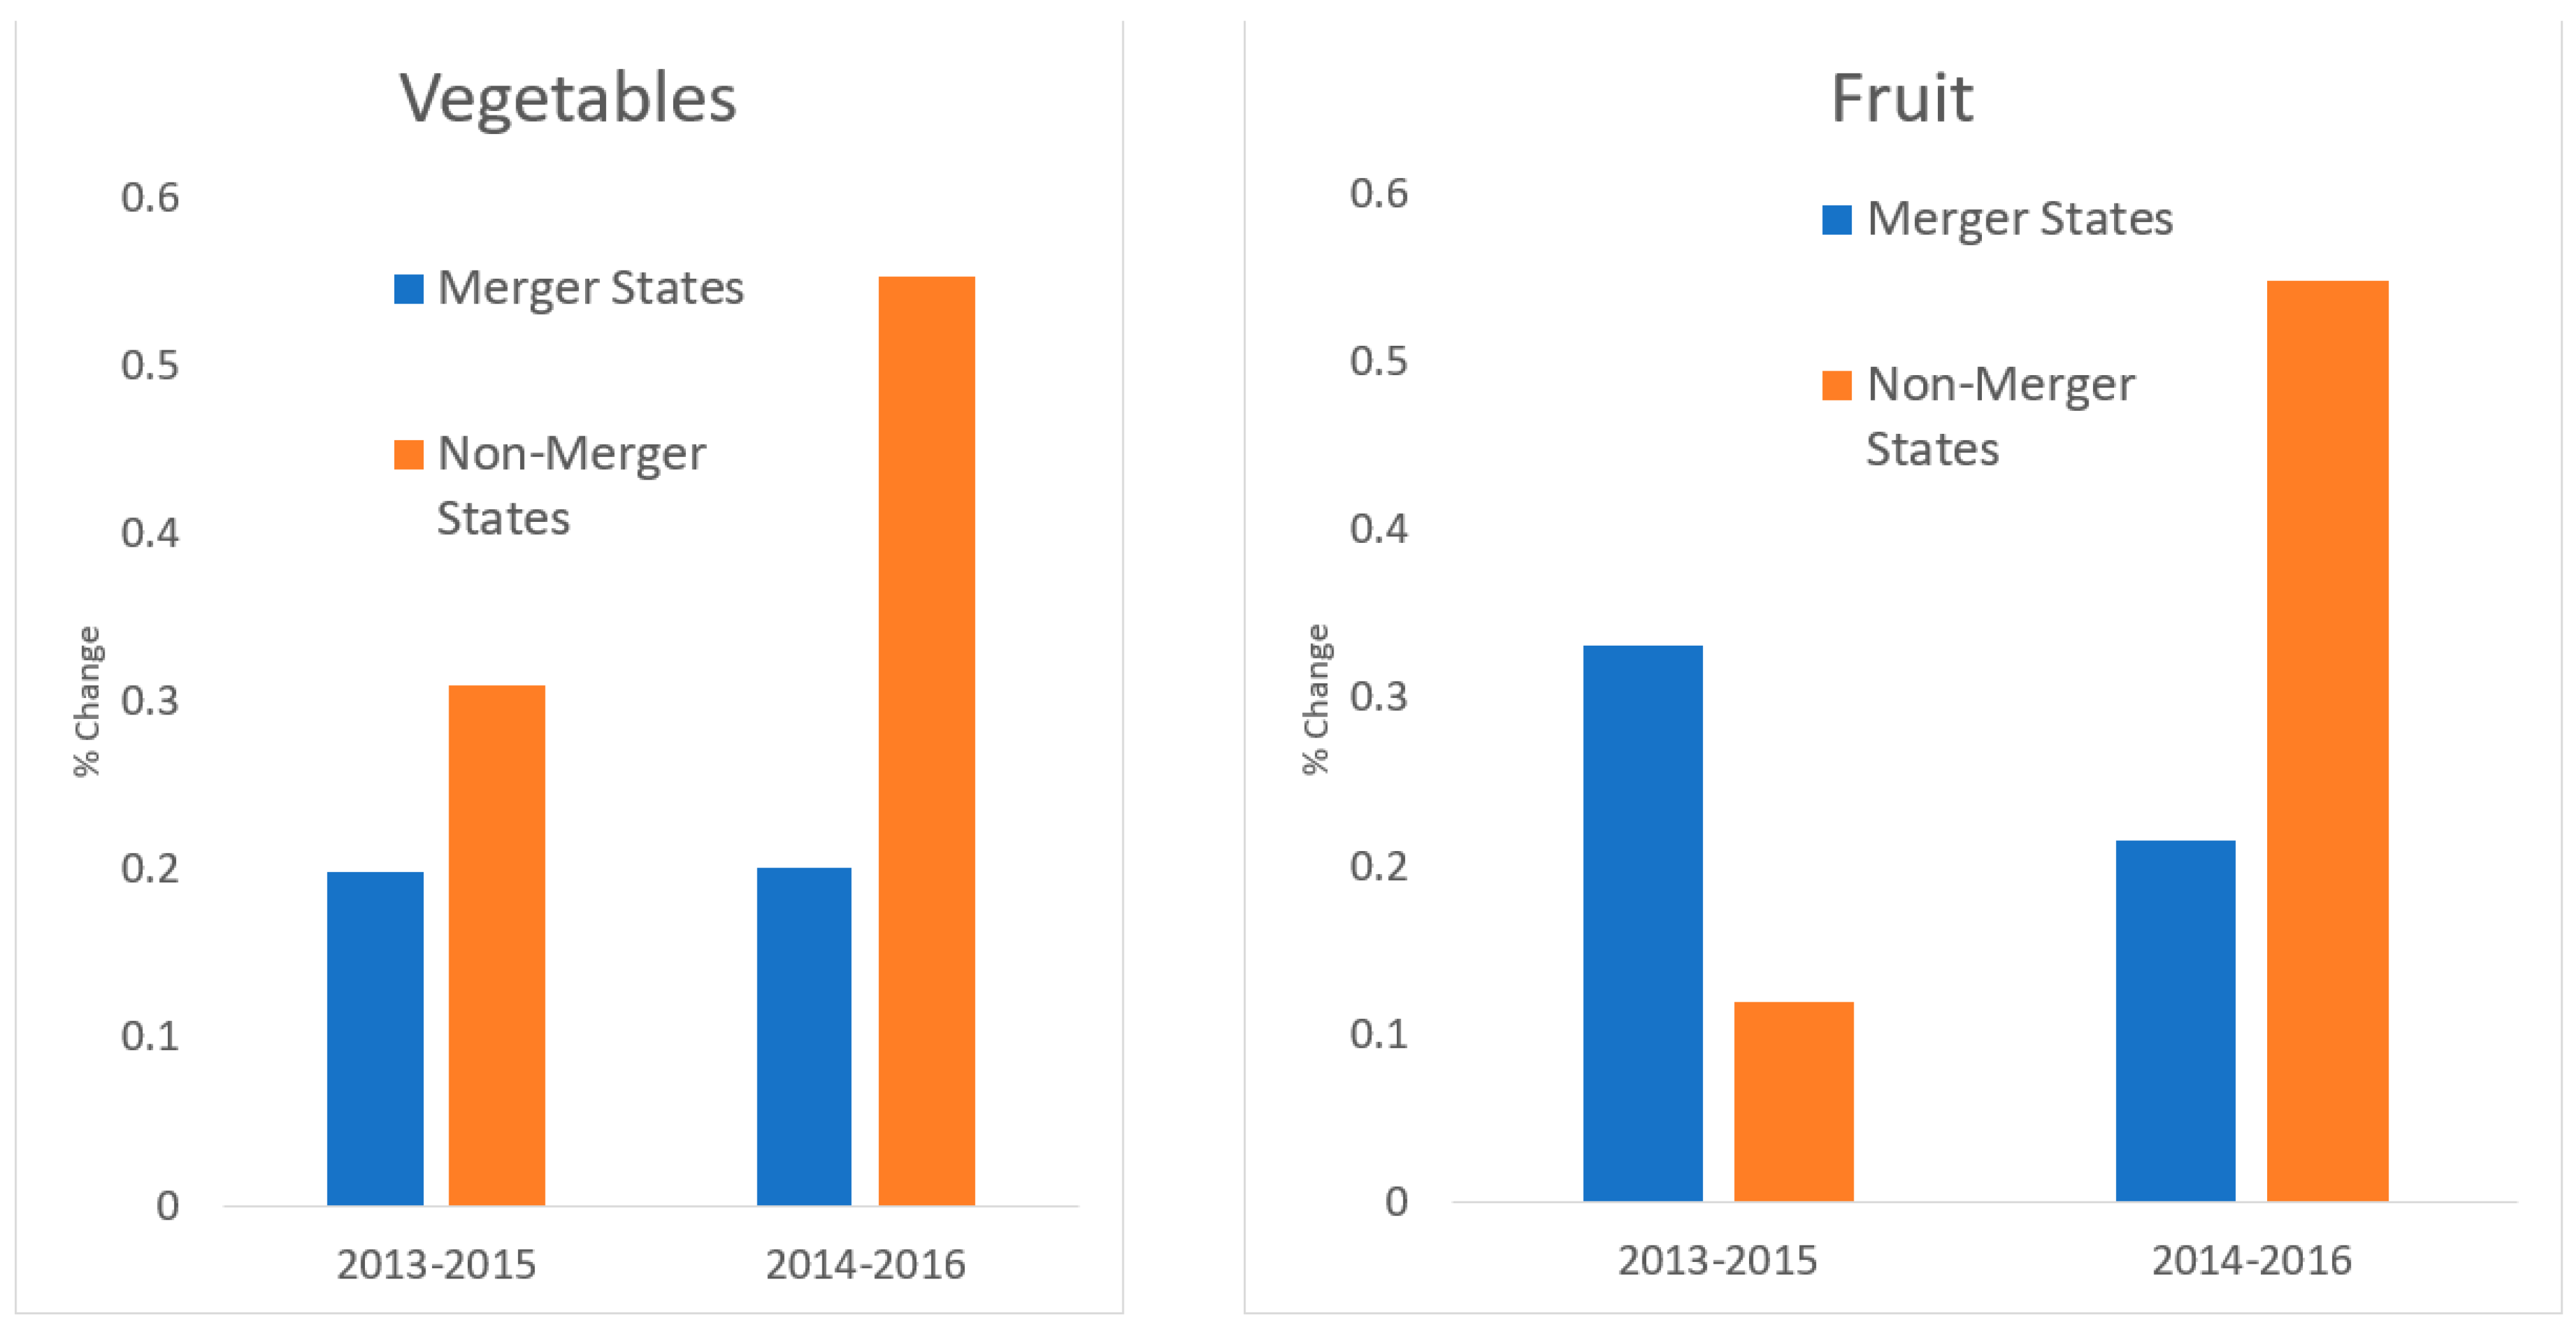
We created a series of variables to measure price changes and volatility in our data. The Safeway–Albertsons merger was finalized in late 2014, and the two companies formally became one in January 2015 [
32]. We calculated two variables to measure the discrete change in farm prices received at the time of the merger, 2013–2015 and 2014–2016, which are the percent changes in the weighted-average prices received between from 2013 to 2015 and 2014 to 2016, respectively. Throughout our discussion, we favor the variable measuring changes from 2014 to 2016. We argue that this more accurately compares prices premerger to postmerger, as the merger was implemented in stores throughout 2015. The 2013 to 2015 comparison is included as an alternative to assess the robustness of the findings with respect to changes in prices received.
To measure variation throughout our analysis, we relied on the coefficient of variation (CV), calculated as the sample standard deviation divided by the sample mean. Thus, higher values imply more volatility. CV 2000–2010 and CV 2011–2020 are the CVs of average prices received, calculated for 2000–2010 and 2011–2020, respectively. The first period was exclusively premerger, while the second may reflect volatility in prices received resulting from the merger. Variable % Change
CV is the percentage change between these two CV variables. Total Commodities is the number of commodities of interest grown by state during our period of study. Avg CV is the average commodity-level CV of prices received for 2013–2020. Total Stores is the number of supermarkets affected by the merger by state. We calculated these by searching for store locations within states using the banners involved in the merger. Lastly, Stores/1000 is the number of merger stores divided by the 2014 state population in 1000s via the U.S. Census [
33]. This is a numerical representation of household access to merger stores.
Table 1 provides summary statistics for all continuous variables. Our measures of price changes and volatility exhibited substantial variation in our dataset. The price change variables ranged from moderate deflation to dramatic inflation, and CV variables ranged from almost no variation to heavy volatility. On average, prices increased more in the 2014–2016 period than in the 2013–2015 period. Overall volatility in prices received increased by an average of 36% more in the decade including the merger than those in the preceding decade. Of the 28 states, 15 sampled for our study featured no stores involved in the merger at all, which facilitated the use of a dummy variable for merger and nonmerger states, which we revisit below.
4. Discussion
Regarding operational transitions resulting from the consolidation, farmers that had existing relationships with Safeway noted significant changes. The merger had obvious impacts to processes and protocols that suppliers needed to follow. Safeway transitioned from having a national buying office that serviced all divisions to the divided structure of Albertsons, in which each division handled their own purchasing, creating a disbursement of people that each supplier needed to work with to sell multiple types of crops to the same organization. There was an entirely new way of doing business with the same organization. Some felt as though processes were streamlined and normalized after the merger, specifically when looking at the transition of working with the Albertsons chain before and after. Several respondents are still experiencing impacts from the merger. These respondents noted misalignment among the divisions which caused complications in building relationships with the organizations.
We investigated the differences in growers that produced fruits versus vegetables. Because many of the respondents produced both fruit and vegetable crops, there were no distinct discrepancies between the responses captured. Expanding the survey to encompass growers that specialized in either sector would provide clarity into the premise addressed earlier in this paper, that vegetable producers are more impacted from M&A activity in the form of an increase of farm-to-retail price spreads.
When approaching the survey responses from a comprehensive perspective, it is evident that most farmers have negative associations with M&As because they limit the farmers’ choice and give unequal power to the buyer. The suppliers that were able to speak to the impacts of the Albertsons and Safeway acquisition felt that it had caused either some level of uncertainty with demand prices received or operational decentralization. The few that indicated that they had seen positive effects acknowledged that any business gained meant business lost for another. It is likely that M&A activity imposes harmful factors beyond a decrease in prices received, such as fluctuations in buying requirements and added costs to the farmers.
Our work with USDA price data is unable to identify impacts owing specifically to the Safeway–Albertsons merger. However, results based on that analysis broadly corroborate the modal findings of the interviews with producers. Moreover, they suggest the possibility that, on average, the merger was associated with lower price received and greater price uncertainty. Both outcomes adversely affect specialty crop growers and are consistent with the generalizations drawn from our interviews with growers in California. The findings motivate further study of this phenomenon, using farm-level indicators and controlling for external factors that could also drive price changes, including costs, demand changes, and marketing channels.
5. Conclusions
This study explores the impacts of a major supermarket merger on upstream specialty crop producers. We undertook a two-part analysis to investigate the issue, focusing on the 2014 merger between Albertsons and Safeway. Our qualitative analysis based on 19 interviews with specialty crop producers revealed that growers typically view M&A activity among buyers unfavorably. Mergers regularly result in uncertainty, lower prices, decreased revenues, lower profitability, higher transaction costs, and more restrictions and requirements required of growers and shippers. Several respondents indicated that the impacts resulting from M&A events can last for years or even indefinitely.
We also analyzed USDA NASS data on farm sector indicators, specifically average prices received. Our work in this respect is exploratory, and we were unable to establish causal impacts of the Safeway–Albertsons merger. We calculated and analyzed production-weighted average prices received across commodities for 28 U.S. states. Results indicated that states featuring supermarkets involved in the merger in many cases saw lower prices received and higher price volatility than those distinct from the merger. Both findings were in line with expectations on the basis of our interviews with growers.
Our study is subject to multiple limitations and, as a result, we are unable to establish causality with any of our findings. The sample size of interviewed growers was relatively small, and they are all located in California. USDA state-level data are not granular enough to measure indicators for individual farms nor to identify impacts owing directly to the merger in question. Our qualitative and quantitative approaches both cannot speak to crop-specific impacts. Lastly, we are unable to measure impacts separately by farm size or type.
Market concentration in food retail garners significant attention in the academic literature, trade association publications, and the popular press, particularly when M&A events are announced. To our knowledge and understanding, much of the interest in market concentration and M&A events centers on food prices and impacts on consumers. Our study is intended to highlight and investigate the potential economic impacts on the upstream production sector, and one of our major objectives is to motivate and inform future research on this topic, which has received limited scholarly attention, to date.
Future research on this topic could investigate a broader set of M&A events in food retail and wholesaling to develop generalized facts about upstream economic impacts. Farm-level data would facilitate research on the impacts of M&A activity on farm revenues, profits, and prices received. Larger and more granular data would also allow for the testing of impacts that may vary geographically or by agricultural commodity.


