Article

Spatial Solutions and Their Impacts When Reshuffling Coastal Management Priorities in Small Islands with Limited Diversification Opportunities

by
Laure Vaitiare André
1,2,*,
Simon Van Wynsberge
3,
Mireille Chinain
4,
Clémence Mahana Iti Gatti
4,
Vetea Liao
5 and
Serge Andréfouët
1
1
IRD Institut de Recherche pour le Développement—France, UMR 9220 Entropie (Institut de Recherche pour le Développement—France, Université de la Réunion, Université de la Nouvelle-Calédonie, Ifremer, Centre National de la Recherche Scientifique), BP A5, CEDEX, 98848 Nouméa, New Caledonia
2
ED 129, SU Sorbonne Université, 21, Rue de L’école de Médecine, 75006 Paris, France
3
Ifremer Institut Français de Recherche pour l’Exploitation de la Mer, UMR 9220 Entropie (Institut de Recherche pour le Développement—France, Université de la Réunion, Université de la Nouvelle-Calédonie, Ifremer, Centre National de la Recherche Scientifique), BP A5, CEDEX, 98848 Nouméa, New Caledonia
4
ILM Institut Louis Malardé, Laboratoire des Biotoxines Marines, UMR 241 EIO (Ifremer, Institut Louis Malardé, Institut de Recherche pour le Développement, Université de la Polynésie française), BP 30, 98713 Papeete, Tahiti, French Polynesia
5
DRM Direction des Ressources Marines, Fare Ute, BP 20, 98713 Papeete, Tahiti, French Polynesia
*
Author to whom correspondence should be addressed.
Sustainability 2022, 14(7), 3871; https://doi.org/10.3390/su14073871
Submission received: 28 February 2022 / Revised: 18 March 2022 / Accepted: 18 March 2022 / Published: 25 March 2022
(This article belongs to the Special Issue Planning for a Sustainable Marine Future)

Abstract

:
In small islands, the potential for new coastal activities and management options are often spatially limited. To reduce dependence on external factors and increase the resilience of populations to global changes and fluctuations in international markets, a recommended pathway is to diversify activities. We used a systematic prioritization tool with single and multiobjective zoning to explore the feasibility of scenarios at various levels of spatial diversification in the Gambier lagoon (French Polynesia), where black pearl culture is economically and spatially dominant. Local managers are committed to economic, livelihood, and environmental sustainability and agree that prioritizing both artisanal fisheries, which provide local food security, and ecosystem conservation should also be considered. Diversification options included the optimized reallocation of farming concessions and the identification of different types of conservation areas while taking into account traditional management areas. The scenarios were set to minimize surface areas and loss of access to existing fishing grounds. The solutions were compared between the scenarios with different cost metrics, allowing further discussions with stakeholders and managers. The Gambier case study shows that exploring diversification options in small islands using systematic prioritization tools can provide local managers with tailor-made plans adapted to island development questions.

Graphical Abstract

1. Introduction

Globally, marine ecosystems harbor high biodiversity and provide vital services to humans. This is particularly true in small islands, where communities are highly dependent on marine resources [1,2]. Coastal ecosystems also face significant local and global pressures and degradation [3,4,5]. Coastal management has evolved globally during the past decades toward more integrated approaches [6], as there is increasing evidence that a better articulation between human activities and conservation helps mitigate impacts on ecosystems and eventually improve benefits for human society.
In small islands, human uses of coastal areas are multiple, generally including recreational, food security, and income-generating activities such as tourism, transport, fisheries, or aquaculture. These activities are often dependent on global markets and can fluctuate due to external factors such as politics, transport issues, climate change, shortage of resources in isolated areas, and pandemic situations [7]. Local factors such as ecosystem health and productivity can also directly affect these activities. These risk factors greatly threaten the sustainability of the activities and underline the vulnerability of populations, especially when the community is organized around a single activity [8].
Diversifying the range of activities is one way to ensure community well-being, income, and resilience to global disruptions and risks [9,10,11]. For instance, in Asia, managing to maintain seaweed culture along with touristic zones is a precautionary backup activity to balance tourism fluctuations and mitigate the risks of economic and livelihood collapse [12]. Securing space and time for multiple activities, including artisanal fisheries, also provides essential services to the communities, such as food security [13,14].
In small islands, different activities can quickly compete for the same resources, which can generate spatial conflicts. Local management authorities, through public inputs, must in these situations establish plans for wise, equitably shared, and accepted use of coastal domains. Activities that easily come into conflict include, for instance, conservation and extractive activities, such as fishing. Local managers and stakeholders need to consider local conservations priorities in order to protect efficiently representative habitats and threatened species or those deemed of interest. In fact, in many places, pressing conservation issues have been the catalyzers for spatial plans [15].
Conflicts for space can be driven by competing economic factors but also by natural barriers, which can be very localized. This is the case, for example, for ciguatera poisoning, which is leading to restrictions in reef fisheries in many tropical islands, particularly in the Pacific. Ciguatera is caused by a dinoflagellate microalgae whose toxins accumulate in the marine food web. This can cause mild to severe poisoning in human consumers and lead to serious threats to food safety [16]. Hence, fishers tend to avoid ciguatera prone fishing areas, and ciguatera may quickly limit the implementation of diversification options for fishery extension. This example points to the fact that while motivations for diversification can be broad (vulnerability to global markets, etc.), solutions can be impaired by very specific local factors. As often said, local solutions to globally generated problems can be very specific, and this is particularly acute in the case of small islands.
To help define spatial management plans, marine spatial planning can offer efficient ways to explore solutions. Marine spatial planning, which is advocated by the Intergovernmental Oceanographic Commission of the UNESCO [17], has proved useful in many different contexts to several nongovernmental organizations and governance entities (from local to national). A special field of Marine Spatial Planning, the Systematic Conservation Planning (SCP), is a data-driven optimization approach that allows for the identification of the best objective–cost compromises in the selection of priority sites [18]. Minimizing the socioeconomic costs generated by the management plan to local communities is deemed necessary to increase the acceptability of the plans and compliance of the populations while best meeting their needs. Several planning toolboxes are available and widely used, including Marxan© and its extensions [19,20], Zonation© [21], C-Plan© [22], and Prioritizr© R package [23]. Among the available options is a multiobjective zoning approach which allows identifying within the same plan, different management zones with different status, such as strict protection with no access, recreational zones with no extractive activity, areas dedicated to aquaculture, and open zones. Incentives to design such multizone spatial plans can be prompted by new economic interests and constraints, such as sustainable aquaculture development [24] or the will to strengthen coral reef connectivity and resilience to global warming [25].
The value of SCP approaches in the case of communities willing to or forced by the circumstances to shift into diversification of activities is certainly critical. Yet, to the best of our knowledge, besides the classical planning for fisheries and conservation, few case studies exist on planning for diversification strategies in the context of small islands (but see [25,26] in continental European contexts). In this case, SCP objectives would be to maximize spatial uses without generating conflict, and conservation per se may not be a priority, although the plan can also include objectives on biological and fishery stock conservation [27]. Other criteria can include prioritization to maintain or enhance existing activities with good environmental practices while allowing the development of other activities, either new or more traditional ones such as fisheries. Specifically, in small tropical islands such as atolls and volcanic islands with steep slopes, usable land area and resources are generally limited, and only marine areas offer viable diversification pathways. Nevertheless, marine spaces that most island communities are able to access easily are mainly restricted to shallow coastal areas, which are relatively narrow and with limited carrying capacity. Thus, maintaining livelihood sustainability is capital, but limited space is a challenge [28,29]. A systematic conservation planning approach can be instrumental in helping to plan for it.
Herein, we demonstrate, through a South Pacific island case study, an original application of SCP to devise the diversification of activities in an island initially strongly devoted to aquaculture, i.e., black pearl farming. This activity has now spatially reached its maximum capacity while at the same time the international trade has decreased, partly due to the COVID-19 pandemic. At the request of the local stakeholders and governance entities (meeting in November 2019 and web workshop in October 2020), we propose to explore zoning plans integrating new priorities. These include spatial reshuffling of the currently overextensive pearl-farming concessions with a downwards revised maximum coverage limit, integration of pearl oyster-restocking sanctuaries, and, importantly, the possibility to leave more grounds for traditional fishing, should this ongoing activity gain momentum in the near future. Local specific environmental factors (ciguatera-prone areas, habitat quality, and remarkable biodiversity) are also at play in a multiobjective zoning, either as areas to include or as areas to avoid in light of the pearl-farming objectives. Finally, we discuss the lessons learned from this case study about the broad issues of spatial implications of diversification of the activities, which is crucial in contexts with low potential for occupational diversity.

2. Materials and Methods

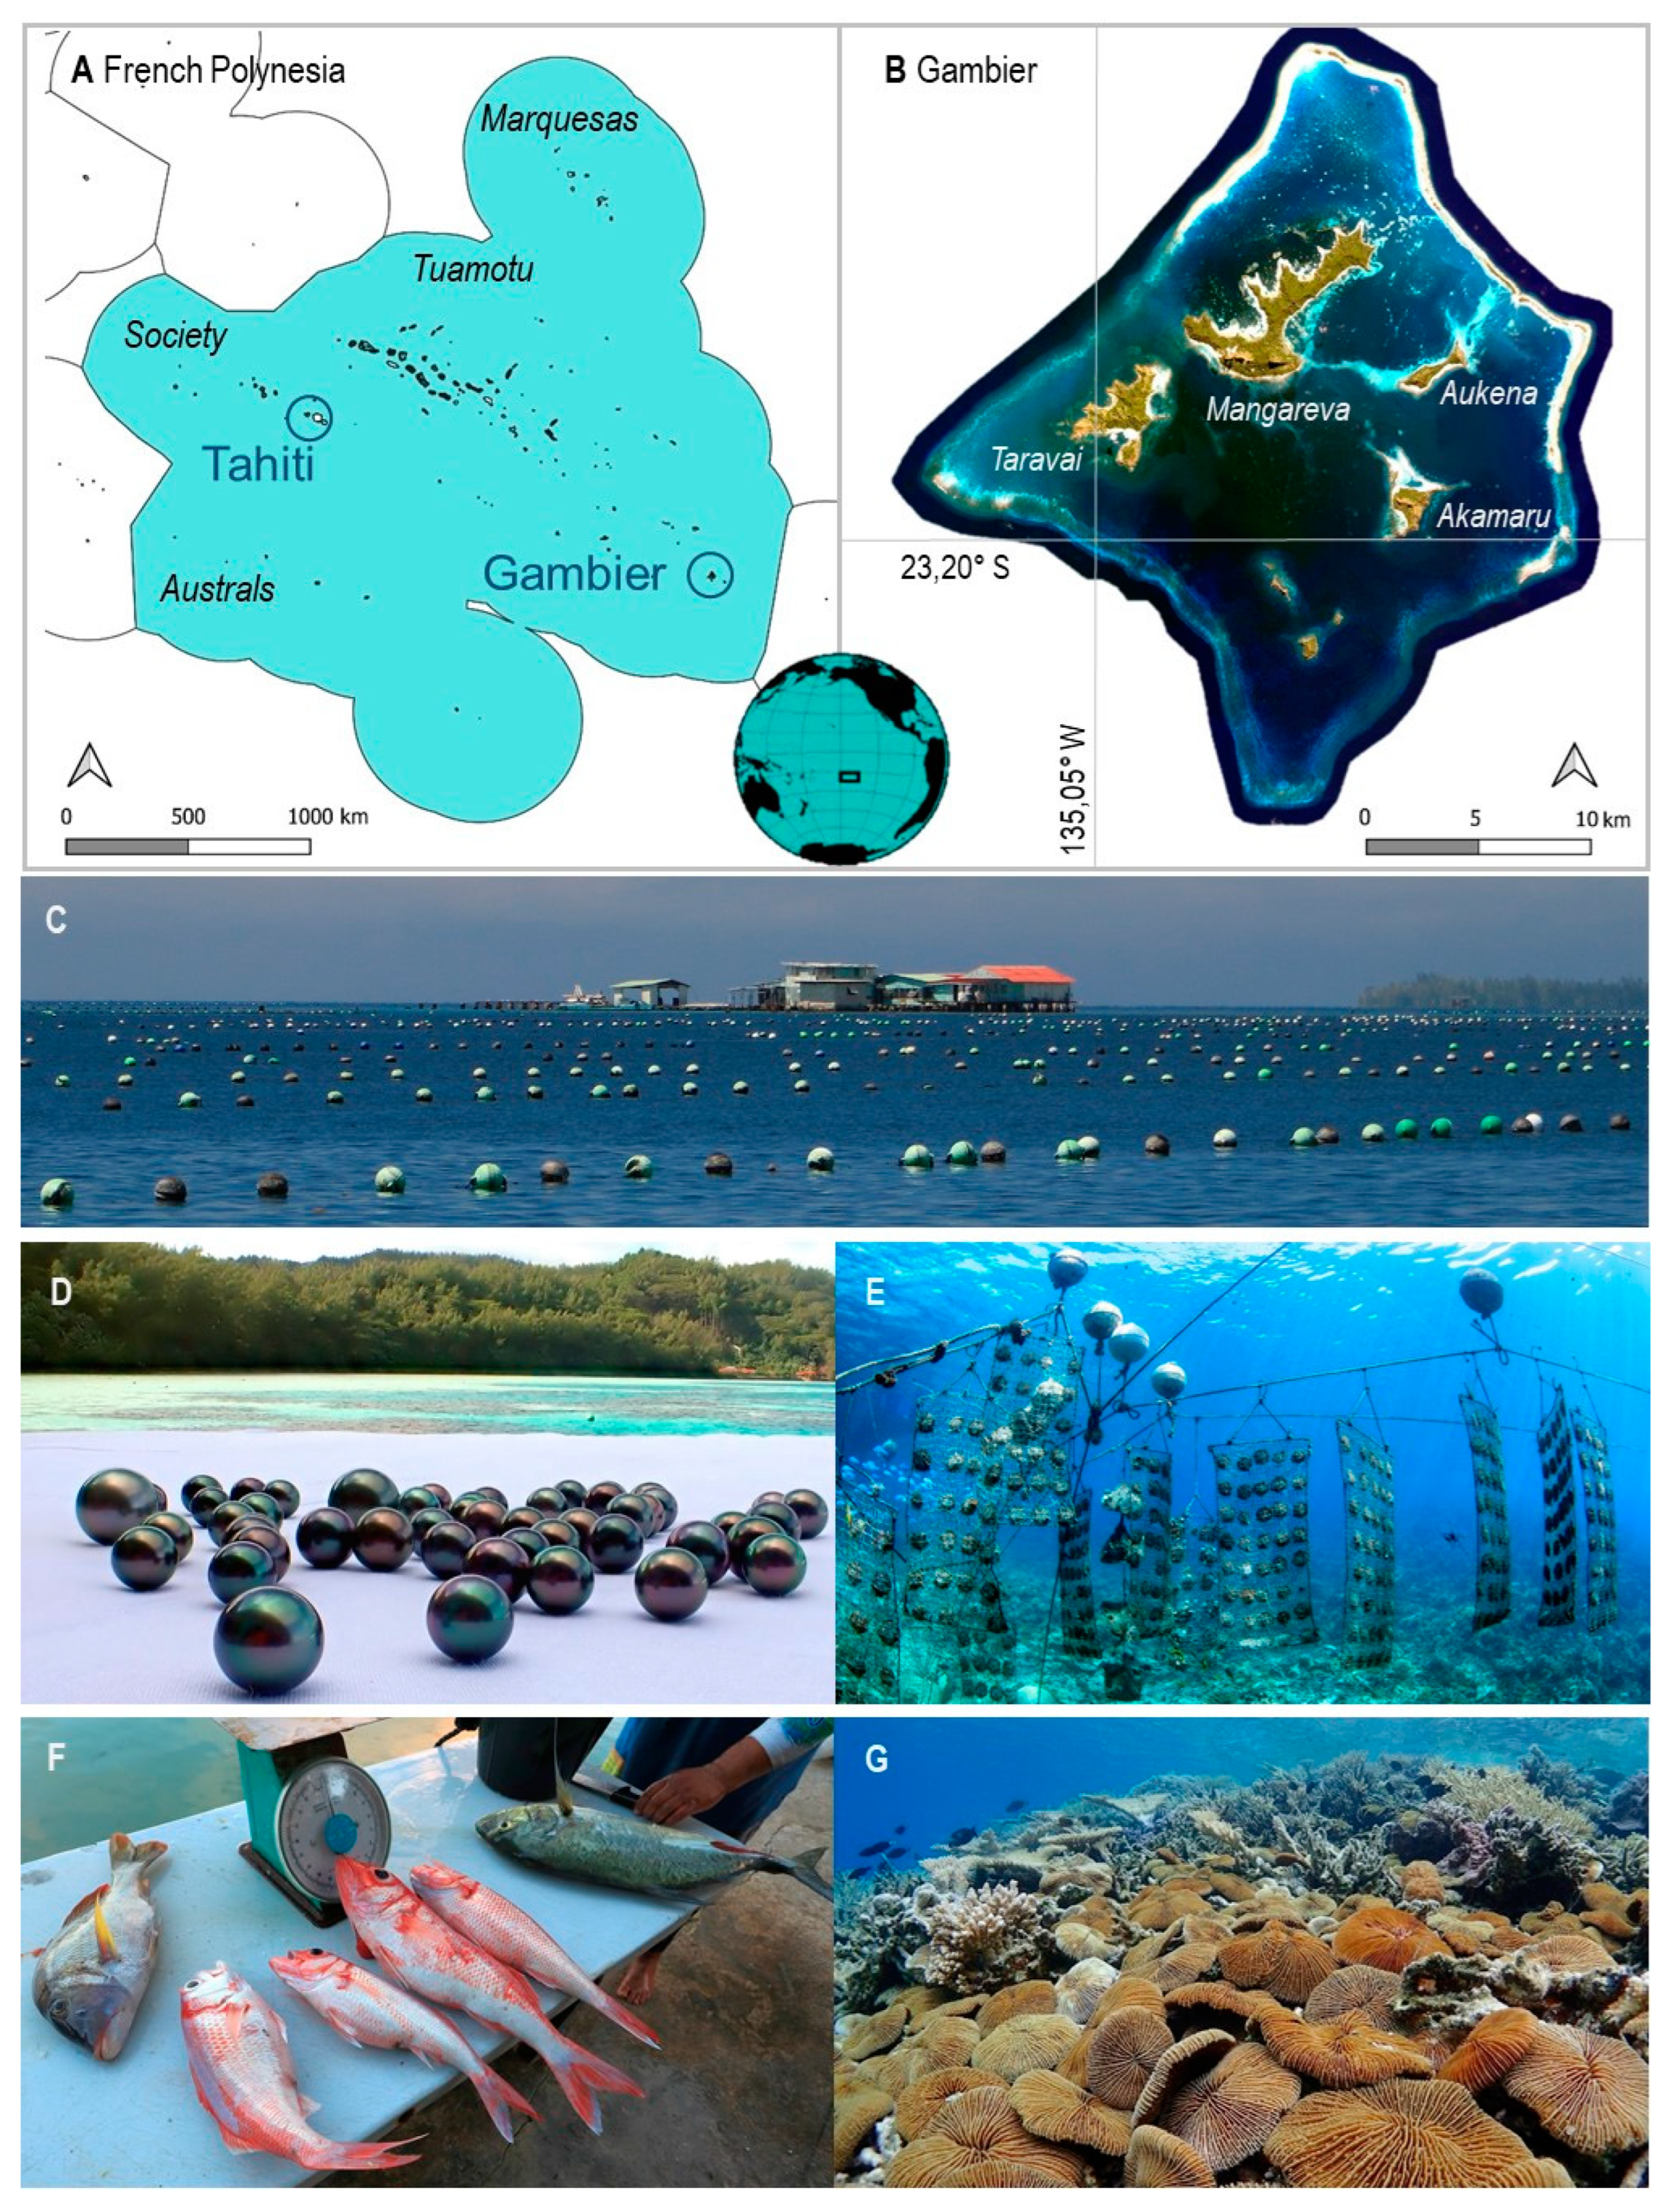
2.1. Pearl Oyster Farming in French Polynesia

We base our study on the case of pearl oyster Pinctada margaritifera farming as a key income-generating activity in French Polynesia. In the 1960s, the government promoted programs to produce cultured black pearls, following practices already in use in Asia. The trials were successful, and pearl production grew exponentially in the 1980s and 1990s due to initial high prices that quickly made pearl farming the second source of income in French Polynesia, after tourism [30]. However, financial gains for individual farmers soon dropped because of overproduction, dramatic drops in selling prices, and anarchic sales; consequently, the whole sector has been in crisis for more than 20 years now. For now, pearl farming remains a valuable resource but is dependent on many factors, from international market fluctuations to local government decisions, not to mention lagoon environmental disturbances causing mass mortalities in oysters.
In a nutshell, it usually takes three to four years to reach a high-quality pearl production, and this includes two distinct activities: (i) spat (juvenile) collection and (ii) oyster (adult) farming. Harvesting wild adult oysters is not permitted in French Polynesia in order to preserve the wild stocks, which provide spats that are further collected on lines of collectors deployed in the water column in locations where larvae are empirically known to accumulate. However, the success of spat collection remains erratic both temporally and spatially and depends on the abundance of reproductive wild oyster stock in the lagoon, hydrodynamic circulation, and suitable environmental conditions at all life stages of oysters [31]. Further, oyster farming includes: (i) managing spat growth until reaching maturity to be grafted, (ii) grafting of bead nucleus, (iii) monitoring the growth of grafted stocks until, eventually, (iv) pearl harvesting. These steps take place in central working buildings on stilts above the lagoon and require marine concessions leased by the government. Lagoon space is thus a critical resource for such activities. The public technical service, the Direction des Ressources Marines (DRM), controls the farming areas through the delivery of these marine concessions, which are subject to an annual fee. Conversely, spat collecting lines can generally be deployed anywhere in lagoon areas.
The current pearl market crisis and environmental risks linked to mass mortality events [32] prompted DRM to manage the pearl-farming activity with a view to improving the sustainability of both farmers’ income and ecosystem quality. This strategy translates into a reduction of the exploited surface areas to give priority to quality over quantity in order to eventually reduce production and pressure on the exploited lagoon ecosystems. An additional measure is the restocking of the lagoon with the adult oysters available following pearl harvesting, preferably at high density in favorable, dedicated areas to maximize reproduction and, eventually, ensure sustainable spat collection. In parallel, decreasing pearl-farming pressure on the ecosystems is expected to benefit other activities such as artisanal fisheries, as well as favor the establishment of conservation zones.

2.2. Specificities of the Gambier

Gambier is among the 31 islands of Tuamotu, Gambier, and Society’s archipelagos, where spat collection and pearl oyster-farming activities take place. Gambier is located at 135° W longitude and 23.20° S latitude, at 1650 km from Tahiti, the main island in French Polynesia (Figure 1). It is a small archipelago with seven high islands within a single lagoon of 486 km2 bordered by a discontinuous barrier reef. The Gambier lagoon study area extends from the various island coastlines to the barrier reef crest. Not all islands are inhabited, and Mangareva Island is home to the majority of the 1530 inhabitants, 377 households (based on the 2017 census). The lagoon is one of the most complex ones across all French Polynesia because of the diversity of its geomorphological and benthic habitats, which include remarkable live coral assemblages and notably Fungia spp. communities that are unique in French Polynesia [33,34].
The Gambier is the most productive pearl-farming island (with 1.7 million pearls in 2020, i.e., more than 25% of the country’s production [35]). Spat collecting remains successful to date, and the lagoon still presents a significant stock of wild P. margaritifera oysters, although limited to several locations nearby the center of the lagoon (Andréfouët et al., in prep.). Unlike most other lagoons in Gambier, collecting is authorized only in a single but quite large area known to be generally productive. Some Gambier’s pearl producers organized themselves into an economic interest group committed towards the best quality. They are keen on managing the sustainability of the activity.
As in many Pacific Ocean tropical Islands, fishing is widespread in Gambier [13,15]. However, ciguatera poisoning outbreaks have also occurred in Gambier, and it still represents a significant issue [16]. Ciguatera causative agent is a dinoflagellate in the genus Gambierdiscus, actually named after the Gambier Islands, where it was first discovered [36]. Consequently, local fishers are particularly aware of ciguatera risk, and local knowledge on areas and species at risk is an important driver for fishing ground selection, based on personal perception and shared information about previous poisoning events [16]. Today, the whole lagoon area is theoretically open to fisheries, but in practice, some areas are less fished or totally avoided and, therefore, are de facto ‘protected’ due to the risk of ciguatera.
In addition, in the past, Gambier inhabitants used to temporarily ban fishing, including wild oyster harvest, in rotating delimited areas (a practice named rāhui in Polynesia [37]). This was deemed necessary to sustain fishery resources in difficult times and in preparation for special events requiring many catches. The four historical traditional management areas around Mangareva Island are still vivid in the inhabitant’s memory. Lagoon users and the general population would strongly welcome and endorse a revival of these traditions. Building upon this, DRM proposed to implement oyster-restocking programs in specific subareas within these four traditional areas and prohibit the fishing of any resources in these oyster sanctuaries.

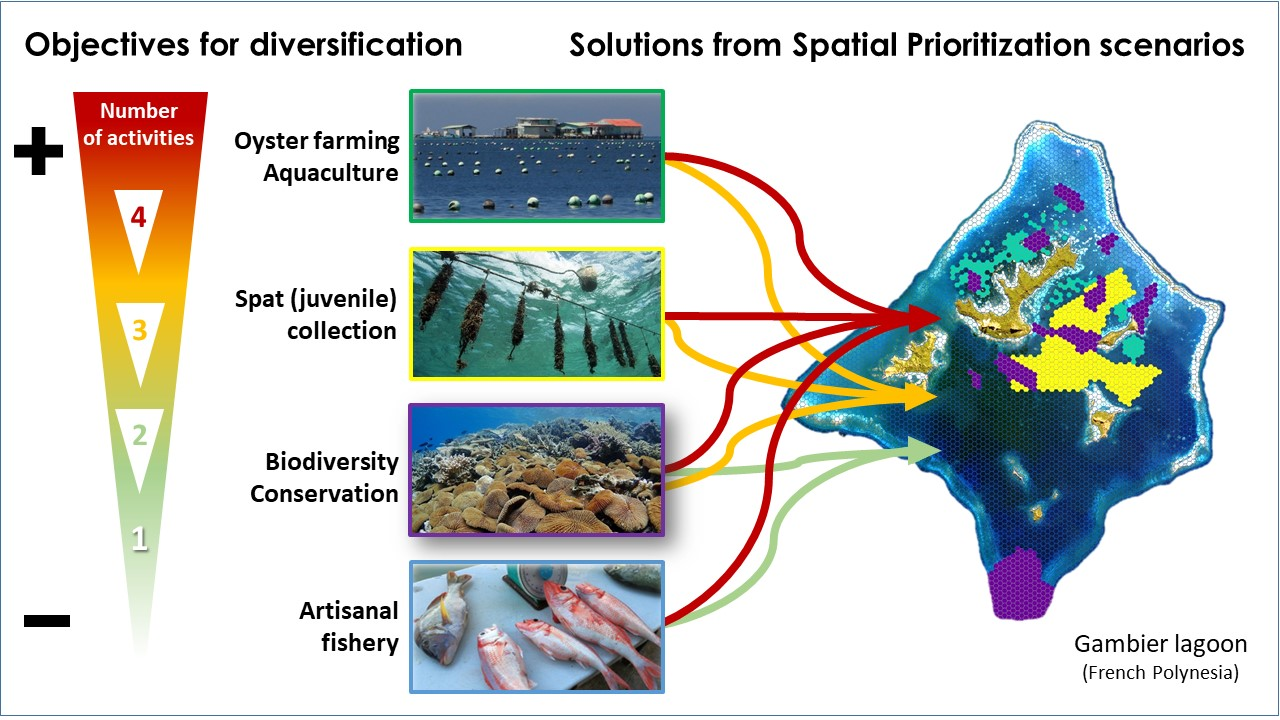
2.3. Diversification Objectives and Study Design

In the Gambier lagoon, inhabitants must live and work in an area that currently prioritizes black pearl production for the international jewelry market, but where artisanal fisheries also take place (mainly subsistence fishing) despite the threat linked to the risk of ciguatera poisoning in some fishing grounds. DRM wishes to explore options away from this ‘business-as-usual’ situation by reducing the extent of areas devoted to pearl farming per se (i.e., spat collection and farm concessions) in favor of more areas dedicated to other activities, including fishing, wild oyster sanctuaries, oyster restocking, and conservation.
According to the different options to test, specific objectives and costs were set for each scenario using SCP. In such an approach, the costs, i.e., the constraints to minimize, were either the surface area of the zone concerned or the opportunity cost to fishers due to the loss of fishing grounds, sensu Naidoo et al. [38].
The principles of the different scenarios are presented in Table 1. Practically, we defined the present situation as a ‘business-as-usual’ scheme (BAU). Then, we considered two systematic multizone prioritization problems, setting up scenarios under a diversification perspective (Table 1). The first one gave priority to the current pearl-farming income-generating activity, but with farming concessions, surface areas lowered to a maximum of 1500 ha (as per DRM specifications) while considering conservation as the first degree of diversification (Scenario 1). The second prioritization scenario was similar to the first one but also considered fisheries as a second degree of diversification while also mitigating ciguatera risk (Scenario 2). Finally, a ‘back-to-tradition’ scenario focused only on fisheries and conservation by banning any pearl-farming activities (Scenario 3). This last scenario was conceived as a one-zone systematic prioritization problem.
In essence, our range of scenarios aims to assess the feasibility of moving away from a lagoon that has reached its maximum farming capacity while taking into account a range of necessary zones devoted to conservation and fisheries. Since fishery is the economic and subsistence diversification pathway that locals and managers are keen to consider in the event of a collapse of pearl-farming activity, hence the new zones are also computed to avoid impacting the fishers’ current usage of the lagoon (in Scenarios 2 and 3), taking into account current practices to avoid ciguatera-prone areas. In other words, productive fishing areas and ciguatera-free areas should be prioritized as fishing zones and not be dedicated to other zones (farming or conservation) as much as possible.

2.4. Collection of Spatial Data and Aggregation by Planning Unit

Several spatially explicit data layers of the high spatial resolution were collected, updated, or created de novo with regards to marine biodiversity, pearl oyster exploitation, artisanal fisheries, and ciguatera risk (Table 2):
  • Layer 1: A habitat map of high thematic resolution with 77 geomorphologic and benthic classes, from resampled QuickBird and IKONOS imagery at 4 m. resolution spatial imagery. This product is an original work made for this study following recent benthic surveys performed in 2019–2020. It was built following the Millennium Coral Reef Mapping Project principles [39,40], with a hierarchical classification scheme describing the first three levels of detailed geomorphological features, followed by, when suitable for our scenario, benthic information, in particular the type of coral communities. This Gambier habitat map included 7 classes of coarse geomorphological description at level 1 and up to 77 classes at level 5, the finest level of description mixing fine geomorphology and benthic coral information;
  • Layer 2: A refined map of fishing grounds established from a map-based questionnaire survey completed by 42 artisanal fishers conducted in November 2019. The sampling strategy was conducted according to [41], and key informants were identified among the most active fishers, recommended by other fishers and the town hall staff, or randomly met all around the main island in order to represent the inhabited area distribution. As a conservative estimation of the representativity of the sampling, the 42 interviews among the 377 households thus represented at 11% sampling, based on the general pattern of one main active fisher/fishery activity per household, or less, in the case of Gambier pearl farming oriented context. Each fishing ground was characterized by an annual level of catch. Using GIS tools, each fishing ground delimitation was then refined according to the limits of the geomorphological features that were compatible with a given fishing gear, following the methodology detailed in [41] (for example, all speargun fishing grounds were redrawn more precisely by eliminating soft-bottom and areas > 30 m deep);
  • Layer 3: A ciguatera risk map established from local knowledge on poisoning events and areas regarded at risk of ciguatera. This information was collected during the same survey as the fishery survey. This also followed the methods described in [41] by giving an increasing risk coefficient to the zones identified by fishers, from areas simply avoided by precaution (coefficient = 1) to areas with proven risk, i.e., reported in actual ciguatera poisoning cases, with areas involved in the most recent poisoning events being assigned the highest coefficient (i.e., 10). Another series of ciguatera data derived from a fish toxicity survey on fish samples conducted in 2017 in various Gambier fishing areas by Institut Louis Malardé (HT. Darius, unpublished data);
  • Layer 4: a wild oyster stock abundance map, achieved from a density survey conducted between 0 and 30 m depth in 64 stations monitored by SCUBA in November 2019 and February 2020 (Andréfouët, Liao, unpublished data), then generalized to the whole lagoon according to the distribution of densities per type of mapped habitats (from Layer 1) and depth (as in [42]);
  • Layer 5: a map of the area reserved for spat collection by legal decree, from the DRM GIS database;
  • Layer 6: a map of the existing concessions authorized for pearl oyster farming as of 2019, from the DRM GIS database;
  • Layer 7: a map of the boundaries of the four traditionally managed sectors, provided by DRM.
Then, the study area was segmented by a regular grid of hexagonal planning units (PUs). This shape presents an optimal ratio between the surface area and boundary length [43]. The planning unit size was 10 ha to best fit the mean data spatial variations [44], in particular the mean concession size in Gambier. Since all data need to be aggregated under the set of PUs for the prioritization scenario, the spatial resolution of the analysis thus corresponds to the PU sizes. Aggregation can refer to a specific algebraic operation (sum, average, weighted sum, etc.), as detailed below for each set of data. Four additional layers were produced, following the data aggregation per PU (Table 2):
  • Layer 8: A fishery catch map, representing for each PU the sum of catches from all individual refined fishing grounds intersecting the PU [41,45]. This layer is used as opportunity cost, i.e., it quantifies the opportunity that is lost for fishers if PUs are closed to fisheries;
  • Layer 9: A combined ‘fishery–ciguatera’ index map, used as a cost layer. This layer was based on the fishery catch map (Layer 8) modulated by the ciguatera risk map as in André et al. [41]. In short, for a given level of catch found in a given PU, its fishery opportunity cost was lowered proportionally to the increased risk of ciguatera for that same PU. Amount of catch and coefficient of ciguatera risk per PU were first normalized over the domain and then combined following the method developed in [41], with a relative coefficient weight for ciguatera of a = 0.25;
  • Layer 10: Oyster-restocking zones were identified within the four traditionally managed (rāhui) sectors. The areas for oyster restocking were constrained to (i) remain below 10 % of the surface area of each sector (Layer 7), (ii) include habitat typically favorable for oysters (i.e., hard-bottom geomorphological unit, according to the habitat map (Layer 1) at geomorphological resolution level 2), and (iii) avoid existing farm concessions (Layer 6). The restocking areas result from a simple layer superposition, eventually representing 160 to 760 ha per traditional zone;
  • Layer 11: A farm suitability index aiming at guiding the selection of optimal places to relocate farming concessions taking into account the farming history. For each PU (i), the farm suitability index (S) was defined as the surface area of geomorphological features suitable for oyster concessions (Fs) (i.e., all features classes except shallow barrier reef exposed to oligotrophic oceanic water and shallow fringing reef, see class list in Supplementary Materials). Since existing concessions are easy to access (a short distance from shore) and benefit from already built infrastructures, the surface area of existing concessions (Es) was also considered, following Equation (1):
    S i = F s i + E s i

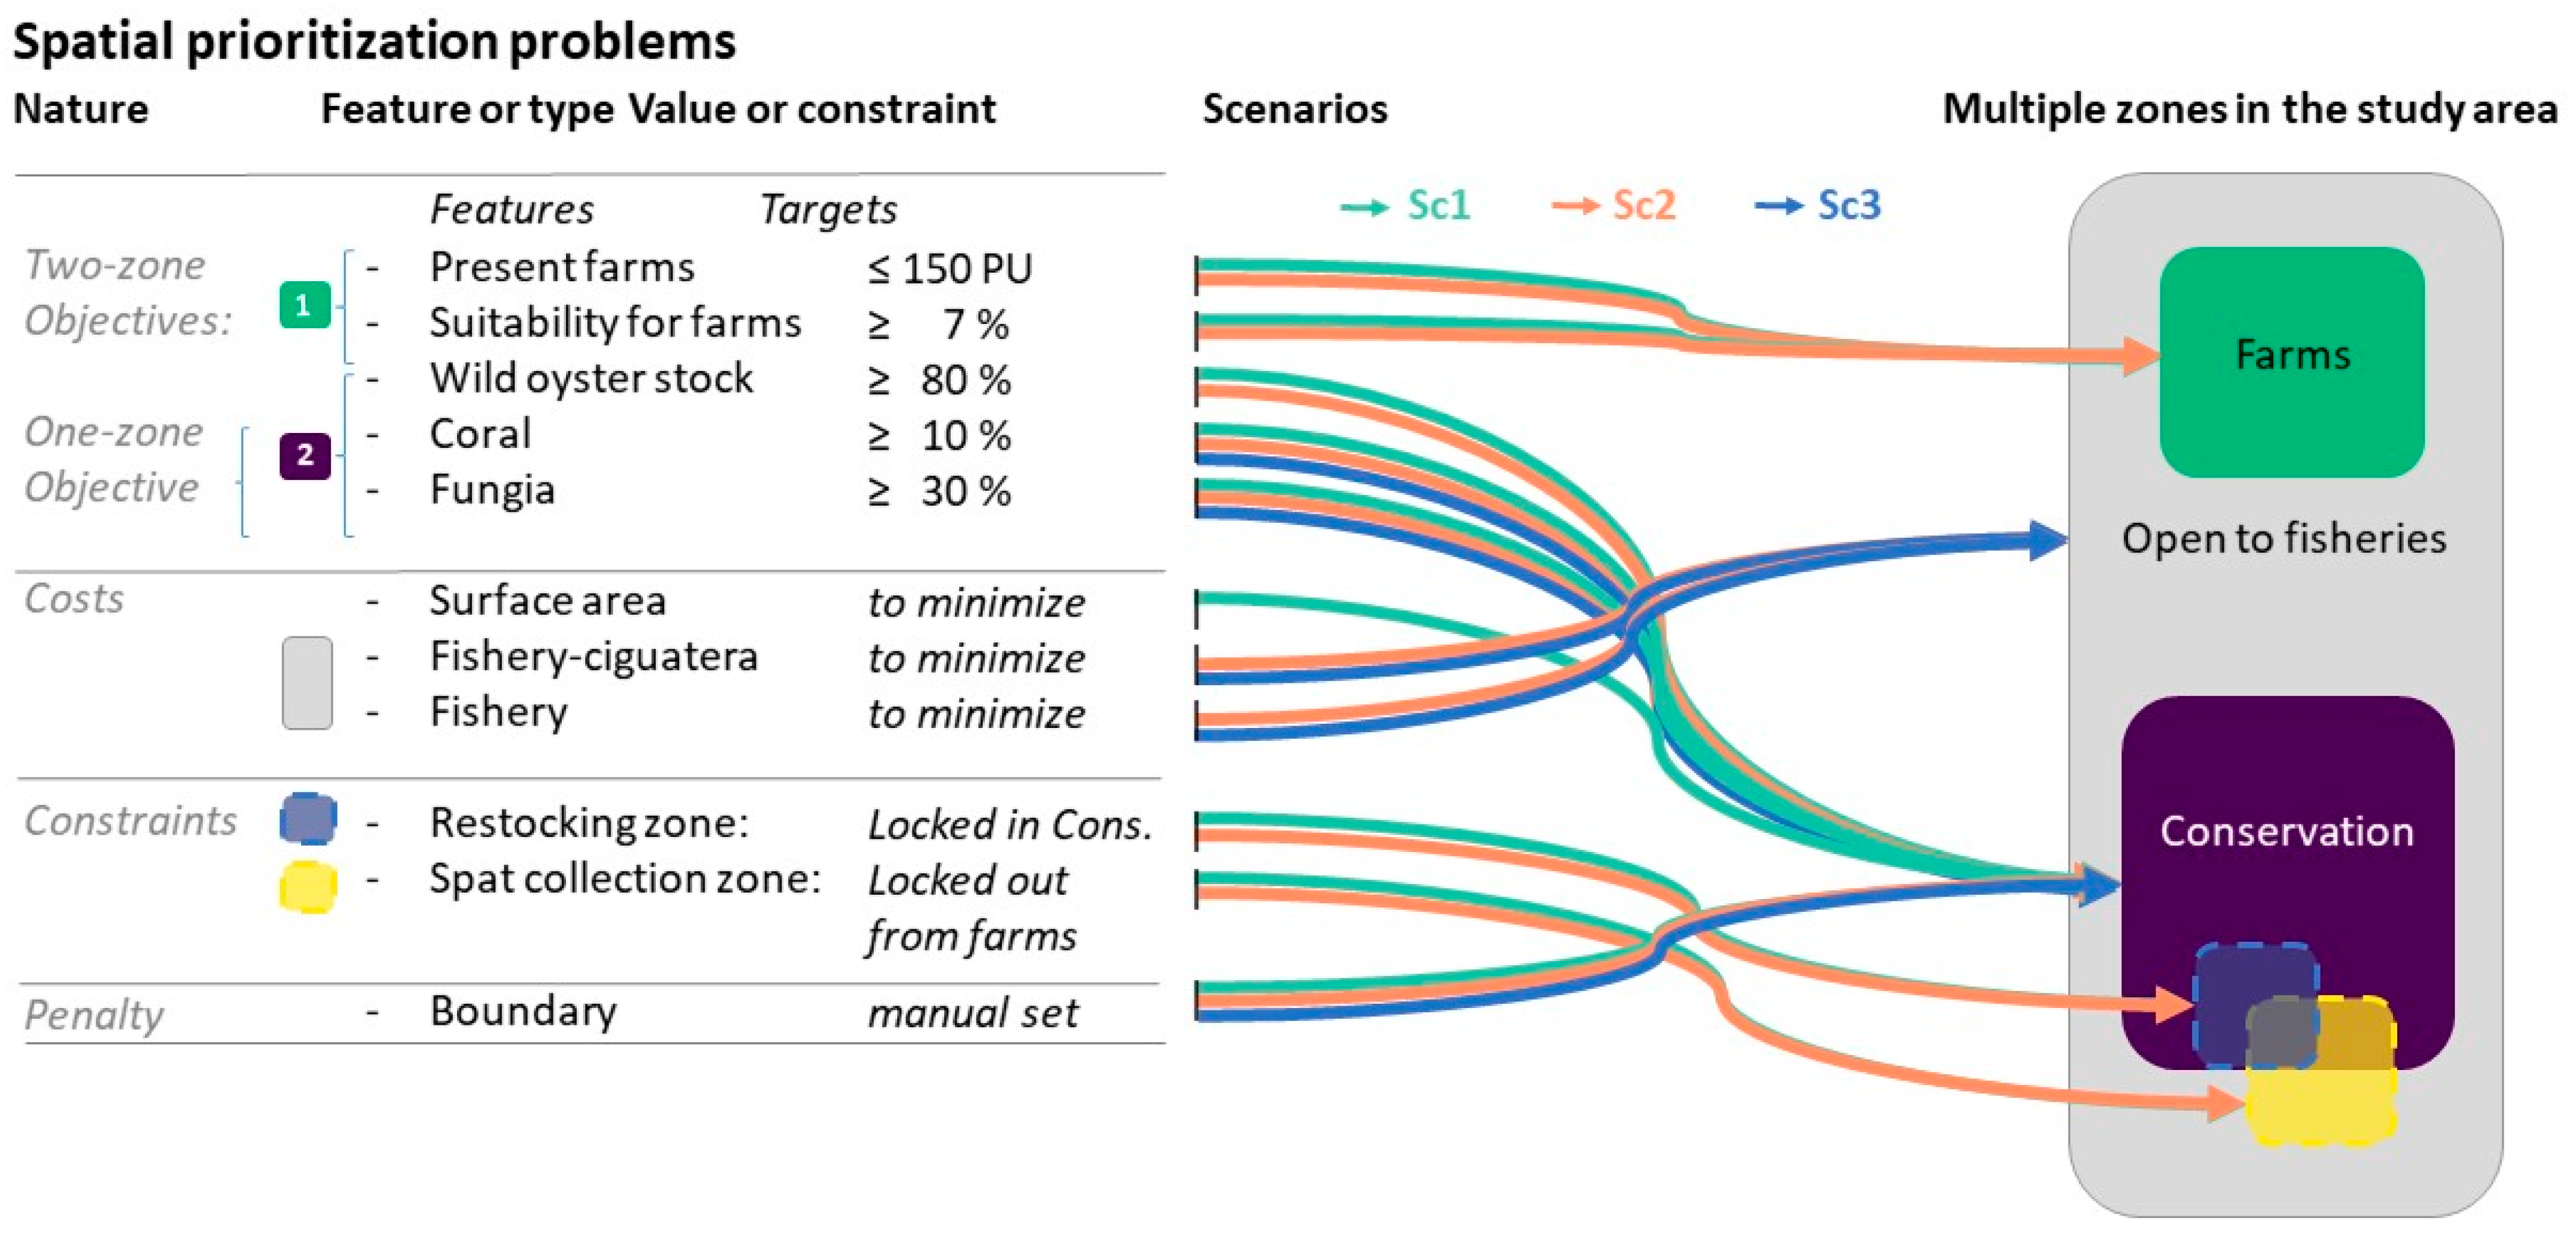
2.5. Detailed Description of Prioritization Scenarios

Based upon discussions with DRM, we implemented three systematic prioritization scenarios introduced in Table 1. Their implementation is detailed below (Figure 2).
A scenario will identify specific zones based on specific constraints defined for each scenario. In particular, some scenarios have locked-in predefined zones that are mandatory outputs to include and that are defined directly from the relevant data layer. Before detailing the different zones and scenarios, an overview is provided in Table 3.
It should be noted that in these multiuse scenarios, some zones mutually exclude each other (farms, fishery, and conservation zones) while others can overlap, either partially (spat collection zone with conservation zone) or totally (restocking zones included in conservation zone). In addition, not all zones are present in all scenarios (e.g., no farms, no spat collection, nor restocking zones are part of Scenario 3).
The different zones resulting from the different scenarios (Table 3) emerge from the optimization process that balances objectives and costs, integrating locked-in and locked-out zones. The zones can be described as:
  • Optimal farm concession zone in suitable environments (using Layer 11), with a maximum representation target set at 1500 ha, as per DRM specifications;
  • Conservation zone, including at least 30% of the surface area of remarkable coral communities, namely the Fungia spp. community and at least 10% of the surface area of the remaining live coral assemblage (resolution level 5 from Layer 1). Similar habitat representation objectives are recommended to protect biodiversity (e.g., in the Aichi Target 11) and sustain fisheries. Depending on the scenarios, the conservation zone can also include wild oyster stock areas, protecting at least 80% of the habitat where wild stocks occur (Layer 4);
  • Oyster restocking zones. Using Layer 10, the four predefined restocking areas are locked in the overall conservation zone. In the optimization process, they are also allowed to overlap potential Fungia and other live coral features, and wild oyster stock as well, and incidentally contribute to the conservation targets;
  • Spat collection zone, already delimited by decree. It is considered open to fishers. We do not aim to completely redesign its boundary here, but small changes in its boundaries are allowed if it contributes to the general optimization. In particular, identification of conservation areas is authorized within that zone, and if so, these zones become closed to fisheries. The spat collection zone was locked out from the farm concession zone as these uses are mutually exclusive;
  • Fishery zone, which is the remaining available area. It is not defined here by a precise target to reach (which could be possible), but the different farming or conservation zones above are computed to minimize the loss of ciguatera-free zones for fishers (using Layer 9) and minimize the loss of productive fishing grounds (using Layer 8) that would be closed if included in other zones.
To run these scenarios, the Prioritizr R package [23] was used as a systematic site-prioritization tool to solve minimum-set problems of multizone spatial management. Prioritizr is a recent tool based on mixed-integer linear programming. Unlike other widely used marine systematic conservation planning tools such as Marxan and its extensions, which relies on simulated annealing from metaheuristics [19], Prioritizr provides exact optimization solution but may fail with large problems (regarding a number of planning units and constraints) that are better studied with (meta)heuristics [46,47,48,49]. The level of complexity of the Gambier scenarios was still compatible with the Prioritizr toolbox, which offered suitable setting options. Among these is the boundary penalty that minimizes the sum of the perimeters of the prioritized zones in order to avoid their fragmentation with isolated PUs. Particularly, Prioritizr allows setting boundary penalty or aggregation that can apply to multiple types of zones. We used it for the multiple types of conservation subzones to be aggregated together.

2.6. Comparison of the Solutions

In a first step, the solutions of the three optimized scenarios were compared in terms of costs generated relative to the BAU scheme as standard. As we used two types of costs, we first compared the relative surface areas and then the relative opportunity costs.
The relative surface areas (RAz,sci) of each zone type (z) resulting from each scenario (sci) was divided by the surface area of the corresponding zone type from the BAU reference scheme (Az,BAU), following Equation (2):
R A z , s c i = A z , s c i A z , B A U
with z ϵ {Fishery zone; Conservation zone; Oyster restocking zone; Farm zone; Spat collection zone} and sci ϵ { Sc1; Sc2; Sc3}
Similarly, we compared the relative opportunity cost (RFCz,sci) of the solution zone z in each scenario sci, using the combined fishery–ciguatera index (FCz,sci), in Equation (3).
R F C z , s c i = F C z , s c i F C z , B A U
As the conservation and oyster restocking zones were absent from BAU, comparisons of surface areas and opportunity cost were made using Sc1 values as the reference for these zones.
In a second step, to compare scenario solutions, we measured and compared the objectives achieved and the incidental effects for other features that were not specifically targeted as objectives or used as costs by the scenarios. In other words, we overlapped the SCP solutions with certain input layers and calculated the value of each zone from the perspective of these layers. To this end, for each scenario, we measured the following indicators:
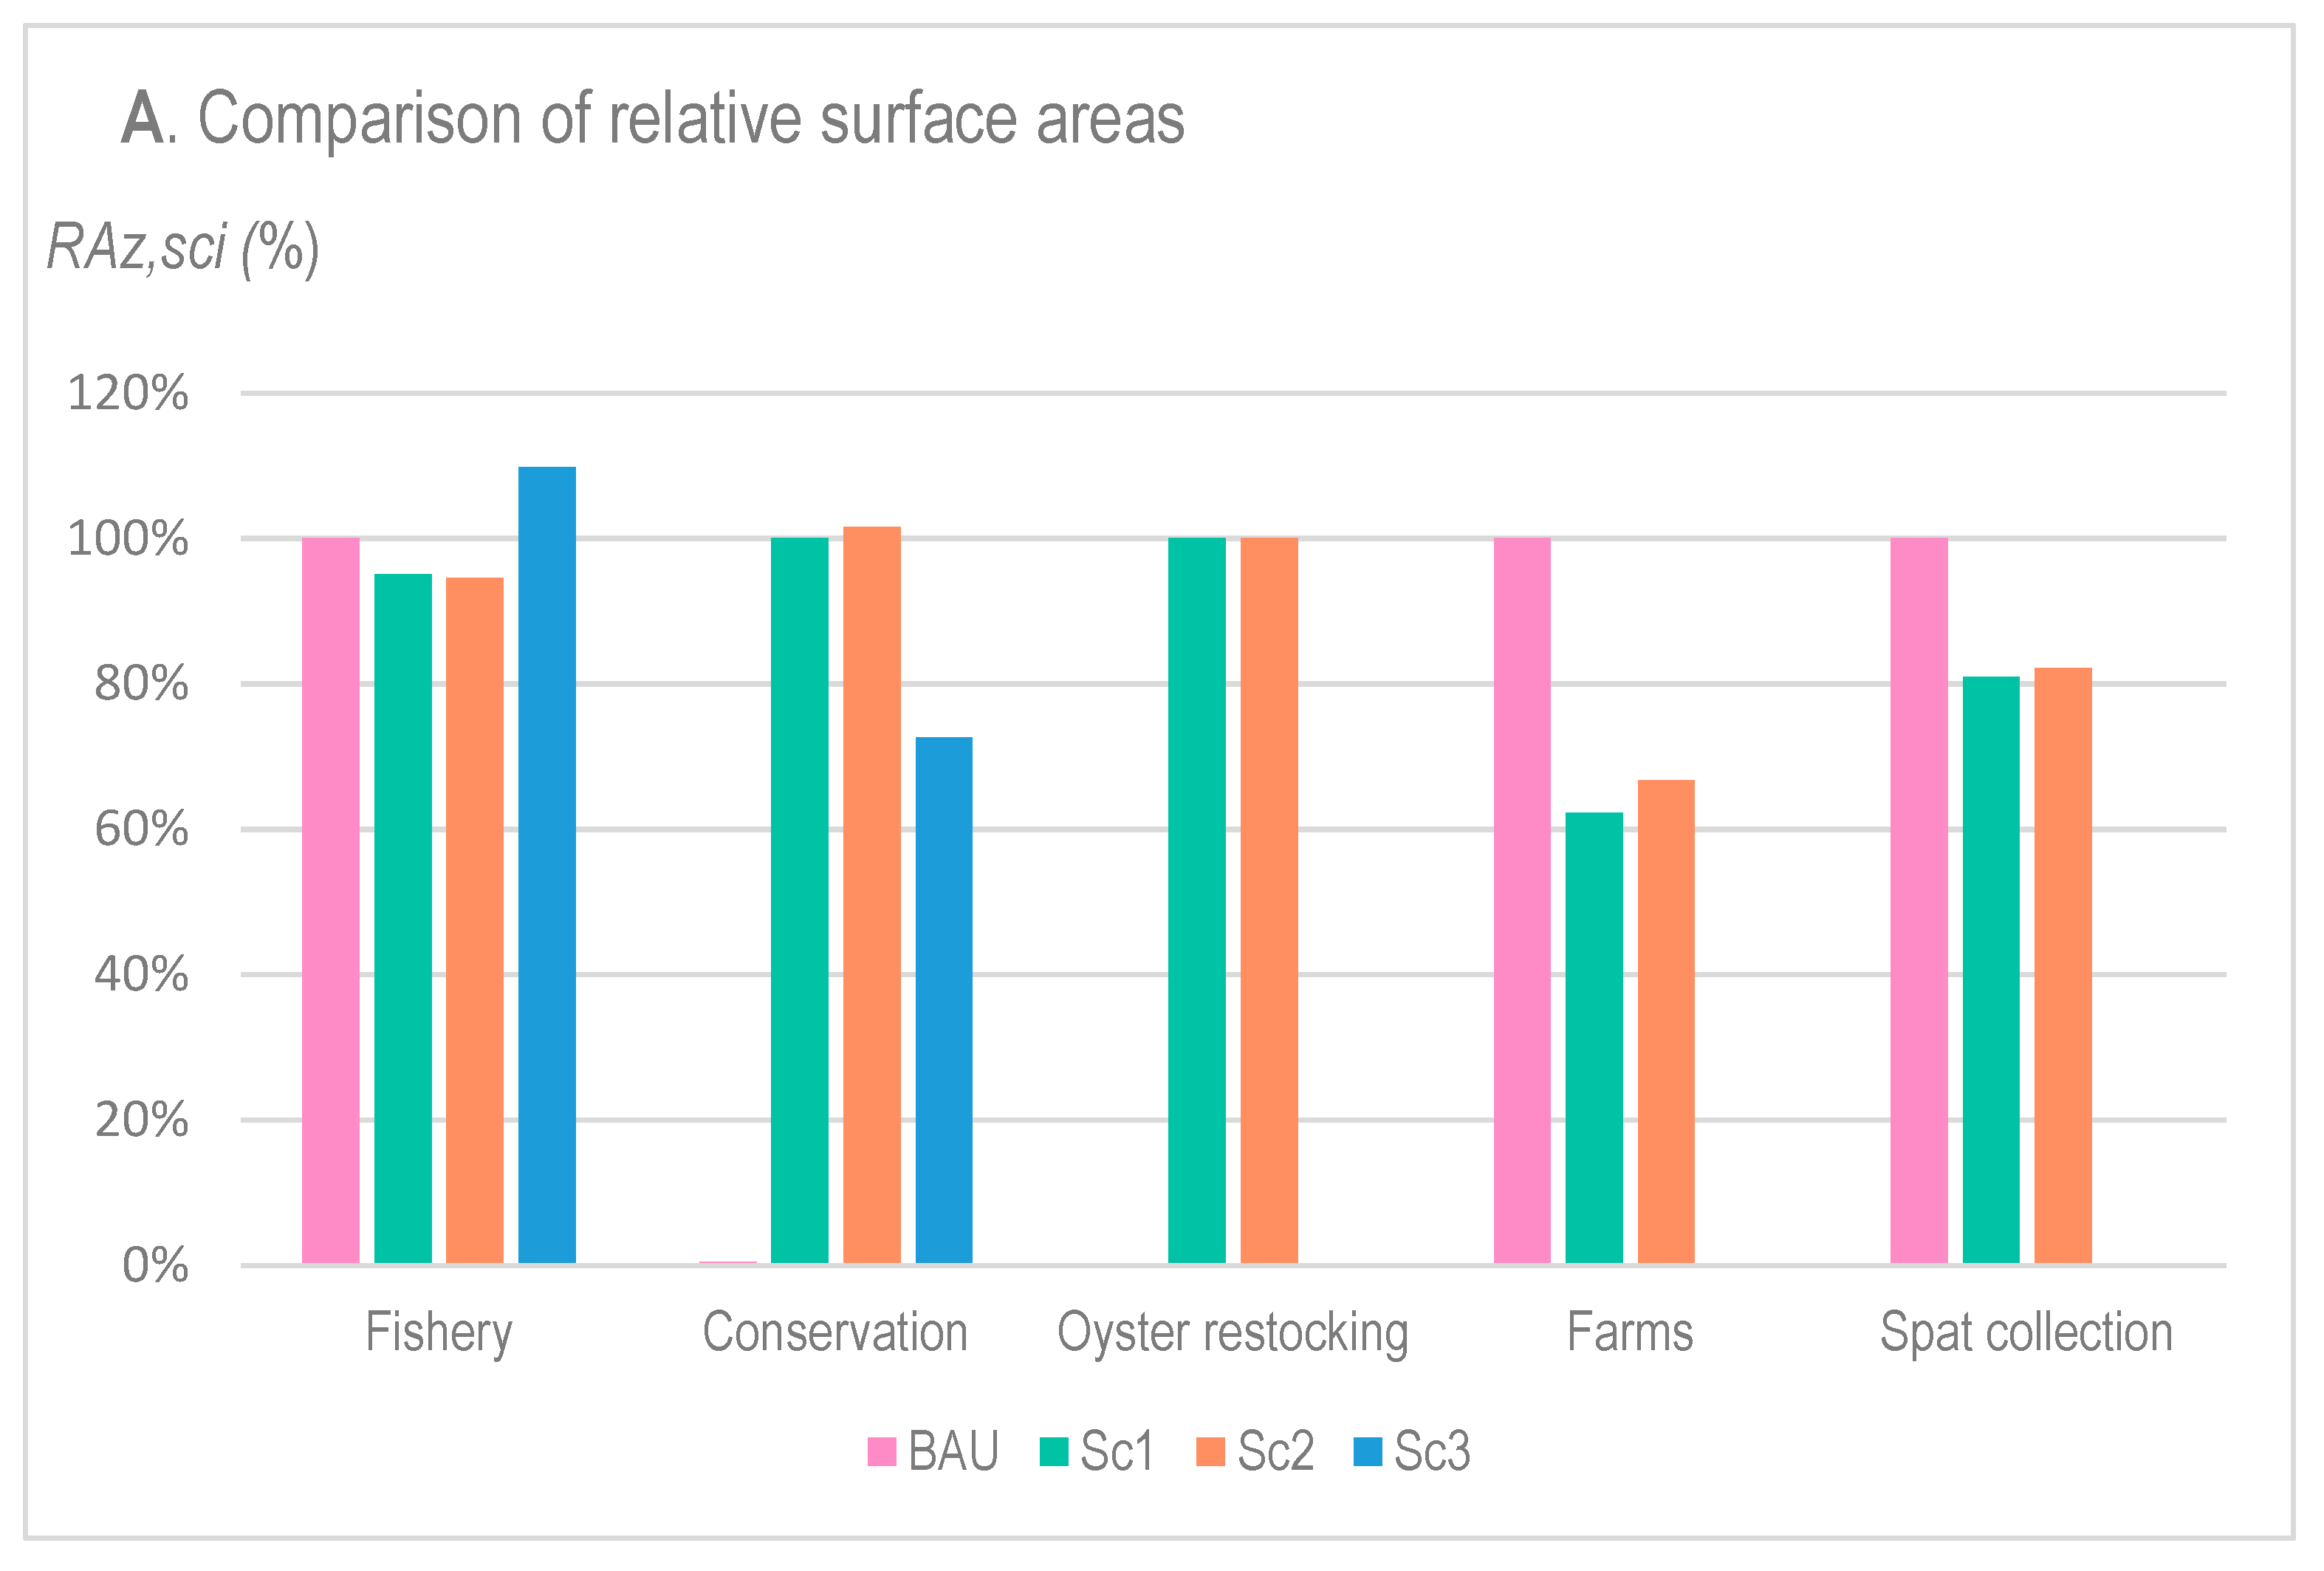
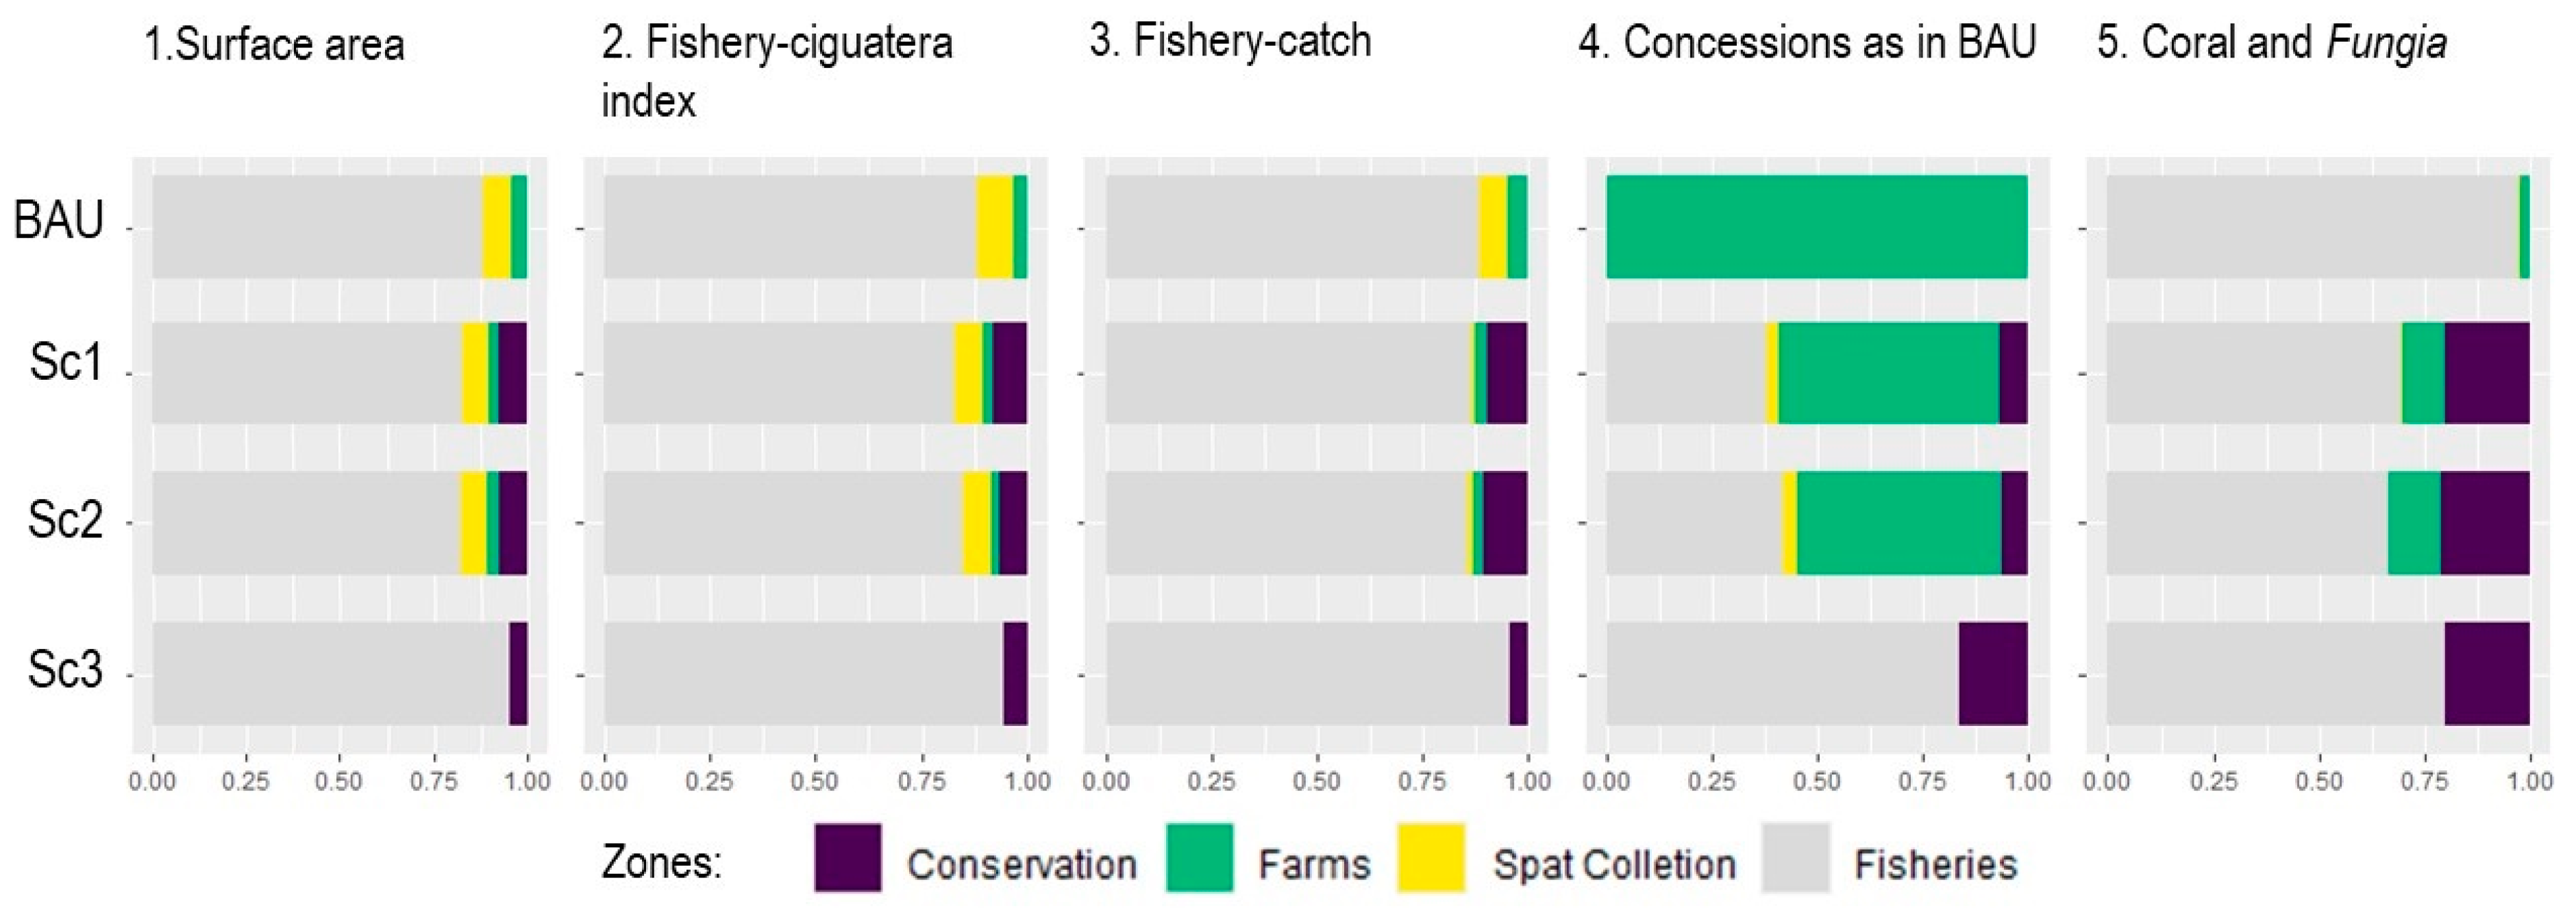
  • The surface area of each solution zone;
  • The value of each solution zone in terms of the fishery–ciguatera index value (overlapping the solution with Layer 9);
  • The value of each solution zone in terms of fishery catch value (Layer 8);
  • The type of solution zones and their surface areas that overlap the zone initially dedicated to concessions as in BAU (Layer 6); and
  • The type of solution zones and their surface areas that overlap the Fungia and coral communities (from Layer 1).
To compare the proportions of each of these indicators between solutions and between zones, they were expressed in percent of the total value of the indicator across the lagoon (i.e., the sum of values over all zones). Note that for a given scenario, the sum of standardized indicators is equal to 1 regardless of the number of zones because the fishery zone will be assigned to all areas not used by any other zones, i.e., the lagoon is always fully occupied.

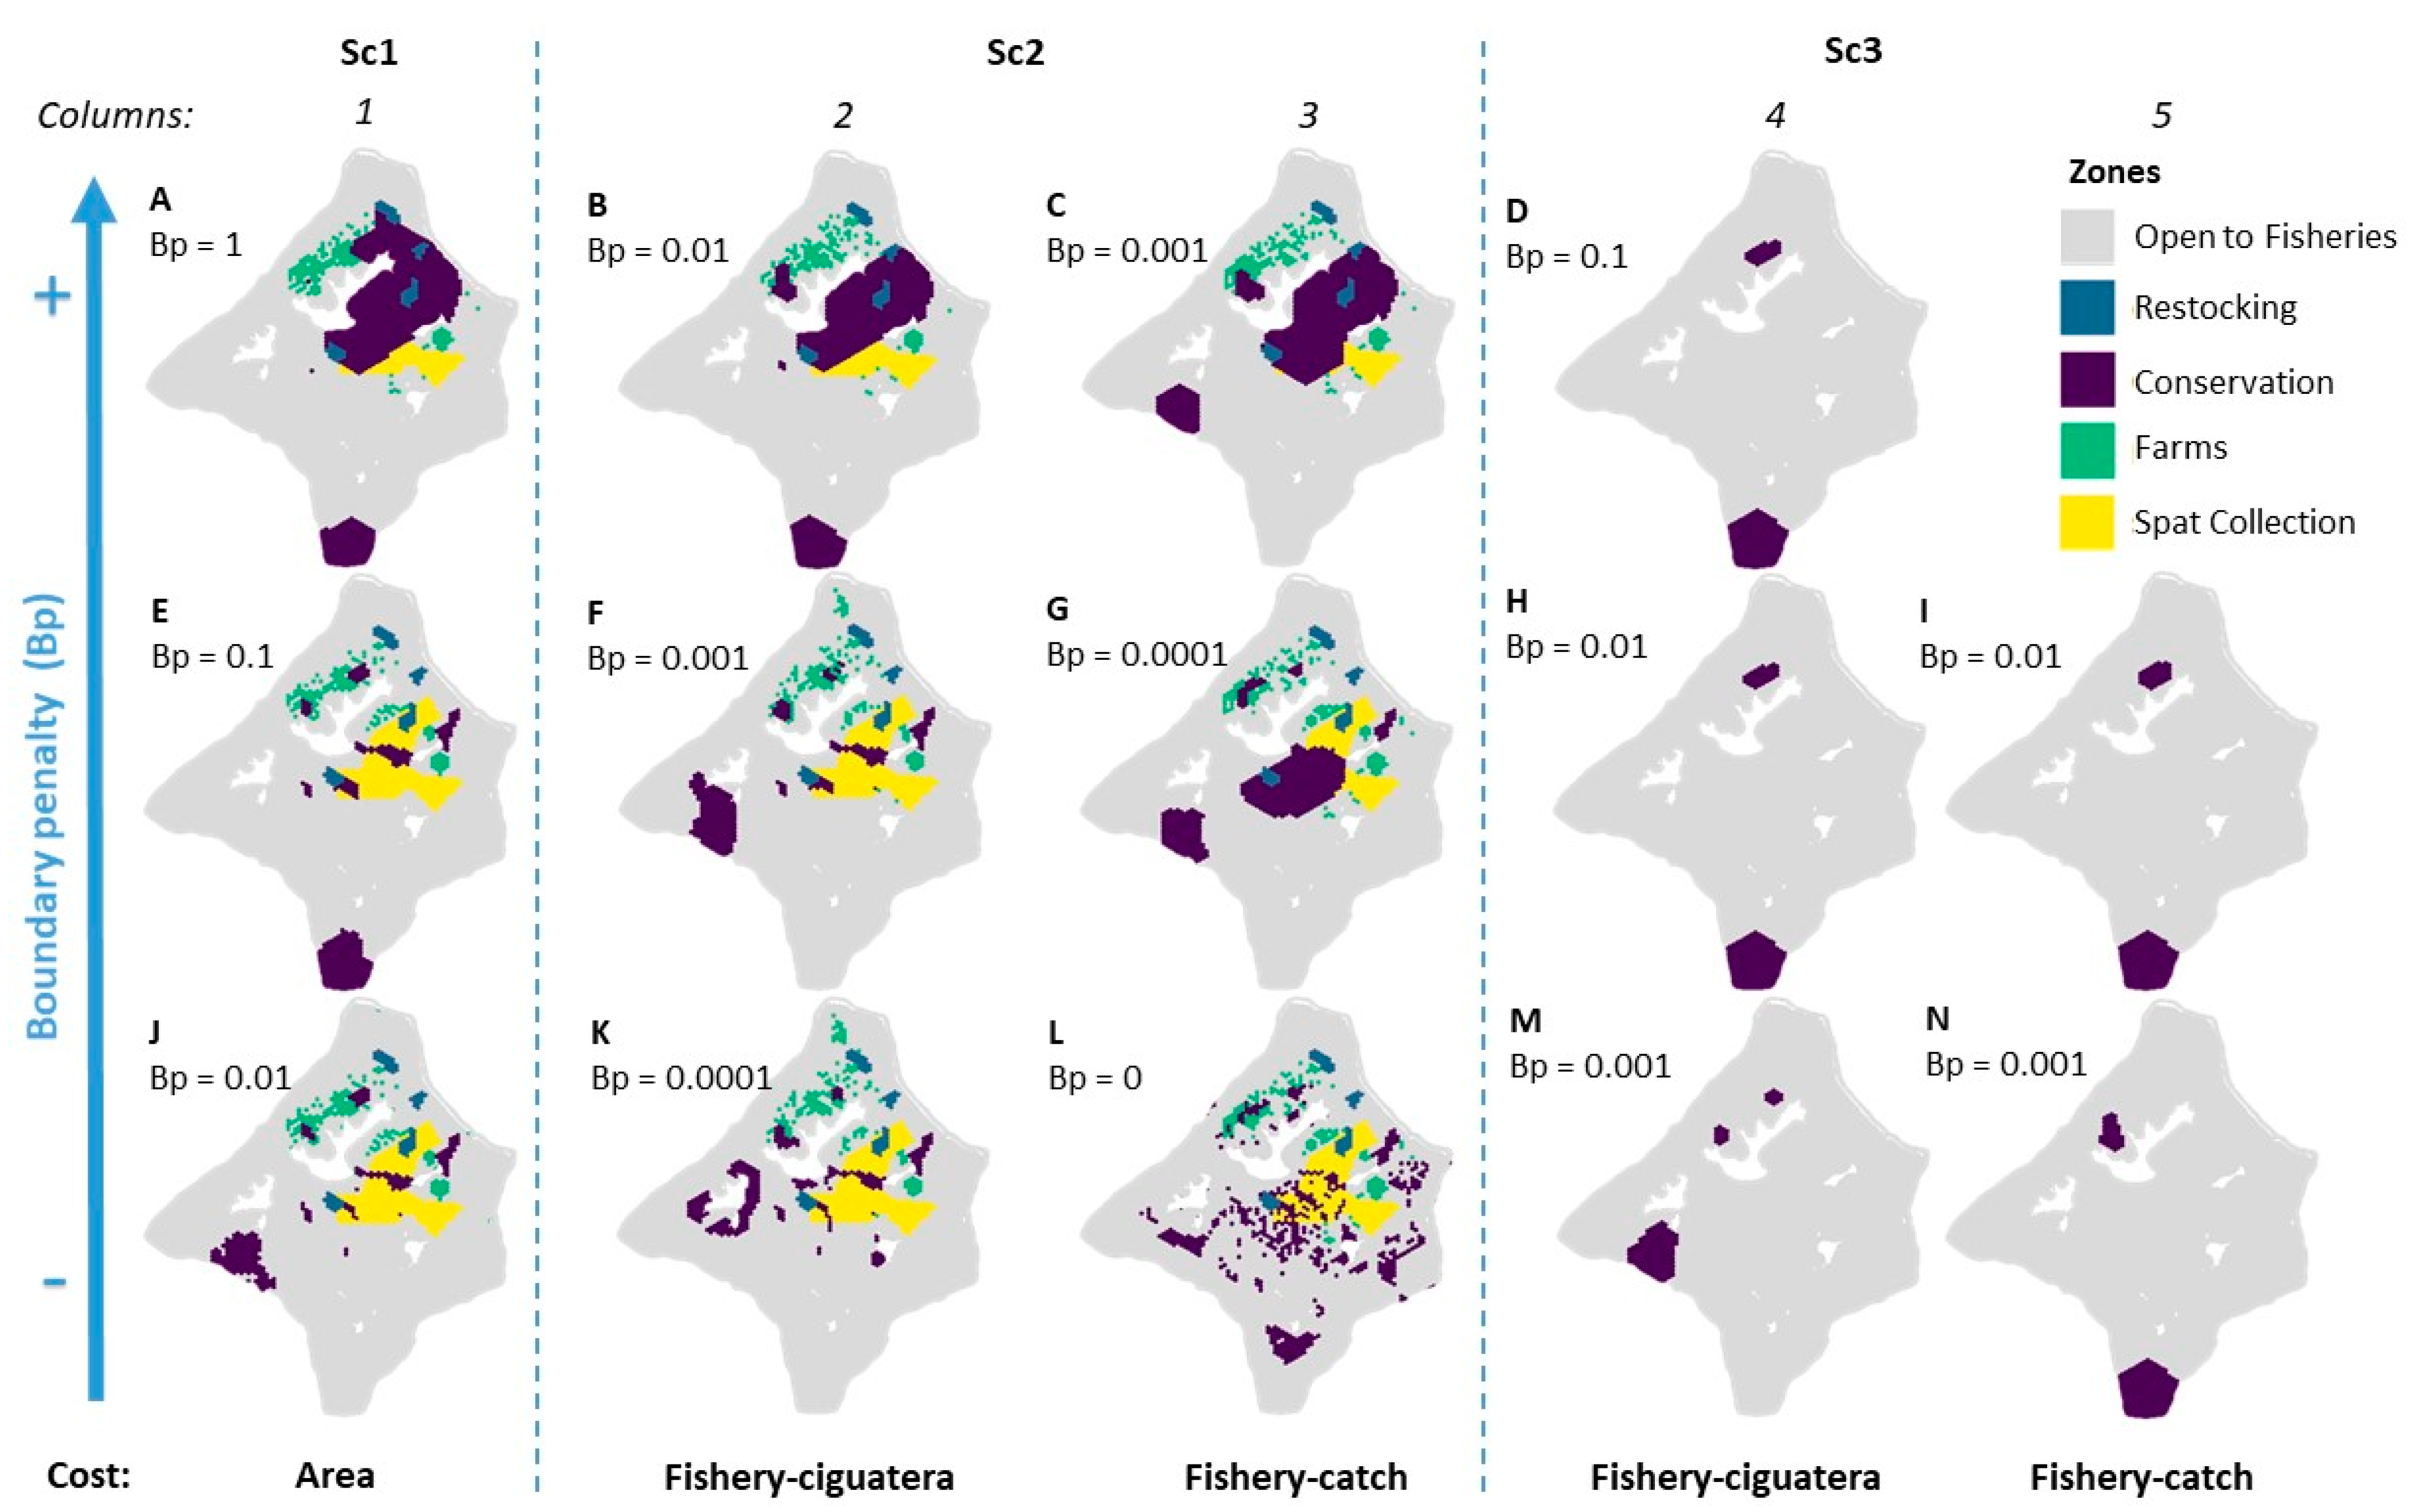
2.7. Sensitivity Analyses

Two sensitivity analyses were conducted to assess the variability of the solutions to input data layers and to a compacity parameter, as recommended by André et al. [15]. We tested the effects of:
  • The use of either the fishery catch or the fishery–ciguatera index layers as input for Scenarios 2 and 3;
  • The boundary penalty applied to the conservation zone. For the latter, an optimal boundary penalty value was sought for each scenario following Ardron et al. [43], based on iterations with a factor-10 increased penalty value. For each value, when plotting the total final cost of the solution against the sum of the perimeters of the solution zones, the optimal boundary penalty value was the point that defined the inflection point of the curve.

3. Results

3.1. Spatial Data Collection and Aggregation

The Gambier lagoon appeared to be characterized by:
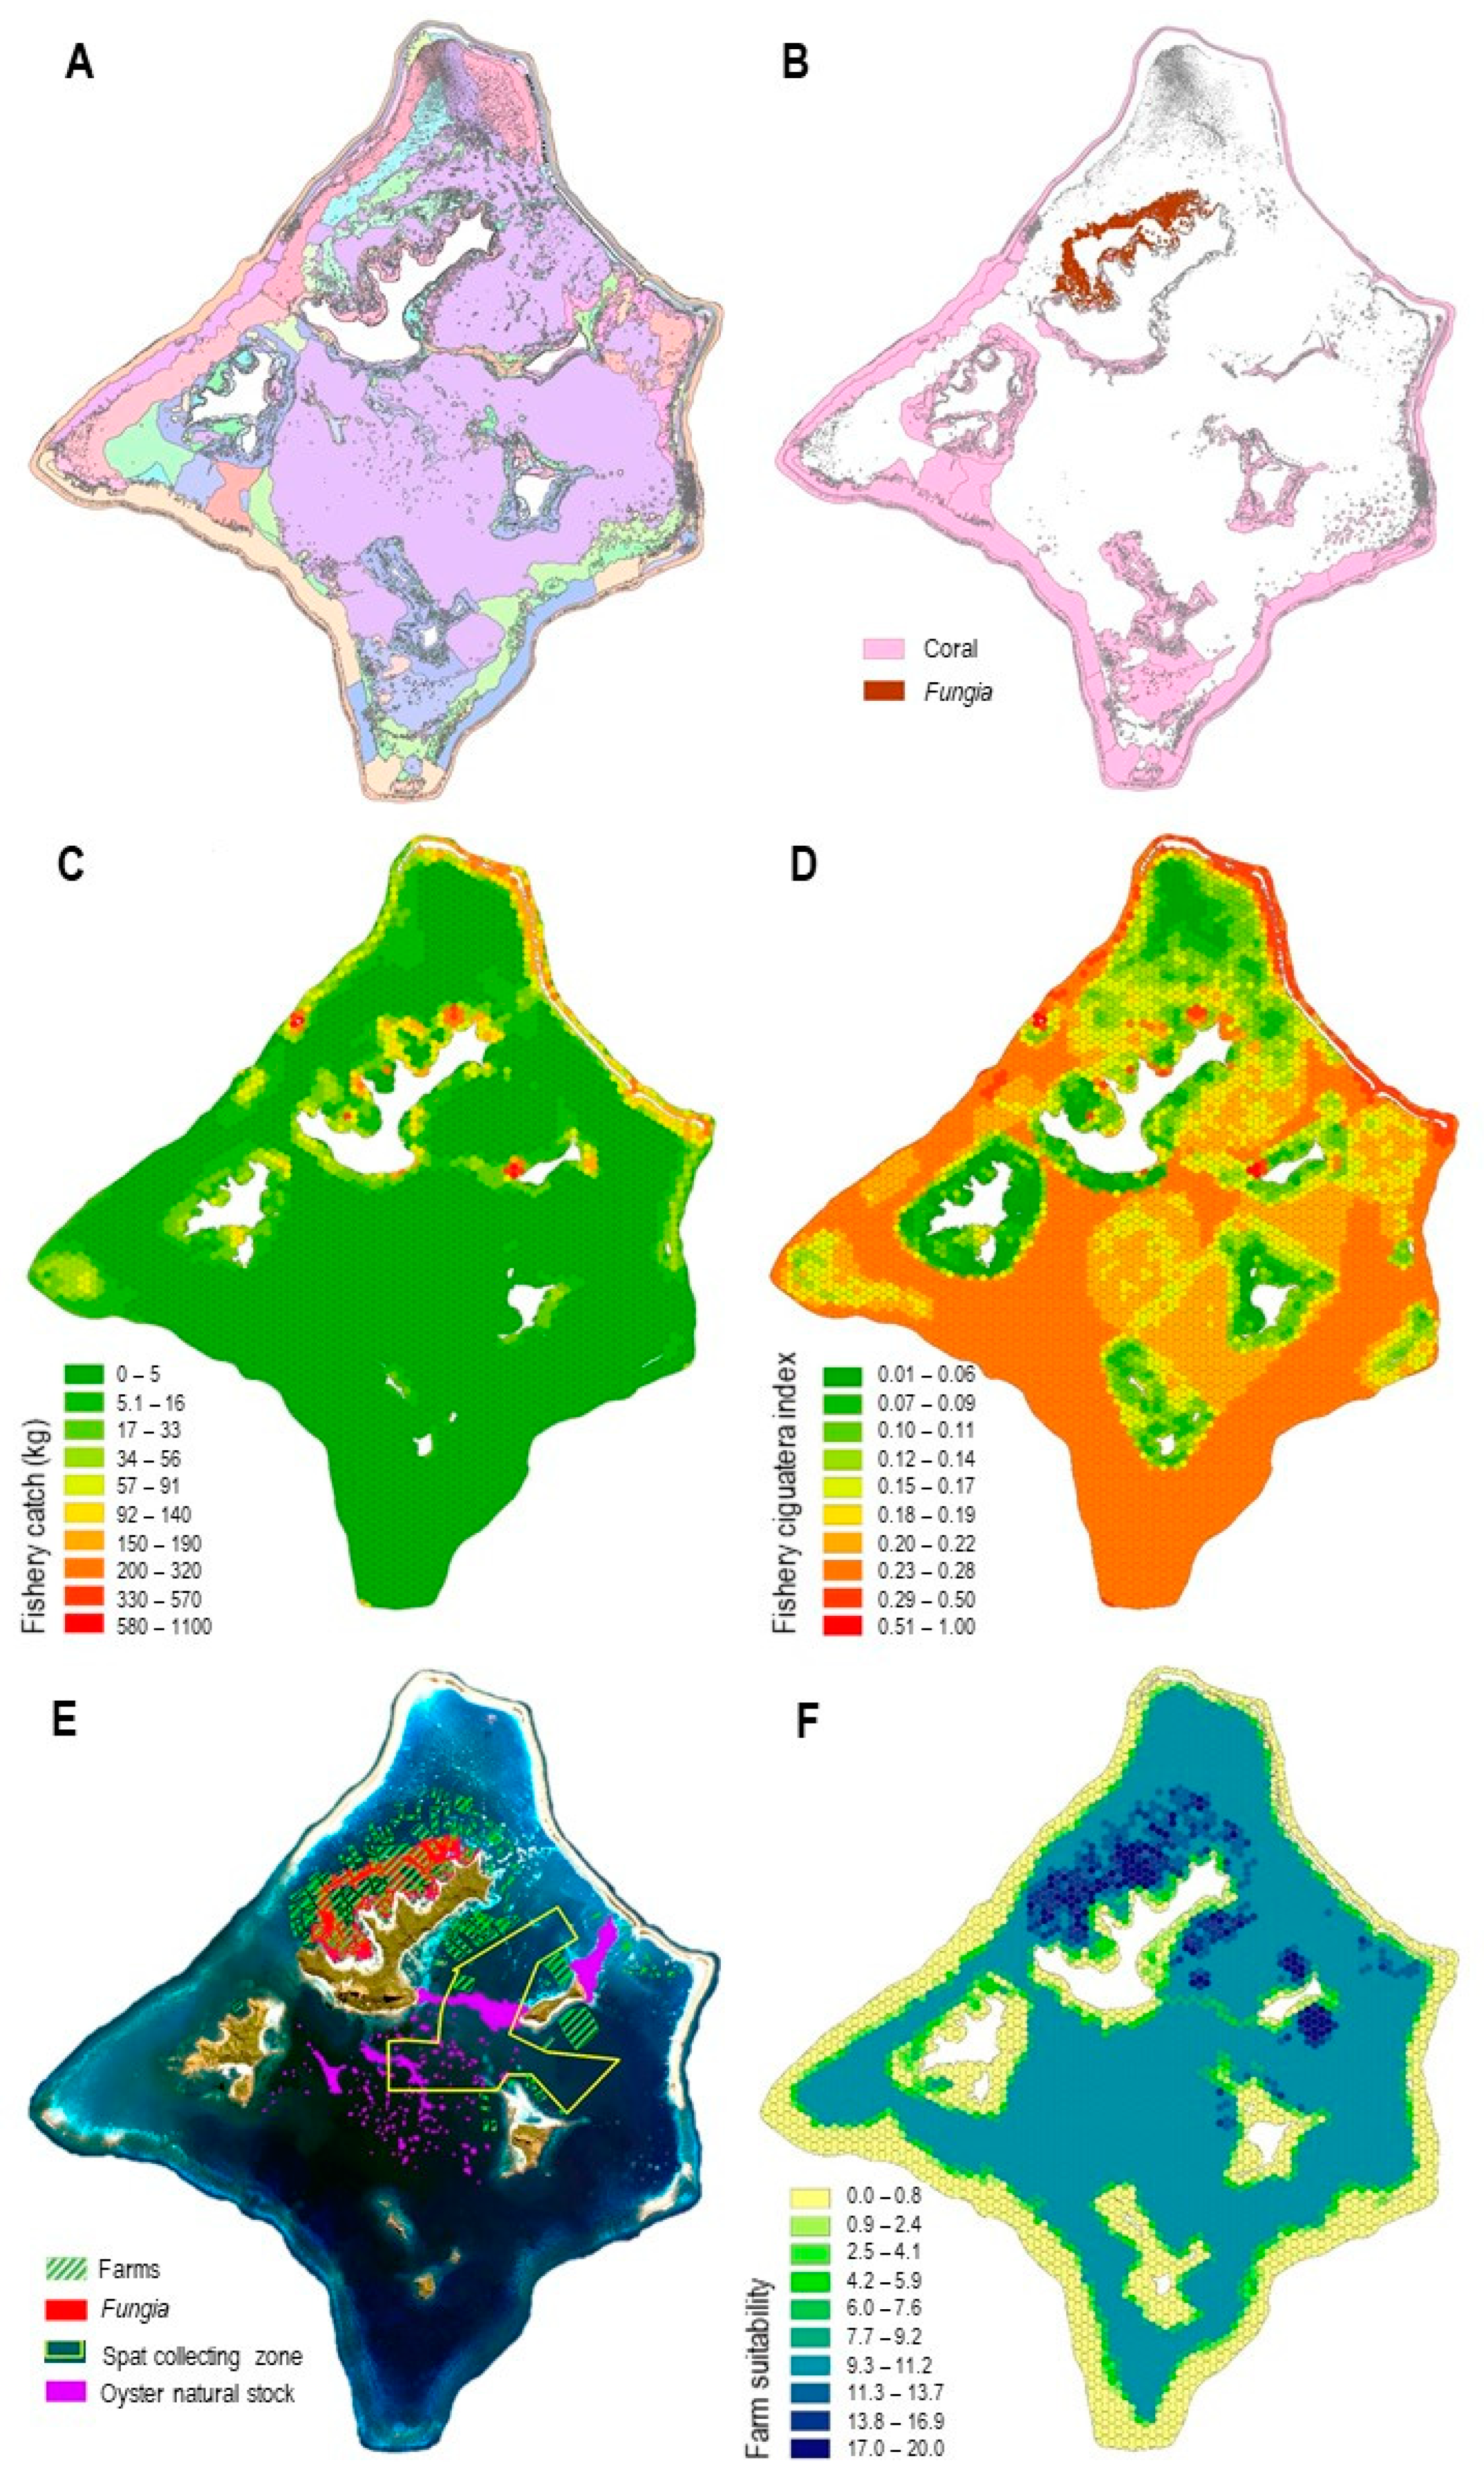
  • A high diversity of habitats (Figure 3A) distributed in the overall 48,560 ha lagoon, including (i) 5920 ha of coral-dominated benthos, preferentially found on fringing reef, patch reef, and lagoon floor geomorphological units, and (ii) 747 ha of remarkable Fungia spp. communities, which were distributed on the northwest of the main island Mangareva (Figure 3B);
  • An extensive fishery activity, estimated at 63.5 t. annual catch based on the 42 fishers surveys, who identified 252 overlapping individual fishing grounds covering 33,845 ha, which corresponds to 70% of the lagoon surface area, a spatially representative depiction of the fishery in the lagoon. A total of 128 individual zones of moderate to a high level of ciguatera risk were identified based on the fishers’ knowledge, completed with five locations of significant risk of ciguatera, identified following the fish toxicity survey conducted by ILM. The resulting risk map, combined with the fishery catch map, reflected the most favorable areas for fishing activity at a lower risk of ciguatera (Figure 3C,D). These favorable areas for fishing were mainly located on the north coast of Mangareva, the west end of Aukena, in a specific location in the middle of the northwest barrier reef near a small pass and, to a lesser extent, all along the northeast barrier reef.
  • A well-established black pearl oyster-farming activity shown by the BAU situation, with 2253 ha of maritime concessions, mainly on the northwest of Mangareva Island and, to a lesser extent, in the south and near Aukena Island (Figure 3E and Figure 4A). Concessions overlapped 358 ha of Fungia spp. communities (48%) (Figure 3E). The lagoon also has 780 ha of abundant wild oyster stock, which is mainly distributed on the shallow terraces between Mangareva and Aukena Islands, between Aukena and the eastern barrier reef, and on the summit of deep patch reefs in the center of the lagoon. The collecting zone overlapped some of these oyster stock habitats (Figure 3E). The farm suitability index highlighted the suitable farming areas (Figure 3F).

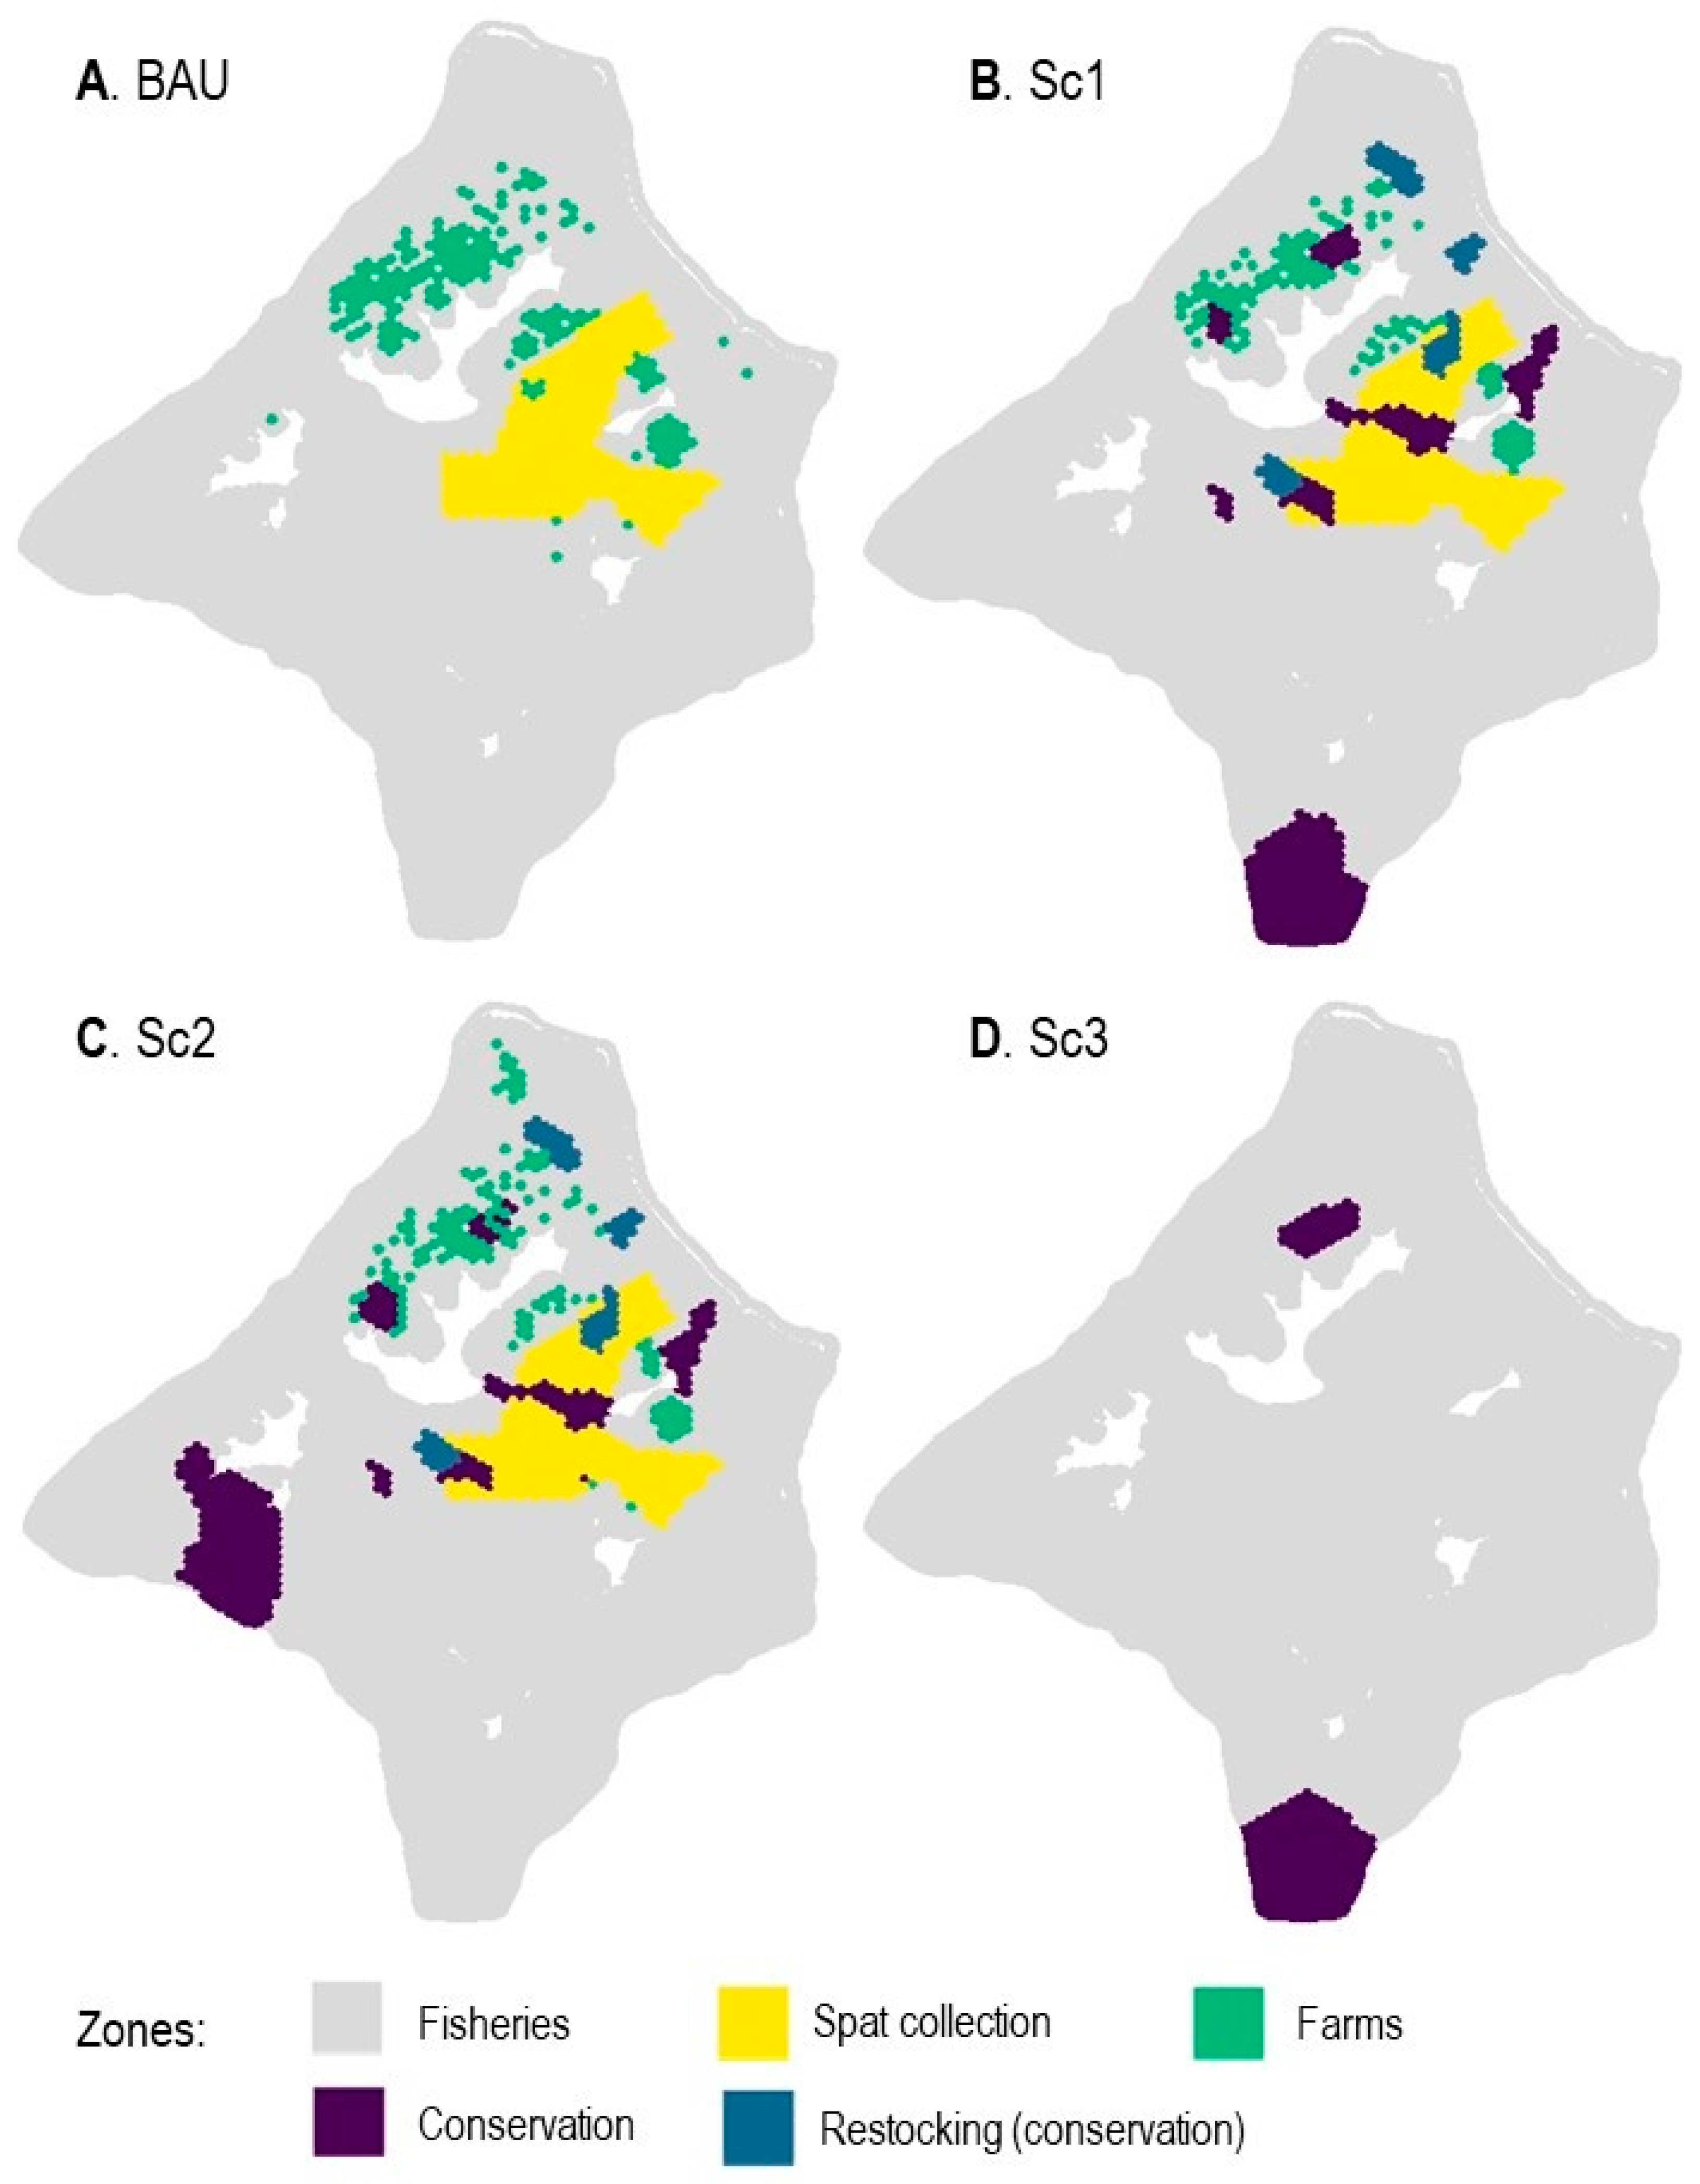
3.2. Scenarios Solutions

Solutions found for each scenario are depicted below in Figure 4.
Sc1 has conservation zones, including 2961 ha for remarkable coral communities and wild oyster stock, distributed in two Fungia spp. zones in the northwest of Mangareva, one large (1363 ha) coral zone south of the lagoon, and 750 ha of oyster restocking zones within the four traditional sectors (Figure 4B). The total surface area allocated to farm concessions was generally distributed to the same locations as for the BAU scheme but decreased down to 1400 ha (as the target was set at ≤1500 ha).
Sc2 was built on Sc1 but also considered fishery activity by avoiding as much as possible overlapping of farming and conservation zones with productive fishing areas or ciguatera-free zones. The conservation surface area slightly grew to 3008 ha, and this time, the large coral conservation zone was located in the west, near Taravai Island. This location was less costly for fishers than in the south, as previously identified in Sc1. As for the 1500 ha farm concessions, minimizing the opportunity cost to fishers led to a new optimal distribution extending towards the far north lagoon (Figure 4C).
Sc3 provided solutions for a lagoon dedicated to fisheries and coral conservation instead of black pearl farming, with 2149 ha for the conservation of remarkable coral communities, implicitly also protecting fishery stocks associated with these productive habitats (Figure 4D). This appears as a large compact polygon in the south part of the lagoon, in shallow areas that have less impact on the fisheries. When comparing this solution to the BAU scheme to estimate the space that would become available for other activities if pearl farming was stopped, we concluded that Sc3 would leave a total of 46,411 ha open to fisheries.

3.3. Comparison of the Respective Impacts of Solution Options

Figure 5 provides the comparison of each scenario in terms of relative surface area RA (Figure 5A) and relative cost in the fishery–ciguatera index RFC (Figure 5B) for each zone.
The diversification options (Sc1 and Sc2) slightly decreased the zone open to fisheries compared with BAU, while it was logically increased in Sc3, both in terms of relative surface area RA (A) and relative cost of the fishery–ciguatera index RFC (B). Indeed, the decrease in RAFishery,sci and RFCFishery,sci resulted from the creation of restocking and conservation zones on Sc1 and Sc2, which did not exist in BAU. By contrast, their increase under Sc3 was due to the inclusion of fishing zones in former concessions and spat collection areas present in BAU.
Compared with BAU, the diversification options (Sc1 and Sc2) led to an important decrease in farm concession zones (62 and 67% decrease in BAU’s surface area RA for Sc1 and Sc2, respectively, and 64 and 55%, in terms of the relative fishery–ciguatera cost RFC, respectively). Surprisingly, despite the concession surface area (RA) being slightly higher in Sc2 than in Sc1, the cost for fishers (RFC) was lower in Sc2 compared with Sc1. Similar results were noted for conservation zones, showing equivalent areas for Sc1 and Sc2, but at a notably lower cost for fishers (RFC) under Sc2 compared with Sc1 (20% lower). Spat collection zone also decreased in the area (RA) and cost (RFC) due to the inclusion of restocking and conservation zones.
The results from the second comparison approach are depicted in Figure 6. Here, the proportion of each zone relative to the others in a given scenario allows comparing the scenarios and measuring their impact by using different units of measurement or layers.
When measured in the surface area (column 1), the zone dedicated to fisheries (grey bar) decreased with diversification (Sc1 and Sc2) but increased with the ‘back-to-tradition’ option (Sc3), compared with BAU. Surprisingly enough, considering the diversification options (Sc1 and Sc2), the scenario that minimizes the cost for fishers (Sc2) did not increase the fishery zone in terms of surface area (column 1), and it increased it only slightly in terms of the fishery–ciguatera index layer (column 2, from 83% to 85% of the index). The zone dedicated to spat collection slightly decreased in Sc1 and Sc2, compared with the BAU option, either in terms of surface area or in the fishery–ciguatera index (columns 1 or 2). This is due to the inclusion of conservation areas within the initial spat collection zone. The spat collection zone in Sc1 and Sc2 does not generate costs when measuring it using the fishery catch layer vs. the fishery-ciguatera index (columns 2 and 3). It suggests this zone is not currently used by fishers, although it would likely be quite safe regarding ciguatera risk. Conversely, the cost of conservation zones was higher when measured in terms of fishery catch vs. the fishery–ciguatera index. This confirms that accounting for ciguatera risk reduces the opportunity cost to fishers.
Regardless of the scenario, the zone remaining open to fisheries was significant, whether in terms of surface area (82% to 88% of the lagoon) or in terms of maintained opportunity to fish, while integrating the ciguatera risk (82% to 94% of the total fishery–ciguatera index (Layer 9)) or not (85% to 96% of the total fishery catch values (Layer 9)).
Optimized location of farms (Sc1 and Sc2) overlapped with only about half of the BAU concessions (column 4), resulting from both a change in location and a reduced surface area of optimized farms. We also noticed that 7% (Sc1 and Sc2) to 17% (Sc3) of the BAU concessions surface areas were reallocated to conservation in optimized scenarios. This is due to the overlap of BAU concessions with coral communities, which were then assigned to conservation zones in the optimization scenarios.
Interestingly, among the total surface area of Coral and Fungia communities (column 5) deemed of interest for conservation, the overlap with farms was higher in optimized scenarios (Sc1 and Sc2) than in BAU. However, while the remaining surface area of Coral-Fungia communities was entirely exposed to impacts related to the fishery in BAU, we noted that at least 20 % of surface area was protected by conservation zones in the three optimized scenarios (Sc1 to Sc3).

3.4. Sensitivity Analyses

Studying the sensitivity of the solutions to different boundary penalty values applied to the conservation zones yielded some common patterns (Figure 7). Generally, at low penalty, we could easily identify which conservation zone was explained by which feature, as some have restricted distributions such as the wild oyster stock subzone or the Fungia subzone. In contrast, the coral feature was widely distributed in the lagoon, and the relatively low target (10%) allowed the possibility to select different parts of the lagoon. In addition to reducing the dispersal of the PUs assigned to conservation zones (as in Figure 7J–L), increasing penalty mainly induced two changes: (i) it created one large clustered conservation zone that connected together wild oyster stock, oyster restocking (B and C), and eventually Fungia zones (A), and (ii) it shifted the coral conservation zone from west to south. This was true for all scenarios except when using the fishery catch cost layer (columns 3 and 5), for which the coral conservation zone remained located in the west (in Sc2) or in the south (in Sc3), whatever the boundary penalty.

4. Discussion

In small islands, where the available land area is limited, activities are highly oriented towards marine areas, and guidance on spatial management of these spaces is essential. In these coastal environments, there is a need to interconnect spheres of economic activities with food security considerations to ensure resilient livelihoods while preserving biodiversity and sustaining ecosystem services. The present study, conducted on a French Polynesian island, highlights the possibility of reconsidering a ‘business-as-usual’ situation geared towards one single activity that occupies a large fraction of the population (namely, black pearl oyster-farming activity) towards a more diverse portfolio where fishery activities and conservation are prioritized compared with the ‘business-as-usual’ situation. Different spatial management options were explored, and their respective impacts were compared.
The results showed that moving away from the ‘business-as-usual’ situation is feasible, with all the different investigated options and targets fitting within the lagoon space. Various zone configurations could be tested, as shown in the sensitivity analysis. Overall, satisfactory solutions were found, including conservation areas and optimized farming activity, with or without fisheries optimization (scenarios 1 and 2, respectively). The diversification solutions allowed keeping productive fishing grounds open (maintaining from 85% to 96% of the current catches, depending on the scenarios), and these large areas open to fisheries (from 82% to 88% of the lagoon surface) leave room for further diversification, potentially in the future.
The diversification scenarios also highlight that a new lagoon spatial organization that better integrates the cycle of pearl farming is feasible in theory. Indeed, the lagoon can accommodate new restocking zones in the four traditionally managed areas, protection of the existing wild stocks, a dedicated existing spat collection zone, and a suitable area for farming within the coverage limit that DRM would like to reach (approx. 1500 ha). However, the different options and their solutions still need to be discussed with local stakeholders and tested in real conditions. For instance, we observed that in Sc2, the prioritization suggested that the farms be relocated to the north of the lagoon to decrease the overall opportunity cost for fishers since they hardly use this area. However, for pearl oyster farmers, this solution increases the distance from the shore, which results in higher operational costs for transport. Distance to the mainland was not considered here because the study domain was relatively small. However, travel distance is a typical socioeconomic cost used in many systematic conservation plans for islands [50,51] and continental coasts [25], and it could be profitably integrated into a second plan if stakeholders confirm that it is an important criterion to consider. Objections can be expected from the farmers who would be the most affected. In fact, any changes that might be implemented are likely to be heavily debated should DRM start discussions with the stakeholders on some of the options highlighted here. Additional aspects relate specifically to the protection of areas with high wild oyster stock abundance and the planning of new restocking zones. Indeed, the health and abundance of wild stocks are critical to sustaining the black pearl activity. Keeping the oldest oysters alive and thus restocking some specific zones may have a positive impact on the sex-ratio of the wild stock, which is critical for spat production, as demonstrated in a modeling and genetic study of larval dispersal and recruitment in Ahe Atoll, Tuamotu [42,52].
Other aspects specific to pearl farming can be investigated further if new scenarios are to be developed. For instance, spat collection, which strongly constrains the entire pearl production, was used here as a locked-in criterion since the area for spat collection is delimited by an official decree. Although we did not investigate other possibilities for spat collection zones, it could be interesting to do so, provided relevant data become available, such as larval dispersal data derived from biophysical models. These models can provide insights into the best spat collection locations under different weather regimes, including future changes in climate conditions [53,54,55].
The ‘back-to-tradition’ scenario defines the maximum surface area and fishery opportunity cost that can be gained by the fishers, compared to the ‘business-as-usual’ farming activity, while planning for optimized conservation zone, expected to favor stock replenishment. This scenario served as an extreme in the diversification options that were explored. As such, it might not be realistic because oyster farming is not likely to be abandoned in Gambier anytime soon. Should this happen, it would bring important changes in the local community, such as potential emigration of farmers to other productive islands or retraining of farmers to become professional fishers, inducing higher fishing pressure and changes in fishing ground locations.
The annual fishery catch in Gambier was estimated to be around 63.5 t. for a 485 km2 lagoon. This is ten times lower than in Raivavae (120 t. for a 86 km2 lagoon), another ciguatera-prone island of French Polynesia [41]. This lower rate of catch per km2 in Gambier is likely due to the strong focus on black pearl-farming activity. In Raivavae, despite a smaller population, islanders are mainly oriented towards fishery and agriculture activities. More generally, the role that noncommercial fisheries play in food provision is often underappreciated in development policies and programs due to limited information available for rural and remote areas [56,57]. In Hawaii State, which represents another Pacific Ocean island context, the importance of artisanal fisheries was evaluated in terms of monetary income, food security, and cultural values associated with nearshore fisheries [58]. Noncommercial catches appeared to be three times higher than commercial ones. This example, among others [28,41,59,60,61,62], highlights the essential role that artisanal fisheries play in Oceania. We stress the importance of accounting for them when making plans of diversification [45,63], even in situations where artisanal fisheries are not the main activity, as is the case in Gambier. Indeed, subsistence and commercial reef fisheries can quickly return to the forefront of the activity and buffer a socioeconomic collapse in case of disruption of the economic activities.
To alleviate pressure on coral reef fisheries due to climate change and population growth, which are recognized as some of the main future threats for the Pacific islands [13], options of diversification within the local fisheries themselves have been recommended. Indeed, the use of nearshore fish aggregation devices was identified to sustain local food security and diversify the sources of marine proteins towards offshore resources such as tuna, mahi mahi, and wahoo while alleviating fishing pressure on coral reef resources [64,65]. Such fish aggregation devices (FADs) could be anchored near the shore on the oceanic outer slope of the barrier reef. Other types of FADs, anchored further from the reef and deeper (800–1500 m), are already implemented and used in Gambier, as well as in other French Polynesian islands (99 FADs in total in French Polynesia as of 2020 [66]). So further development of marine spatial plans could consider that point by extending the study zone to the oceanic slope to include a nearshore FAD activity and its associated habitats.
In French Polynesia, diversification from mainly fishery activity towards more lucrative activities such as black pearl production as it occurred in the years 1980–1990 concerns many island lagoons, particularly in the remote and rural islands of Tuamotu Archipelago. Other diversification pathways could include tourism or aquaculture and samplings for the aquarium trade, for example, which bring additional incomes (in French Polynesia [67,68], in Samoa [69]). After spatially assessing the current situation, systematic planning could highlight options of spatially sound diversification integrating environmental and socioeconomic aspects. It is a useful tool to help design an integrated approach for sustainable development and management of activities, spaces, and resources.
International and local governance, as well as scientific research, are called upon to integrate more and more sustainability science principles taking into account society, culture, economy, and the environment systems [70,71]. For this, systematic planning can be used as a transdisciplinary tool that can thrive on, and be applied to, these different spheres in a dynamic adaptive planning process involving the different stakeholders. Adaptive management is crucial to integrate new knowledge, the changing society, and environments [72,73], particularly in the context of small and isolated islands, which have limited diversification opportunities.
In this study, we focused on islands, but it should actually be further understood sensu lato, as patches with a certain degree of isolation that can be geographic or biogeographic in remote regions, but also social, cultural, or administrative, in any regions including certain continental coastal contexts where the question of activity diversification arises.
So, all in all, the Gambier case study takes into account several of the recommendations that were put forward following our review of 34 SCP cases studies in the Pacific [15]. Specifically, it takes into consideration aquaculture (pearl farming), the impact of ciguatera on fisheries, and focuses on an invertebrate resource, which were barely studied despite being a critical resource in Oceania. It also generated a spatially explicit fishery atlas data (all data made available are not shown here, such as details about the fishing gears per fishing area) and provides sensitivity analyses to different input factors, including SCP optimization parameters (boundary penalty), as recommended by Van Wynsberge et al. [44]. As such, it fills several gaps to better characterize some of the configurations and specificities of the Indo-Pacific tropical islands that have never or poorly been taken into account thus far in SCP work.
Finally, as a perspective to complement this analysis, we suggest that a socioeconomic model will be useful to measure the economic implications of each scenario. In the current state of knowledge, such a model cannot be created. Additional information on monetary fluxes is required to help define the limits beyond which a change in lagoon zonation might be necessary to maintain the level of incomes on the islands. This aspect is necessary but not sufficient since not all exchanges are monetary. Indeed, there are substantial trades and gifts that motivate fishing in the Gambier lagoon, as in most Pacific Ocean islands [60,74]. The implications of the different scenarios on these exchanges are unknown to date. Concerning the pearl oyster production, the estimations would need to take into account numerous components that vary between the years, such as the quality and quantity of the production for both spats and pearls, as well as the value of Tahitian black pearls in international markets. This is, however, beyond the scope of the present study.

5. Conclusions

In the context of integrated coastal management, leaving the ‘business-as-usual’ mentality’ [71] and planning for diversification of activities by considering several different options is a challenging but sensible way to ensure some economic sustainability [8], even when stakeholders may be reluctant to change their practices [75]. Through this case study, we explored and compared different options for reshuffling management priorities for an island with limited diversification options and currently facing socioeconomic and environmental changes (or expected to face such issues in the near future). In charting diversification pathways, using a systematic planning approach has ensured objectivity and data-based solutions that can inform public policies. For islands sensu lato, exploring pathways using spatial planning to avoid future livelihood bottlenecks and traps should not be delayed for places near their maximum carrying capacity, or other specific situations, given the speed with which the biosphere and the anthroposphere are changing.

Supplementary Materials

The following supporting information can be downloaded at: https://www.mdpi.com/article/10.3390/su14073871/s1, Table S1: Complete legend of the geomorphological and benthos habitat map of Gambier.

Author Contributions

Conceptualization, L.V.A., S.V.W., V.L. and S.A.; methodology, L.V.A., S.V.W. and S.A.; software, L.V.A.; validation, S.A.; formal analysis, L.V.A.; investigation, L.V.A., M.C. and C.M.I.G.; resources, S.A.; data curation, L.V.A.; writing—original draft preparation, L.V.A.; writing—review and editing, L.V.A., S.V.W., M.C., C.M.I.G., V.L. and S.A.; visualization, L.V.A. and C.M.I.G.; supervision, S.A.; project administration, M.C. and S.A.; funding acquisition, L.V.A., M.C. and S.A. All authors have read and agreed to the published version of the manuscript.

Funding

This research within Pangea Project, was funded by half a doctoral fellowship from Délégation à la Recherche de la Polynésie française (conv. number 06575/MED of 28 September 2018, implicating Institut Louis Malardé), by half a doctoral fellowship from Sorbonne Université to L.V.A. (doctoral contract number 3369/2018), and by Agence Nationale de la Recherche—ANR MANA (Management of Atolls, grant number ANR-16-CE32-0004).

Institutional Review Board Statement

The study was conducted in accordance with the European General Data Protection Regulation (GDPR), with informed consent from each fisher surveyed on his/her knowledge on fisheries and ciguatera prone areas, within the framework of the Pangea Project, a grant from Délégation à la Recherche de Polynésie française to Institut Louis Malardé, (Conv. N° 06575/MED of 28 September 2018).

Informed Consent Statement

Informed consent was obtained from all subjects involved in the study. All participants in the fishery and ciguatera survey were informed about the study goal and their right to access the data collected. Informed consent to participate in the study was obtained for each one, following the General Data Protection Regulation (GDPR) European current procedure.

Data Availability Statement

The R codes developed for this project are available at https://github.com/AndreLaureV/GitHub_SCP_MultiZoning_PrioritizR_Gambier (accessed on 22 February 2022).

Acknowledgments

We acknowledge all the people of Gambier, including fishers and black pearl farmers, as well as Rikitea city council representatives, for taking the time to reply to our questions and for their input. We thank Jeffrey Hanson for his precious advice on Prioritizr code, H. Taiana Darius for providing data on ciguatera field sample analysis, and Solène Derville for tips in data visualization. We thank the urbanization service of French Polynesia for providing the Gambier QuickBird and IKONOS imagery.

Conflicts of Interest

The authors declare no conflict of interest. The funders had no role in the design of the study; in the collection, analyses, or interpretation of data; in the writing of the manuscript, or in the decision to publish the results.

References

  1. Cinner, J.E.; McClanahan, T.R.; Graham, N.A.J.; Daw, T.M.; Maina, J.; Stead, S.M.; Wamukota, A.; Brown, K.; Bodin, Ö. Vulnerability of Coastal Communities to Key Impacts of Climate Change on Coral Reef Fisheries. Glob. Environ. Chang. 2012, 22, 12–20. [Google Scholar] [CrossRef]
  2. Lau, J.D.; Cinner, J.E.; Fabinyi, M.; Gurney, G.G.; Hicks, C.C. Access to Marine Ecosystem Services: Examining Entanglement and Legitimacy in Customary Institutions. World Dev. 2020, 126, 104730. [Google Scholar] [CrossRef]
  3. Jupiter, S.; Mangubhai, S.; Kingsford, R.T. Conservation of Biodiversity in the Pacific Islands of Oceania: Challenges and Opportunities. Pac. Conserv. Biol. 2014, 20, 206–220. [Google Scholar] [CrossRef]
  4. He, Q.; Silliman, B.R. Climate Change, Human Impacts, and Coastal Ecosystems in the Anthropocene. Curr. Biol. 2019, 29, R1021–R1035. [Google Scholar] [CrossRef]
  5. Payri, C.E.; Vidal, E. Biodiversity, a Pressing Need for Action in Oceania; Payri, C.E., Vidal, E., Eds.; Presses Universitaires de la Nouvelle-Calédonie (PUNC): Nouméa, New Caldonia, 2019. [Google Scholar]
  6. Birch, T.; Reyes, E. Forty Years of Coastal Zone Management (1975–2014): Evolving Theory, Policy and Practice as Reflected in Scientific Research Publications. Ocean Coast. Manag. 2018, 153, 1–11. [Google Scholar] [CrossRef]
  7. Campbell, S.J.; Jakub, R.; Valdivia, A.; Setiawan, H.; Setiawan, A.; Cox, C.; Kiyo, A.; Darman; Djafar, L.F.; de la Rosa, E.; et al. Immediate Impact of COVID-19 across Tropical Small-Scale Fishing Communities. Ocean Coast. Manag. 2021, 200, 105485. [Google Scholar] [CrossRef]
  8. Fenichel, E.P.; Levin, S.A.; McCay, B.; St. Martin, K.; Abbott, J.K.; Pinsky, M.L. Wealth Reallocation and Sustainability under Climate Change. Nat. Clim. Chang. 2016, 6, 237–244. [Google Scholar] [CrossRef]
  9. Barrett, C.B.; Bezuneh, M.; Clay, D.C.; Reardon, T. Heterogeneous Constraints, Incentives and Income Diversification Strategies in Rural Africa; Working Paper; Cornell University: Ithaca, NY, USA, 2001; p. 46. Available online: https://ageconsearch.umn.edu/record/14761 (accessed on 22 February 2022).
  10. Bowser, W.; Nelson, C.H. Land Institutions, Investments, and Income Diversification: Pathways to Economic Development for Brazil’s Quilombo Communities; IFPRI Discussion Paper 1179; International Food Policy Research Institute (IFPRI): Washington, DC, USA, 2012; Available online: http://ebrary.ifpri.org/cdm/ref/collection/p15738coll2/id/126905 (accessed on 22 February 2022).
  11. Kasperski, S.; Holland, D.S. Income Diversification and Risk for Fishermen. Proc. Natl. Acad. Sci. USA 2013, 110, 2076–2081. [Google Scholar] [CrossRef] [Green Version]
  12. Andréfouët, S.; Dewantama, I.M.I.; Ampou, E.E. Seaweed Farming Collapse and Fast Changing Socio-Ecosystems Exacerbated by Tourism and Natural Hazards in Indonesia: A View from Space and from the Households of Nusa Lembongan Island. Ocean Coast. Manag. 2021, 207, 1–8. [Google Scholar] [CrossRef]
  13. Bell, J.D.; Adams, T.J.; Johnson, J.E.; Hobday, A.J.; Gupta, A. Sen. Chap. 1. Pacific Communities, Fisheries, Aquaculture and Climate Change: An Introduction. In Vulnerability of Tropical Pacific Fisheries and Aquaculture to Climate Change; Bell, J.D., Johnson, J.E., Hobday, A.J., Eds.; Secretariat of the Pacific Community: Noumea, New Caledonia, 2011; pp. 1–48. [Google Scholar]
  14. UN—United Nations General Assembly. Transforming Our World: The 2030 Agenda for Sustainable Development; Cambridge University Press: Cambridge, UK, 2015; p. 35. [Google Scholar] [CrossRef] [Green Version]
  15. André, L.V.; Van Wynsberge, S.; Chinain, M.; Andréfouët, S. An Appraisal of Systematic Conservation Planning for Pacific Ocean Tropical Islands Coastal Environments. Mar. Pollut. Bull. 2021, 165, 20. [Google Scholar] [CrossRef]
  16. Chinain, M.; Gatti, C.M.I.; Darius, H.T.; Quod, J.P.; Tester, P.A. Ciguatera Poisoning: A Global Review of Occurrences and Trends. Harmful Algae 2020, 22. [Google Scholar] [CrossRef]
  17. Ehler, C.N.; Douvere, F. Marine Spatial Planning, A Step-by-Step Approach toward Ecosystem-Based Management; Intergovernmental Oceanographic Commission and Man and the Biosphere Programme. iOC Manual and Guides no. 53, iCaM Dossier no. 6; UneSCO: Paris, France, 2009; (In English). [Google Scholar] [CrossRef]
  18. Margules, C.R.; Pressey, R.L. Systematic Conservation Planning. Nature 2000, 405, 243–253. [Google Scholar] [CrossRef] [PubMed]
  19. Ball, I.R.; Possingham, H.P.; Watts, M.E. Marxan and Relatives: Software for Spatial Conservation Prioritization. In Spatial Conservation Prioritization. Quantitative Methods & Computational Tools; Moilanen, A., Wilson, K.A., Possingham, H.P., Eds.; Oxford university Press: Oxford, UK, 2009; pp. 185–195. [Google Scholar]
  20. Watts, M.E.; Ball, I.R.; Stewart, R.S.; Klein, C.J.; Wilson, K.; Steinback, C.; Lourival, R.; Kircher, L.; Possingham, H.P. Marxan with Zones: Software for Optimal Conservation Based Land- and Sea-Use Zoning. Environ. Model. Softw. 2009, 24, 1513–1521. [Google Scholar] [CrossRef] [Green Version]
  21. Moilanen, A.; Franco, A.M.A.; Early, R.I.; Fox, R.; Wintle, B.; Thomas, C.D. Prioritizing Multiple-Use Landscapes for Conservation: Methods for Large Multi-Species Planning Problems. Proc. R. Soc. B Biol. Sci. 2005, 272, 1885–1891. [Google Scholar] [CrossRef] [PubMed] [Green Version]
  22. Pressey, R.L.; Watts, M.E.; Barrett, T.W.; Ridges, M.J. The C-Plan Conservation Planning System: Origins, Applications, and Possible Futures. In Spatial Conservation Prioritization; Moilanen, A., Wilson, K.A., Possingham, H.P., Eds.; Oxford Biology: Oxford, UK, 2009; pp. 211–234. [Google Scholar]
  23. Hanson, J.O.; Schuster, R.; Morrell, N.; Strimas-Mackey, M.; Watts, M.E.; Arcese, P.; Bennett, J.; Possingham, H.P. Prioritizr: Systematic Conservation Prioritization in R. R Package Version 7.0.1. 2021. Available online: https://CRAN.R-project.org/package=prioritizr (accessed on 31 August 2021).
  24. Magris, R.A.; Pressey, R.L.; Mills, M.; Vila-nova, D.A.; Floeter, S. Integrated Conservation Planning for Coral Reefs: Designing Conservation Zones for Multiple Conservation Objectives in Spatial Prioritisation. Glob. Ecol. Conserv. 2017, 11, 53–68. [Google Scholar] [CrossRef]
  25. Venier, C.; Menegon, S.; Possingham, H.P.; Gissi, E.; Zanella, A.; Depellegrin, D.; Sarretta, A.; Barbanti, A.; McGowan, J. Multi-Objective Zoning for Aquaculture and Biodiversity. Sci. Total Environ. 2021, 785, 146997. [Google Scholar] [CrossRef] [PubMed]
  26. Delavenne, J. Conservation of Marine Habitats under Multiple Human Uses: Methods, Objectives and Constraints to Optimize a Marine Protected Areas Network in the Eastern English Channel; Université du Littoral Côte d’Opale: Dunkerque, France, 2012. [Google Scholar]
  27. Krueck, N.C.; Ahmadia, G.N.; Possingham, H.P.; Riginos, C.; Treml, E.A.; Mumby, P.J. Marine Reserve Targets to Sustain and Rebuild Unregulated Fisheries. PLoS Biol. 2017, 15, 1–20. [Google Scholar] [CrossRef] [PubMed] [Green Version]
  28. Cinner, J.E. Coral Reef Livelihoods. Curr. Opin. Environ. Sustain. 2014, 7, 65–71. [Google Scholar] [CrossRef]
  29. Hurtado, A.Q.; Gerung, G.S.; Yasir, S.; Critchley, A.T. Cultivation of Tropical Red Seaweeds in the BIMP-EAGA Region. J. Appl. Phycol. 2014, 26, 707–718. [Google Scholar] [CrossRef]
  30. Le Pennec, M.; Anastas, M.; Bichet, H.; Buestel, D.; Cochard, J.-C.; Cochennec-Laureau, N.; Coeroli, M.; Conte, E.; Correia, P.; Fougerousse-Tsing, A.; et al. Huître perlière et perle de Tahiti; Université de la Polynésie française: Faaa, French Polynesia, 2009; 204p, ISBN 978-2-9534554-2-7. [Google Scholar]
  31. Sangare, N.; Lo-Yat, A.; Le Moullac, G.; Pecquerie, L.; Thomas, Y.; Lefebvre, S.; Le Gendre, R.; Beliaeff, B.; Andréfouët, S. Impact of Environmental Variability on Pinctada Margaritifera Life-History Traits: A Full Life Cycle Deb Modeling Approach. Ecol. Modell. 2020, 423, 109006. [Google Scholar] [CrossRef]
  32. Andréfouët, S.; Dutheil, C.; Menkes, C.E.; Bador, M.; Lengaigne, M. Mass Mortality Events in Atoll Lagoons: Environmental Control and Increased Future Vulnerability. Glob. Chang. Biol. 2015, 21, 195–205. [Google Scholar] [CrossRef] [PubMed]
  33. Hoeksema, B.W.; Benzoni, F. Multispecies Aggregations of Mushroom Corals in the Gambier Islands, French Polynesia. Coral Reefs 2013, 32, 1041. [Google Scholar] [CrossRef] [Green Version]
  34. Chevalier, J.P. Aperçu sur les Scléractiniaires des Iles Gambier. Cahier du Pacifique 1974, 18, 615–627. [Google Scholar]
  35. DRM—Direction des Ressources Marines. Zones Maritimes Réglementées; Direction des Ressources Marines: Papeete, French Polynesia, 2020.
  36. Yasumoto, T.; Inoue, A.; Bagnis, R.; Adaci, R. Finding of a dinoflagellate as a likely culprit of ciguatera. Bull. Jap. Soc. Sci. Fish 1977, 43, 1021–1026. [Google Scholar] [CrossRef] [Green Version]
  37. Bambridge, T. The Rahui: Legal Pluralism in Polynesian Traditional Management of Resources and Territories; Bambridge, T., Ed.; ANU-Press: Camberra, Australia, 2016; Available online: http://press.anu.edu.au/?p=337293 (accessed on 22 February 2022).
  38. Naidoo, R.; Balmford, A.; Ferraro, P.J.; Polasky, S.; Ricketts, T.H.; Rouget, M. Integrating Economic Costs into Conservation Planning. Trends Ecol. Evol. 2006, 21, 681–687. [Google Scholar] [CrossRef]
  39. Andréfouët, S.; Muller-Karger, F.E.; Robinson, J.A.; Kranenburg, C.; Torres-Pulliza, D.; Spraggins, S.A.; Murch, B. Global Assessment of Modern Coral Reef Extent and Diversity for Regional Science and Management Applications: A View from Space. In Proceedings of the 10th International Coral Reef Symposium, Japanese Coral Reef Society, Okinawa, Japan, 28 June–2 July 2004; Suzuki, Y., Nakamori, T., Hidaka, M., Kayanne, H., Casareto, B.E., Nadaoka, K., Yamano, H., Tsuchiya, M., Yamazato, K., Eds.; Japanese Coral Reef Society: Okinawa, Japan, 2006; pp. 1732–1745. [Google Scholar]
  40. Andréfouët, S.; Bionaz, O. Lessons from a Global Remote Sensing Mapping Project. A Review of the Impact of the Millennium Coral Reef Mapping Project for Science and Management. Sci. Total Environ. 2021, 776, 145987. [Google Scholar] [CrossRef]
  41. André, L.V.; Van Wynsberge, S.; Chinain, M.; Gatti, C.M.I.; Dempsey, A.; Andréfouët, S. A Framework for Mapping Local Knowledge on Ciguatera and Artisanal Fisheries to Inform Systematic Conservation Planning. ICES J. Mar. Sci. 2021, 78, 1357–1371. [Google Scholar] [CrossRef]
  42. Andréfouët, S.; Thomas, Y.; Dumas, F.; Lo, C. Revisiting Wild Stocks of Black Lip Oyster Pinctada Margaritifera in the Tuamotu Archipelago: The Case of Ahe and Takaroa Atolls and Implications for the Cultured Pearl Industry. Estuar. Coast. Shelf Sci. 2016, 182, 243–253. [Google Scholar] [CrossRef] [Green Version]
  43. Ardron, J.A.; Possingham, H.P.; Klein, C.J. Marxan Good Practices Handbook, Version 2; Ardron, J.A., Possingham, H.P., Klein, C.J., Eds.; Pacific Marine Analysis and Research Association: Victoria, BC, Canada, 2010; Volume 2010. [Google Scholar]
  44. Van Wynsberge, S.; Andréfouët, S.; Gaertner-Mazouni, N.; Remoissenet, G. Conservation and Resource Management in Small Tropical Islands: Trade-Offs between Planning Unit Size, Data Redundancy and Data Loss. Ocean Coast. Manag. 2015, 116, 37–43. [Google Scholar] [CrossRef]
  45. Léopold, M.; Guillemot, N.; Rocklin, D.; Chen, C. A Framework for Mapping Small-Scale Coastal Fisheries Using Fishers’ Knowledge. ICES J. Mar. Sci. 2014, 17, 12. [Google Scholar] [CrossRef] [Green Version]
  46. Beyer, H.L.; Dujardin, Y.; Watts, M.; Possingham, H.P. Solving Conservation Planning Problems with Integer Linear Programming (Appendices). Ecol. Modell. 2016, 2010, 1–16. [Google Scholar]
  47. Possingham, H.P.; Ball, I.R.; Andelman, S. Mathematical Methods for Identifying Representative Reserve Networks. In Quantitative Methods for Conservation Biology; Ferson, S., Burgman, M., Eds.; Springer: New York, NY, USA, 2000; pp. 291–305. [Google Scholar] [CrossRef]
  48. Justeau-Allaire, D. Constraint-Based Systematic Conservation Planning, A Generic and Expressive Approach; Université Montpellier 2: Montpellier, France, 2020. [Google Scholar]
  49. André, L.V. Systematic Spatial Planning for the Management of Black Pearl Farming Islands in the Pacific, with A Multi-Criteria Approach (Biodiversity, Resources, Uses, Ciguatera); Sorbonne Université ED 129: Paris, France, 2021. [Google Scholar]
  50. Cheok, J.; Pressey, R.L.; Weeks, R.; Andréfouët, S.; Moloney, J. Sympathy for the Devil: Detailing the Effects of Planning-Unit Size, Thematic Resolution of Reef Classes, and Socioeconomic Costs on Spatial Priorities for Marine Conservation. PLoS ONE 2016, 11, e0164869. [Google Scholar] [CrossRef] [PubMed] [Green Version]
  51. Kabbadj, L.; Van Wynsberge, S.; Andréfouët, S. Scaling Tropical Island Conservation Planning to the Regional Level Can Lead to Unbalanced Ecological Representation and Poor Social Equity among Islands. Mar. Policy 2018, 93, 31–39. [Google Scholar] [CrossRef]
  52. Reisser, C.M.O.; Le Gendre, R.; Chupeau, C.; Lo-Yat, A.; Planes, S.; Andréfouët, S. Population Connectivity and Genetic Assessment of Exploited and Natural Populations of Pearl Oysters within a French Polynesian Atoll Lagoon. Genes 2020, 11, 426. [Google Scholar] [CrossRef] [PubMed] [Green Version]
  53. Thomas, Y.; Dumas, F.; Andréfouët, S. Larval Connectivity of Pearl Oyster through Biophysical Modelling; Evidence of Food Limitation and Broodstock Effect. Estuar. Coast. Shelf Sci. 2016, 182, 283–293. [Google Scholar] [CrossRef] [Green Version]
  54. Dutheil, C.; Andréfouët, S.; Jullien, S.; Le Gendre, R.; Aucan, J.; Menkes, C. Characterization of South Central Pacific Ocean Wind Regimes in Present and Future Climate for Pearl Farming Application. Mar. Pollut. Bull. 2020, 160. [Google Scholar] [CrossRef]
  55. André, L.V.; Chinain, M.; Gatti, C.M.I.; Liao, V.; Van Wynsberge, S.; Tedesco, P.; Andréfouët, S. A Systematic Prioritization Approach for Identifying Suitable Pearl Oyster Restocking Zones Following a Mass Mortality Event in Takaroa Atoll, French Polynesia. Mar. Pollut. Bull. 2022, 176, 113472. [Google Scholar] [CrossRef]
  56. Jacquet, J.; Pauly, D. Funding Priorities: Big Barriers to Small-Scale Fisheries. Conserv. Biol. 2008, 22, 832–835. [Google Scholar] [CrossRef]
  57. FAO. The State of the World Fisheries and Aquaculture 2018—Meeting the Sustainable Development Goals; Licence: CC BY-NC-SA 3.0 IGO; FAO: Rome, Italy, 2018; Volume 35. [Google Scholar]
  58. Grafeld, S.; Oleson, K.L.L.; Teneva, L.; Kittinger, J.N. Follow That Fish: Uncovering the Hidden Blue Economy in Coral Reef Fisheries. PLoS ONE 2017, 12, e0182104. [Google Scholar] [CrossRef] [Green Version]
  59. Zeller, D.S.; Booth, S.; Pauly, D. Fisheries Contributions to the Gross Domestic Product: Underestimating Small-Scale Fisheries in the Pacific. Mar. Resour. Econ. 2007, 21, 355–374. [Google Scholar] [CrossRef] [Green Version]
  60. Bell, J.D.; Kronen, M.; Vunisea, A.; Nash, W.J.; Keeble, G.; Demmke, A.; Pontifex, S.; Andréfouët, S. Planning the Use of Fish for Food Security in the Pacific. Mar. Policy 2009, 33, 64–76. [Google Scholar] [CrossRef] [Green Version]
  61. Kronen, M.; Pinca, S.; Magron, F.; McArdle, B.; Vunisea, A.; Vigliola, L.; Kulbicki, M.; Andréfouët, S. Socio-Economic and Fishery Indicators to Identify and Monitor Artisanal Finfishing Pressure in Pacific Island Countries and Territories. Ocean Coast. Manag. 2012, 55, 63–73. [Google Scholar] [CrossRef]
  62. Thiault, L.; Collin, A.; Chlous, F.; Gelcich, S.; Claudet, J. Combining Participatory and Socioeconomic Approaches to Map Fishing Effort in Smallscale Fisheries. PLoS ONE 2017, 12, e0176862. [Google Scholar] [CrossRef] [PubMed] [Green Version]
  63. Aswani, S.; Lauer, M. Incorporating Fishermen’s Local Knowledge and Behavior into Geographical Information Systems (GIS) for Designing Marine Protected Areas in Oceania. Hum. Organ. 2006, 65, 81–102. [Google Scholar] [CrossRef]
  64. Bell, J.D.; Albert, J.; Andréfouët, S.; Andrew, N.L.; Blanc, M.; Bright, P.; Brogan, D.; Campbell, B.; Govan, H.; Hampton, J.; et al. Optimising the Use of Nearshore Fish Aggregating Devices for Food Security in the Pacific Islands. Mar. Policy 2015, 56, 98–105. [Google Scholar] [CrossRef]
  65. Bell, J.D.; Cisneros-Montemayor, A.; Hanich, Q.; Johnson, J.E.; Lehodey, P.; Moore, B.R.; Pratchett, M.S.; Reygondeau, G.; Senina, I.; Virdin, J.; et al. Adaptations to Maintain the Contributions of Small-Scale Fisheries to Food Security in the Pacific Islands. Mar. Policy 2018, 88, 303–314. [Google Scholar] [CrossRef]
  66. DRM. 2020. Available online: http://www.ressources-marines.gov.pf/cdi/bulletin-statistique/chiffres-cles-peche-aquaculture-et-perliculture-en-polynesie-francaise/ (accessed on 31 August 2021).
  67. Remoissenet, G.; Wabnitz, C. Postlarval Capture and Culture of Tridacna Maxima Giant Clams in French Polynesia. SPC Fish. Newsl. 2012, 139, 16–19. [Google Scholar]
  68. IUCN. French Polynesia Case Study. Sustainable Use, Mariculture and Conservation of Giant Clams in the Marine Regulated Fishing Area Reao Atoll, Tuamotu. Case Study N° 4; IUCN: Gland, Switzerland, 2021. [Google Scholar]
  69. Wabnitz, C.C.C. SPC ACTIVITIES Commercial Marine Aquarium Surveys in Samoa; SPC Fisheries Newsletter #146: Nouméa, New Caldonia, 2015; pp. 11–13. [Google Scholar]
  70. Duvat, V. L’évolution de La Recherche Sur Les Systèmes Coralliens (1960–2007). VertigO 2008, 8, 1–17. [Google Scholar] [CrossRef]
  71. Eger, S.L.; Courtenay, S.C. Integrated Coastal and Marine Management: Insights from Lived Experiences in the Bay of Fundy, Atlantic Canada. Ocean Coast. Manag. 2021, 204, 105457. [Google Scholar] [CrossRef]
  72. Mills, M.; Weeks, R.; Pressey, R.L.; Gleason, M.G.; Eisma-osorio, R.; Lombard, A.T.; Harris, J.M.; Killmer, A.B.; White, A.; Morrison, T.H. Real-World Progress in Overcoming the Challenges of Adaptive Spatial Planning in Marine Protected Areas. Biol. Conserv. 2015, 181, 54–63. [Google Scholar] [CrossRef]
  73. Winter, K.B.; Rii, Y.M.; Reppun, F.A.W.L.; Delaforgue Hintzen, K.; Alegado, R.A.; Bowen, B.W.; Bremer, L.L.; Coffman, M.; Deenik, J.L.; Donahue, M.J.; et al. Collaborative Research to Inform Adaptive Comanagement: A Framework for the Heʻeia National Estuarine Research Reserve. Ecol. Soc. 2020, 25, 1–17. [Google Scholar] [CrossRef]
  74. Gillett, R. Fisheries in the Economies of Pacific Island Countries and Territories; Pacific Community: Nouméa, New Caledonia, 2016; 684p, Available online: https://www.spc.int/resource-centre/publications/benefish-report-by-gillett-fisheries-in-the-economies-of-pacific (accessed on 22 February 2022).
  75. Cinner, J.E.; Daw, T.; McClanahan, T.R. Socioeconomic Factors That Affect Artisanal Fishers’ Readiness to Exit a Declining Fishery. Conserv. Biol. 2009, 23, 124–130. [Google Scholar] [CrossRef] [PubMed] [Green Version]
Figure 1. Study-site characteristics. (A). Location of Gambier in French Polynesia. (B). Gambier lagoon and islands. (C). Concessions for pearl oyster farming. Under the buoys lie the lines with baskets of oysters. (D). Black pearls harvested in Gambier. (E). Baskets of adult pearl oysters ready for grafting. (F). Local fish catches for livelihood. (G). Remarkable Fungia coral communities.
Sustainability 14 03871 g001
Figure 2. Graphical description of the three types of optimization scenarios. Optimal farm concession zones are in green, conservation zones in purple, oyster restocking zones in blue, spat collection zone in yellow, and the remaining area (open to fishing) in grey.
Sustainability 14 03871 g002
Figure 3. Spatial information on Gambier lagoon. (A). Gambier habitat map (Layer 1), including here 77 classes. Complete legend is provided in Supplementary Materials. (B). Distribution of live coral benthos and Fungia communities (from Layer 1). (C). Fishery catch aggregated by planning unit (PU) (Layer 8). (D). Fishery-ciguatera index aggregated by PU (Layer 9). (E). The extent of the present (as in BAU) farm concessions (Layer 6) overlaid on Fungia communities; extent of spat collecting zone (Layer 5) and its overlap with wild oyster stock (Layer 4). (F). Farm suitability index by PU (Layer 11).
Sustainability 14 03871 g003
Figure 4. The ‘business-as-usual’ (BAU) situation (A) and the best solutions in terms of zones distribution for each optimized scenario (BD).
Sustainability 14 03871 g004
Figure 5. Relative surface areas (RAz,sci) (A) and relative fishery–ciguatera index (RCz,sci) (B) of each zone z (x-axis) and each scenario sci (colors) as standardized by the BAU scheme when suitable or by the Sc1 when BAU was not available (for Conservation and Oyster Restocking zones).
Sustainability 14 03871 g005aSustainability 14 03871 g005b
Figure 6. Comparison between scenarios (in rows) on the repartition of the zones (colors), as measured using different indicators, or layers, (in columns) related to the objective (Surface area, Concessions as in BAU and Coral-Fungia) or costs (Fishery–ciguatera and Fishery catch).
Sustainability 14 03871 g006
Figure 7. Sensitivity analysis of the three optimization scenario under different cost layers (area in column 1, fishery-ciguatera in columns 2 and 4, or fishery catch in columns 3 and 5), and under boundary penalty variation (from low compactness in bottom row, to high compactness in top row). SCP best solutions display reshuffling of the different zones, in response to these settings.
Sustainability 14 03871 g007
Table 1. Principles of the spatial management options studied for Gambier.
Scenario or SchemeCriteriaGoals
BAU scheme‘Business-as-usual’The present use of the lagoon with pearl farming & fisheries-
Scenario 1Diversification 1Pearl farming
& conservation
Reach both the revised surface area targeted for the farming objective and conservation objectives while minimizing surface areas
Scenario 2Diversification 2Pearl farming,
conservation
& fisheries
Reach both the surface area targeted for the farming objective and conservation objectives while minimizing the loss of fishing grounds for fishers
Scenario 3‘Back-to-tradition’Conservation
& fisheries
Reach the conservation objectives while minimizing the loss of fishing grounds for fishers
Table 2. Synoptic table of the data layers used in this study.
GIS LayersObjectResolutionSource
Original informationLayer 1Habitat map77 classes/from 4 m image resolution This study
Layer 2Fishing grounds and
associated catch
Fishers mapping:
~1 ha precision
This study
Layer 3Ciguatera risk mapFishers mapping:
~1 ha precision
This study
Layer 4Wild oyster stock
abundance
Habitat resolutionThis study
Layer 5Spat collection areaLegal unit: 1 ha minDRM record
Layer 6Farm concessionsLegal unit: 1 ha minDRM record
Layer 7Traditionally managed sectorsContext-dependent
polygons
DRM record
Information aggregated by PULayer 8Fishery catch/PU10 ha PULayer 2 aggregated by PUs
Layer 9Fishery–ciguatera
index/PU
10 ha PUCombination of Layers 2 and 3,
aggregated by PUs
Layer 10Oyster restocking zones/PU10 ha PUCombination of Layers 1, 6, 7,
aggregated by PUs
Layer 11Farm suitability
index/PU
10 ha PUCombination of Layers 1, 6, 7,
aggregated by PUs
Table 3. The different zones, their associated layers, and their use in the different scenarios.
ZoneLayerObjective, Cost, or Locked ZoneScenario
Optimal farm concession zoneLayer 11Farming Objective1, 2
Conservation zone:
-
wild oyster stock,
-
live coral assemblage, and
-
Fungia spp. communities
Layer 1, 4Conservation Objective1, 2
Conservation zone:
-
live coral assemblage, and
-
Fungia spp. communities
Layer 1Conservation Objective3
Fishery (and ciguatera free) zoneLayer 8 or 9Fishery opportunity Cost2, 3
Conservation zoneLayer 1 Cost of the surface area of the conservation zone1
Oyster restocking zoneLayer 10Locked in a conservation zone1, 2
Spat collection zoneLayer 5Locked out from farm zone1, 2
Publisher’s Note: MDPI stays neutral with regard to jurisdictional claims in published maps and institutional affiliations.

