1. Introduction
Sustainable utilisation of urban retail space can be achieved by balancing environmental, societal, and economic needs. As the challenges facing the retail property sector (e.g., the demise of high streets, increasing store closures, vacancy rates, and void periods) continue to grow, the global mission towards sustainability and resilience remains an uphill task [
1]. In this sense, sustainability was considered through a dual focus in this paper: (1) the efficient use of retail property assets for economic purposes and (2) the impact of these physical retail assets on the local environment in terms of carbon footprint. In other words, within a given location, retail spaces can be optimally set out to minimise travelling distance of consumers, thereby reducing the carbon footprint of consumers and maximising the potential footfall (consumer movement towards retail properties) and dwell time (consumers stopping at retail properties) in retail locations. In turn, this process can lead to the more efficient performance of these assets through greater consumer interaction.
This then results in greater business turnover, demand for these optimum locations, and increased rental levels for landlords. The decision regarding where to shop is highly connected to accessibility which, if impeded, can discourage shopping and have an adverse effect on the sustainable performance of retail locations. Indeed, successful retail locations tend to be those that benefit from quality urban design and form, where adequate consideration is given to accessibility, pedestrian movement and transport connectivity [
2]. In this sense, a sustainable retail property is one that generates an optimum return for the landlord and turnover for tenants, emits low (no) carbon, and is positioned in an optimum location to reduce the carbon footprints of consumers, suppliers, employers, and others.
In line with the triple-bottom-line framework of sustainability [
3], it is becoming increasingly important for local planners, town centre managers, property developers, investors, landlords and retailers to have a thorough understanding of how consumer movement influences shopping behaviour and, by extension, retail location performance and viability [
4]. A clear understanding of the nexus of accessibility and retail location performance will also enable strategic planning, asset management, and the optimum utilisation of urban retail spaces. To this end, the central research question that guides this study is:
how does consumer movement influence the performance of retail locations?To consider this situation, the study applied an innovative space syntax methodology to measure accessibility (spatial distribution of retail consumers) across three UK cities. The study considered how optimum utilisation of urban retail space could be achieved through analysing the relationships between accessibility (using a consumer movement index) and the changes in rental value and floor area across these different locations. The principle on which the research was based is that analysis of accessibility and consumer movement (using space syntax methodology to compute spatial accessibility) in cities could inform the sustainable distribution of retail uses within a city. This is because consumer choice influences the decision making of retail occupiers, investors/landlords, and property developers. It is this spatial activity of retail consumers, in each location, that helps determine the sustainable vitality of the said location [
5].
The novel method adopted in this paper examines spatial accessibility and changes in retail rental value (demand), as well as changes in stock (supply) across the three UK cities, namely, Leeds, Newcastle, and York. The research adopted street network (spatial configuration) analysis, based on Space Syntax theory, to compute spatial accessibility as a measure of retail consumer movement across the sampled cities at different scales. The study offers original findings concerning the implication of the extent (scale) of city analysis in mapping the future location performance of retail spaces in the case study cities.
The remainder of this paper is divided into four sections.
Section 2 presents the research principles and conceptual framework, reviews key literature, and identifies gaps in the knowledge and understanding.
Section 3 introduces the method of analysis and identifies the data employed in the study.
Section 4 and
Section 5 present the analysis, results, and conclusions.
2. The Conceptual Framework
Several studies [
5,
6,
7,
8,
9,
10,
11,
12] have investigated the connections between street connectivity, urban land uses, and the inherent value of assets in associated locations. These studies have established different types of relationships between spatial accessibility, human movement, and land value. However, little is known regarding how spatial accessibility correlates with changes in retail rental value and stock across different locations, and it is this knowledge gap that this study sought to fill. The paper argues that if there is a significant relationship between spatial accessibility and changes in retail property value and/or stock in a given location, then it would be possible to forecast the future performance of that retail location using regression modelling where the latter is the dependent variable and the former the predictor.
As reported earlier in the paper, physical retailing relies on connecting streets, which serve as corridors for human movement within a city and the way a street network is laid out influences consumer movement flows, accessibility, and concentration of footfall [
3,
13]. This study, therefore, serves as an evidence base for urban policies and decisions that can drive the viability and success of retail locations and developments.
The study is significant for the following reasons. Firstly, the findings established that the future performance of retail locations can be understood by evaluating the relationship between accessibility and changes in demand for retail spaces. This evidence is vital because it has the potential to facilitate better decision-making concerning the planning, design, and management of retail locations and spaces. Secondly, the study is significant because it can serve as a reference for promoting urban sustainability agenda, especially in ensuring that urban land and premises are used optimally to maximise their social, economic, and environmental values. Retail developments are expected to deliver financial gains to developers and investors but they are also gaining increasing attention for their social value [
14]; the UK Green Building Council’s framework defines social value in terms of the wellbeing and quality of life improvements real properties can deliver to stakeholders. More specifically, ”in the context of the built environment, social value is created when buildings, places and infrastructure support environmental, economic and social wellbeing, and in doing so improve the quality of life of people” [
15] (p.4). According to this definition, any agenda that ensures the viability and success of retail locations and developments is ultimately helping to achieve sustainability in cities.
The importance of consumer movement on the successes of retail locations is relatively well known [
16]. However, the assessment and understanding of dynamic consumer spatial behaviour across urban retail spaces is comparatively rare. This is because it can be complicated to examine this situation due to the size, complexity, and volatility of collective consumer behaviour within a given location. Earlier studies [
17,
18,
19] that investigated consumer spatial behaviour across cities have typically relied on observational and physiological methods. However, retail location theories that have explored spatial relationships between retail rental value and accessibility have not considered the possible implications of changes in spatial extent. Notable works such as bid rent theory [
6], concentric zone model [
20], and central place theory [
17] were established on the assumptions that city boundaries (and the dynamism within) are fixed. However, subsequent studies [
21,
22,
23] argue that such static concepts are beginning to lose relevance because of the dynamic changes in city morphology.
To consider this new situation, it is important to consider the possible influence of changes in the extent of city boundary on relationships between spatial accessibility and retail market performance (including, rental value, retail clustering, and property stock). This inherent changeability influences the evolution of locations associated with retail property and the overall street network of a given location. By using Space Syntax principles (and related software), this study sought to overcome several of the above limitations by examining the ‘street network’ to
comprehensively assess how consumers move ‘through’ and ‘to’ urban locations. Several studies have now applied spatial configuration analysis to investigate the relationship between spatial accessibility and urban economic data across different cities [
5,
12,
24,
25,
26]. However, these studies have not considered the possible implications of changes in the scale of street network city analysis.
Nevertheless, it is essential to note that the technique has been criticised for various reasons. For example, authors have challenged perceived inconsistencies and inherent assumptions that human movement follows a set of procedural rules while moving from one location to another [
27]. Other studies [
28,
29] have shown that humans exhibit random movement while navigating across street networks for different reasons, including shopping. These perceived shortcomings led to the formulation of normalised angular choice (NACH) [
30] to enhance its scientific explanation of human movement and relationships with urban socio-economic variables.
The underlying method in this paper rests upon the development of a Spatial Accessibility Index that denotes the concentration and distribution of human movement on a given street network. The hypothetical illustration in
Figure 1 illustrating the connection of streets (A, B, C, and D) helps to explain how analysing street connectivity can help inform human movement and the development of an accessibility score for a given location.
Figure 1 shows four connecting streets that permit human movement across the entire street network. However, the relative power, usefulness, and weight that individual streets contribute to ensuring movement across the entire street network differ. Conceivably, the role played by street ‘A’ is higher than those of B, C, and D for movement to exist across the street network. Put differently, without street A, movement will only be possible within individual streets and will not be able to extend beyond that individual street. However, without street B, movement is still possible across the remaining three streets (i.e., A, C, and D) and vice versa.
Consequently, street A is more likely to experience the highest natural movement than other connecting streets (B, C, and D). Therefore, the accessibility score of street A is the highest because of its location, position, and role in ensuring movement in the given street network. Meanwhile, streets B, C, and D have the lowest (and equal) accessibility scores. The addition of more connecting streets to
Figure 1 further explains the hierarchy of consumer movement in a given street network.
Figure 2 reveals that streets ‘E’ and ‘F’ have been added to the initial
Figure 1.
The above illustration (
Figure 2) shows that streets ‘C’ and ‘D’ are more important than streets ‘E’ and ‘F’, while street ‘A’ maintains its superiority over all other streets. This is because for movement to exist beyond streets E and F, there must be streets D and C respectively. In other words, the accessibility index of the streets re-prioritises as the street network extends. Meaning the initial lowest accessibility score for streets C and D in
Figure 1 has shifted to streets E and F because of the extensions in the street network.
Strictly speaking, a Spatial Accessibility Index of a given location within a city is not a fixed value, but is dependent on the extent of city analysis.Computation of the spatial accessibility of the street network can now be achieved using Space Syntax software (Depthmap), which is an open-source spatial configuration analysis tool that measures ‘to-movement’ and ‘through-movement’. Respectively, ‘to-movement’ and ‘through-movement’ indicate the integration (closeness) and choice (betweenness) values of individual street segments within a given street network. Simply put, ‘integration value’ is a measure of how close a street (or location) is to every other location within an analysed street network. It measures the possibility of moving towards that location if movement is evenly distributed across the street network [
31].
On the other hand, the choice value measures the possibility that a street (location) will be used as a connection to all other locations within the street network. In other words, the ‘choice value’ of a street indicates the probability that a given street will allow movement to every other location if movement is to be initiated across a given street network. Studies [
31,
32] have shown that these parameters reflect approximately 70% of the observed human movement within different cities (locations), despite not factoring human behaviours in their computations. The output was confirmed by [
30], who recorded an 80% match between configured spatial movement and observed/actual movements in the case study cities.
3. Method: Data and Procedures
This research applied four (4) basic steps to achieve the research objectives. The first step was to compute changes in demand and supply across the three sampled cities. The second step was to conduct spatial configuration (street segment) analysis on the underlying street network of the sampled cities at both mesoscale (2 km radii) and macroscale (10 km radii) to measure Spatial Accessibility Indexes. The third step was to examine the relationships between the retail property market and Spatial Accessibility Indexes across the analysed cities (at mesoscale and macroscale) to establish the significance of relationships across variables. The fourth step was to estimate retail location performance based on the significance of relationships between variables. The following subsections explain these four key steps.
3.1. Computing Changes in Retail Space Demand and Supply
In this paper, changes in retail rental value and changes in retail stock denote changes in demand and changes in the supply of retail spaces respectively [
5,
33,
34]. The changes in retail rental value and changes in retail stock (floor area) across the case study cities between 2010 and 2019 were computed. Business rates data from England’s Valuation Office Agency (VOA), which contain rental value, floor area, address, use, date of valuation, and special category (SCAT) codes across England and Wales, were used as the basis for establishing the changes in demand and supply of retail spaces across the studied cities. Retail property data across the three case study cities (specifically, Leeds, Newcastle, and York) were retrieved for 2010 and 2019 using the MS Access tool. To minimise errors and avoid bias, the research adopted the same sets of SCAT codes to define the extent (types) of retail property for the dates across the three cities. The extracted retail property data were then organised in tables using MS Access and MS Excel tools. Addresses (primarily postcodes) of the retail property units were then bulk geocoded to assist geospatial analysis in QGIS.
3.2. Computing Spatial Accessibility Indexes
Spatial accessibility was measured through spatial configuration analysis of the sampled cities at two scales using Depthmap. The street network for each of the three (3) sampled cities were obtained at mesoscales (2 km radii) and macroscales (10 km radii) from the Ordnance Survey OS maps. The mesoscale and macroscale can be attributed as the city centre and city-wide network respectively. OS MasterMap was adopted as a base map for the spatial configuration analysis because it is detailed and compatible with the other spatial analysis tools (mainly ArcGIS, QGIS and Depthmap) adopted in this research.
The OS data were verified and edited (by planarising and deleting non-connected street edges) in ArcGIS before being exported to Depthmap for spatial configuration (street segment) analysis. In Depthmap, global street segment analyses were run on each of the investigated street networks (Leeds mesoscale, Leeds macroscale, Newcastle mesoscale, Newcastle macroscale, York mesoscale, and York macroscale) to obtain the values of integration, choice, and NACH parameters for all the street segments within the network. The values of integration, choice, and NACH parameters as obtained from the Depthmap were syntactic values that were ranked into percentiles for a meaningful interpretation of the accessibility scores as shown in
Table 1.
The relationships between the accessibility indexes of integration, choice, and NACH parameters were investigated with the changes in retail rental value and stock for all the sampled layouts.
3.3. Relationship Analyses between Variables
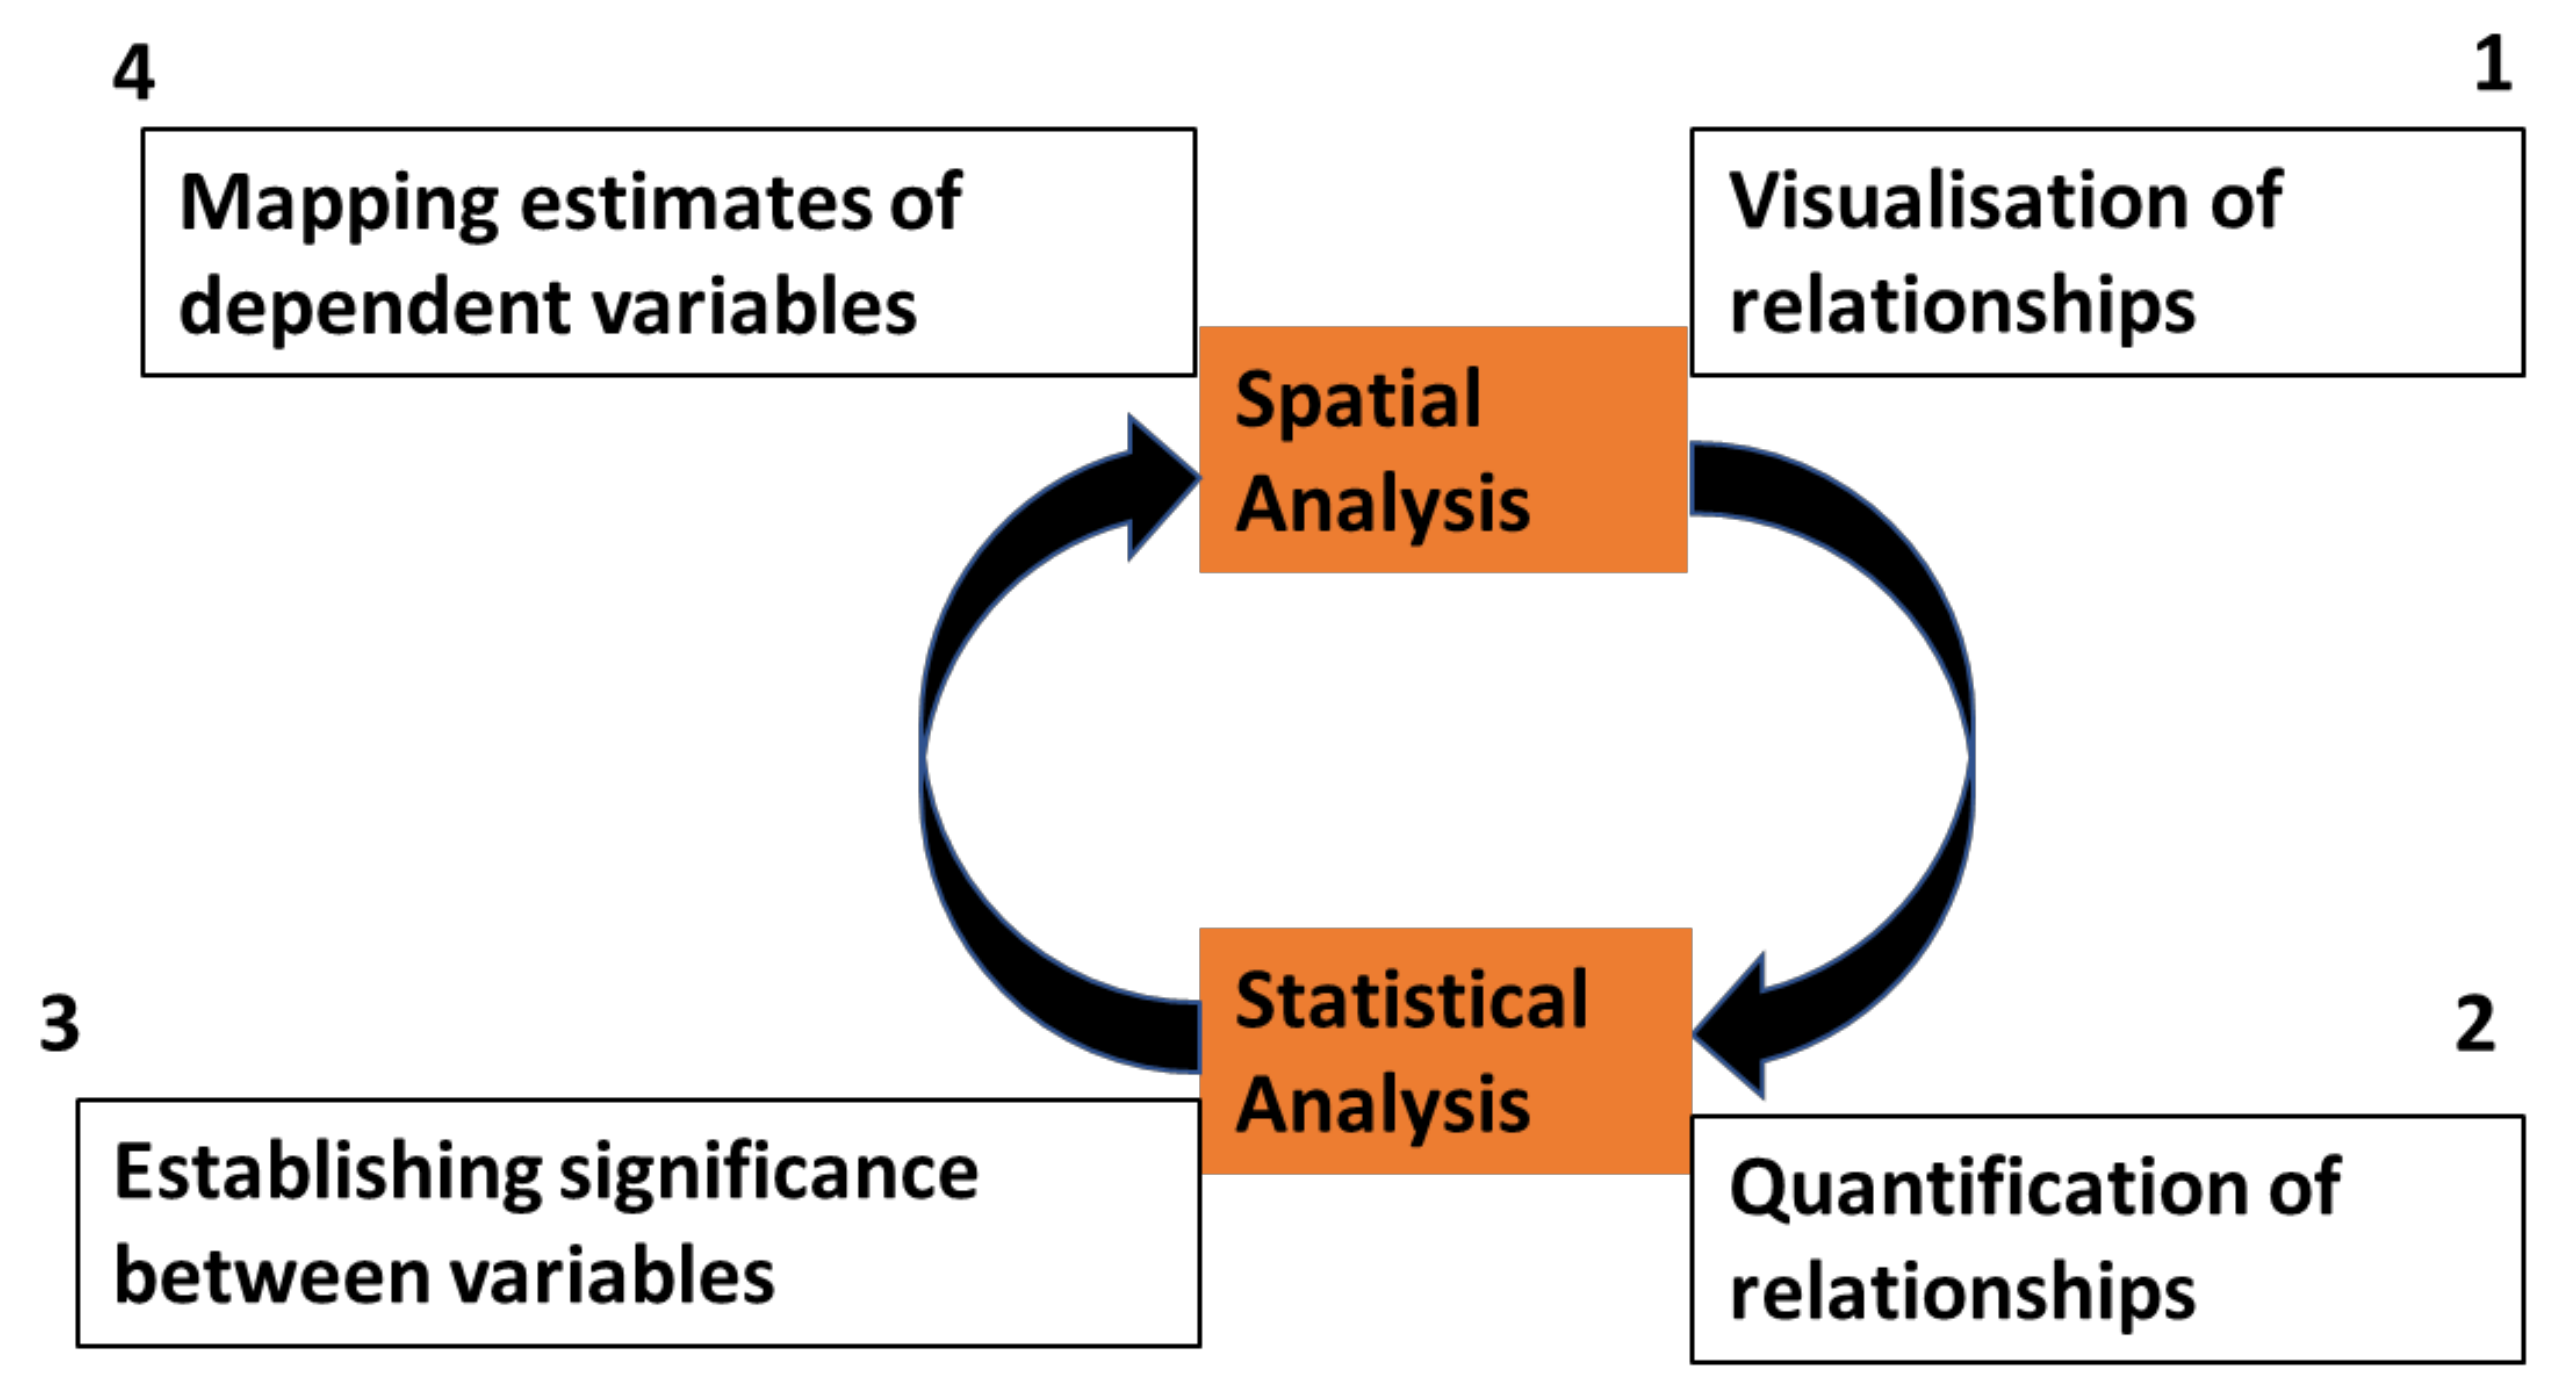
Spatial and statistical analyses were conducted in investigating the relationships between accessibility indexes (independent variables) and changes in the demand/supply of retail space (dependent variables) in the cyclical and iterative process, as shown in
Figure 3.
The initial spatial analysis between the investigated variables was examined in QGIS to visualise the relationships and prepare variables for statistical analysis. Thereafter, statistical analysis was conducted to perform two key roles. The first role was to quantify the visualised relationships between variables. The second was to determine the significance/insignificance relationships between the variables while testing for Spearman’s rho correlation. Subsequently, spatial analyses were conducted in QGIS to map the estimates of the dependent variables (changes in demand/supply) using the coefficients of the independent variables obtained from the earlier statistical analysis (namely, Spearman’s rho correlation test). (Spearman’s rho correlation test was adopted since the investigated variables are ranked values).
Having computed the changes in retail rental value and stock and completed spatial configuration analysis to obtain accessibility values of integration, choice, and NACH parameters, all variables were imported into QGIS as point features. It is important to emphasise that the configured street network was exported from Depthmap as point format rather than linear format. This was necessary to ensure the objectives of estimating and mapping the future location performance of retail spaces across the sampled layouts were achieved. Specifically, exporting the accessibility parameters as linear features would have limited this investigation to only quantifying and visualising the relationships between variables. Subsequently, three basic steps were taken in QGIS at the initial spatial analysis stage (before the statistical analysis). These steps comprised:
Delineating spatial layouts into grids (locations),
Joining attributes of points features to grids, and
Grouping attributes of variables
The above steps were taken to define and delineate the analysed cities (retail) spaces into locations. Put differently, analyses were based on delineated locations and not individual retail stores and street segments.
3.3.1. Delineating Spatial Layouts into Grids (Locations)
All the sampled cities were delineated into locations using the vector grid tool in QGIS. This was necessary to establish a uniform basis for localised relationship analyses between computed changes in demand/supply and Spatial Accessibility Indexes at mesoscale and macroscale levels. This is because the study understands that relationships between variables could vary across locations and should be seen as such for practical applications. To maintain uniformity in approach, the same sizes of grid tiles were adopted in defining locations at macroscales and mesoscales across the three sampled cities. The sizes of the grid tiles (polygonal feature) at macroscales and mesoscales were specified as 500 m by 500 m and 200 m by 200 m tiles respectively. These sizes were chosen because of the intelligibility view at mesoscale and macroscales (having experimented with different sizes). Subsequently, the attributes of all the investigated variables (in point features) were later joined to the delineated grids in QGIS.
3.3.2. Joining Attributes of Point Features to Grids
A join-attribute-by-location tool in QGIS was adopted to join the variable attributes to grid positions. Thus, the accessibility values of integration, choice, and NACH and computed changes in rental value and stock were spatially attached to the correct grid tiles. Intrinsically, the distribution of points of the accessibility parameters (integration, choice, and NACH) depict the street network pattern, while that of changes in retail demand and supply reveals the concentration pattern of retail activities across the sampled cities. The joined attributes were later grouped per delineated grid tiles.
3.3.3. Grouping Attributes of Variables
Group-stat tool in QGIS was adopted in calculating (summing and averaging) the attributes of variables per grid. In doing so, the attributes of variables (point feature) were converted and merged into the delineated grids (polygonal feature). Changes in retail rental value and stock were computed per grid by summing up the attributes of these variables in each grid.
Meanwhile, computation of accessibility was completed by averaging the syntactic values of integration, choice, and NACH per grid tile. The logic behind averaging (and not summing up) accessibility values per grid was that these values are nominal and, intrinsically, summing up would disrupt the accessibility outputs of spatial configuration (street network) analysis as obtained from Depthmap. Experiments in this research confirmed that averaging the syntactic/accessibility values of variables per grid (polygonal feature) maintains a similar visual interpretation with street network analysis (linear feature), as obtained in Depthmap. However, there were obvious dissimilarities in visual interpretation when accessibility values were summed for each grid. Consequently, relationships between averaged accessibility values of integration, choice, NACH (independent variables), and summed changes in retail rental value and stock (dependent variables) per grid tile were conducted across the sampled cities at mesoscales and macroscales.
Table 2 summarises the number of retail property units, street segments, and grid tiles across the cities at mesoscale and macroscales.
Having grouped the variables into locations, Spearman’s rho correlation tests were conducted to determine the significance/insignificance of relationships between variables per delineated grid tiles across the spatial layouts. This resulted in estimating and mapping retail location performance using coefficients of accessibility parameters.
3.4. Relationship Analyses between Variables
Statistical analyses of Spearman’s rho correlation tests that establish the significance/insignificance of relationships between dependent variables (changes in retail rental value and changes in retail stock) and independent variables (integration, choice, and NACH) were useful in the estimating and mapping of retail location performance. In this experimental research, the
significance of relationships between variables in the Spearman rho correlation tests was the condition for estimating the dependent variables in a city layout. Namely, for an estimate of either change in retail rental value or change in retail stock to be made, all the three accessibility indexes (integration, choice, and NACH) must exhibit a significant relationship with the dependent variables [
30]. Setting up such a condition aims to improve the likelihood of estimating retail location performance correctly.
Intrinsically, the study developed a preceding regression equation to estimate changes in retail rental value and/or changes in retail stock using the coefficients of integration, choice, and NACH parameters as follows:
where ‘a’ is the constant coefficient value; ‘b’ is the corresponding coefficient of accessibility indexes; ‘e’ is the error term.
The above equations were applied to all the investigated cities at mesoscales and macroscales. The formula equations were populated for all locations that were deemed estimable based on the conditions of variables demonstrating significant relationships. The results (that is, estimates of retail location performance) were ranked into very high, high, neutral, low, and very low for visualisation in QGIS.
5. Conclusions and Area of Further Research
This paper investigated the relationships between the demand and supply of retail space and Spatial Accessibility in Leeds, Newcastle, and York at two scales to estimate retail location performance with a view to understanding how retail locations can be managed sustainably. Results showed that accessibility of retail location influences the demand for retail spaces to a higher degree than the supply of retail spaces. That is, the relationships between changes in retail rental value and Spatial Accessibility could help in estimating the future of retail location performance in cities. Moreover, the results revealed the heterogeneous nature of cities and the importance of taking into consideration the scale at which the city is being analysed when investigating the relationships between urban economic data and spatial configuration parameters.
Investigations have shown that scientific computation of retail consumer movement via spatial configuration can enhance the application of relationships between accessibility and retail property markets in given locations. The practical applications of relationships between land value and accessibility were enhanced by estimating and mapping the future location performance of retail spaces. Specifically, such outputs can support strategic decisions on sustainable urban retail investment, development, occupation, and planning. Similarly, findings from this study can be applied to improve urban resilience, place-making and sustainability policies, planning and development strategies, especially concerning vitality, viability and socio-economic value of retail locations and properties.
This paper showed that there is a stronger relationship between variables at mesoscale across all the sampled layouts. Therefore, the paper recommends further investigation of relationships between variables at a smaller scale (microscale), depending on the practical application of outputs (maps). Furthermore, whilst this research only considered limited accessibility indexes, the paper identified the possibilities of updating the predicting model using other local (controlled) variables of integration to estimate retail location performance. Similarly, other existing econometric models, such as Spatial Error Model, Spatial Lag Model, and Spatial Durbin Model, can be adopted in estimating the spatio-temporal performance of retail locations across cities. Finally, this research calls for a similar investigation of other cities and property types, whilst implementing a similar methodology and research techniques to measure and estimate property locational performance at different spatial scales. This will contribute significantly to making retail locations sustainable to meet the environmental, economic, and social sustainability agenda in cities.


