Article

Compressive Strength of Stabilised Granitic Residual Soil Using Mixture of Pineapple Fibre—Hydrated Lime

by
Zeety Md Yusof
1,
Abdullah Mahgoob Yahya Al-Adhami
2 and
Mohd Effendi Ewan Mohd Matore
3,*
1
Faculty of Civil Engineering and Built Environment, University Tun Hussein Onn, Batu Pahat 86400, Malaysia
2
Faculty of Engineering, Technology and Built Environment, UCSI University Kuala Lumpur, Batu Pahat 86400, Malaysia
3
Faculty of Education, University Kebangsaan, Bangi 43600, Malaysia
*
Author to whom correspondence should be addressed.
Sustainability 2022, 14(7), 3826; https://doi.org/10.3390/su14073826
Submission received: 18 February 2022 / Revised: 20 March 2022 / Accepted: 20 March 2022 / Published: 24 March 2022
(This article belongs to the Section Sustainable Engineering and Science)

Abstract

:
Granitic Residual Soil (GRS), referring to the weathered soil from rocks, widely exists all over the world, especially in tropical regions. This type of soil is considered weak for construction due to unsaturated soils and the fact that granitic soil properties can vary from one location to another during formation. As a result, soil stabilisation is necessary. In Malaysia, pineapple fibre (PA fibre) is one of the most widely available waste materials. Chemical stabilisation technology is an attractive stabilisation technique that has been successfully used as a soil stabilising agent for many years. Hydrated lime (HL) is an activation agent and is very commonly used to replace cement application in soil stabilisation. Utilising HL and PA fibre as a soil stabilising agent is an economical and sustainable option as HL contains high pozzolanic characteristics that make it more suitable and reliable to stabilise soil, and PA fibre has high specific stiffness and strength. This study uses the replacement portion of the GRS with stabilising agents—HL and PA fibre, aiming to achieve Malaysia’s green technology goals by balancing economic expansion and environmental privilege. However, the aim of this study is to determine the effect of HL–PA fibre mixture replacement on the performance of mechanical and physical properties enhancements of GRS. GRS is the control sample whereas HL and PA fibre are used as binders. The unconfined compressive strength with the curing period was tested. The result showed that for untreated GRS, the moisture content, Atterberg limit, and specific gravity were 9.44%, 37.3%, and 2.3%, respectively, while the maximum dry density was 1.55 g/cm3 and the optimum moisture was 13.5%, according to the compaction test. Due to weathering conditions, the soil was classified using the Unified Soil Classification System (USCS) as well-graded sand soil, based on the sieve analysis. Sieved soil of 2 mm was used to stabilise the GRS mix with HL and PA fibre. The resulting UCS showed that 0 curing days increased strength by 31%, while 7 curing days increased strength by 26% before decreasing the strength by 8.4% to 9%.

1. Introduction

Malaysia is controlled by two kinds of residual soil: granitic residual soil (GRS) and residual sedimentary soils (RSS). GRS is the most common type of soil in Malaysia and covers around 75% of Malaysian land [1]. The properties of this soil differ widely from one place to another during formation, depending on the type of stone and the atmosphere in the region [1]. Based on this, the physical properties of GRS showed that it has higher sand range percentages, about 54% to 63%, followed by the percentage of silt (32% to 42%) and clay (1% to 6%). Due to this, GRS was classified as having intermediate plasticity index of 9.90% to 11.99% [2].
Generally, the unsaturated GRS is often found above the groundwater level. In tropical regions, most of the structures deal with this type of soil. Commonly unsaturated soil makes the engineering properties quite challenging because the unsaturated condition is more susceptible to volume change. It has a high void ratio between the soil particles, which will result in failure or damage to the structural foundation due to the excessive deformation and volume change. Furthermore, the determination of GRS strength is difficult due to the diverse composition of the soil as well as the difficulties of obtaining undisturbed samples of good quality [3].
The basic geotechnical properties of GRS, obtained by different researchers that conducted tests in several sites and conditions, have been reviewed by [4]. Based on [4], lab testing-related GRS properties such as moisture content, specific gravity, particle size distribution, Atterberg limit and soil shear strength have been studied.
The use of chemical additives such as cement, lime, bitumen, and fly ash is common practice to stabilise soft or wet fine-grained soils before they are built upon. This can be achieved through the use of traditional and non-traditional agents. The distinction between the two classes exists as a result of the pre-existing and well-established additives as compared to the most recently developed agents. Examples of traditional chemical stabilisation agents include lime, cement, bitumen, and fly ash and they are usually calcium-based [5]. Hydrated lime (HL) was observed to be the most effective additive [6] and as a consequence, it is now specified in many states, and it is estimated that 40 Mt of asphalt mixtures are now produced in the USA each year with hydrated lime [7].
Moreover, in [5], researchers determined the performance effectiveness of different percentages (0%, 2.5%, 7.5%, and 10%) of quick and hydrated lime when applied separately to the soil of tropical and sub-tropical regions. As mentioned in [6,8,9], hydrated lime enhanced the strength by increasing the curing time but need additional admixture. According to [5], hydrated lime has an attractive stabilisation technique in geotechnical and geo-environmental applications projects for soil. Hydrated lime is capable of providing calcium ions, the primary ingredient necessary for stabilising soil, in sufficient amounts, though the soils differ slightly in the mode of reaction in the presence of water.
The most popular ground improvement techniques are to enhance the soil properties as well as control the volume change. The GRS can achieve engineering properties such as compaction characteristics by adding HL. The HL also has a visible effect on decreasing both the plasticity and capacity of swelling and shrinkage. It also plays a big role in enhancing strength and workability because a soil–water–lime mixture increases due to the increased concentration of hydroxyl ions. The increased concentration of hydroxyl ions is caused by lime dissolution. Clay particles containing silica and alumina become soluble as the pH rises. As a result, lime provides calcium and a suitable chemical environment. In contrast, the soil provides the silica and alumina ions required to form cementitious compounds, specifically calcium-alumina silicates. These clay silicates and clay aluminates bind or gel with the clay particles, further reinforcing the soil [5,10,11].
Pineapple fibre (PA fibre), a waste product material, can be a new source of raw material for the construction industry. It is an effective replacement for synthetic fibres. PA fibre has high stiffness and strength. This is because it has a large cellulose content and is hydrophilic in nature [12]. In addition, the use of PA waste is an alternative and sustainable source of natural fibres for building material because it has a high tensile strength, which improves its engineering properties, especially bearing capacity and tensile strength [12,13,14]. Moreover, the PA fibre has stronger mechanical and physical properties, especially in tensile strength, compared to Sisal, Ramie, Jute, and Coir fibres [15,16,17]. A comparison of all available fibres with PA fibre has been reviewed by [13]. Furthermore, Ref. [13] stated that natural fibres such as fibre flax, seed flax and kenaf have been used as soil stabiliser. According to [12], PA fibre has been used in Malaysia and is abundantly available in waste materials produced every year [18]. In the study [12], different percentages of PA fibre (0%, 0.25%, 0.75%, and 1%) are used to determine the strength of the soil.
The concept unconfined compressive strength (UCS) test is a simple laboratory test and is the quickest and cheapest method to determine a measure of the UCS of soil [8]. Previous researchers such as [8,12,19] used the UCS test in their study to determine the strength of soft soil.
Therefore, this research aims to improve soil stability by introducing different percentages of PA fibre and HL into the soil and observing how the soil reacts after the addition of HL and PA fibre. A series of laboratory tests were undertaken to achieve the study objectives. The physical tests and UCS test were carried out in the civil engineering laboratory at UCSI University on untreated and processed soil samples, using different hydrated lime contents of 2.5%, 4.5%, 6.25%, and 9%, with 0.75% PA fibre after seven (7) days of curing. The selection of the HL and PA fibre percentage is based on the previous studies of [5] and [12], respectively. For the UCS, specimens were compacted using the British Standard Light (BSL) compaction effort, adopting curing periods of 7, 14, 21, and 28 days [20]. Therefore, this study chose 7 curing days to survey the early performance of the GRS mix with HL and PA fibre. The results of this experiment were analysed and discussed to gain a better knowledge of the effects of HL and PA on the tested GRS.

2. Materials and Method

This part contains a list of several procedures and methods utilised to accomplish the study’s goals. The main purpose of the research was to observe how mixing HL with PA fibres affects the engineering qualities of granitic residual soil. There are also various tests to assess the physical and mechanical properties of GRS.

2.1. Materials

This part discusses the materials that were utilised throughout this investigation. The materials employed in this study were GRS with PA fibre and HL.

2.1.1. Granitic Residual Soil (GRS)

The soil used in the experiment was taken from UCSI Heights, 1, Jalan Puncak Menara Gading, Taman Connaught, 56000 Cheras, Wilayah Persekutuan Kuala Lumpur. The GRS that was used in the study was taken specifically at latitude (3.087581°) and longitude (101.731328°), as shown in Figure 1. Figure 2 shows the distribution of GRS in Malaysia and another soil type.
The soil was extracted approximately 0.3–1 m below the surface. The samples were oven-dried, sieved and collected in accordance with the size of the particles through the 2 mm sieve.

2.1.2. Pineapple (PA) Fibre

PA fibre, which has high specific stiffness and strength, was used in this analysis. The PA fibre was bought from a local factory. The PA fibre was in a totally dry condition. It was kept at room temperature to control and maintain the same conditions and properties of the fibre. The diameter was in the range of 0.6–0.8 mm. It was approximately 1 foot long. For this study, the 1-foot-long samples of PA were each cut into 1.0–1.5 cm long pieces of fibre hair. Figure 3 shows the pineapple fibre that was used in this experiment. The percentage of PA fibre was selected based on the engineering properties of the soil. The soil with 0.75% PA showed a positive effect in its engineering properties based on the study of [12].

2.1.3. Hydrated Lime (HL)

The HL that was used in this study is a dry powder lime that was collected from CAO Industries Sdn Bhd, a local factory. The physical and chemical properties of hydrated lime that were used in this study are shown in Table 1.

2.2. Sample Preparation

The sample was prepared using a variety of standard codes, as provided in Table 2. The GRS was extracted at 0.5 m below the earth’s surface and prepared to determine the soil’s physical characteristics.

2.3. Experimental Method

Various methodologies were used in the study to investigate the physical parameters of GRS. The physical properties of the examined soil were also determined using particle size distribution, moisture content, compaction, Atterberg limit, and UCS. Furthermore, the British Standard (BS) 1377:1990 standards specify all facilities and processes [19,26,27,28,29].

2.3.1. Particle Size Distribution

Particle size distribution, commonly known as gradation, refers to distributing a soil’s dry mass throughout specific particle-size ranges. Soils are classed by gradation for engineering and other applications. The well-graded sand-grained soil type that was utilised in this experiment is granitic residual soil (GRS). The soil was classified using the Unified Soil Classification System (USCS) as well-graded sand soil, based on the sieve analysis. The grain-size distribution was used during this study, following British Standard (BS) 1377:1990 standards. Therefore, to classify the different sizes, a method called sieve analysis was used. The technique requires the layering of sieves with different grade sizes. The total weight of the soil after sieving was 1010 g, and the shaker was used for 10 min.

2.3.2. Moisture Content

Moisture content refers to the amount of water in the soil within the pore space between the soil particles that can be removed by oven drying at a temperature of no more than 110 degrees Celsius. The moisture content can be determined using Equation (1) [20].
W = (   m 2     m 3 m 3     m 1   )   ×   100 %
where:
W  is moisture content
m1  is the mass of container only (g)
m2  is the mass of container with wet soil (g)
m3  is the mass of container with dry soil (g)

2.3.3. Atterberg Limits

The Atterberg limits, which include plastic limit and the liquid limit, were determined by using British Standard (BS) 1377:1990 standards. The liquid limit is the amount of water content added to soil to shift it from the plastic condition to the liquid condition, while the plastic limit is the amount of water that changes the condition from plastic to semi-solid. The plastic and liquid limits were determined as the water content after drying the soil in the oven for 24 h.

2.3.4. Compaction Test

Compaction is the process through which soil particles become closely packed, increasing the soil’s dry density. The dry density was determined in this procedure. The moisture content is called optimum moisture content in this range and matches the optimal dry density optimum for this degree of compaction. The compaction test method followed British Standard (BS) 1377:1990 standards. Using Equations (2) and (3), we calculated each sample’s bulk and dry densities [20].
ρ b   = m v   unit   ( g / cm 3 )  
where:
v  is the volume of the mold (cm3)
m  is the mass of soil (g)
ρb  is the bulk density
ρ d = ρ b 100 + w unit   ( g / m 3 )
where:
w  is the moisture content (%)
ρd  is the dry density
ρb  is the bulk density

2.3.5. Specific Gravity

The specific gravity was determined by using the pycnometer method, and this test must be carried out at a constant temperature. The value of Gs can be calculated by using Equation (4) [20], following the procedure in British Standard (BS) 1377:1990 standards.
G S = m 2     m 1 ( m 2     m 1 )     ( m 3     m 4 )
where:
m1  is the weight of the pycnometer including the stopper (g)
m2  is he weight of pycnometer with dried soil only (g)
m3  is the weight include the pycnometer with water and soil (g)
m4  is the weight of pycnometer and water only (g)

2.3.6. Unconfined Compressive Strength (UCS)

The UCS test is well known and is systematically used in many experiments presented in soil stabilisation [30]. The purpose of this test is to determine the UCS of the stabilised soil with HL and PA by applying load to the sample till failure. The required load to smash the samples kN/m2. The UCS test was determined by using Equation (5) [20] and following the procedure in British Standard (BS) 1377:1990 standards.
σ = P A     unit   ( kN / m 2 )
where:
σ  is the stress
P  is the pressure (kN)
A  is the area (m2)
It was identified that there was a void ratio (0.82) of the soil specimens before the test. The denseness or looseness of the sample affected the value of unconfined compressive strength. Therefore, in every trial test, the specimen was maintained using the same method. The samples were sealed and labelled first before being kept in boxes. The boxes were sealed and stored in a moist curing room and left undisturbed for the curing days.
The mixing process of the UCS test was divided into two: unstabilised and stabilised soil. For unstabilised soil, the soil was 100% from GRS only. The purpose of the unstabilised soil was as a control sample. Stabilised soil was divided into two types, which were GRS mix with PA fibre and GRS mix with HL and PA Fibre.
For the stabilised GRS mix with PA fibre only, the stabilised soil was GRS mix with 0.75% PA fibre. The amount of PA fibre used was based on the wet weight of GRS. For example, 0.75% PA fibre means that with each 100 g of wet soil, 0.75 g PA fibre was added. The wet weight of GRS refers to soil + water.
For the stabilised GRS mix with HL and PA fibre, the stabilised soil was GRS mix with 2.5% HL and 0.75% PA fibre. The amounts of HL and PA fibre used were based on the wet weight of GRS. For example, the use of 2.5% HL and 0.75% PA fibre meant that for each 100 g of wet soil, 2.5 g HL and 0.75 g PA fibre were added. The process was maintained for samples of 4.5%, 6.25%, and 9% HL.
The stabilised sample was prepared by mixing the GRS with different percentages of HL (2.5%, 4.5%, 6.25%, and 9%). For each amount of HL (2.5%, 4.5%, 6.25%, and 9%) and GRS, 0.75% PA fibre was added. The HL and PA fibre samples were mixed with the wet weight of GRS (soil + water). The water was obtained from optimum moisture content.

3. Data Collection

The information acquired for this research was based on sample results. In this investigation, each specimen has a varying proportion of HL and a constant percentage of PA fibre, and each sample has three specimens. The reported result should be the average value rather than the highest value. The study investigates how curing days and additional materials influence unconfined compressive strength. We covered the sample with a double plastic sheet and stored it in a sealed container to keep it safe. The mix proportions for this study are shown in Table 3.

3.1. Result and Discussion

This section presents the results of various experiments carried out over the research period. The goal of this experiment was to understand how HL and PA affected soil stabilisation after 7 days of curing. Therefore, to reach the results, all the experimental methodologies carried out in the UCSI university laboratory were used, as discussed in methodology.

3.1.1. Grain Size Distribution

Table 4 shows the passing percentage of grain size. Figure 4 shows the grain-size distribution curve of the GRS sample. The proportion of sand, fine and gravel are 61%, 9%, and 30%, respectively. The value of D60, D30, and D10 were 1.7 mm. 0.54 mm, and 0.08 mm, respectively, whereas the value of Cu and Cc were 21.25 and 2.14, respectively. Relative to this, the soil as classified as well-graded and sand-grained.
From Figure 4, we note that soil characteristics are affected by the residual original material, mode of formation, degree of weathering and the position of the samples at the site, such as depth. The grain-size distribution experiment was manipulated to broaden the soil classification. From the results, the soil was classified as Granitic Residual Soil Type V. The results also showed that the percentage of fine particles (silt and clay) for granitic residual soil grade V was smaller and the percentage of sand and gravel was higher, and this is supported by [1].

3.1.2. Laboratory Determination of Water (Moisture) Content

The laboratory determination of water (moisture) content was determined using the British Standard (BS) 1377:1990 standards and Equation (1). Three samples were taken from various pockets and weighed before and after being in the oven for 24 h at 110 degrees Celsius. However, the results of this experiment revealed that the average moisture content for test soil was 9.44%.

3.1.3. Atterberg’s Limit

Atterberg limits, which include liquid limit and the plastic limit, were determined using British Standard (BS) 1377:1990 standards. The liquid limit of soil (soil of No. 4 sieved) is the moisture content, expressed as a percentage of the weight of the oven-dried (110 degrees Celsius for 24 h) soil, at the boundary between the liquid and plastic states of consistency. The moisture content at this boundary is arbitrarily defined as the water content at which two halves of a soil cake flowed together for a distance of ½ in. (12.7 mm) along the bottom of a groove of standard dimensions separating the two halves, when the cup of a standard liquid limit apparatus is dropped 25 times from a height of 0.3937 in. (10 mm) at the rate of two drops/second. Based on Figure 5, the result showed that at 25 blows, the water content was 51.8%.
The plastic limit of soil (soil of No. 4 sieved) is the moisture content, expressed as a percentage of the weight of the oven-dried (110 degrees Celsius for 24 h) soil, at the boundary between the plastic and semi-solid states of consistency. It is the moisture content at which soil begins to crumble when rolled into a thread 1/8 in. (3 mm) in diameter using a ground glass plate or another acceptable surface. The results of average moisture content (plastic limit) of the specimens were 14.1%, so the plastic index for tested soil was 37.7%.

3.1.4. Compaction Test

The compaction test was used based on British Standard (BS) 1377:1990 standards and Equations (2) and (3) to determine the tested soil’s optimum moisture content and density. Based on Figure 6, the curve showed that the maximum dry density reached 1.55 g/cm3 while the maximum optimum moisture content was 13.5%. Furthermore, the water content used was 5%, 10%, and 15%, while the average soil mass and volume for the three specimens was 1746 g and 976.9 cm3, respectively.

3.1.5. Specific Gravity

The specific gravity of the tested soil was calculated using Equation (4) and the British Standard (BS) 1377:1990 standards. The result showed that the average specific gravity for the three samples was 2.37.

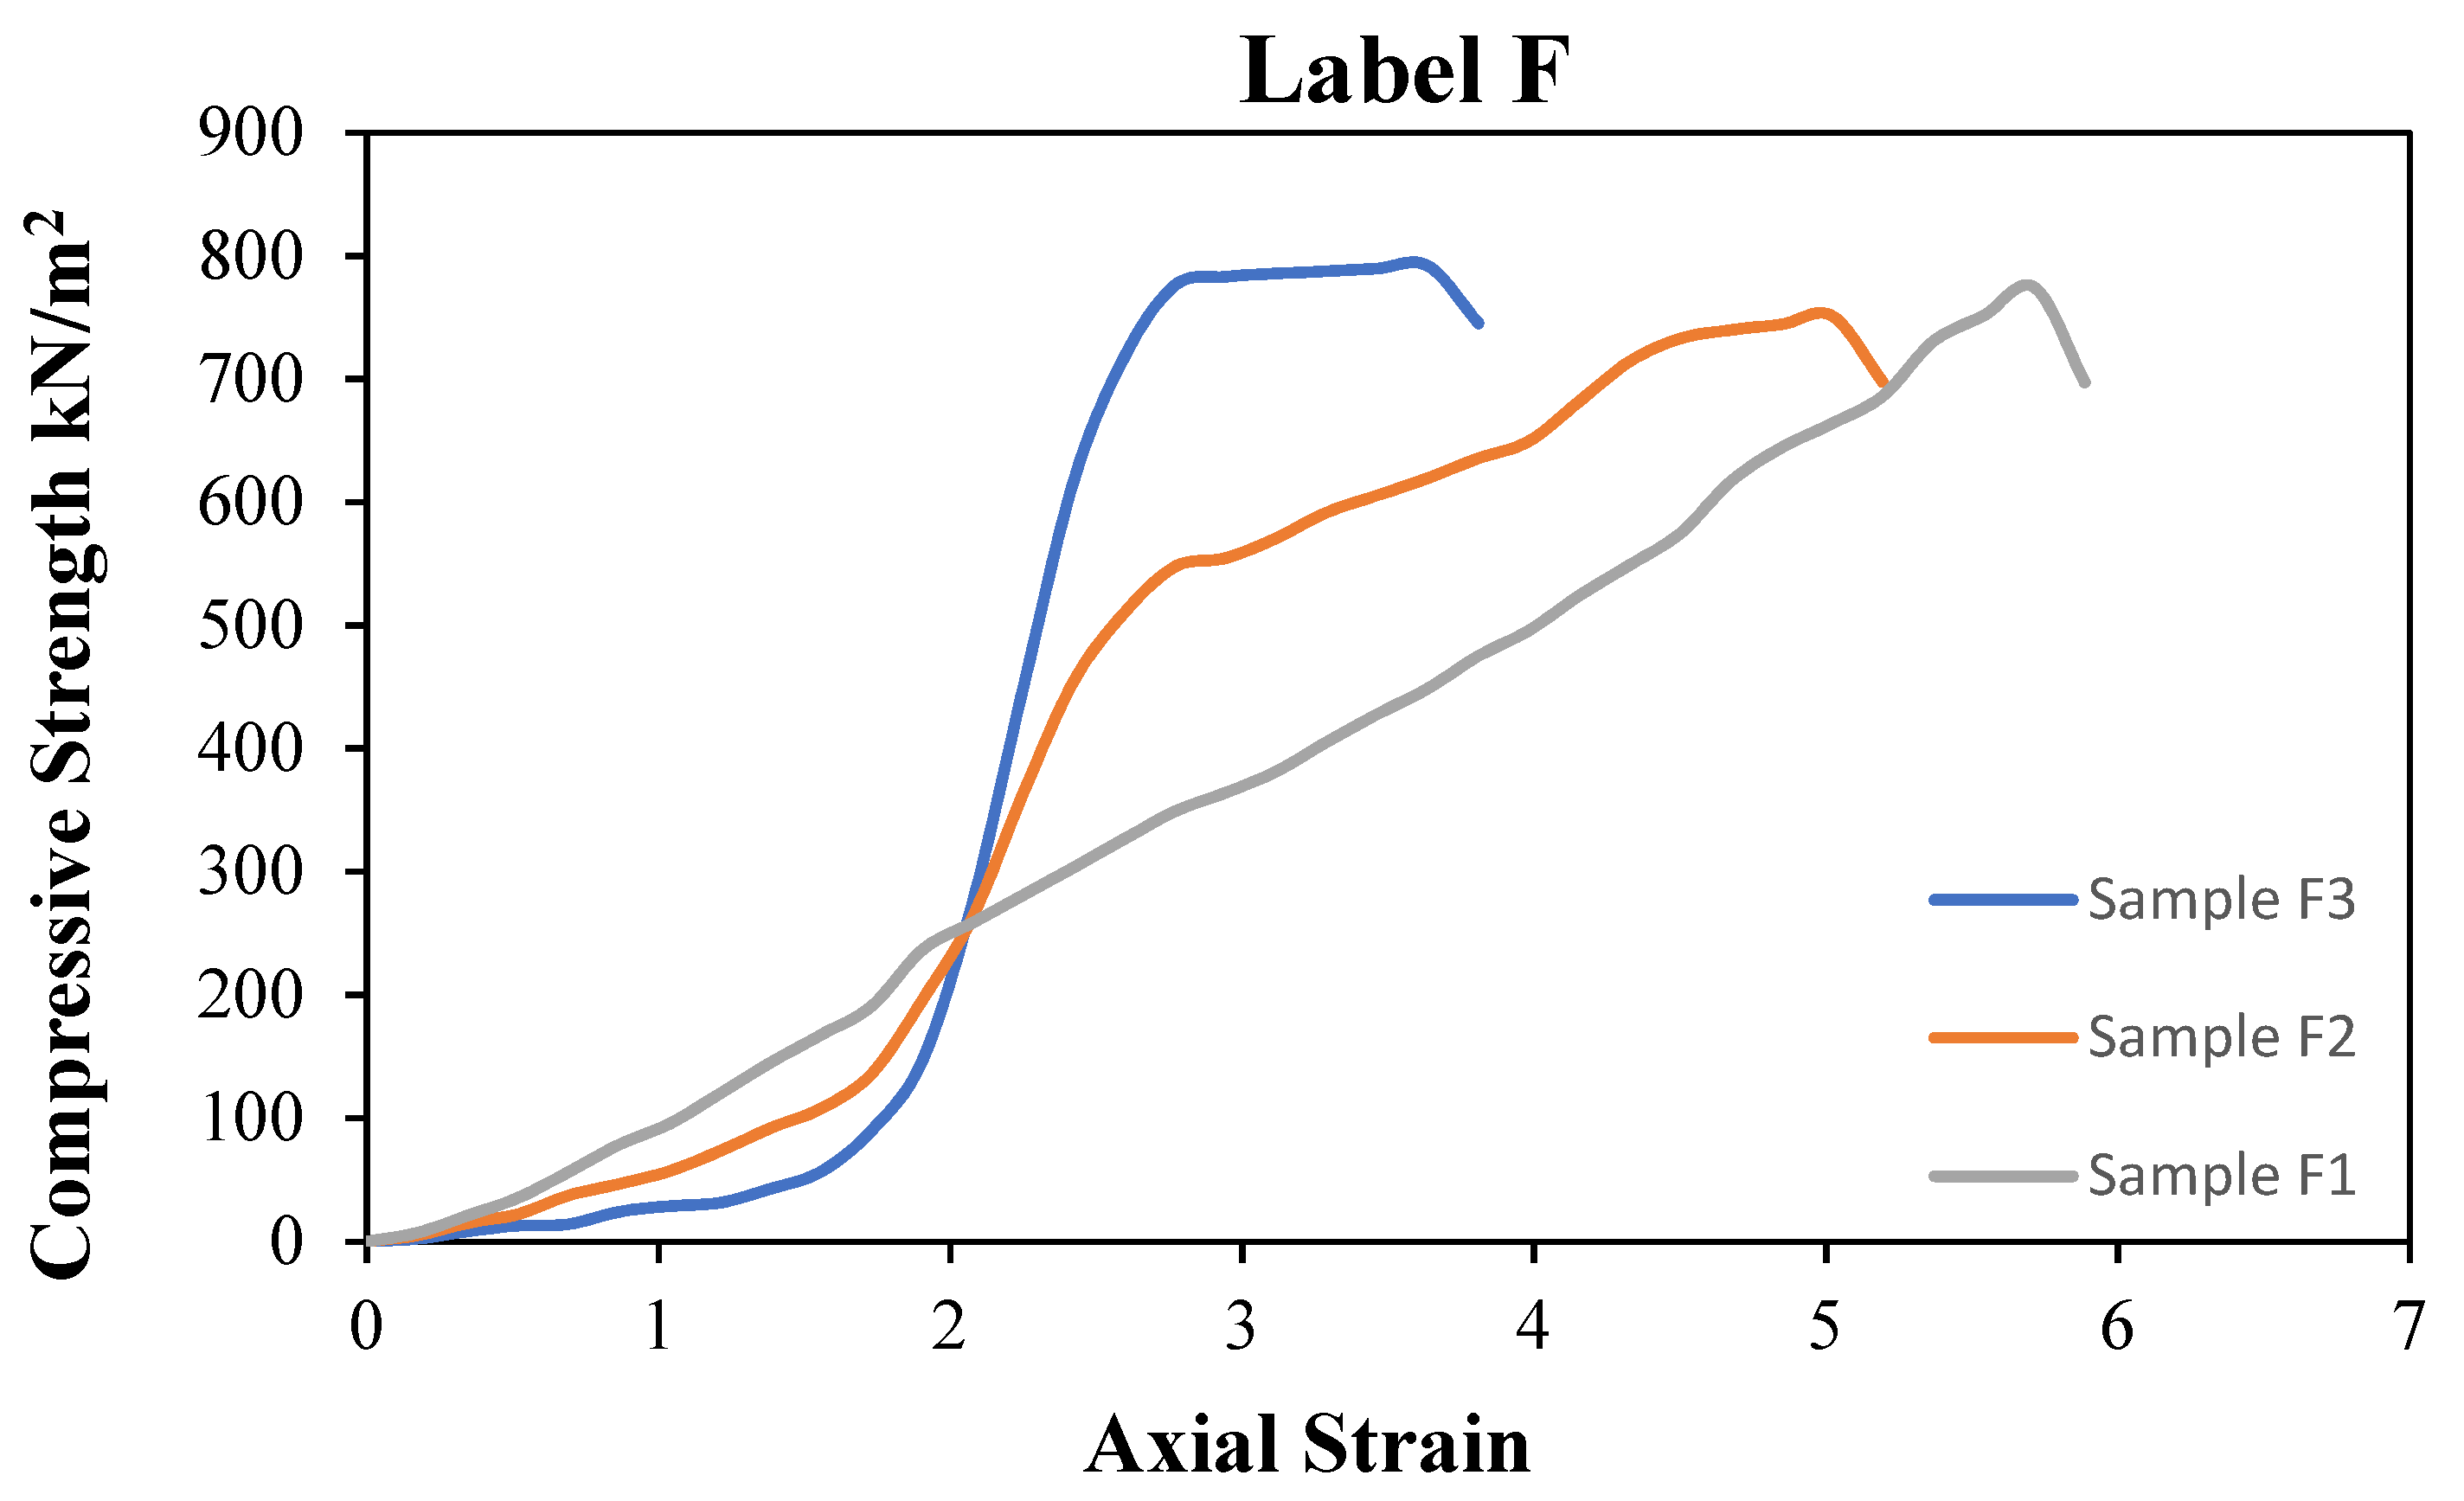
3.1.6. Unconfined Compressive Strength (UCS) Test

The experiment was carried out following British Standard (BS) 1377:1990 standards. The samples were sealed and labelled first before being kept in boxes. The boxes were sealed and stored in a moist curing room and left undisturbed for 7 days. In all samples, the percentage of HL was 2.5%, 4.5%, 6.25%, and 9%, and the PA was 0.75%; however, the sample with PA fibre and HL was cured for 7 days, whereas both control soil samples and the soil with fibre samples were only cured at 0 curing days. The percentages were chosen based on the research description. Furthermore, the sample had a diameter of 0.1044 m and a cross-section of 0.008 m2. Sample A is GRS only instead of label A, indicating that this is a result of the UCS of the control sample. Three specimens were taken from sample A, namely specimens A1, A2, and A3. From the compaction result, the water content used was 13.5% and the UCS result for 0 curing days shows that sample label A3 reaches 341 kN/m2, which is the maximum value when compared with samples label A1 (285 kN/m2) and A2 (325 kN/m2), based on Figure 7. The average value is 317 kN/m2.
Figure 8 represents sample B. Sample B is a GRS mix with 0.75% PA fibre instead of label B, indicating that this is a result of the UCS of the GRS mix with 0.75% PA sample at 0 curing days. Three specimens were taken from sample B, namely specimens B1, B2, and B3. From Figure 8, the UCS result for 0 curing days shows that sample label B1 reaches 575 kN/m2, which is the highest value, while the sample for labels B2 and B3 reaches 545 kN/m2 and 491 kN/m2, respectively. The average value is 537 kN/m2.
Figure 9 shows sample C. Sample C is a GRS mix with 2.5% HL and 0.75% PA fibre instead of label C, indicating that this is a result of the UCS of the GRS mix with 2.5% HL and 0.75% PA sample at 7 curing days. Three specimens were taken out from samples C, namely specimens C1, C2, and C3. From Figure 9, the UCS result for 7 curing days shows that sample label C3 reaches 615 kN/m2, which is the maximum value, while the sample for labels C1 and C2 reaches 589 kN/m2 and 569 kN/m2, respectively. The average value is 591 kN/m2.
Figure 10 represents sample D. Sample D is a GRS mix with 4.5% HL and 0.75% PA fibre instead of label D, indicating that this is a result of the UCS of the GRS mix with 4.5% HL and 0.75% PA sample at 7 curing days. Three specimens were taken out from sample D, namely specimens D1, D2, and D3. The UCS result for 7 curing days shows that sample label D1 reaches the maximum value (823 kN/m2), while sample labels D2 and D3 reach 771 kN/m2 and 807 kN/m2, respectively. The average value is 800 kN/m2.
Figure 11 shows sample E. Sample E is a GRS mix with 6.25% HL and 0.75% PA fibre instead of label E, indicating that this is a result of the UCS of the GRS mix with 6.25% HL and 0.75% PA sample at 7 curing days. Three specimens were taken out from sample E, namely specimens E1, E2, and E3. From Figure 11, the UCS result for 7 curing days shows that sample label E3 reaches 861 kN/m2, which is the maximum value, while the sample for labels E1 and E2 reaches 842 kN/m2 and 827 kN/m2, respectively. The average value is 843 kN/m2.
Figure 12 represents sample F. Sample F is a GRS mix with 9% HL and 0.75% PA fibre instead of label F, indicating that this is a result of the UCS of the GRS mix with 9% HL and 0.75% PA sample at 7 curing days. Three specimens were taken out from sample F, namely specimens F1, F2, and F3. The UCS result for 7 curing days shows that sample label F3 reaches the maximum value (792 kN/m2), while sample labels F1 and F2 reach 774 kN/m2 and 751 kN/m2, respectively. The average value is 772 kN/m2.
An average of UCS was provided from the typical stress–strain curves for all samples and is presented in Table 5. Table 5 shows the average results of UCS for GRS (soil only) as the control sample and GRS mix with 0.75% PA fibre sample at 0 curing days, and the GRS mix with 2.5% HL and 0.75% PA fibre, the GRS mix with 4.5% HL and 0.75% PA fibre, the GRS mix with 6.25% HL and 0.75% PA fibre, and the GRS mix with 9% HL and 0.75% PA fibre sample at 7 curing days.
From Figure 13, it can be noticed that the UCS of GRS before adding PA fibre is 371 kN/m2. After adding 0.75% PA fibre, the value increases to 537 kN/m2. It is shown that the strength increases by 31%. Here, the PA fibre reinforcement affects the engineering properties of soil positively. PA fibre reinforced with polyethylene provides high-performance composites.
Figure 13 also indicates that for 7 curing days, the UCS of GRS after adding 2.5% HL and 0.75% PA fibre is 591 kN/m2. After supplementing GRS with 4.5% HL and 0.75% PA fibre, the UCS is 800 kN/m2. It is shown that the strength increases by 26%.
The UCS continues to increase to 843 kN/m2, showing a strength increase of 5% after GRS supplemented with 6.25% HL and 7.5% PA fibre. However, the UCS decreases to 772 kN/m2. It is shown that the strength decreases around 8.4% to 9% after GRS is supplemented with 9% HL and 7.5% PA fibre.
According to [8], the decrement of the UCS is due to the fact that HL has low self-cementing properties, and HL interacts with water to produce a cementitious product known as calcium silicate hydrated, ettringite and calcium hydroxide. While calcium silicate hydrated and ettringite gels govern the primary bondage strength of the cemented soil, calcium hydroxide is required to react with excess silica and alumina from HL under pozzolanic reaction.
The curing period in the stabilisation process has a significant effect on unconfined compressive strength. It indicates that the strength of GRS stabilisation depends on the presence of a binder as a chemical because of the pozzolanic reaction and the cementation process. Furthermore, according to Thomas et al. [12], the utilisation of PA fibre in composite material is a new source of economic, recyclable and eco-friendly materials.
There are many factors contributing to the length of the curing period required for strength gain in GRS, HL and PA fibre samples. Faster wind speed, higher air temperature and a long delay in compaction commonly results in a poor strength.

4. Conclusions

The purpose of this research was to stabilise GRS by mixing it with different percentages of HL and a constant percent of PA and subjecting it to 7 days of curing. The soil was tested using the UCS test to observe the impact of PA with HL on the soil. Furthermore, based on the findings of the laboratory tests, the following conclusions are drawn.
  • The studied soil was classed as well-graded sand soil, based on the particle size distribution results and discussion.
  • The moisture content of GRS was measured and the average moisture content for the test soil was 9.44%.
  • The liquid and plastic limits of the Atterberg limits were determined for the tested soil. The liquid limit was 51.8%, while the plastic limit was 14.1%.
  • The compaction test was conducted to evaluate the optimal moisture content and density for the tested soil, with the findings revealing a maximum dry density of 1.55 and a maximum optimum moisture content of 13.5%.
  • The specific gravity of the tested soil was determined, and the result showed that the average specific gravity of the sample was 2.37.
  • The compressive strength was greatly improved by combining soil with HL and PA. The resulting UCS showed that 0 curing days increased strength by 31% while 7 curing days increased strength by 26% before decreasing the strength by 8.4% to 9%.
  • Natural fibre-based composites are eco-friendly and have the advantages of continuous supply, easy and safe handling and being biodegradable.
Based on the major findings of this study, further studies are suggested to treat HL–PA fibre with different lengths of curing and laboratory tests. This study could be shear strength under the Direct Shear test. Applying the optimum curing days and optimum amount of HL–PA fibre helps to achieve better results. It is also recommended to conduct a Triaxial test and a Permeability test for these reported materials to study other parameters such as pore water pressure and angle of friction, which can be defined through the Triaxial test rather than the Direct Shear test.

Author Contributions

Conceptualization, Z.M.Y. and A.M.Y.A.-A.; data curation, Z.M.Y. and A.M.Y.A.-A.; formal analysis, Z.M.Y. and A.M.Y.A.-A.; funding acquisition, Z.M.Y., and M.E.E.M.M.; investigation, Z.M.Y. and A.M.Y.A.-A.; methodology, Z.M.Y. and A.M.Y.A.-A.; project administration, Z.M.Y. and A.M.Y.A.-A.; supervision, Z.M.Y.; validation, Z.M.Y.; writing—original draft, Z.M.Y. and A.M.Y.A.-A.; writing—review and editing, Z.M.Y. and M.E.E.M.M. All authors have read and agreed to the published version of the manuscript.

Funding

This research was funded by the Faculty of Education, Universiti Kebangsaan Malaysia (UKM) through the Dana Ganjaran Penerbitan (Nombor Geran: GG-2021-K021854).

Institutional Review Board Statement

This study was conducted according to the guidelines of the Declaration of Helsinki and approved by the Institutional Review Board of Universiti Teknologi MARA (UiTM), Malaysia [UiTM/FND/FKA/2013112297].

Informed Consent Statement

Not applicable.

Data Availability Statement

The data presented in this study are available on request from the main author.

Conflicts of Interest

The authors declare no conflict of interest.

References

  1. Saffari, P.; Nie, W.; Noor, M.J.; Zhang, X.; Liang, Q. Characterization the GEOTECHNICAL properties of a Malaysian Granitic RESIDUAL soil grade V. IOP Conf. Ser. Earth Environ. Sci. 2019, 289, 012006. [Google Scholar]
  2. Aishah Zarime, N. Leaching Behavior of Cadmium through Compacted Granitic Residual Soil Using Column Infiltration Test. EDP Sci. 2019, 101, 04002. [Google Scholar]
  3. Saffari, P.; Nie, W.; Noor, M.J.; Asadi, A.; Liu, J.; Zhang, X. Collapse behavior of unsaturated remolded granitic residual soil. Bull. Eng. Geol. Environ. 2020, 79, 3857–3868. [Google Scholar]
  4. Asmaa, G.S. Review on Granitic Residual Soils’ Geotechnical Properties. EJGE 2012, 11, 2645–2658. [Google Scholar]
  5. Amadi, A.A.; Okeiyi, A. Use of quick and hydrated lime in stabilization of lateritic soil: Comparative analysis of laboratory data. Int. J. Geo-Eng. 2017, 8, 119. [Google Scholar]
  6. Yusof, Z.M.; Mohamed, K.; Henry, O.M.; Yahya, N.A. Effects of hydrated lime-pond ash admixtures on the compaction characteristics of treated peat soils. Aust. J. Basic Appl. Sci. 2015, 9, 359–361. [Google Scholar]
  7. Mouillet, V.; Sejourne, D.; Delmotte, V.; Ritter, H.J.; Lesueur, D. Method of quantification of hydrated lime in asphalt mixtures. Constr. Build. Mater. 2014, 68, 348–354. [Google Scholar]
  8. Yusof, Z.M.; Harris, S.N.M.; Mohamed, K. Compressive strength improvement of stabilized peat Soil by pond ash-hydrated lime admixture. In Applied Mechanics and Materials Trans; Trans Tech Publications Ltd.: Freienbach, Switzerland, 2015; Volume 747, pp. 242–245. [Google Scholar]
  9. Yusof, Z.M.; Mohamed, K. Strength of treated peat soil with pond ash-hydrated lime subjected to soaking time. Int.-Aided Civ. Infrastruct. Eng. 2015, 11, 319–329. [Google Scholar]
  10. Patel, A. Soil stabilization. In Geotechnical Investigations and Improvement of Ground Conditions; Woodhead Publishing: Sawston, UK, 2019; Volume 11, pp. 19–27. [Google Scholar]
  11. Taha, M.R.; Jamal, M.A.A. Performance of soil stabilized with carbon nanomaterials. Chem. Eng. Trans. 2018, 63, 124. [Google Scholar]
  12. Thomas, S.R.P.; Abhijith, R.; Joseph, A.; Unnikrishnan, V. Improvement in Shear Strength of Soil Reinforced with Pineapple Fibre. Int. Res. J. Eng. Technol. 2018, 5, 1827–1829. [Google Scholar]
  13. Asim, M.; Abdan, K.; Jawaid, M.; Nasir, M.; Dashtizadeh, Z.; Ishak, M.R.; Hoque, M.E. A review on pineapple leaves fibre and its composites. Int. J. Polym. Sci. 2015, 16, 1415. [Google Scholar]
  14. Yusof, Z.M. Strength characteristics of pond ash-hydrated lime admixture treated peat soil. IOP Conf. Ser. Mater. Sci. Eng. 2020, 932, 145. [Google Scholar]
  15. Jose, S.; Ammayappan, L.; Salim, R. An overview on production, properties, and value addition of pineapple leaf fibers (PALF). J. Nat. Fibers 2016, 13, 362–373. [Google Scholar]
  16. Parsons, R.L.; Milburn, J.P. Engineering behavior of stabilized soils. Transp. Res. Rec. J. Transp. Res. Board 2003, 1837, 20–29. [Google Scholar]
  17. Makusa, G.P. Soil Stabilization Methods and Materials in Engineering Practice; Luleå University of Technology: Luleå, Sweden, 2012. [Google Scholar]
  18. Mazlan, A.A.; Sultan, M.T.H.; Shah, A.U.M. The effect of different length of pineapple leaf fiber (PALF) of tensile properties of random oriented composites. Int. J. Recent Technol. Eng. 2019, 8, 15. [Google Scholar]
  19. Ko, Y.N.; Yusof, Z.M.; Surol, S.; Samsudin, N.S. Rice husk admixture’s effect on the compressive strength characteristics of Klang Valley’s clayey soil. AIP Conf. Proc. 2021, 2401, 20014. [Google Scholar]
  20. British Standard Method of Test—BS 1377 Methods of test for civil engineering purposes. In General Requirements and Sample Preparation; British Standard Institution: London, UK, 1990.
  21. Hadi, B.A.; Md Noor, M.J.; Ibrahim, A.; Ismail, B.N.; Ahmad, J.; Zakariah, Z. The effect of soaking on shear strength of a Malaysian granitic residual soil. IOP Conf. Ser. 2020, 476, 12049. [Google Scholar]
  22. Dang, L.; Hassan, H.A.; Fatahi, B.; Jones, R.; Khabbaz, H. Enhancing the engineering properties of expansive soil using bagasse ash and hydrated lime. Intern. J. GEOMATE 2016, 11, 2447–2454. [Google Scholar]
  23. Bell, F.G. Lime stabilization of clay minerals and soils. Eng. Geol. 1996, 42, 223–237. [Google Scholar]
  24. Kassim, K.A.; Chern, K.K. Lime stabilized Malaysian cohesive soils. Malays. J. Civ. Eng. 2004, 16, 13–23. [Google Scholar]
  25. Ghobadi, M.H.; Abdilor, Y.; Babazadeh, R. Stabilization of clay soils using lime and effect of pH variations on shear strength parameters. Bull. Eng. Geol. Environ. 2014, 73, 611–619. [Google Scholar]
  26. Algaba, F. Tanzania Laboratory Testing Manual; Academia.edu.: San Francisco, CA, USA, 2020. [Google Scholar]
  27. Baalwy, H.A.; Yusof, Z.M.; Zain, N.H.M. Permeability of stabilised sandy soil using mixture of coir fibre-hydrated lime. AIP Conf. Proc. 2021, 2401, 20013. [Google Scholar]
  28. Yusof, Z.M.; Zain, N.H.M. Engineering properties of hydrated lime-pond ash treated peat soil. AIP Conf. Proc. 2021, 2401, 20012. [Google Scholar]
  29. Yusof, Z.M. Performance of Hydrated Lime-Pond Ash Treated Peat Soil. Ph.D. Thesis, MARA University of Technology, Shah Alam, Malaysia, 2018. [Google Scholar]
  30. Consoli, N.C.; Bittar Marin, E.J.; Quinonez Samaniego, R.A.; Heineck, K.S.; Johann, A.D.R. Use in sustainable binders in soil stabilization. J. Mater.Civ.Eng. 2019, 31, 6018023. [Google Scholar]
Figure 1. Location of GRS collected.
Sustainability 14 03826 g001
Figure 2. Malaysia map with the distribution of GRS [21].
Sustainability 14 03826 g002
Figure 3. PA fibre [12].
Sustainability 14 03826 g003
Figure 4. Grain-size distribution curve.
Sustainability 14 03826 g004
Figure 5. Liquid limit.
Sustainability 14 03826 g005
Figure 6. Optimum moisture content.
Sustainability 14 03826 g006
Figure 7. Unconfined compressive strength for the control sample at 0-day curing period.
Sustainability 14 03826 g007
Figure 8. Unconfined compressive strength for the GRS + 0.75% PA fibre sample at 0-day curing period.
Sustainability 14 03826 g008
Figure 9. Unconfined compressive strength for GRS + 2.5% HL + 0.75% PA fibre sample at 7-day curing period.
Sustainability 14 03826 g009
Figure 10. Unconfined compressive strength for GRS + 4.5% HL + 0.75% PA fibre sample at 7-day curing period.
Sustainability 14 03826 g010
Figure 11. Unconfined compressive strength for GRS + 6.25% HL + 0.75% PA fibre sample at 7-day curing period.
Sustainability 14 03826 g011
Figure 12. Unconfined compressive strength for GRS + 9% HL + 0.75% PA fibre sample at 7-day curing period.
Sustainability 14 03826 g012
Figure 13. Average UCS for all samples.
Sustainability 14 03826 g013
Table 1. The HL physical and chemical characteristics [22,23,24,25].
Physical Properties
Bulk density (kg/m3)400–600
Specific gravity2.2–2.3
Chemical Properties
SiO21.8%
Al2O30.5%
CO22.5%
CaO72%
Table 2. Material specifications.
Type of MaterialStandards Codes
HLMS 850:1997
PA fibre-
GRSBS 1377:1990
Table 3. Mix Proportion.
LabelGRS %HL %PA %Curing Days
07
No. of Samples
A100--3-
B99.25-0.753-
C96.752.50.75-3
D95.254.50.75-3
E936.250.75-3
F90.2590.75-3
Table 4. Passing percentage of grain size analysis.
Size Diameter (mm)Percent Passing (%)
3.3587.33
269.81
1.1851.89
0.634.27
0.42528.14
0.323.39
0.21219.93
0.1517.86
0.0638.36
Table 5. Average result for all samples.
LabelSample ContentCompressive Strength (kN/m2)
(Average)
Curing days
07
AGRS only371-
BGRS + 0.75% PA537-
CGRS + 2.5HL + 0.75% PA-591
DGRS + 4.5% HL + 0.75% PA-800
EGRS + 6.25 HL + 0.75% PA-843
FGRS + 9% HL + 0.75% PA-772
Publisher’s Note: MDPI stays neutral with regard to jurisdictional claims in published maps and institutional affiliations.

