Abstract
The CO2 capture using adsorption can reduce the carbon footprint, increasing the sustainability of the process without the production of wastes present in commonly used industrial operations. The present research work analyses the effect of the doping-agents incorporation in carbon materials upon adsorption and separation of gases, specifically for carbon dioxide and nitrogen. The carbons precursor was polyacrylonitrile (PAN), which enabled the incorporation of nitrogen atoms in the structure, whereas sulphur doping was reached using pure sulphur after the carbonisation step. The influence of several variables (such as temperature or pressure) and characteristics of synthesised materials (mainly corresponding to surface characteristics) on carbon dioxide separation has been evaluated. Adsorption isotherms were determined for each gas (CO2 and N2) at different temperatures and pressures. Different adsorption models were evaluated to fit the experimental data. In general, the Toth isotherm described better the adsorption for both gases. Important parameters such as CO2/N2 selectivity and heat of adsorption were determined using the IAS theory and the experimental isotherms at different temperatures, respectively. Non-activated carbons generated from PAN carbonisation without sulphur addition showed the highest values of selectivity (up to 400) and adsorption heat (up to 40 kJ mol−1), mainly at low pressures and at low carbon dioxide uptakes, respectively. Furthermore, thanks to their high adsorption capacity, these carbons can be applied for carbon dioxide separation from mixtures with nitrogen.
1. Introduction
Gas separation continues to be an essential field in chemical engineering due to its application in industrial processes and to reduce the number of pollutant gases emissions to the atmosphere. Within these processes, gas-liquid absorption is a mature technique used in several industries using physical (e.g., Rectisol for hydrogen purification) or chemical solvents (e.g., KS-1 for carbon dioxide separation). The great importance of this type of separation operation led to the development of new chemical solvents with better absorption rate and selectivity characteristics. First, though, the energy penalty associated with solvent regeneration and degradation must be overcome. To reach this aim, several low-energy solvents have been developed [1,2], though the performance in CO2 separation has not been entirely satisfactory. As a result, a growth of the research studies focused on developing other separation techniques that allow their use in industrial processes has occurred, trying to enhance the sustainability of this type of carbon capture operations.
Thus, gas-solid adsorption has gained importance for gas separation, considering operational simplicity and the development of new materials for specific separations. Researchers have paid attention to different types of sorbents such as zeolites [3], metal-organic frameworks [4], silica gels [5], to mention a few, to be used in a significant number and types of gas streams. These materials have been analysed considering different characteristics such as gas loading and selectivity; however, also negative issues must be pointed out, for instance, their thermal stability that can reduce their application [6].
Activated carbons continue to be one of the most studied sorbents as they possess different suitable characteristics, such as a high surface area that allows reaching high gas loadings (e.g., for carbon dioxide adsorption). Moreover, the type of adsorption produced is characterised by low interactions between adsorbate molecules and sorbent, showing low heat values of adsorption. This low value in the amount of heat tends to reduce the energy needed to carry out sorbent regeneration and then the penalty associated with the overall process compared to other materials and gas-liquid chemical solvents. This decrease in the required energy makes this operation attractive from the point of view of sustainability. Other favourable characteristics of these materials include their hydrophobicity, easy preparation, high thermal and chemical stability, and relatively low energy requirements related to sorbent regeneration [7]. These peculiarities make them suitable for applications as sorbents to replace the commonly used techniques in the industry [8].
In the last few years, research focused on using carbonaceous materials for gas adsorption has proposed the doping process of activated carbons. For instance, nitrogen incorporation can contribute to improving gas adsorption, mainly for carbon dioxide separation. This enhancement is based on surface modification by generating basic sites. However, recent studies [9] have not clearly concluded about the effect of this modification that is probably related to the type of nitrogen centre, which is influenced by the experimental procedure and/or the type of pores in the material [10]. These findings were also reported for other types of materials (polyimides) in which the presence of tertiary amine groups produced a slight improvement of CO2 adsorption [11].
The most used experimental procedures to carry out activated carbons doping are centred on impregnating the material with a chemical compound that contains nitrogen. Another procedure involves a grafting process with chemical compounds bearing amine groups, which turned out to be more satisfactory, mainly due to its simplicity and good results in adsorption.
A further possible modification of carbons consists in S-doping, which, due to the high affinity with carbon dioxide [12], improves selectivity [13]. Other studies showed that the presence of sulphur also entails an enhancement of interactions with higher values of isosteric heat compared with sorbents of similar nature [14].
Among the few recent works focused on developing co-doped materials, it is worth citing the use of chitosan as a carbon and nitrogen source and hydroquinonesulfonic acid potassium salt as a sulphur source [15]. As no evident conclusions were withdrawn on the role of the simultaneous presence of these heteroatoms for gas adsorption, in the present work, we aim to investigate the effect of N- and S-doping further inactivated and non-activated carbons synthesised from polyacrylonitrile (PAN) upon CO2 and N2 adsorption. That is, studying their role in the adsorbate-adsorbent interactions and the porous carbon structure (pores size, surface area, and functional groups).
2. Materials and Methods
2.1. Materials
The materials used in the preparation of activated carbons were polyacrylonitrile, PAN (150,000 g/mol) and sulphur, both provided by Sigma-Aldrich (Darmstadt, Germany). PAN has been used as a precursor and as a nitrogen source. The activating agent, KOH, was supplied by Fisher Scientific (Hampton, NH, USA). 37% (w/w). HCl solution to remove excess KOH and NaOH (98%) were purchased from Sigma-Aldrich. A commercial activated carbon (CAC) for analysis was purchased from Merck (Kenilworth, NJ, USA) and used as reference material.
2.2. Methods
2.2.1. Synthesis of Activated Carbons
Four types of carbon materials were synthesised in this work via thermal treatment in a tubular furnace (Carbolite, Sheffield, UK) from the polymeric precursor PAN: N-doped carbon (PAN-C), N-doped activated carbon (PAN-C-Act), N,S-doped carbon (PAN-S-C), and N,S-doped activated carbon (PAN-S-C-Act). Activated carbons were prepared through three processes, namely carbonisation, activation, and washing with HCl solution. The carbonisation method was carried out in two steps, oxidative stabilisation followed by pyrolysis. In the oxidative stabilisation, PAN powder was annealed with O2 (10 mL min−1) at 553 K (2 K min−1) for 1 h to produce the rigidifies of morphology through the cyclisation and cross-linking of the PAN. Then, it was kept at 553 K for 0.5 h under an inert atmosphere and pyrolysed under anaerobic conditions at 1073 K (5 K min−1) for 0.5 h. PAN-C was synthesised through the carbonisation process. PAN-C activation (PAN-C-Act) was performed by milling the PAN-C with a 4-fold excess of KOH, heated under N2 (10 mL min−1) to 1073 K, and kept at this temperature for 2 h. When the PAN-C-Act was at room temperature, excess KOH was removed by washing with 100 mL of 0.1 M HCl and distilled water to neutral pH. It was filtered under vacuum and dried in an oven at 373 K for 24 h. PAN-S-C was obtained by mixing PAN with sulphur in a 1:1 weight ratio, heated under N2 (10 mL min−1) to 553 K, and stabilised at this temperature for 1 h. Finally, the carbon was heated under N2 (10 mL min−1) to 1073 K and held at this temperature for 0.5 h, followed by free cooling to room temperature. The activation process of PAN-S-C-Act was similar to PAN-C-Act. Finally, carbon materials were ground in a mortar before characterisation and adsorption experiments.
2.2.2. Characterisation of Activated Carbons
Surface textural characteristics: Several properties of carbons employed in the present work (surface area and pore volume) were determined by duplicate using a Micromeritics ASAP 2020 sorption analyser. The surface area was determined using the BET equation to fit experimental data of nitrogen adsorption at 77 K and carbon dioxide adsorption at 273 K. Previously, samples were outgassed under vacuum at 573 K (ramp of 5 K min−1) for enough time to guarantee constant weight after outgassing. Total pore volume was determined from the amount of adsorbed nitrogen at P/Po = 0.99. Micropore (<2 nm) volume was obtained by the difference between the total meso (2–50 nm) and macropore (>50 nm) volume.
Scanning electron microscopy: The morphological and structural features of the materials were assessed by field emission scanning electron microscopy (FESEM). The images were obtained using a Zeiss Fesem Ultra Plus with EDX, working at 3 kV.
X-ray photoelectron spectroscopy: The chemical nature and atomic quantity of the functional resulting from pyrolysis treatments was studied by X-ray photoelectron spectrometry (XPS). PHI 5000 Versa Probe instrument (Physical Electronics) was equipped with an Al Kα radiation (1486.6 eV) X-ray to carry out the XPS analysis.
Raman spectroscopy: Raman spectra were obtained using a Raman spectrometer (Renishaw, InVia Reflex) with a laser ion Ar 514 nm at room temperature, operating in the confocal mode.
Fourier transform infrared spectroscopy: To study the bond structure, the precursor and carbons were characterised by Fourier transform infrared (FTIR) spectroscopy with a PerkinElmer Spectrum Two with ATR mode. A total of 30 scans were recorded with a resolution of 4 cm−1. FTIR analysis was completed in the spectral range of 400–4000 cm−1 in the transmittance mode.
Determination of the point of zero charge: The point of zero charge (pHPZC) of all carbons synthesised was determined following the method proposed by Rivera-Utrilla et al. [16]. Eleven Erlenmeyer flasks were filled with 20 mL of 0.01 M NaCl solution, and pH was adjusted between 2–11 with the addition of 0.01 M solutions of NaOH or HCl. When the pH value was constant, 20 mg of carbon sample was added to each flask. The flasks were then shaken for 48 h to reach equilibrium. Blank tests were also made without carbon samples. Finally, the pHPZC value is the point where the curve pHfinal vs. pHinitial crosses the line pHinitial = pHfinal.
2.2.3. Carbon Dioxide and Nitrogen Adsorption Isotherms
This analysis was performed using the static volumetric system Micromeritics ASAP 2020 analyser. A previous degasification step was carried out at 573 K (ramp of 5 K min−1) under vacuum for 2 h. The range of each experimental variable was 0–760 mmHg for pressure and 273–348 K for temperature. The temperature was maintained constant by using an ice bath in a Dewar for experiments at 273 K and a temperature-controlled vessel employing a Selecta Sensoterm sensor for the other temperatures.
3. Results
3.1. Materials Characterisation
Four different N-doped and N,S-doped carbons (named PAN-C, PAN-C-Act, PAN-S-C, and PAN-S-C-Act) were synthesised by a two-step carbonisation process, eventually followed by an activation procedure. Their structure, surface characteristics, and physical properties were investigated by using different techniques and compared with those of a commercial activated carbon (named CAC).
3.1.1. Specific Surface Area and Pore Volume
The first characterisation studies focused on the determination of the specific surface area and the type of porosity generated during the synthesis procedure. The typical nitrogen adsorption and desorption isotherms at 77 K for PAN-S-C, PAN-S-C-Act, and CAC are shown in Figure 1, which compares the behaviour of a synthesised carbon without and with activation and that of the commercial activated carbon.
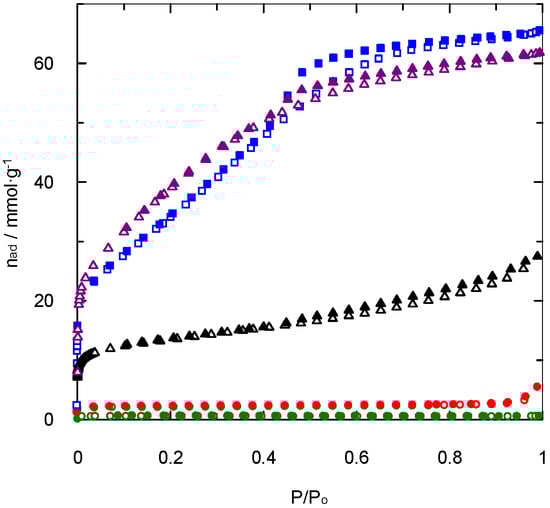
Figure 1.
Nitrogen adsorption/desorption isotherms at 77 K.  and
and  : PAN-C;
  and
and  : PAN-S-C;
  and
and  : PAN-C-Act;
  and
and  : PAN-S-C-Act;
  and
and  : CAC. Empty symbols: adsorption. Full symbols: desorption.
As expected, the activation process plays an important role in nitrogen adsorption at 77 K and its relationship with the BET surface area. Thus, a higher amount of nitrogen adsorbed on the surface involves the existence of a higher surface area (Table 1).

Table 1.
Surface textural and composition data of materials used.
The experimental data related to PAN-S-C show a type I isotherm of the IUPAC classification [17], suggesting physical adsorption on homogeneous surfaces or chemical adsorption, depending on the adsorbate. In this case, as the gas employed was nitrogen, this carbon shows physical adsorption over a homogeneous surface.
For the PAN-S-C-Act activated carbon, the isotherm shape is different. It can be described as type IV or a combination of types I and IV [18], indicating the existence of microporosity combined with mesoporosity. This fact is confirmed by the presence of a hysteresis cycle at relative pressures higher than 0.5. These conclusions are also supported by the data included in Table 1 that show an important presence of mesopores (2.164 cm3 g−1), taking into account the absence of macroporosity. Similar behaviour was found for the isotherms of non-activated and activated carbons synthesised without sulphur (PAN-C and PAN-C-Act), though the PAN-C-Act showed higher micropores volume (0.5402 cm3 g−1). This conclusion agrees with the results found in previous studies that evaluated the effect of sulphur upon pore size distribution, observing an increase in the pore diameter with the presence of this doping agent [19]. The commercial activated carbon, CAC, showed a type II nitrogen adsorption isotherm and specifically type IIb, due to the presence of a hysteresis loop. This type of isotherm is related to meso and microporous solids with the heterogeneous surface.
As shown in Table 1, an increase in surface area was reached with the material activation, as commonly observed in this type of solids. Moreover, all activated carbons synthesised using PAN have higher surface areas than the commercial ones.
Otherwise, the analysis of this type of materials using nitrogen adsorption/desorption isotherms at 77 K can be limited due to the presence of pores with a very small diameter [20]. This limitation is related to size exclusion and a decrease in diffusivity caused by the low temperatures and pores diameter [21]. Consequently, the surface area analysis has been completed by performing carbon dioxide adsorption tests at 273 K. The carbon dioxide isotherms are presented in Figure 2. A lower range for pressure ratio (0–0.035) is due to the saturation pressure of carbon dioxide at 273 K. The experimental data have also been fitted using the BET model to calculate the CO2 surface area (Table 1). The values for carbon dioxide uptake included in Table 1 were similar to those found for other activated and non-activated carbons (0.92–2.27 mmol·g−1) [22].
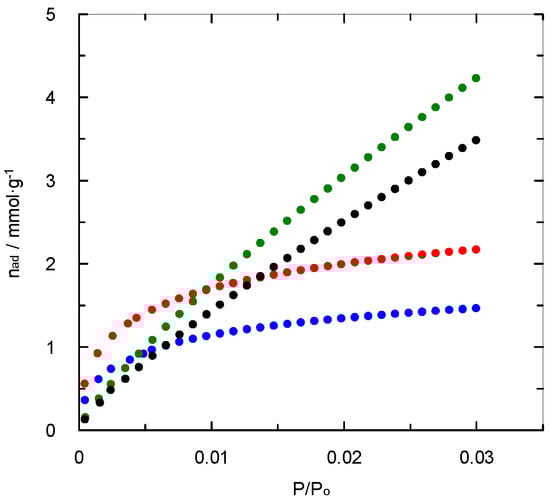
Figure 2.
Carbon dioxide adsorption isotherms at 273 K.  , PAN-C; , PAN-S-C; , PAN-C-Act;
  , PAN-S-C-Act.
As shown, the surface area determined with carbon dioxide for non-activated carbons is significantly higher than those obtained by nitrogen sorption at 77 K (Table 1). This fact is indicative that the effect of microporosity is high on the gas adsorption, especially for PAN-C, which exhibited a micropore volume contribution of 86.0% of the total pore volume. As for nitrogen adsorption, the results reflect that the sulphur incorporation into the solid structure causes an increase in surface area.
Conversely, the presence of sulphur in the activated carbon (PAN-S-C-Act) causes a decrease in both surface areas (12.4% and 19.7% for nitrogen and carbon dioxide surface area, respectively). This behaviour agrees with a previous work [19] that concluded that an increase in the pore diameter was produced due to sulphur doping using sulphuric acid as the sulphur source. These results are also in accordance with sulphur’s effect upon pore size found for the non-activated carbons.
Furthermore, the influence of pore size upon the adsorption behaviour of some gases such as carbon dioxide [23] agrees with the values of carbon dioxide uptake (at 15 kPa) shown in Table 1. The activation process does not cause positive effects upon the carbon dioxide loading though the increase in surface area is significant. Thus, the highest carbon dioxide uptake was reached for PAN-S-C (1.34 mmol g−1). Though this material shows a low percentage of microporosity (32.1% of total pore volume), the presence of sulphur allows generating a high carbon dioxide affinity, which considerably influences the gas adsorption at low surface coverage [24], while an increase in microporosity entailed a higher effect when the amount of gas adsorbed increases. The affinity zone was defined for certain activated carbons for pressure (0–4 kPa) and loading (0.7 mmol g−1) ranges [10]. The commercial activated carbon shows a relatively high carbon dioxide uptake at 15 kPa because it maintains a higher microporosity degree in comparison with the synthesised activated carbons.
A relationship between the amount of CO2 adsorbed at 273 K (and, therefore, the corresponding surface area determined) and the volume of ultramicropores (pore size lower than 0.7 nm) is found, which is closely related to the above-mentioned affinity for non-activated carbons as the area determined with CO2 at 273 K is significantly greater than that with N2 at 77 K (Table 1). Therefore, it can be concluded that the ultramicroporosity of non-activated carbons is one of the key parameters affecting CO2 adsorption, as other researchers found [22,25].
For activated materials, the presence of sulphur diminishes both nitrogen and carbon dioxide surface areas by more than 10% (12% using N2 and 20% using CO2) for PAN-S-C-Act compared to PAN-C-Act. These results indicate that activation treatment causes surface modification in the functional groups generated by sulphur, reducing the carbon dioxide affinity. The effect of the activation of PAN-C to obtain PAN-C-Act results in a percentage increase of 30% of O and a percentage decrease of 10% of N in the form of pyrrolic groups. In the case of sulphur-doped carbons, activation with KOH reduces the percentage of S groups and, to a great extent, in the loose of the pyridonic N and pyridinic oxide groups. For PAN-S-C-Act, the sulfide and sulfone groups are maintained after activation, observing an increase in C=S and C-SO2-C groups percentage compared to PAN-C (Table 2).
Table 2.
Approximate distribution of N and S groups obtained by fitting the N1s and S2p core level spectra.
3.1.2. SEM Characterisation
The structural morphology of all carbons was analysed by SEM (Figure 3). PAN-C (Figure 3a) is formed by large and compact globules with a smooth surface. Conversely, PAN-C-Act (Figure 3b) has a highly heterogeneous structure with large globules, zones with irregular macroporosity, and sites with microporosity generated by KOH activation. PAN-S-C-Act (Figure 3d) structure consists of highly vesiculated particles with 100–150 nm diameter and a regular shape. The formation of a vesicular structure is due to the presence of sulphur which acts as a mild oxidant stabilising the morphology. This structure in which the agglutination of the vesicles formed during the doping process and the increase in the pore size due to the activation of carbon occur is very similar to PAN-S-C (Figure 3c). The commercial activated carbon exhibits a sponge-like framework with a disordered structure (Figure 3e).
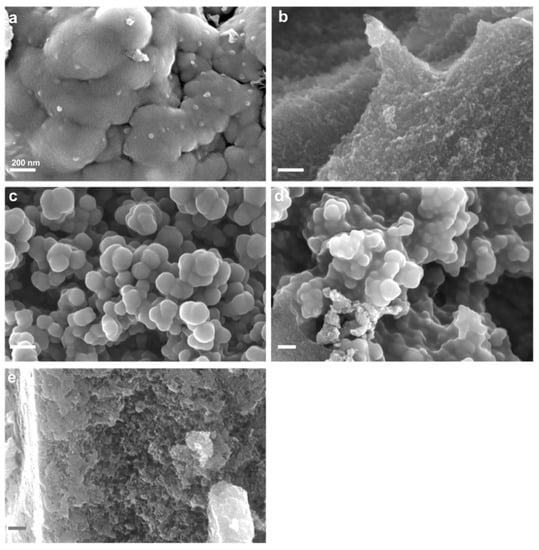
Figure 3.
SEM images of (a) PAN-C, (b) PAN-C-Act, (c) PAN-S-C, (d) PAN-S-C-Act and (e) CAC.
3.1.3. XPS Analysis
Figure 4 shows an example of XPS spectra and deconvolution of N1s and S2p spectra for PAN-C-S and PAN-C-S-Act. According to the elemental composition measured by XPS (Table 1), and as mentioned above, the nitrogen percentage decreased considerably due to the activation process for both PAN-C and PAN-C-S carbons. In any case, the% N is always higher for the two carbons doped with sulphur. Moreover, for these carbons, the sulphur percentage is reduced, due to the carbon activation at 1073 K, increasing by 13.5% the carbon content for PAN-S-C-Act. On the other hand, the activation of PAN-C decreases by 19.8% C and increases by 29.55% O.
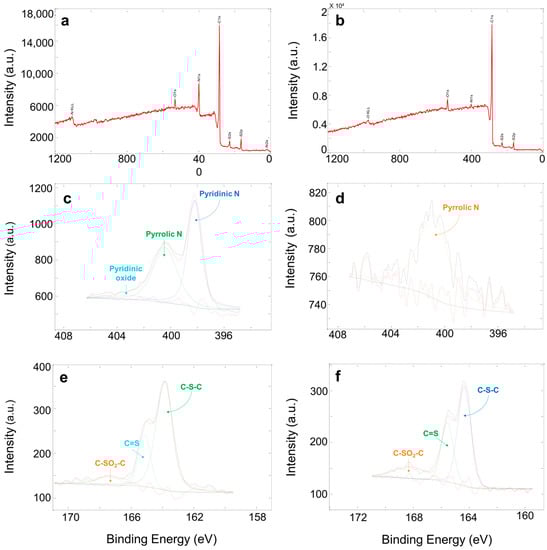
Figure 4.
XPS spectra and deconvolution of N1s and S2p spectra. PAN-C-S: (a) XPS, (c) N1s, (e) S2p. PAN-C-S-Act: (b) XPS, (d) N1s, (f) S2p.
XPS analysis was also used to determine the presence of functional groups of N and S incorporated in the carbon surface. PAN-C, PAN-S-C and PAN-S-C-Act show four deconvoluted peaks for C1s spectra indicating the presence of C-C bond (284.7–284.8 eV), C-N bond (285.7–285.9 eV), carbonyl group (288.9–289.0 eV), and O-C=O (291.1–291.9 eV). O1s spectra reveal the presence of the carbonyl group (531.0–532.6 eV) for PAN-C and PAN-S-C. N1s spectrum of PAN-C shows two peaks after deconvolution, pyridonic N (398.3 eV) and pyrrolic N (400.6 eV) (Table 2).
PAN-C-Act presents the carbonyl group (531.0 eV) and C-OH (532.1 eV). N1s spectrum indicates the presence of pyrrolic N (400.8 eV). PAN-S-C spectrum shows three peaks after deconvoluting the N1s spectra, i.e., pyridinic nitrogen (398.2 eV), pyrrolic nitrogen (400.4 eV) and pyridinic oxide (403.0 eV). S2p spectra show C-S-C (163.9 eV), C=S (165.1 eV) and C-SO2-C (167.4 eV). PAN-S-C-Act spectrum presents two peaks after deconvoluting the O1s spectra, carbonyl group at 532.2 eV and COOH at 534.1 eV. N1s spectra evidence the loss of groups after the activation of the carbon material, showing only one peak (400.8 eV) that corresponds to pyrrolic nitrogen. S2p spectrum indicates the existence of C-S bond (164.3 eV), C=S (165.6 eV) and C-SO2-C (168.2 eV). CAC shows three peaks after deconvoluting the C1s spectra, C-C bond (284.8 eV), C=C bond (285.8 eV) and C=O (290.0 eV). O1s spectrum shows the carbonyl group (531.8 eV) and COOH (533.4 eV).
It can be concluded that the nitrogen-rich groups come from the precursor and, to a lower extent, from the continuous flow of nitrogen used in the synthesis. The oxygen groups were formed in the pre-oxidation and activation stages, and the presence of C-SO2-C bonds guarantees that sulphur is part of the carbon structure. Furthermore, these results confirm the sulphur stabilisation with the formation of −Sx− chains covalently bonded to the cyclised and dehydrogenated PAN backbones.
3.1.4. Raman and FTIR Spectroscopy
The molecular structure of the synthesised porous carbons was characterised by Raman and FTIR spectroscopy. As shown in Figure 5, the Raman spectra exhibit the two characteristics bands of pyrolysed materials at 1204–1226 and 1361–1451 cm−1, corresponding to the D-band and G-band, respectively. D-band arises due to the breathing of C hexagons at the defect sites or edges of the carbon structure. Hence, it is related to the defects or disorders of the material, whereas G-band is related to the in-plane stretching vibration of sp2 carbon [26].
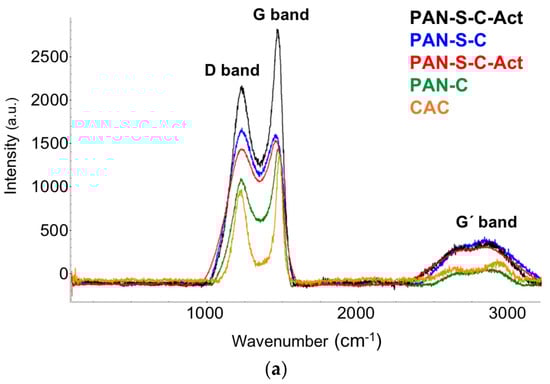
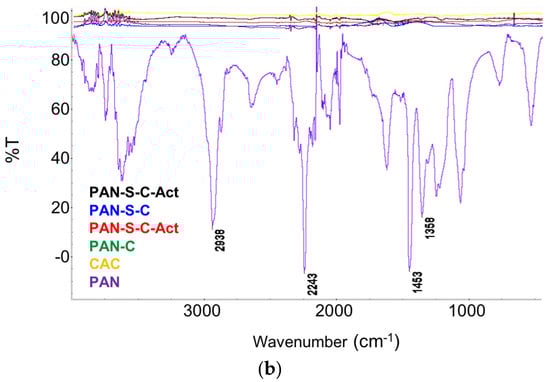
Figure 5.
RAMAN (a) and FTIR spectra (b) of PAN-C, PAN-C-Act, PAN-S-C, PAN-S-C-Act, CAC and precursor (PAN).
The presence of D and G bands indicates that the PAN polymer was transformed into amorphous carbon with a nanographitic structure during the carbonisation process. In addition, the broad Raman peak at around 2800 cm−1 was related to the G′ band (2D band), which is a typical characteristic of highly ordered graphitic lattices. The ratio of Raman characteristic peaks intensity ID/IG is a useful qualitative and quantitative way for evaluating the structural defects using the ratio between graphitisation and crystallinity in the carbon materials and depends on the type of graphitic materials. The intensity ratio of ID/IG was calculated to be 1.02 (PAN-S-C), 0.99 (PAN-S-C-Act), 0.85 (PAN-C), 0.85 (PAN-C-Act) and 0.99 (CAC). The lower ID/IG indicates a higher degree of graphitisation.
In the PAN FTIR spectrum (Figure 5), the CH2 stretching vibration gives rise to three bands at 2938 cm−1, 1453 cm−1 and 1358 cm−1, and the signal of the nitrile bond (CN) stretching vibration is observed at 2243 cm−1. The comparison of PAN spectra with those of the carbons confirms that most of the characteristic bands are weakened and possibly eventually disappear after the carbonisation process. FT-IR spectra show how the pyrolysing processes alter the chemical environment of the carbons. Thereby, some active functional groups are lost while, in PAN-S-C and PAN-S-C-Act carbons, sulphur is directly incorporated into the formed carbon backbone as seen previously in XPS analysis (Section 3.1.3).
3.1.5. Determination of the Zero-Charge Point
Table 3 shows the pHPZC values obtained for all carbons. It can be observed that, in general, the carbons are relatively neutral, although the non-activated ones tend towards alkalinity. This may be because activated carbons have a higher percentage of oxygen groups than the non-activated ones (Table 1), which gives them a slightly more acidic character. The doping with sulphur has little influence on the pHPZC.
Table 3.
pHPZC of carbonous materials.
Studies published by other researchers [27] show that there is a relationship between the amount of adsorbed gas and the pHPZC; thus, as CO2 behaves like a Lewis acid, it could be expected that PAN-C has better adsorption properties than other carbons. PAN-C and PAN-S-C show the highest values of pHPZC though as was shown above, other parameters are more significant in the CO2 uptake.
3.2. Adsorption Experiments: Influence of Pressure and Temperature
The analysis of carbon dioxide and nitrogen adsorption by the different materials synthesised was performed at different temperatures and pressures. As observed in Figure 6, the adsorbed amount of both gases at 298 K shows, for all carbons, lower nitrogen adsorption in comparison with carbon dioxide. The highest value of carbon dioxide uptake at 760 mmHg and 298 K is close to 2.5 mmol·g−1, in agreement with previous studies using doped carbons [15]. This behaviour is interesting if carbons are going to be used for the separation of these gas streams. Although the carbons possess different surface area values, the shape of nitrogen adsorption isotherms and the adsorbed amount (Figure 6) did not differ significantly.
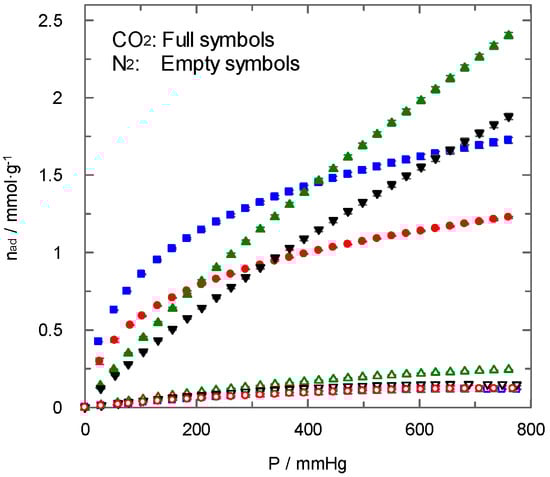
Figure 6.
N2 and CO2 adsorption isotherms at 298 K. PAN-C: ( ) and ( ); PAN-S-C: (  ) and (
  ); PAN-C-Act: (
  ) and (
  ); PAN-S-C-Act: (
  ) and (
  ).
).
Conversely, for carbon dioxide adsorption, the shape of isotherms clearly changed for non-activated and activated carbons. In fact, PAN-C and PAN-S-C showed higher carbon dioxide uptake than activated carbons at low pressures. This behaviour can be related to the presence of ultramicroporosity, as mentioned before, for non-activated carbons, which implies the existence of a certain part of the surface area only available for the carbon dioxide molecules and with a suitable chemical environment. Other authors [20] suggested that as the molecule kinetic diameter decreases, the adsorption improves, confirming that the adsorption of CO2 with a smaller diameter has been better than that of N2. Moreover, the presence of sulphur tends to enhance carbon dioxide adsorption at 273 K (Figure 2), as explained above. In previous studies about carbons doped with nitrogen [28], the authors found that a significant increase in carbon dioxide adsorption occurred due to pores with a small diameter without a significant contribution of the nitrogen. In the current work, the results confirm that non-activated samples with sulphur doping show better carbon dioxide adsorption values.
In relation to the adsorption isotherms corresponding to activated carbons (PAN-C-Act and PAN-S-C-Act), the existence of a higher surface area does not contribute to enhancing carbon dioxide adsorption proportionally at low pressures. This fact indicates that the surface chemistry of carbon changed during the activation process, and the affinity for carbon dioxide is reduced. Chemical activation causes the loss of surface groups from synthesised porous carbons, as demonstrated by FTIR spectroscopy (Section 3.1.4). Furthermore, as mentioned above, the XPS analysis showed a significant decrease in the percentage of the N and S groups and changes after activation. In the case of N, the loss of the pyrrolic N and nitrogen oxide groups is also observed with the activation in PAN-C-Act and PAN-S-C-Act. This conclusion agrees with previous studies [19,20] that confirmed the negative effect caused by high temperatures and activation times upon carbon dioxide adsorption.
In addition to the study of carbon dioxide and nitrogen adsorption at several temperatures, as shown in Figure 2 and Figure 5, similar experiments were carried out to assess the role of the temperature in the adsorption process. Figure 6 shows as an example the carbon dioxide adsorption isotherms of PAN-C and PAN-C-Act at four temperatures (the right plot of Figure 7 is a zoom at a low-pressure range).
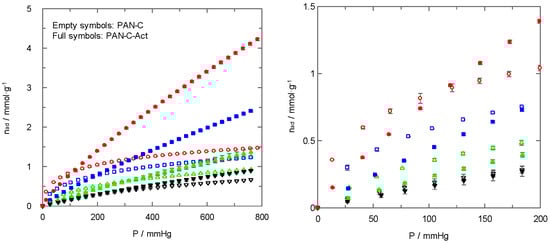
Figure 7.
Influence of temperature upon carbon dioxide adsorption isotherms. T = 273 K: ( ) and ( ); T = 298 K: ( ) and ( ); T = 323 K: ( ) and ( ); T = 348 K: ( ) and ( ) for PAN-C and PAN-C-Act.
For all carbons, the amount of adsorbed gas decrease with increasing temperature for the entire pressure range. This behaviour has been commonly observed for this type of process, and it is the base of the thermal swing adsorption operation. In general, the non-activated carbons reached higher carbon dioxide uptakes than activated ones for a wider pressure range at higher temperatures.
Figure 8 shows the effect of sulphur doping on the carbon dioxide adsorption by PAN-C and PAN-S-C at two temperatures. Even though the importance of the porous structure and surface chemistry of carbons on carbon dioxide adsorption with temperature could be different [29], in this case, the carbon doped with sulphur (PAN-S-C) always showed higher adsorption loading than the PAN-C at different temperatures and pressures. A previous work [27] concluded that the main influence upon CO2 adsorption was the narrow micropore volume, whereas a non-significant influence of surface chemistry was observed. However, in the present study, an enhancement in carbon dioxide uptake due to the presence of sulphur was found for non-activated carbons.
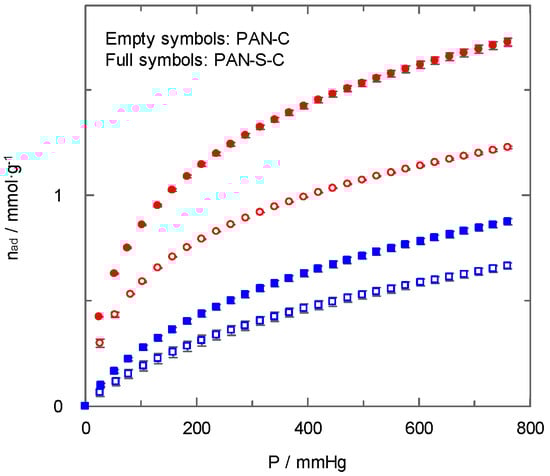
Figure 8.
Effect of temperature upon carbon dioxide adsorption isotherms. T = 298 K: ( ) and ( ); T = 348 K: ( ) and ( ) for PAN-C and PAN-S-C.
3.3. Adsorption Experiments: Isotherm’s Modelling
Experimental data corresponding to the carbon dioxide adsorption isotherms at different temperatures and pressures for all carbons have been employed to evaluate the behaviour of different well-known models (Table 4): Langmuir, Freundlich, and Toth isotherms, where n is the loading of adsorbate, P is pressure and nm,L, nm,T, KL, KF, KT, nF, and t are isotherms’ parameters.
Table 4.
Fitting models used to model the carbon dioxide adsorption.
Figure 9 shows as an example the fitting of the experimental data corresponding to carbon dioxide adsorption over PAN-C and PAN-C-Act to the Langmuir, Freundlich and Toth models. For both materials, significant differences among selected models, mainly at high pressures, are evident. Thus, the non-activated carbon (PAN-C) data show a suitable fit to the Freundlich and Toth models. Still, only the Toth equation fits the experimental data satisfactorily for the activated one (PAN-C-Act).
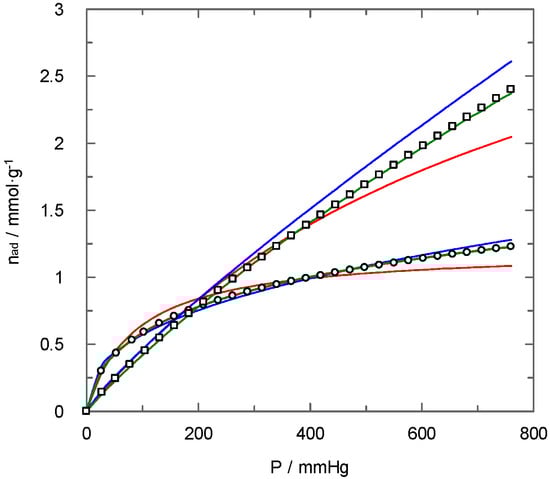
Figure 9.
Curve fitting for carbon dioxide adsorption isotherms. (  ) PAN-C, (
  ) PAN-C-Act to adsorption models: (red line) Langmuir, (blue line) Freundlich, (green line) Toth. T = 298 K.
Table 5 shows the parameters of the models and the standard deviations determined from the fitting of the experimental data for all carbons at different temperatures.
Table 5.
Fitting parameters corresponding to carbon dioxide adsorption using Langmuir, Freundlich and Toth models for all carbons at different temperatures.
The analysis of these data allows concluding that, although for activated carbons, Freundlich and Toth’s models show similar values of standard deviation, for non-activated carbons, the lowest deviation is obtained using the Toth model. Therefore, the Toth equation better explains the carbon dioxide isotherms for all carbons used, including the commercial carbon for comparison. The t parameter of the Toth equation is close to 1 for activated carbons (which implies a high surface homogeneity). It is below 1 for the non-activated carbons, hence confirming their surface heterogeneity [30]. These results also agree with those for the nitrogen adsorption/desorption studies at 77 K.
3.4. CO2/N2 Selectivity
Apart from the information obtained studying the effect of pressure and temperature upon gas-solid isotherms and the determination of the amount of carbon dioxide adsorbed, one of the most important parameters for gas separation is the selectivity of the process. The extrapolation of experimental data for pure components can cause errors in the simulation and/or design of adsorption packed columns. For this reason, the evaluation of adsorption selectivity for a binary mixture of nitrogen and carbon dioxide has been carried out using the ideal adsorbed solution theory (IAST). This procedure has been commonly used for this type of evaluation, and it is deeply described in the literature [31]. Thus, this theory overcomes the difficulty with the values of selectivity determined from pure compounds isotherms considering the competition between gases for the active centres [32] and uses concepts similar to the Raoult equation for vapour-liquid equilibrium.
Figure 10 shows the CO2/N2 selectivity obtained using IAS Theory as a function of pressure for all carbons synthesised in the present work. Different behaviour is observed for non-activated samples compared to the other carbons, which agrees with the results previously explained for the other studies performed (for instance, regarding the shape of adsorption isotherms). Non-activated carbons show high values of selectivity to carbon dioxide (up to 400 for PAN-C), mainly at low pressures. Subsequently, a decrease in the values of selectivity is observed with pressure, which approaches a constant value close to 100. Activated carbons show a value of selectivity independent of pressure and close to 10, in agreement with previous results using carbons from different sources [30].
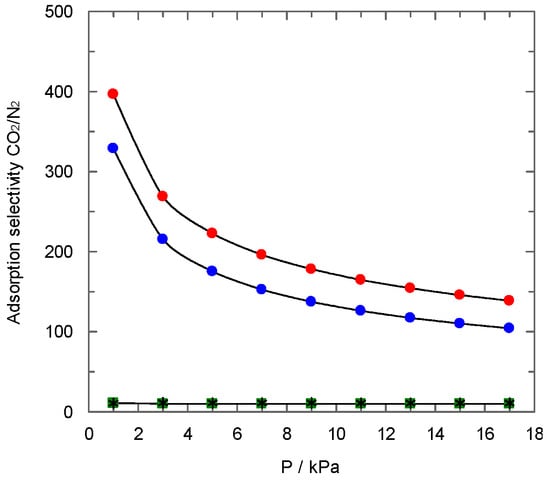
Figure 10.
CO2/N2 selectivity predicted by IAST method for a gas mixtures (CO2:N2 = 0.15:0.85). ( ) PAN-C; ( ) PAN-S-C; (  ) PAN-C-Act; (
  ) PAN-S-C-Act. T = 273 K.
Furthermore, the high selectivity observed for non-activated samples, higher for PAN-C, can be ascribed to the higher ultramicroporosity of the samples [20]. The micropores and, specifically, ultramicropores present in this type of sample are only available for carbon dioxide, avoiding nitrogen adsorption. Again, this finding agrees with the different surface area values found using nitrogen at 77 K and carbon dioxide at 273 K, as previously discussed in Section 3.1.1.
Figure 11 shows another comparison in relation to the adsorption behaviour of a nitrogen+carbon dioxide stream using IAS Theory to estimate the amount adsorbed of each gas, which allows evaluating the effect of activation upon selectivity. High values in the selectivity of non-activated carbons imply that the curves for total adsorption and the corresponding for carbon dioxide are similar. It allows reaching a carbon dioxide purity beyond 95% of the gas adsorbed. However, the activation of PAN-S-C causes a significant decrease in the value of selectivity, reducing the interest in using PAN-S-C-Act in gas separation. The main reasons for this unsuitable behaviour are its low microporosity (lower than 5% of total pore volume, Table 1) and probably low ultramicroporosity and the modification of sulphur functional groups.

Figure 11.
Adsorbed CO2 and N2 predicted by IAST method for a gas mixtures (CO2:N2 = 0.15:0.85). PAN-S-C: (  ) total; (
  ) CO2; ( ) N2. PAN-S-C-Act: ( ) total; ( ) CO2; (
  ) N2. T = 273 K.
3.5. Heat of Adsorption
A deep analysis of carbon dioxide adsorption in different materials could be carried out by determining the heat of adsorption (Qst) associated with the process. The analysis of this parameter allows obtaining conclusions about the chemical interactions produced between adsorbates and the solid surface of the carbons. The heat of adsorption was determined using the Clausius-Clapeyron equation (Equation (4)) and using the experimental data of carbon dioxide isotherms determined at different temperatures. The calculation process has been carried out using the ASAP 2020 software (Micromeritics) that uses the Toth model to fit the experimental isotherms.
where A is a coefficient, R is the universal constant of gases, and T is the temperature.
Figure 12 shows the influence of the carbon dioxide uptake upon the value of heat of adsorption for the different materials employed. In general, the values of heat of adsorption decrease with increasing the carbon dioxide coverage of the solid phase. This behaviour is commonly observed for a wide range of carbonaceous and non-carbonaceous materials [8]. It is attributed to the filling of the pores with lower diameters, which is a part of the surface area associated with higher values of heat of adsorption. The interactions between sorbent and adsorbate tend to decrease when the pore size increases [33]. Thus, non-activated carbons show significantly higher values for the adsorption heat at low carbon dioxide uptakes. This behaviour is related to the existence of ultramicroporosity that causes significant interactions during adsorption. PAN-C is a clear example of this type of behaviour. At the beginning of adsorption, the carbon dioxide fills the micropores with high values of heat of adsorption. When these pores are filled, the adsorption takes place with lower interactions. Conversely, PAN-S-C shows a lower decrease in the value of heat of adsorption with the carbon dioxide loading. This difference is probably due to the presence of sulphur, which is capable of keeping significant interactions with carbon dioxide.
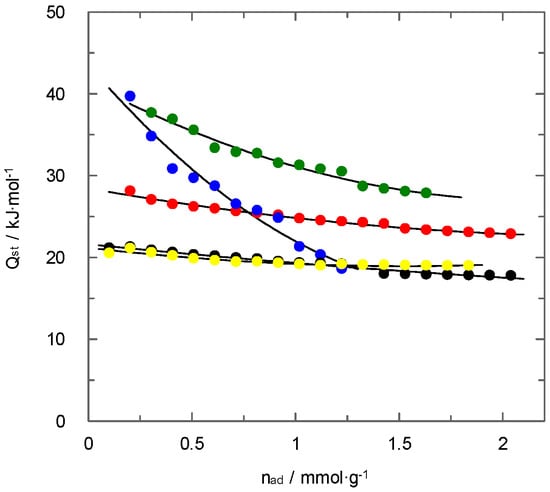
Figure 12.
Influence of carbon dioxide loading upon the heat of adsorption for all materials. ( ) CAC, ( ) PAN-C, ( ) PAN-S-C, ( ) PAN-C-Act, (  ) PAN-S-C-Act.
The two activated carbons show similar behaviour, and no influence of sulphur content has been detected. The CO2 adsorption in both materials involves low values of heat of adsorption in agreement with previous studies [34,35]. The influence of surface coverage upon the value of this parameter is low and, therefore, it remains almost constant. These results agree with the characterisation of the surface from the analysis of nitrogen adsorption/desorption isotherms at 77 K, which suggested homogeneous surfaces without chemical interactions with carbon dioxide. This conclusion also agrees with previous results that showed a low carbon dioxide adsorption at low pressures caused by the surface modification during the activation process.
The commercial activated carbon shows an intermediate behaviour between activated and non-activated carbons. The effect of surface coverage is similar to that for activated materials. However, the higher values of heat of adsorption compared to activated materials must be related to a slightly higher surface heterogeneity, in agreement with previous conclusions reached from nitrogen adsorption/desorption isotherms at 77 K.
Finally, PAN-C can be considered an interesting material for its use in gas separation, allowing the reduction of the energy penalty associated with the regeneration process through the values corresponding to CO2 uptake and selectivity are slightly lower than PAN-S-C carbon.
4. Conclusions
In the present work, the synthesis of activated and non-activated carbons by polyacrylonitrile carbonisation in order to include nitrogen atoms in the material structure has been thoroughly investigated. These materials were also modified by the inclusion of sulphur.
The synthesised materials were characterised using different techniques evidencing the influence of carbonisation and S-doping on the surface characteristics. Several studies (surface area determined with nitrogen and carbon dioxide, adsorption isotherms, selectivity, and heat of adsorption) concluded that microporosity and mainly ultramicroporosity could play a more important role than the doping process upon carbon dioxide adsorption. The importance of pore size distribution is also influenced by the presence of sulphur because it caused an increase in the pore size and modified the microporosity degree.
Non-activated PAN-C showed a promising behaviour due to its high adsorption capacity at moderate loadings and high selectivity to carbon dioxide (producing streams with purities beyond 95%) and low heat of adsorption at high carbon dioxide loading (allowing a reduction in desorption energy penalty). Sulphur presence in non-activated carbon increases carbon dioxide uptake but decrease selectivity. In addition, it causes high heat of adsorption that could increase the energy for sorbent desorption. The suitable characteristics of PAN-C material are mainly ascribed to the high ultramicroporosity of this material.
Based on the results of the present work, it will be possible to prepare carbons with the appropriate degree of ultramicroporosity to enhance carbon dioxide selectivity.
Author Contributions
Conceptualisation: M.S.F., D.G.-D., J.G.-Á. and M.L.; investigation: A.P.-E., L.D.-R., M.S.F., D.G.-D. and G.M.; writing—original draft preparation: M.S.F. and D.G.-D.; writing—review and editing: M.S.F., D.G.-D., J.G.-Á. and M.L. All authors have read and agreed to the published version of the manuscript.
Funding
This research was funded by Ministerio de Ciencia, Innovación y Universidades, grant number PGC2018-101047-B-I00 and Consellería de Educación, Universidade e Formación Profesional, grants number ED431B 2020/39 and ED431B 2020/13.
Institutional Review Board Statement
Not applicable.
Informed Consent Statement
Not applicable.
Data Availability Statement
Data is contained within the article.
Conflicts of Interest
The authors declare no conflict of interest.
References
- Yuksel-Orhan, O.; Tankal, H.; Kayi, H.; Alper, E. Innovative carbon dioxide-capturing organic solvent: Reaction mechanism and kinetics. Chem. Eng. Technol. 2017, 40, 737–744. [Google Scholar] [CrossRef]
- Heldebrant, D.J.; Koech, P.K.; Glezakou, V.-A.; Rousseau, R.; Malhotra, D.; Cantu, D.C. Water-lean solvents for post-combustion CO2 capture: Fundamentals, uncertainties, opportunities, and outlook. Chem. Rev. 2017, 117, 9594–9624. [Google Scholar] [CrossRef] [PubMed]
- Ackley, M.W.; Rege, S.U.; Saxena, H. Application of natural zeolites in the purification and separation of gases. Microporous Mesoporous Mater. 2003, 61, 25–42. [Google Scholar] [CrossRef]
- Emam, H.E.; Abdelhameed, R.M.; Ahmed, H.B. Adsorptive performance of MOFs and MOF containing composites for clean energy and safe environment. J. Environ. Chem. Eng. 2020, 8, 104386. [Google Scholar] [CrossRef]
- Shou, L.; Bai, S. Adsorption of nitrogen on silica gel over a large range of temperatures. Adsorption 2002, 8, 79–87. [Google Scholar]
- Ding, M.; Cai, X.; Jiang, H.-L. Improving MOF stability: Approaches and applications. Chem. Sci. 2019, 10, 10209–10230. [Google Scholar] [CrossRef] [Green Version]
- Wickramaratne, N.P.; Jaroniec, M. Activated carbon spheres for CO2 adsorption. ACS Appl Mater. Interfaces 2013, 5, 1849–1855. [Google Scholar] [CrossRef]
- Abd, A.A.; Naji, S.Z.; Hashim, A.S.; Othman, M.R. Carbon dioxide removal through physical adsorption using carbonaceous and non-carbonaceous adsorbents: A review. J. Environ. Chem. Eng. 2020, 8, 104142. [Google Scholar] [CrossRef]
- Dilokekunakul, W.; Klomkliang, N.; Phadungbut, P.; Chaemchuen, S.; Supasitmongkol, S. Effects of functional group concentration, type, and configuration on their saturation of methanol adsorption on functionalized graphite. Appl. Surf. Sci. 2020, 501, 144121. [Google Scholar] [CrossRef]
- Dilokekunakul, W.; Teerachawanwong, P.; Klomkliang, N.; Supasitmongkol, S.; Chaemchuend, S. Effects of nitrogen and oxygen functional groups and pore width of activated carbon on carbon dioxide capture: Temperature dependence. Chem. Eng. J. 2020, 389, 124413. [Google Scholar] [CrossRef]
- Abdulhamid, M.A.; Ma, X.; Miao, X.; Pinnau, I. Synthesis and characterization of a microporous 6FDA-polyimide made from a novel carbocyclic pseudo Troger’s base diamine: Effect of bicyclic bridge on gas transport properties. Polymer 2017, 130, 182–190. [Google Scholar] [CrossRef] [Green Version]
- Li, D.; Li, W.B.; Shi, J.S.; Xin, F.W. Influence of doping nitrogen, sulphur, and phosphorus on activated carbons for gas adsorption of H2, CH4 and CO2. RSC Adv. 2016, 6, 50138–50143. [Google Scholar] [CrossRef]
- Saha, D.; Orkoulas, G.; Chen, J.; Hensley, D.K. Adsorptive separation of CO2 in sulphur-doped nanoporous carbons: Selectivity and breakthrough simulation. Microporous Mesoporous Mater. 2017, 241, 226–237. [Google Scholar] [CrossRef] [Green Version]
- Seema, H.; Kemp, K.C.; Le, N.H.; Park, S.-W.; Chandra, V.; Lee, J.W.; Kim, K.S. Highly selective CO2 capture by S-doped microporous carbon materials. Carbon 2014, 66, 320–326. [Google Scholar] [CrossRef]
- Shi, J.; Cui, H.; Xu, J.; Yan, N.; Zhang, C.; You, S. Synthesis of nitrogen and sulfur co-doped carbons with chemical blowing method for CO2 adsorption. Fuel 2021, 305, 121505. [Google Scholar] [CrossRef]
- Rivera-Utrilla, J.; Bautista-Toledo, I.; Ferro-García, M.A.; Moreno-Castilla, C. Activated carbon surface modifications by adsorption of bacteria and their effect on aqueous lead adsorption. J. Chem. Technol. Biotechnol. 2001, 76, 1209–1215. [Google Scholar] [CrossRef] [Green Version]
- Sing, K.S.W.; Everett, D.H.; Haul, R.A.W.; Moscou, L.; Pierotti, R.A.; Rouquerol, J.; Siemieniewska, T. Reporting physisorption data for gas/solid systems with special reference to the determination of surface-area and porosity (Recommendations 1984). Pure Appl. Chem. 1985, 57, 603–619. [Google Scholar] [CrossRef]
- Rouquerol, F.; Rouquerol, J.; Sing, K.S.W.; Llewellyn, P.; Maurin, G. Adsorption by Powders and Porous Solids: Principles, Methodology and Application; Academic Press: San Diego, CA, USA, 2014. [Google Scholar]
- Shi, J.; Yan, N.; Cui, H.; Liu, Y.; Weng, Y. Sulphur doped microporous carbons for CO2 adsorption. J. Environ. Chem. Eng. 2017, 5, 4605–4611. [Google Scholar] [CrossRef]
- Sethia, G.; Sayari, A. A comprehensive study of ultra-microporous nitrogen-doped activated carbon for CO2 capture. Carbon 2015, 93, 68–80. [Google Scholar] [CrossRef]
- Kim, K.C.; Yoon, T.-U.; Bae, Y.-S. Applicability of using CO2 adsorption isotherms to determine BET surface areas of microporous materials. Microporous Mesoporous Mater. 2016, 224, 294–301. [Google Scholar] [CrossRef]
- Adeniran, B.; Mokaya, R. Is N-doping in porous carbons beneficial for CO2 storage? Experimental demonstration of the relative effects of pore size and N-doping. Chem. Mater. 2016, 28, 994–1001. [Google Scholar] [CrossRef]
- Zeng, Y.; Do, D.D.; Nicholson, D. Existence of ultrafine crevices and functional groups along the edge surfaces of graphitized thermal carbon black. Langmuir 2015, 31, 4196–4204. [Google Scholar] [CrossRef] [PubMed]
- Manyà, J.J.; González, B.; Azuara, M.; Arner, G. Ultra-microporous adsorbents prepared from vine shoots-derived biochar with high CO2 uptake and CO2/N2 selectivity. Chem. Eng. J. 2018, 345, 631–639. [Google Scholar] [CrossRef] [Green Version]
- Li, D.; Ma, T.; Zhang, R.; Tian, Y.; Qiao, Y. Preparation of porous carbons with high low-pressure CO2 uptake by KOH activation of rice husk char. Fuel 2015, 139, 68–70. [Google Scholar] [CrossRef]
- Zhang, Z.; Wang, L.; Li, Y.; Wang, Y.; Zhang, J.; Guan, G.; Pan, Z.; Zheng, G.; Peng, H. Nitrogen-doped core-sheath carbon nanotube array for highly stretchable supercapacitor. Adv. Energy Mater. 2017, 7, 1601814. [Google Scholar] [CrossRef]
- Peredo-Mancilla, D.; Matel Ghimbeu, C.; Ho, B.N.; Jeguirim, M.; Hort, C.; Bessieres, D. Comparative study of the CH4/CO2 adsorption selectivity of activated carbons for biogas upgrading. J. Environ. Chem. Eng. 2019, 7, 103368. [Google Scholar] [CrossRef]
- Sevilla, M.; Parra, J.B.; Fuertes, A.B. Assessment of the role of micropore size and N-doping in CO2 capture by porous carbons. ACS Appl. Mater. Interfaces 2013, 5, 6360–6368. [Google Scholar] [CrossRef] [Green Version]
- Sánchez-Sánchez, A.; Suárez-García, F.; Martínez-Alonso, A.; Tascón, J.M.D. Influence of porous texture and surface chemistry on the CO2 adsorption capacity of porous carbons: Acidic and basic site interactions. ACS Appl. Mater. Interfaces 2014, 6, 21237–21247. [Google Scholar] [CrossRef]
- Chowdhury, S.; Balasubramanian, R. Three-dimensional graphene-based porous adsorbents for postcombustion CO2 capture. Ind. Eng. Chem. Res. 2016, 55, 7906–7916. [Google Scholar] [CrossRef]
- Myers, A.L.; Prausnitz, J.M. Thermodynamics of mixed-gas adsorption. AIChE J. 1965, 11, 121–127. [Google Scholar] [CrossRef]
- González, A.S.; Plaza, M.G.; Rubiera, F.; Pevida, C. Sustainable biomass-based carbon adsorbents for post-combustion CO2 capture. Chem. Eng. J. 2013, 230, 456–465. [Google Scholar] [CrossRef] [Green Version]
- Chiang, Y.-C.; Yeh, C.-Y.; Weng, C.-H. Carbon dioxide adsorption on porous and functionalized activated carbon fibers. Appl. Sci. 2019, 9, 1977. [Google Scholar] [CrossRef] [Green Version]
- Yang, M.; Guo, L.; Hu, G.; Hu, X.; Chen, J.; Shen, S.; Dai, W.; Fan, M. Adsorption of CO2 by petroleum coke nitrogen-doped porous carbons synthesized by combining ammoxidation with KOH activation. Ind. Eng. Chem. Res. 2016, 55, 757–765. [Google Scholar] [CrossRef]
- Hao, W.; Björkman, E.; Lilliestråle, M.; Hedin, N. Activated carbons prepared from hydrothermally carbonized waste biomass used as adsorbents for CO2. Appl. Energy 2013, 112, 526–532. [Google Scholar] [CrossRef]
Publisher’s Note: MDPI stays neutral with regard to jurisdictional claims in published maps and institutional affiliations. |
© 2022 by the authors. Licensee MDPI, Basel, Switzerland. This article is an open access article distributed under the terms and conditions of the Creative Commons Attribution (CC BY) license (https://creativecommons.org/licenses/by/4.0/).