
Service Failure Risk Assessment and Service Improvement of Self-Service Electric Vehicle

Abstract
:1. Introduction
2. Literature Review
2.1. Fuzzy FMEA
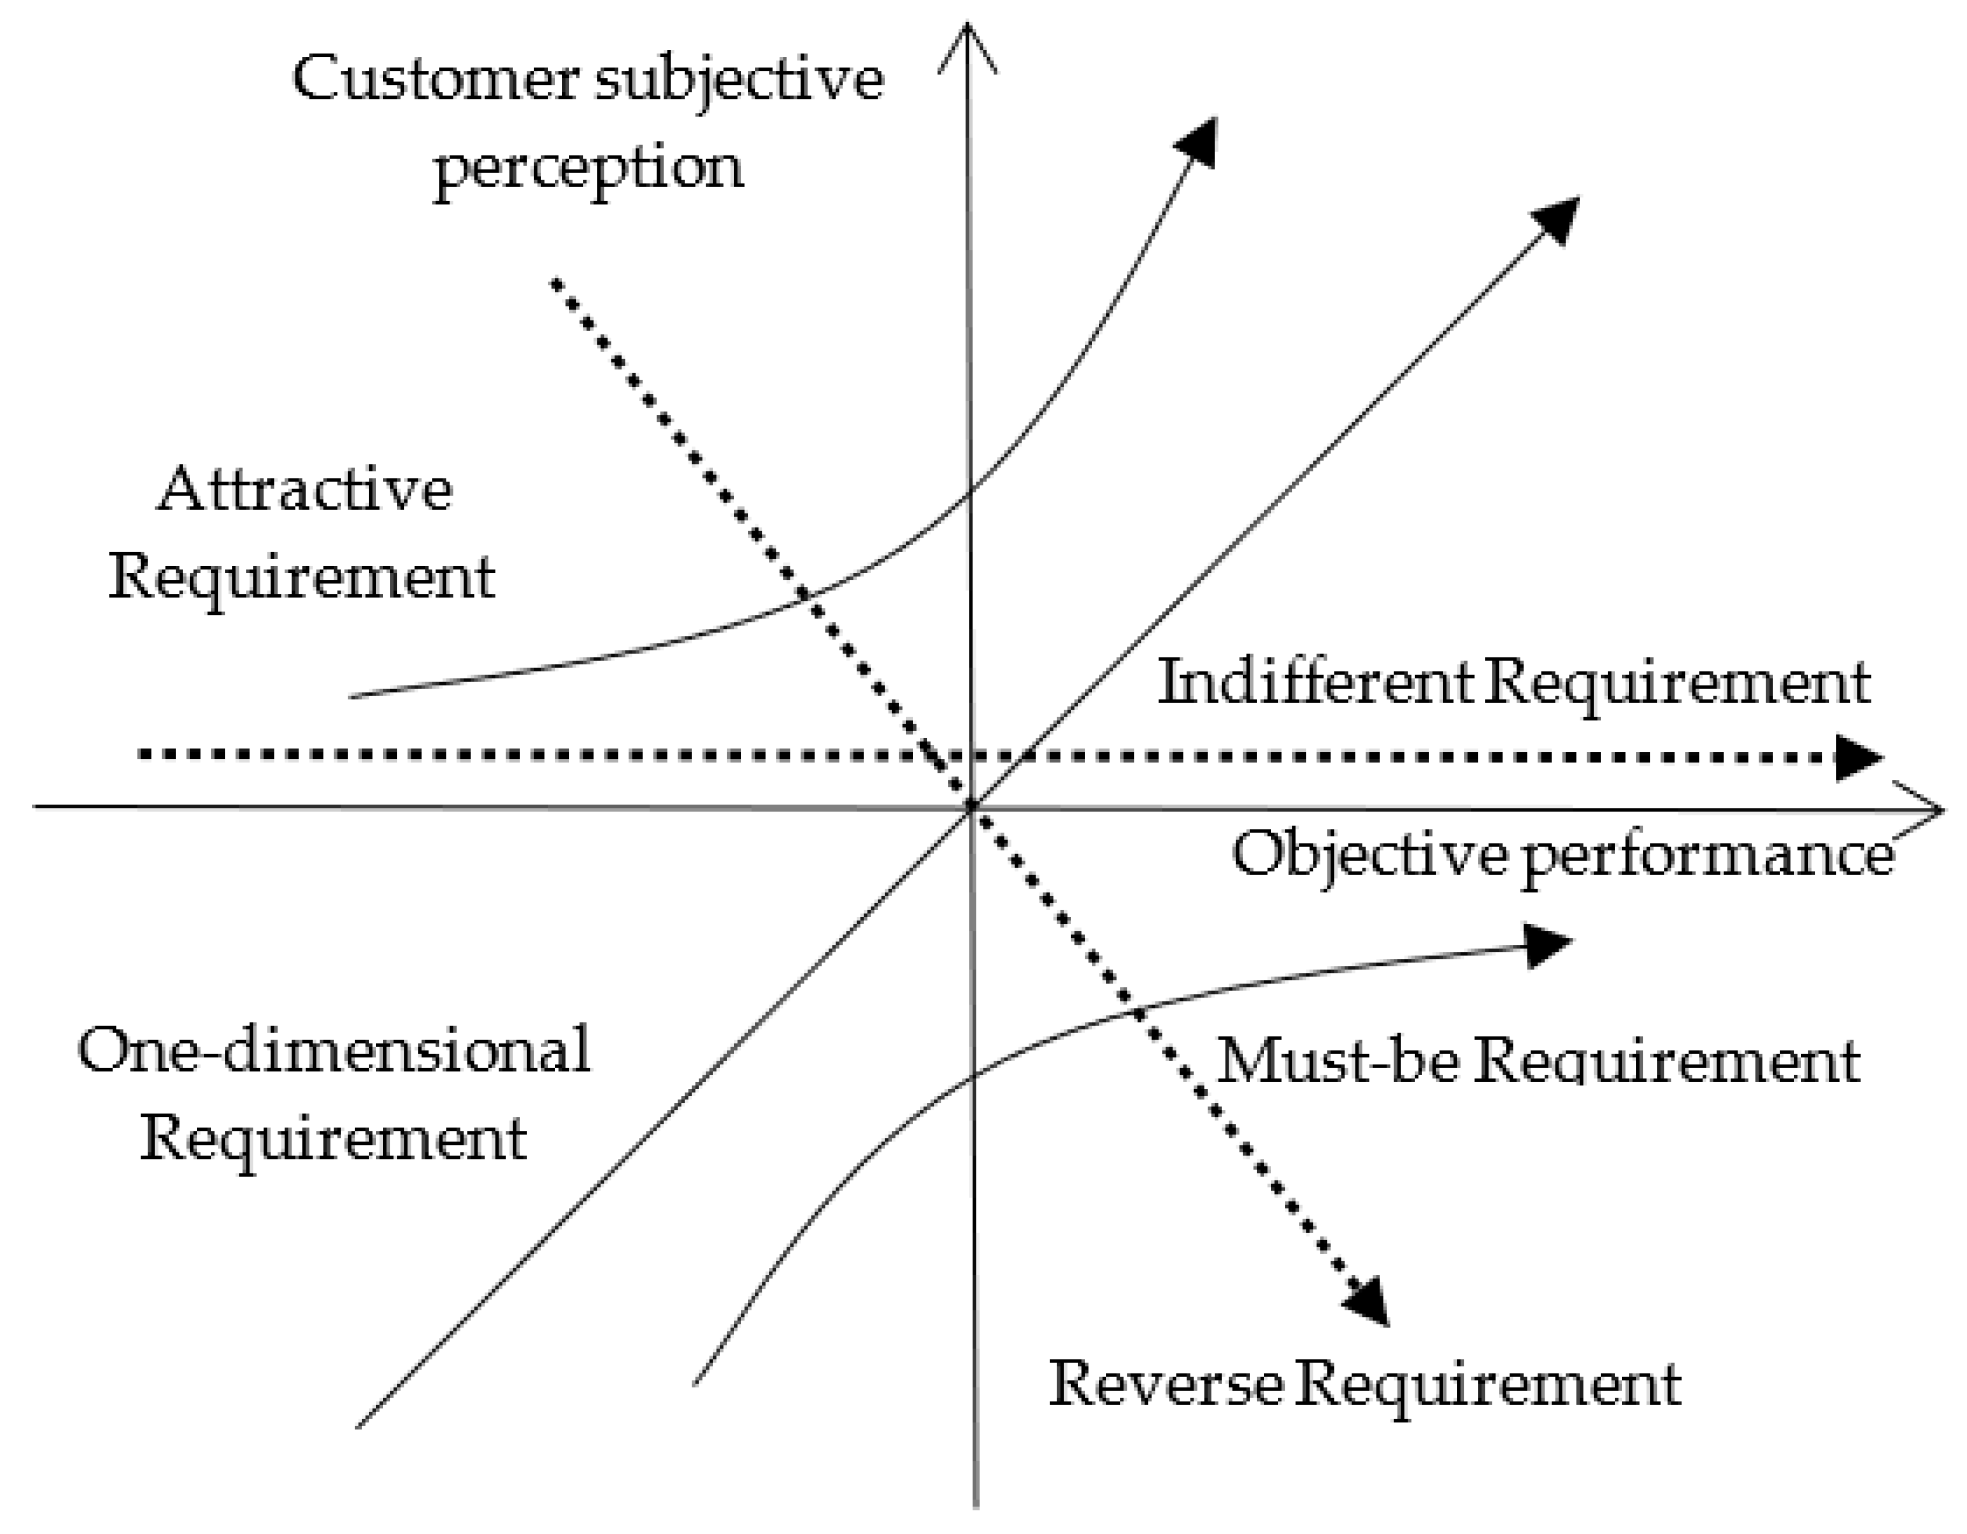
2.2. Kano Model
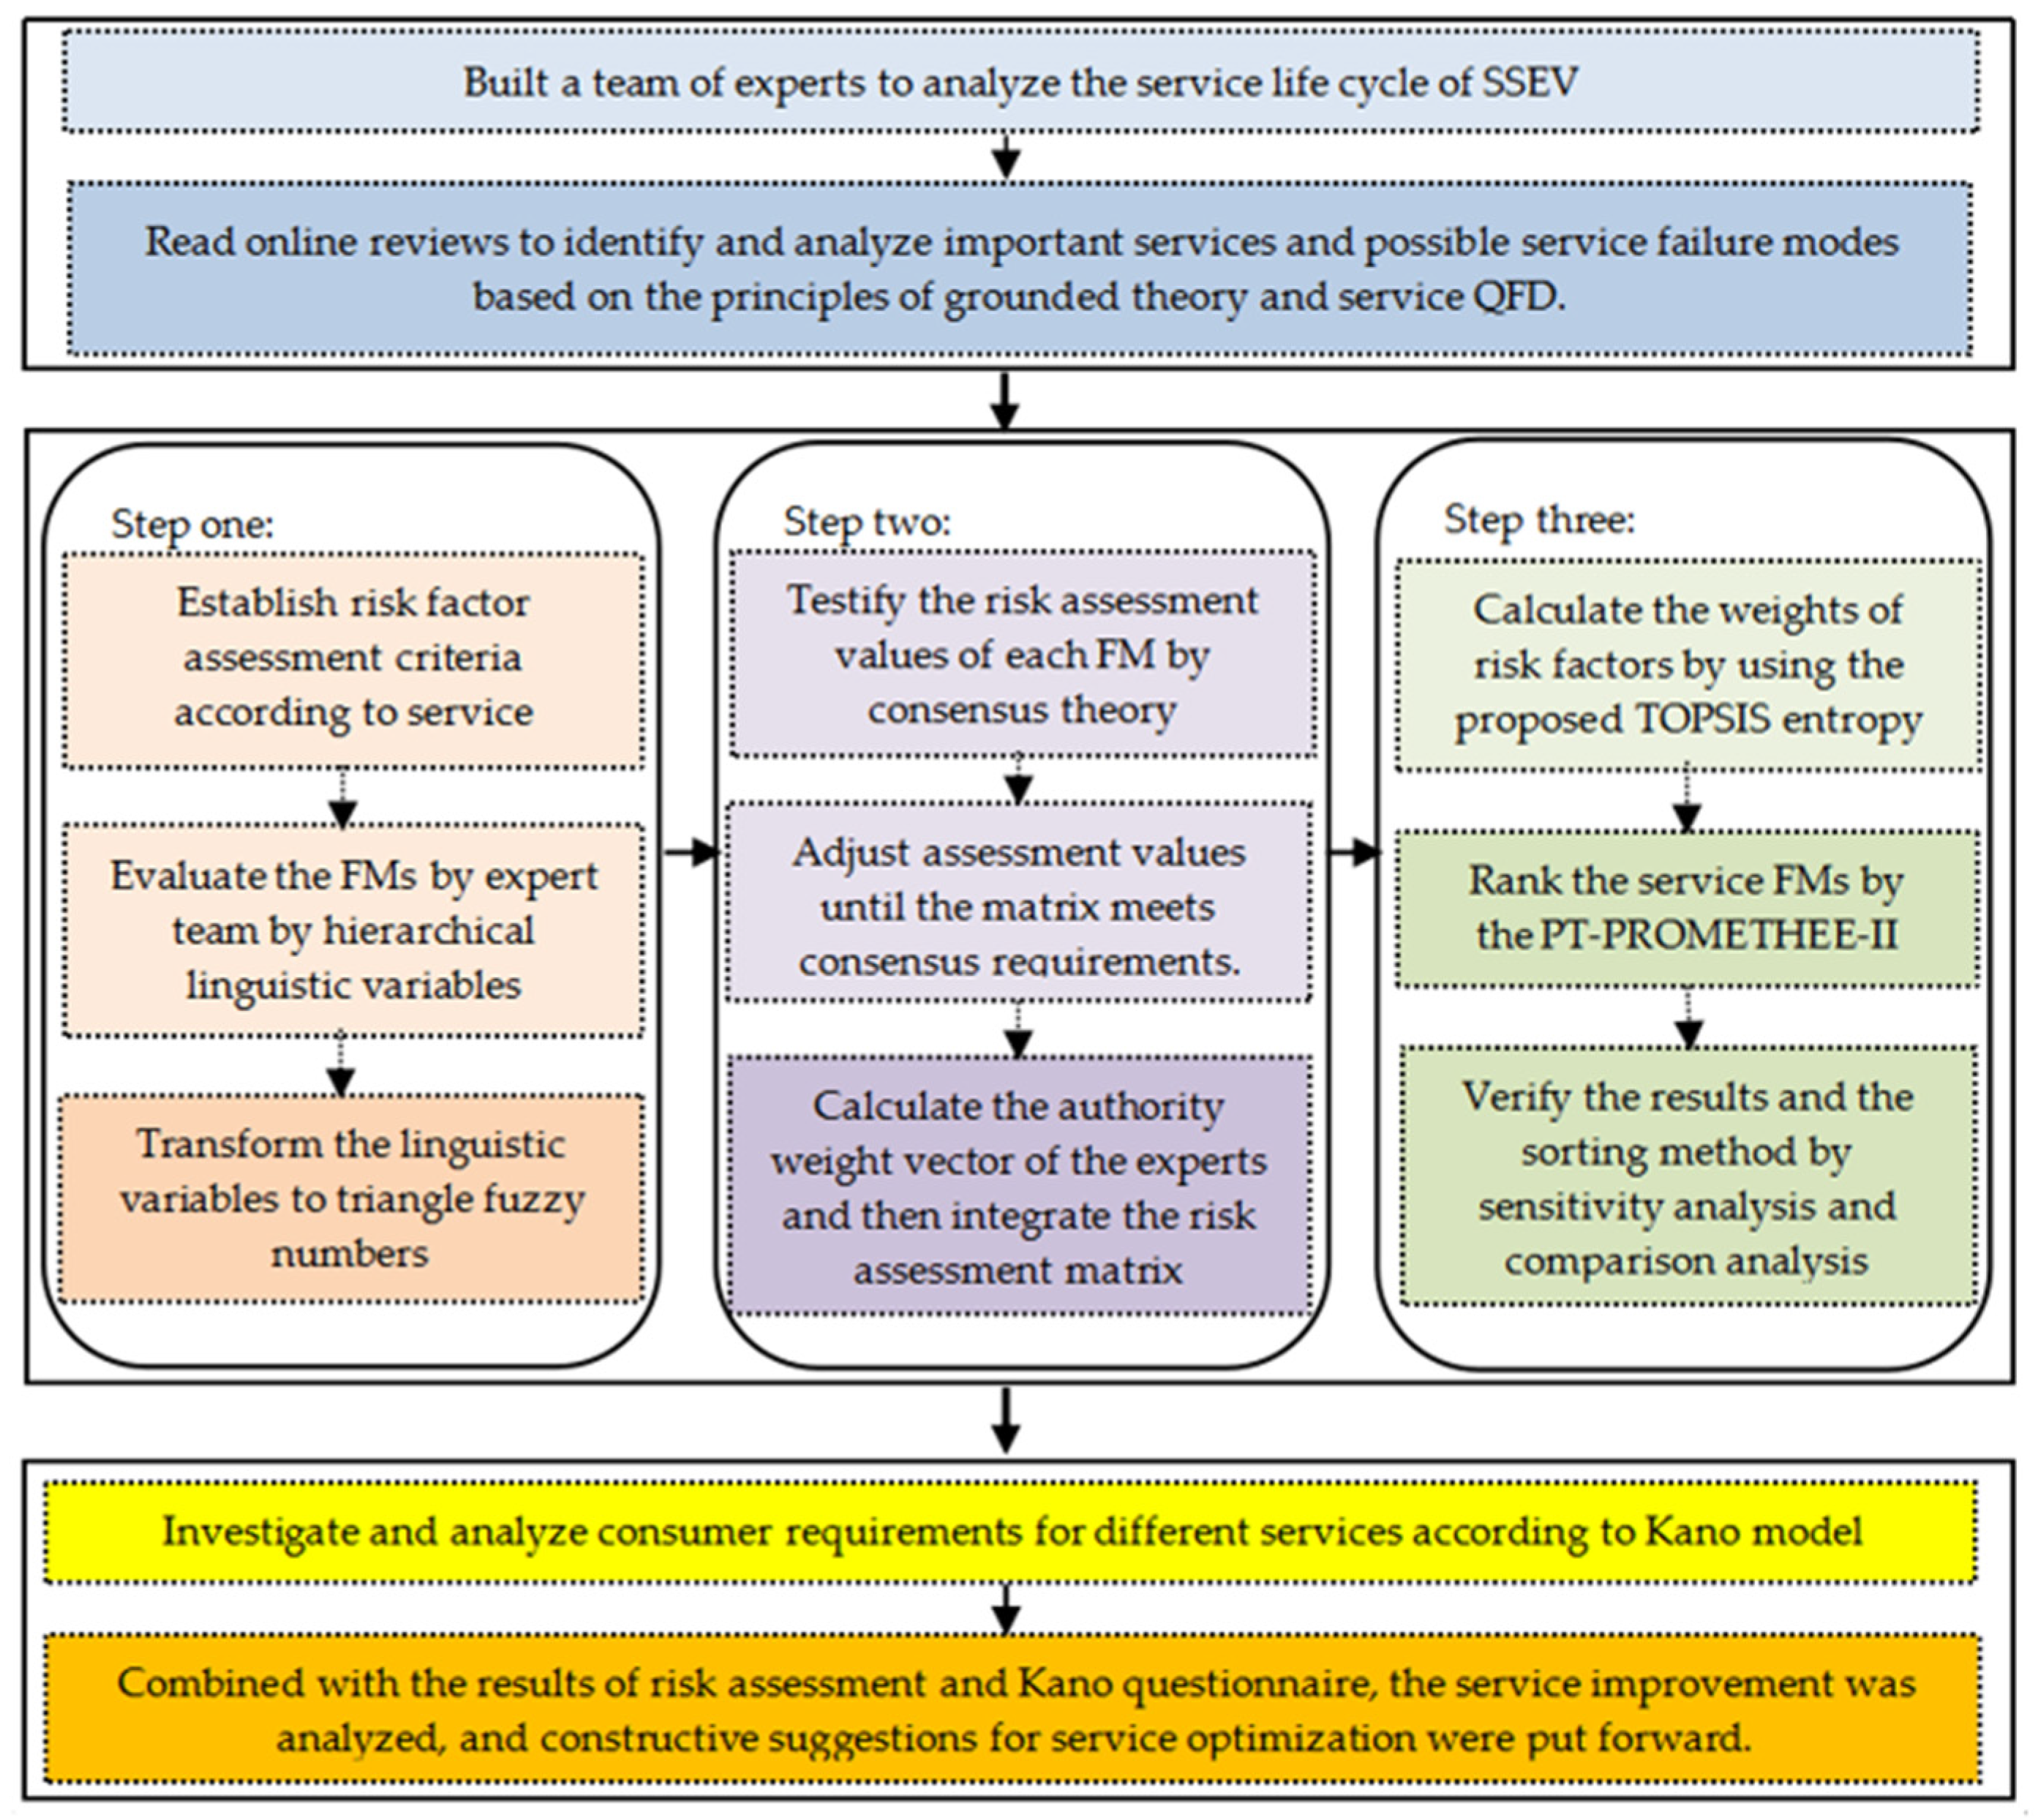
3. Methodology
3.1. Linguistic Variables
- Ordering: when i > k, Li > Lk.
- Reversible: when k = L − i, , where neg is an inverse operation.
- Extreme value: when , there exists and .
3.2. The Establishment of the Expert Team
3.3. Inspection and Integration of FMEA Matrix
3.4. Calculation of Weights of Risk Factors
3.5. Ranking FMs by Using the PT-PROMETHEE-II Method
3.6. Calculation of Satisfaction Index
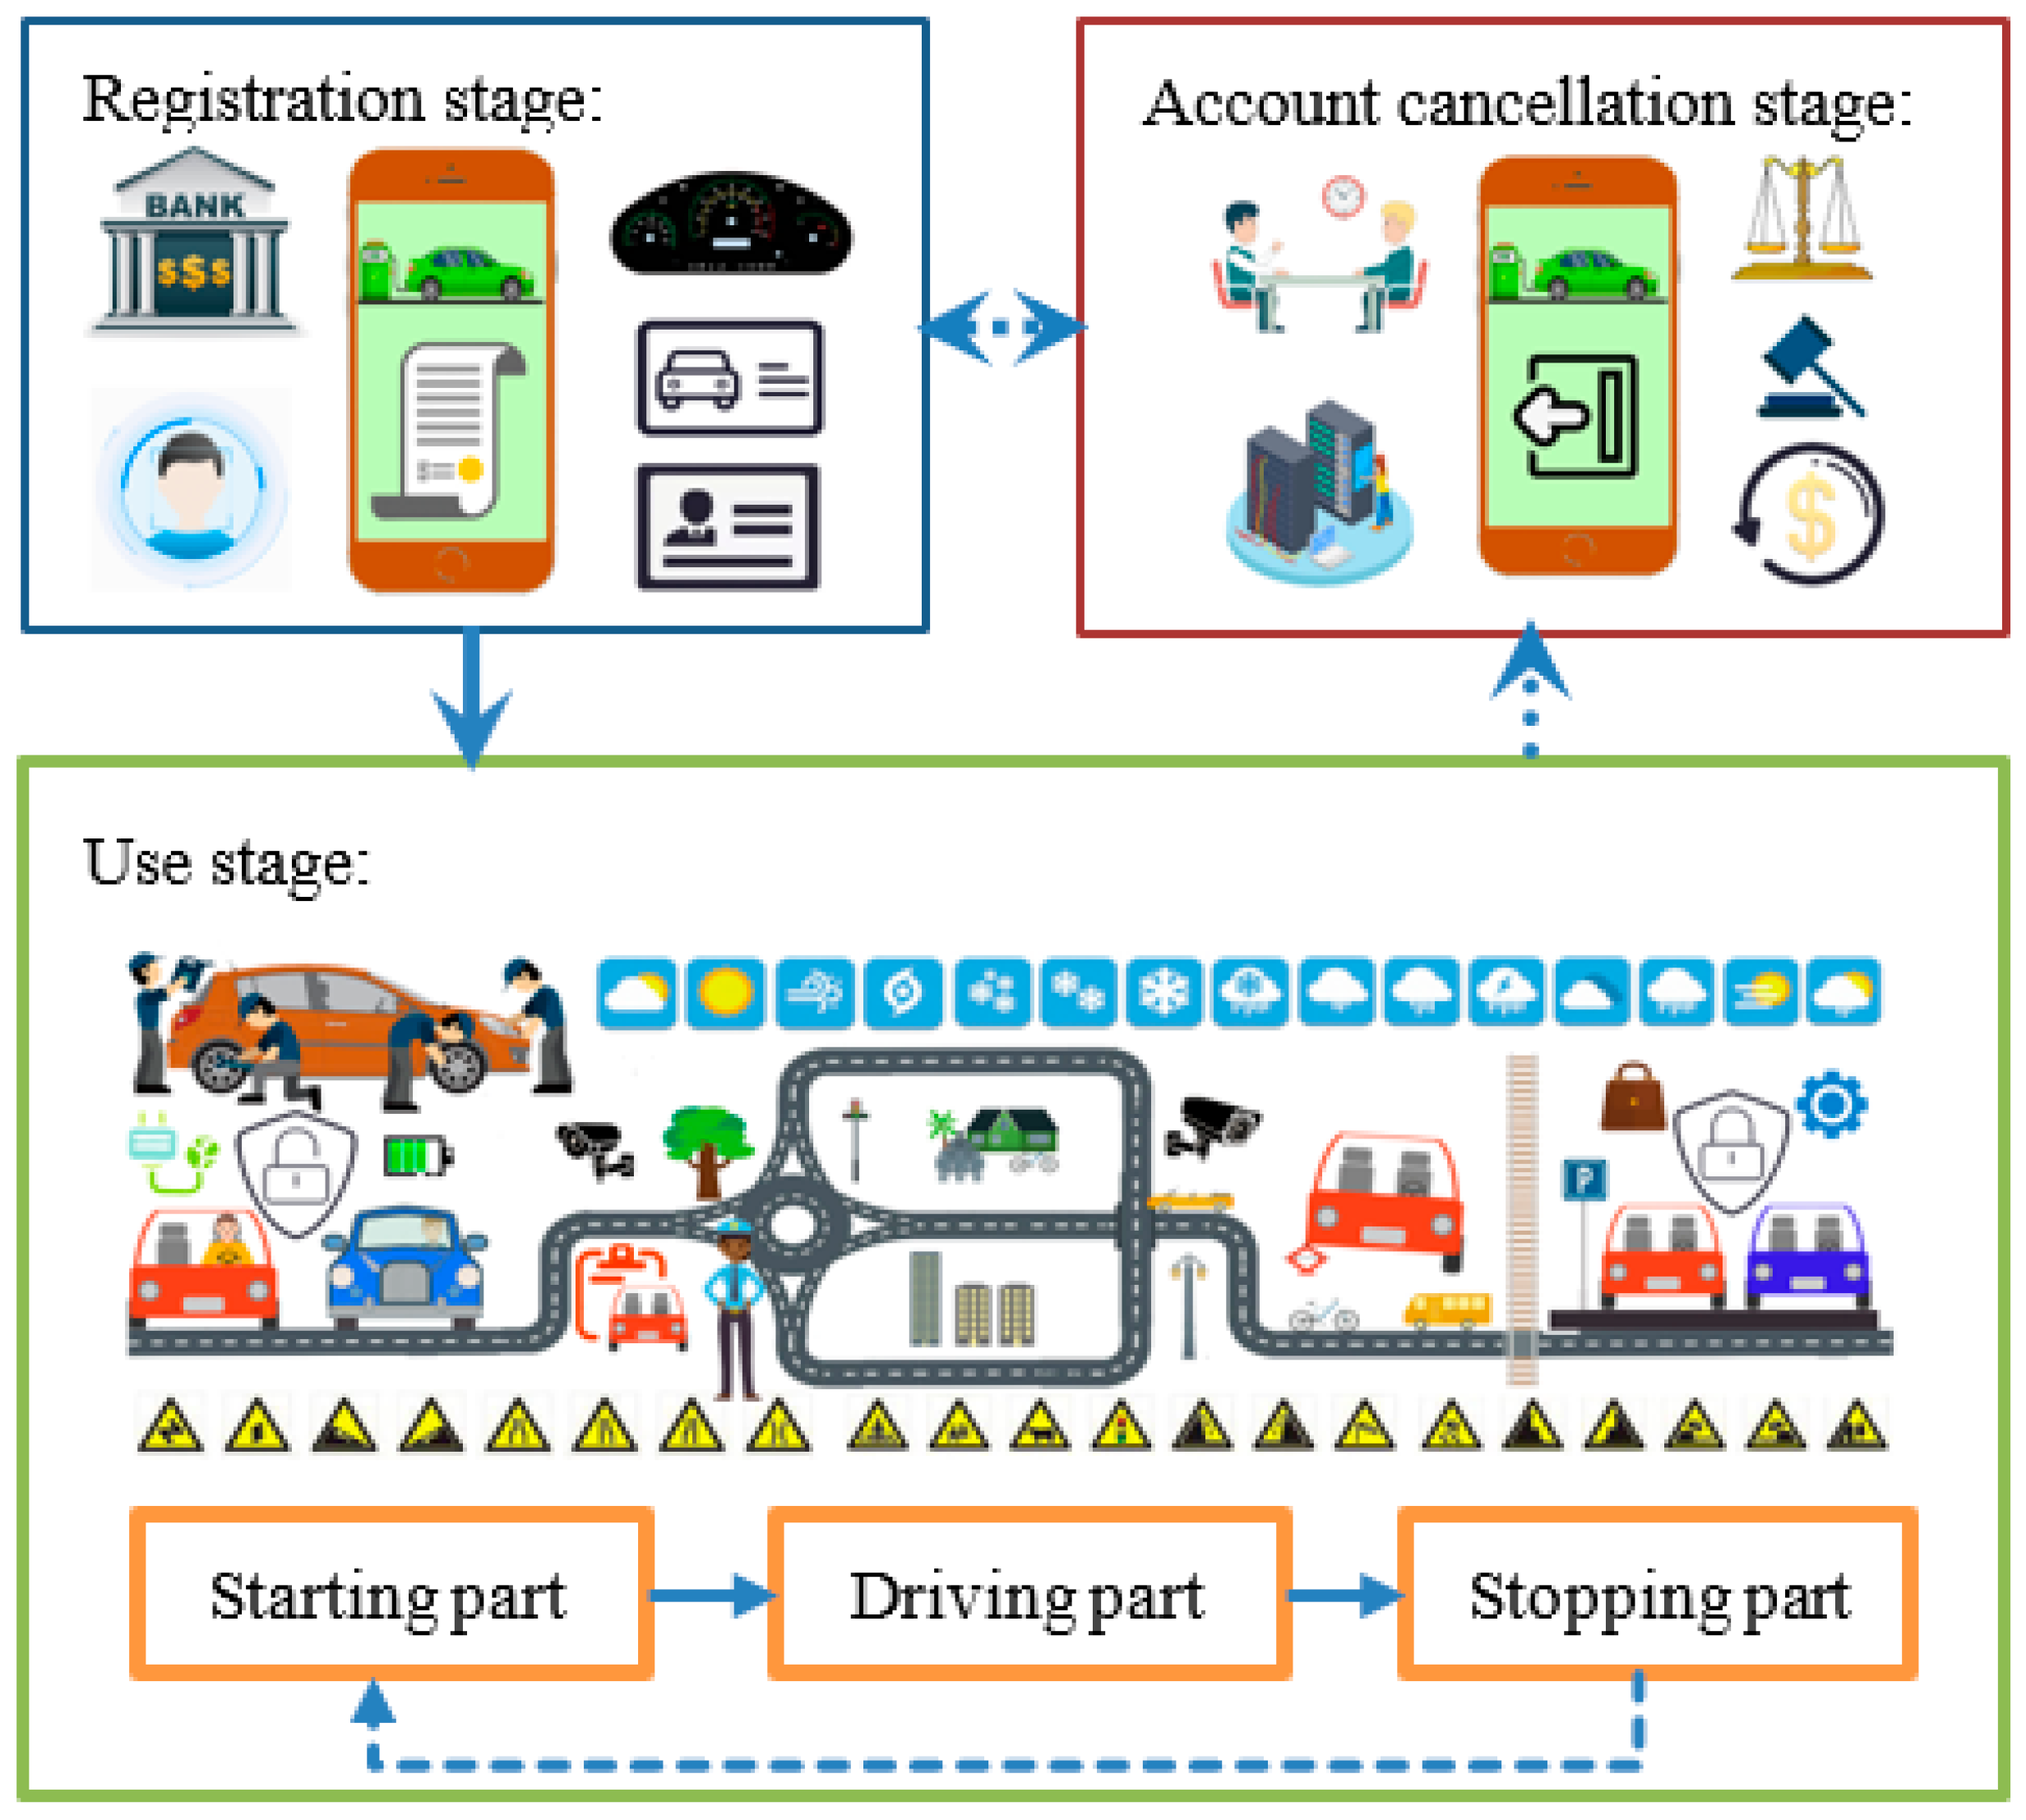
4. SLC Analysis of SSEVs
4.1. Construction of Expert Team
4.2. Service Life Cycle Analysis
4.2.1. Registration Stage
4.2.2. Use Stage
4.2.3. Account Cancellation Stage
5. Risk Assessment of Service Failures
5.1. Construction of Evaluation Criteria and Risk Assessment
5.2. Inspection and Construction of Assessment Matrix
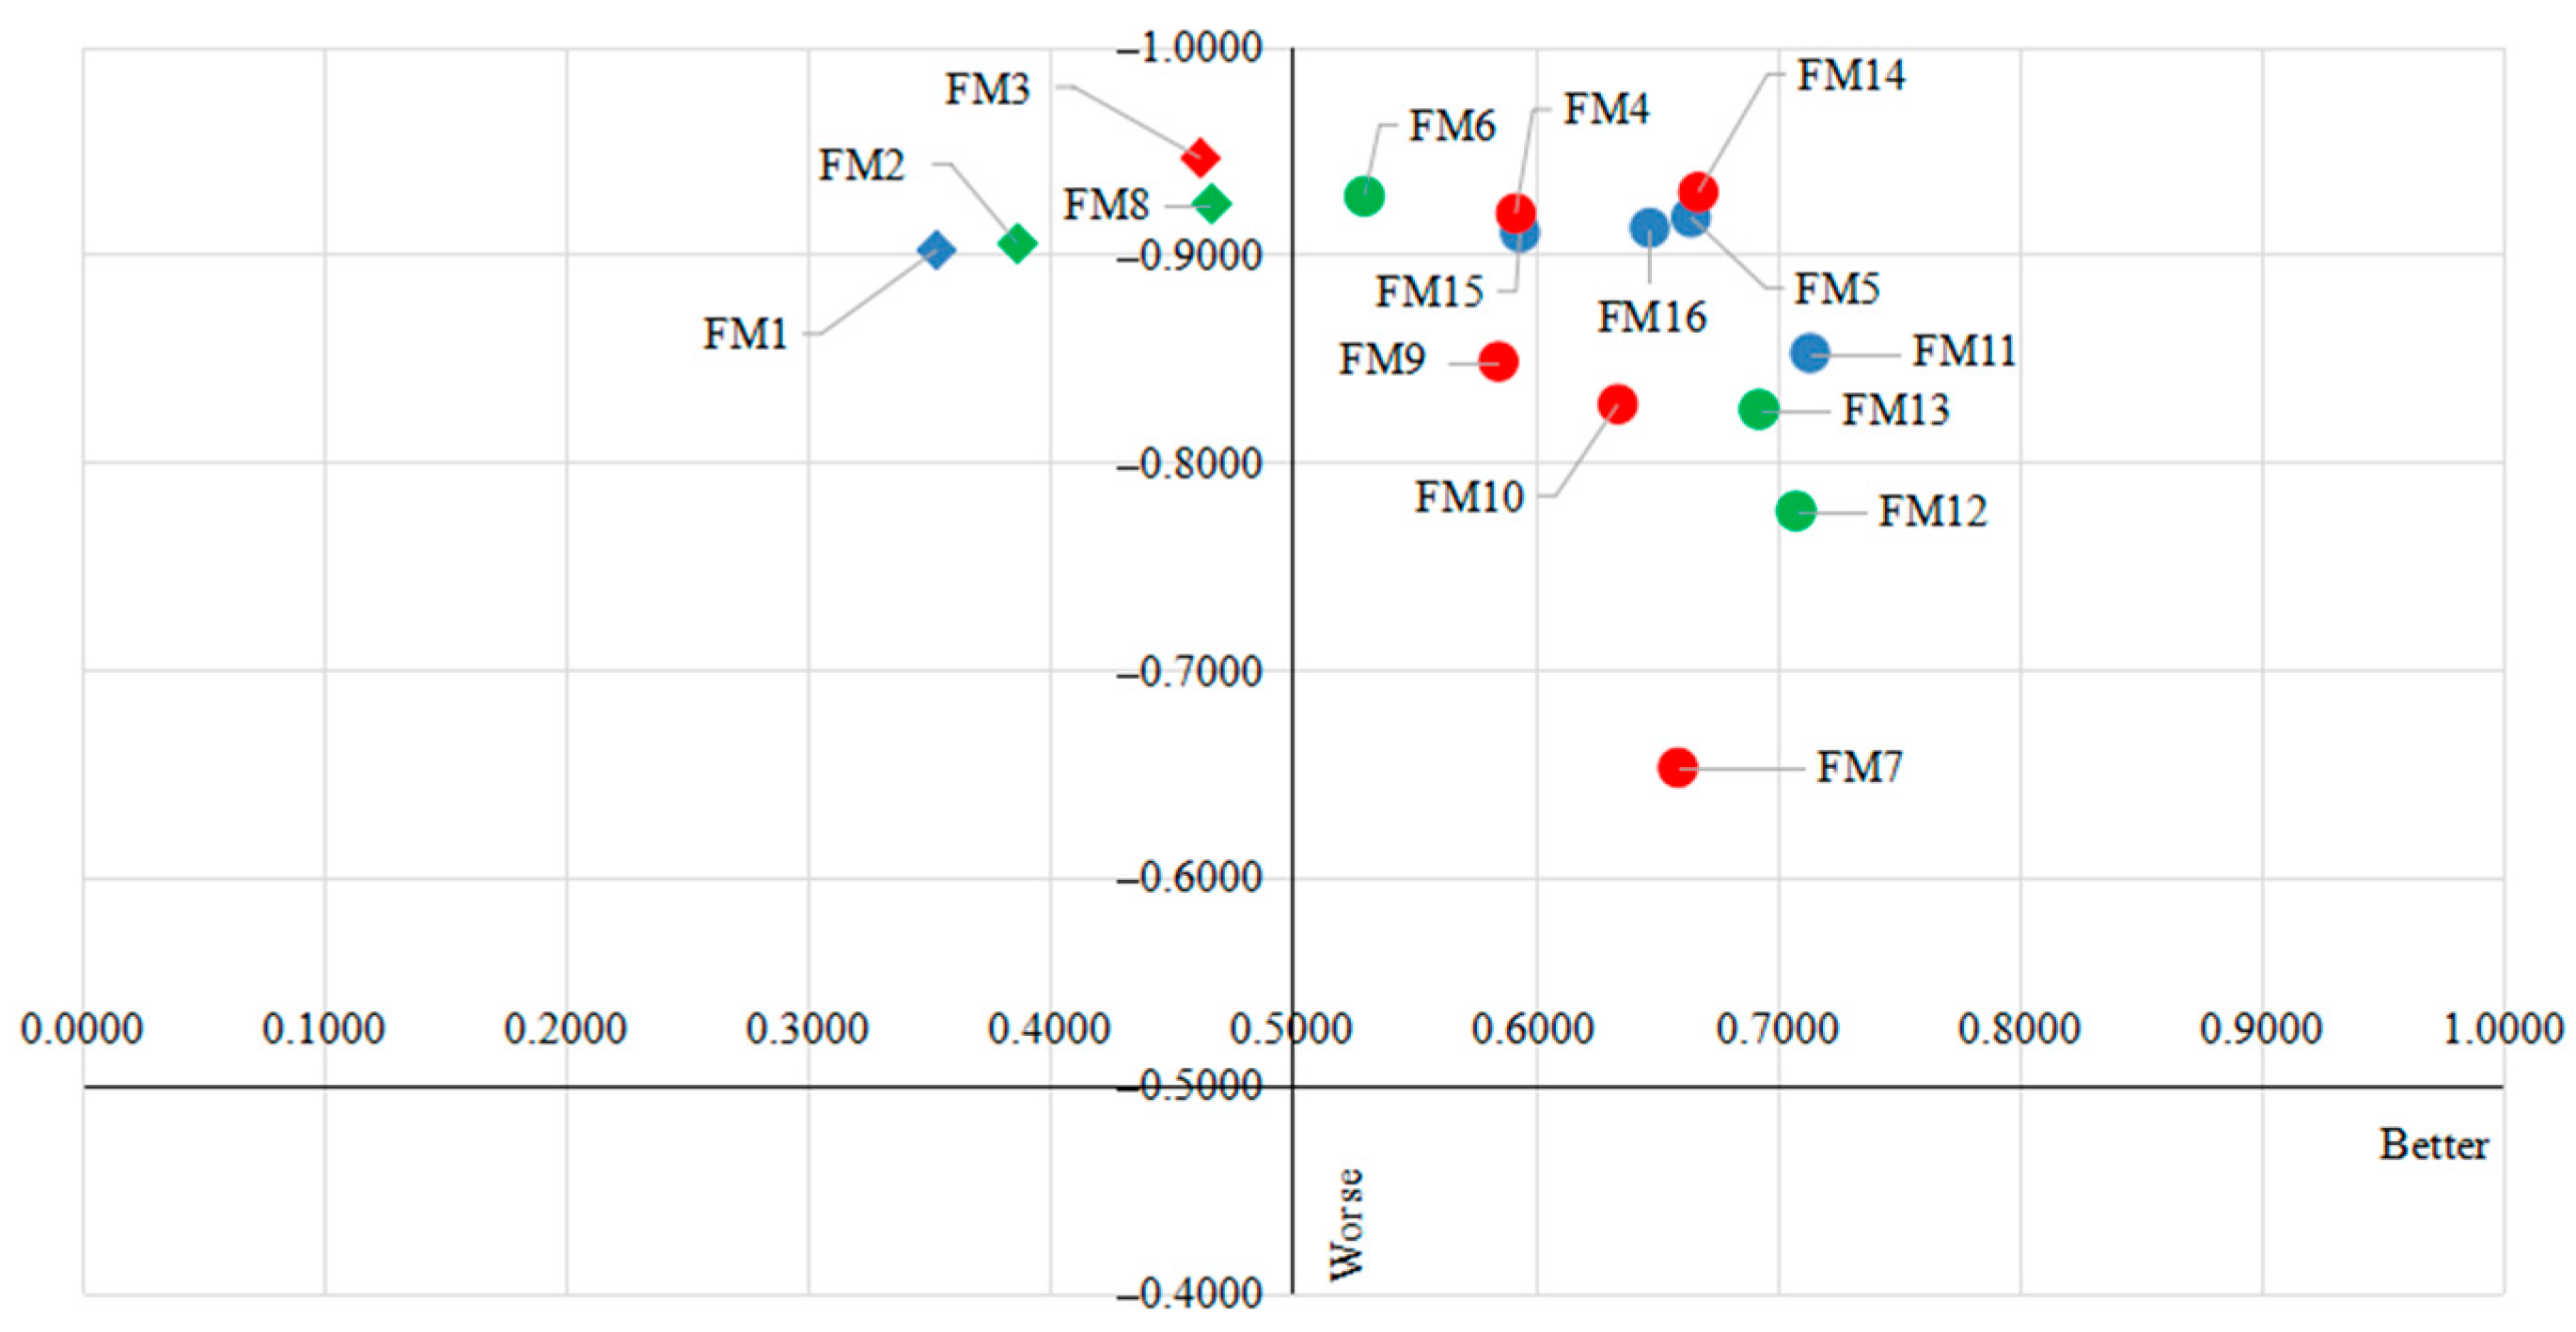
5.3. Ranking of FMs through TOPSIS Entropy Method and PT-PROMETHEE-II Method
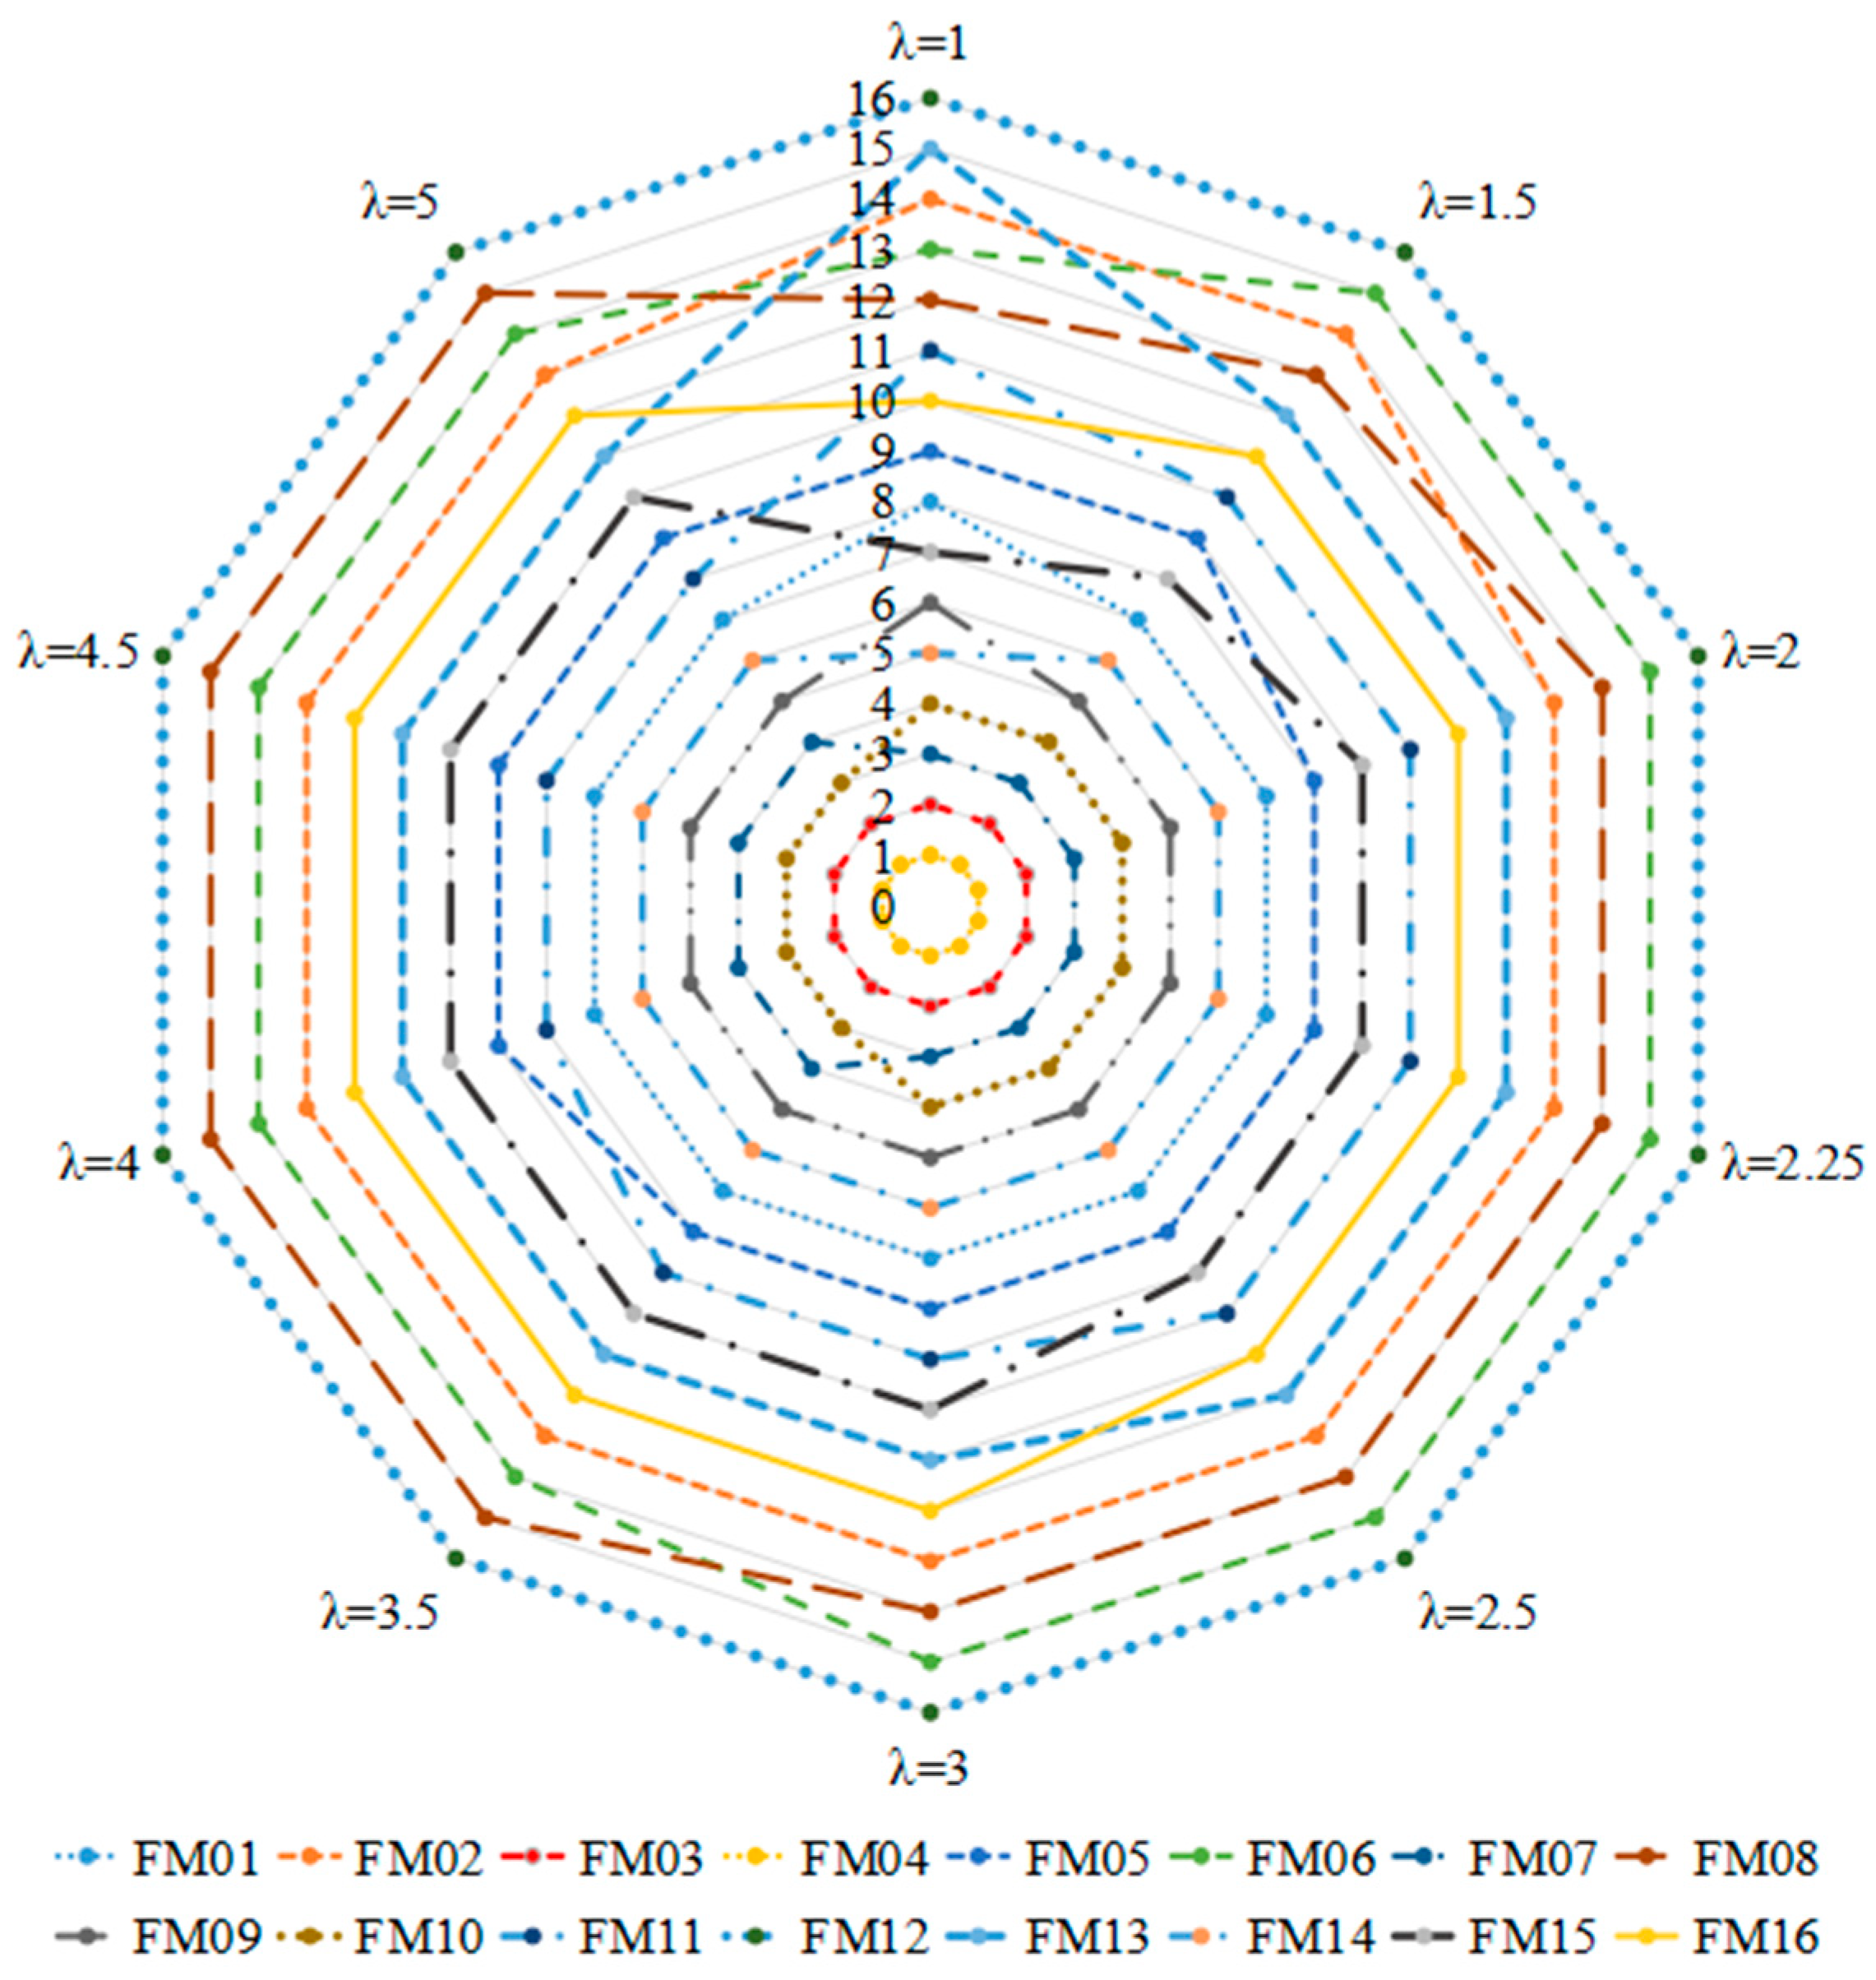
5.4. Sensitivity Analysis
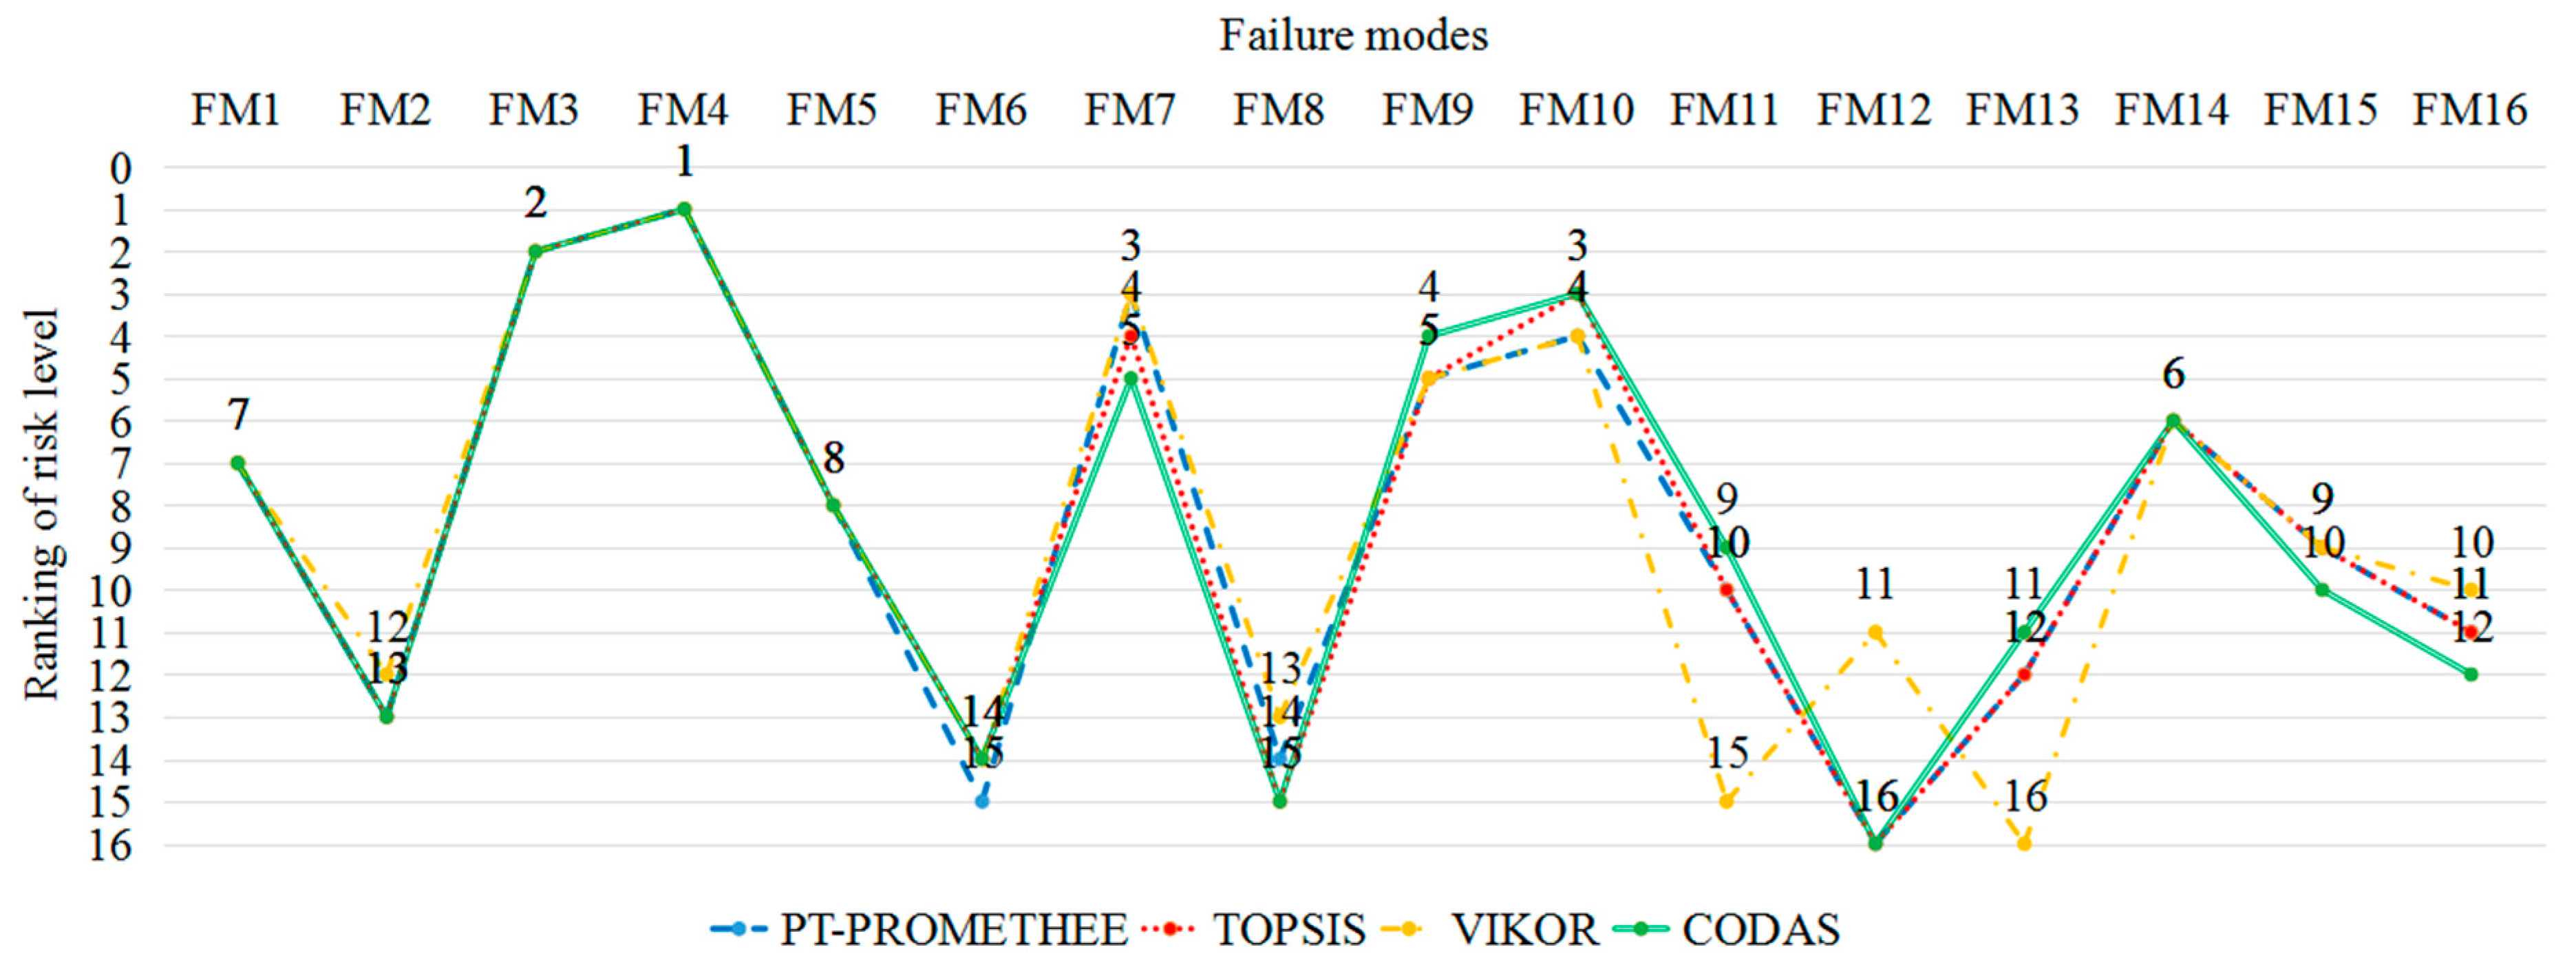
5.5. Comparison Analysis
6. Service Improvement Analysis
6.1. Kano Investigation
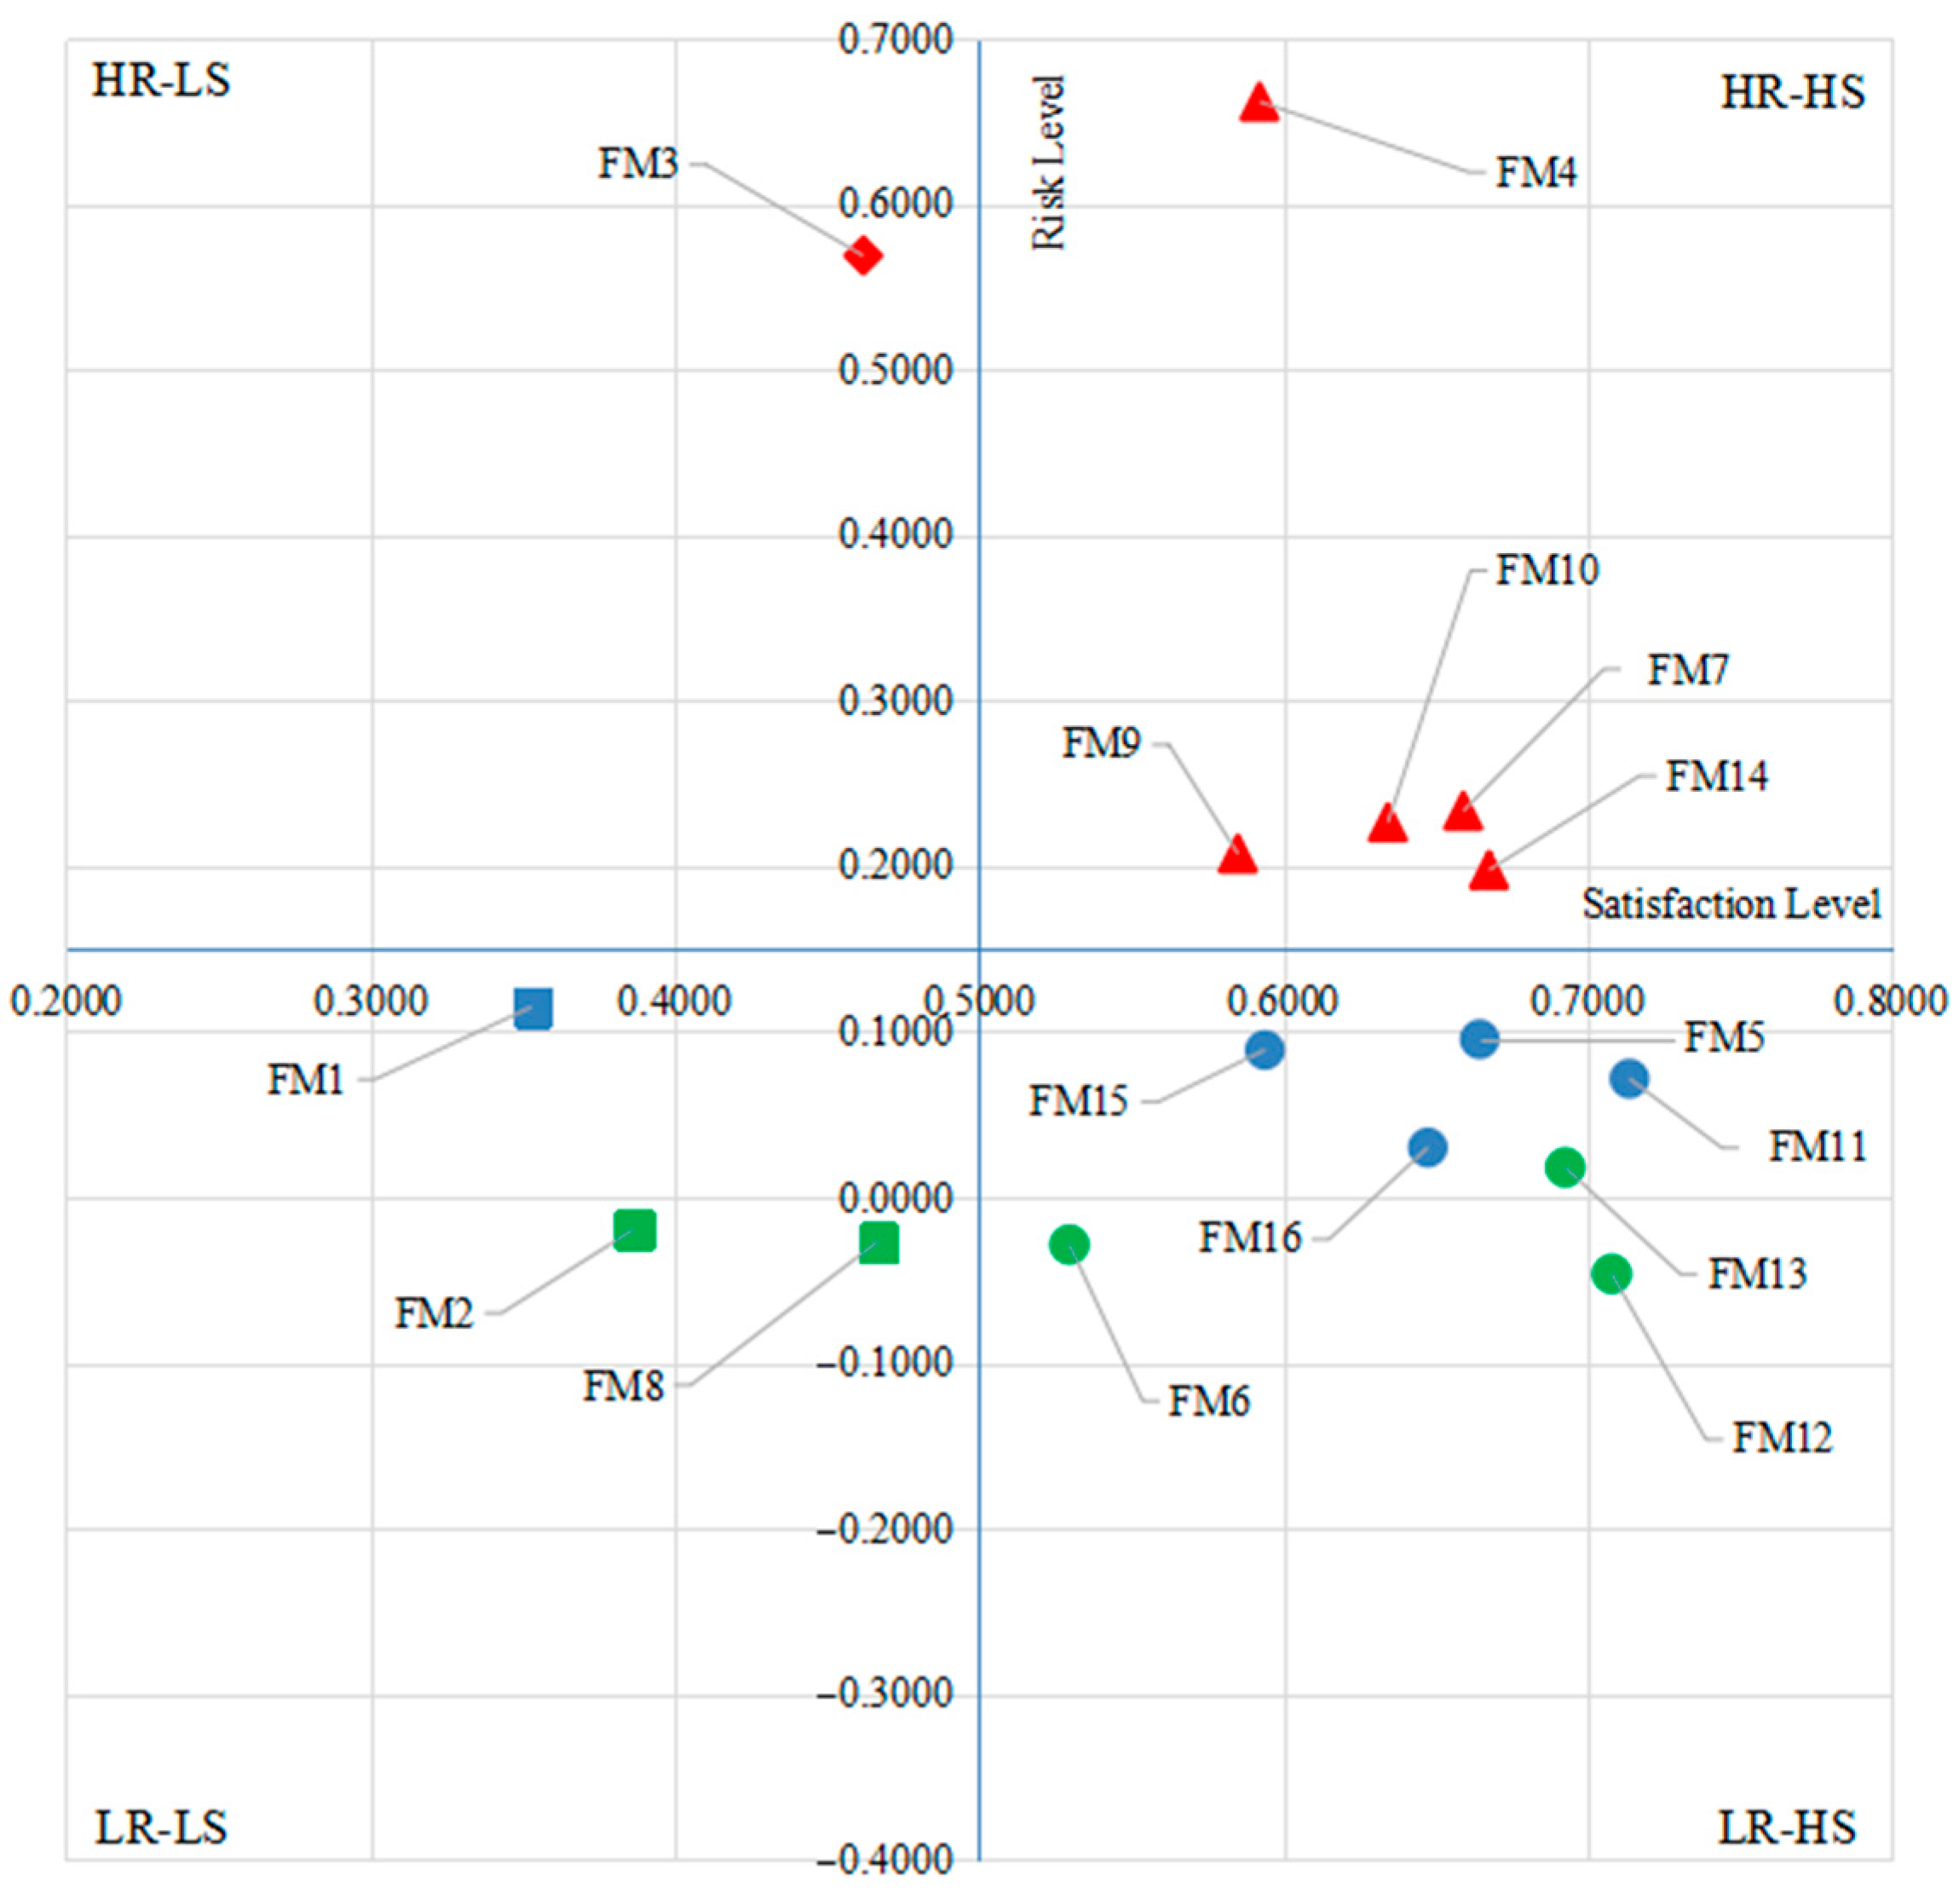
6.2. Risk-Satisfaction Analysis
7. Conclusions and Summary
7.1. Conclusions and Discussion
7.2. Summary and Prospects
Author Contributions
Funding
Institutional Review Board Statement
Informed Consent Statement
Data Availability Statement
Conflicts of Interest
References
- World Health Organization. COP24 Special Report: Health and Climate Change; World Health Organization: Geneva, Switzerland, 2018; p. 74. Available online: http://apps.who.int/iris/handle/10665/276405 (accessed on 1 February 2022).
- Shojaie, A.A.; Raoofpanah, H. Solving a two-objective green transportation problem by using meta-heuristic methods under uncertain fuzzy approach. J. Intell. Fuzzy Syst. 2018, 34, 1–10. [Google Scholar] [CrossRef]
- Ding, N.; Pan, J.; Zhang, Z.; Yang, J. Life cycle assessment of car sharing models and the effect on GWP of urban transportation: A case study of Beijing. Sci. Total Environ. 2019, 688, 1137–1144. [Google Scholar] [CrossRef] [PubMed]
- Yang, H.; Huo, J.; Bao, Y.; Li, X.; Yang, L.; Cherry, C.R. Impact of e-scooter sharing on bike sharing in Chicago. Transp. Res. Part A Policy Pract. 2021, 154, 23–36. [Google Scholar] [CrossRef]
- Brown, C. Carsharing: State of the Market and Growth Potential. Auto Rental News. 2015. Available online: https://www.icscarsharing.it/wp-content/uploads/2019/02/2015-car-sharing-market-in-USA.pdf (accessed on 1 February 2022).
- Mounce, R.; Nelson, J. On the potential for one-way electric vehicle car-sharing in future mobility systems. Transp. Res. Part A Policy Pract. 2019, 120, 17–30. [Google Scholar] [CrossRef]
- Esfandabadi, Z.S.; Ravina, M.; Diana, M.; Zanetti, M.C. Conceptualizing environmental effects of carsharing services: A system thinking approach. Sci. Total Environ. 2020, 745, 141169. [Google Scholar] [CrossRef] [PubMed]
- Stanley, J.; Ellison, R.; Loader, C.; Hensher, D. Reducing Australian motor vehicle greenhouse gas emissions. Transp. Res. Part A Policy Pract. 2018, 109, 76–88. [Google Scholar] [CrossRef]
- Franzò, S.; Nasca, A. The environmental impact of electric vehicles: A novel life cycle-based evaluation framework and its applications to multi-country scenarios. J. Clean. Prod. 2021, 315, 128005. [Google Scholar] [CrossRef]
- Yang, C.-W.; Ho, Y.-L. Assessing carbon reduction effects toward the mode shift of green transportation system. J. Adv. Transp. 2016, 50, 669–682. [Google Scholar] [CrossRef]
- Schlüter, J.; Weyer, J. Car sharing as a means to raise acceptance of electric vehicles: An empirical study on regime change in automobility. Transp. Res. Part F Traffic Psychol. Behav. 2019, 60, 185–201. [Google Scholar] [CrossRef]
- Nijland, H.; van Meerkerk, J. Mobility and environmental impacts of car sharing in the Netherlands. Environ. Innov. Soc. Trans. 2017, 23, 84–91. [Google Scholar] [CrossRef]
- Lee, C.M.; Erickson, P. How does local economic development in cities affect global GHG emissions? Sustain. Cities Soc. 2017, 35, 626–636. [Google Scholar] [CrossRef]
- Lefeng, S.; Chunxiu, L.; Jingrong, D.; Cipcigan, L. External benefits calculation of sharing electric vehicles in case of Chongqing China. Util. Policy 2020, 64, 101021. [Google Scholar] [CrossRef]
- Pham, Q.-T.; Nakagawa, C.; Shintani, A.; Ito, T. Evaluation of the effects of a personal mobility vehicle on multiple pedestrians using personal space. IEEE Trans. Intell. Transp. Syst. 2015, 16, 1–10. [Google Scholar] [CrossRef]
- Sarriera, J.M.; Álvarez, G.E.; Blynn, K.; Alesbury, A.; Scully, T.; Zhao, J. To share or not to share: Investigating the social aspects of dynamic ridesharing. Transp. Res. Rec. J. Transp. Res. Board 2017, 2605, 109–117. [Google Scholar] [CrossRef] [Green Version]
- Hunecke, M.; Richter, N.; Heppner, H. Autonomy loss, privacy invasion and data misuse as psychological barriers to peer-to-peer collaborative car use. Transp. Res. Interdiscip. Perspect. 2021, 10, 100403. [Google Scholar] [CrossRef]
- Feng, X.; Ouyang, M.; Liu, X.; Lu, L.; Xia, Y.; He, X. Thermal runaway mechanism of lithium ion battery for electric vehicles: A review. Energy Storage Mater. 2018, 10, 246–267. [Google Scholar] [CrossRef]
- Qi, W. Fuzzy control strategy of pure electric vehicle based on driving intention recognition. J. Intell. Fuzzy Syst. 2020, 39, 5131–5139. [Google Scholar] [CrossRef]
- Choi, H.B.S.; Lee, M.; Lee, H. Two Faces of Car Sharing: An Exploration on the Effect of Car Sharing on Car Accident. In Proceedings of the Twenty-fifth Americas Conference on Information Systems, Cancun, Mexico, 15–17 August 2019; pp. 1–10. Available online: https://koasas.kaist.ac.kr/handle/10203/275588 (accessed on 20 January 2022).
- Jin, F.; Yao, E.; An, K. Understanding customers’ battery electric vehicle sharing adoption based on hybrid choice model. J. Clean. Prod. 2020, 258, 120764. [Google Scholar] [CrossRef]
- Zeithaml, V.A.; Berry, L.L.; Parasuraman, A. The Behavioral Consequences of Service Quality. J. Mark. 1996, 60, 31–46. [Google Scholar] [CrossRef]
- Fouroudi, P.; Kitchen, P.J.; Marvi, R.; Akarsu, T.N.; Uddin, H. A bibliometric investigation of service failure literature and a research agenda. Eur. J. Mark. 2020, 54, 2575–2619. [Google Scholar] [CrossRef]
- Lee, J.; Nah, J.; Park, Y. Electric Car Sharing Service Using Mobile Technology. In Proceedings of the CONF-IRM 2011 Proceedings, Seoul, Korea, 12–14 June 2011; Paper 12. Available online: https://aisel.aisnet.org/cgi/viewcontent.cgi?article=1018&context=confirm2011 (accessed on 20 January 2022).
- Arena, M.; Azzone, G.; Colorni, A. Service design in electric vehicle sharing: Evidence from Italy. IET Intell. 2015, 9, 145–155. Available online: https://re.public.polimi.it/retrieve/handle/11311/861794/622203/11311-861794_Azzone.pdf (accessed on 20 January 2022). [CrossRef]
- He, L.; Mak, H.-Y.; Rong, Y.; Shen, Z.-J.M. Service region design for urban electric vehicle sharing systems. Manuf. Serv. Op. 2017, 19, 309–327. [Google Scholar] [CrossRef] [Green Version]
- Symeonidis, I.; Mustafa, M.A.; Preneel, B. Keyless car sharing system: A security and privacy analysis. In Proceedings of the 2016 IEEE International Smart Cities Conference (ISC2), Trento, Italy, 12–15 September 2016; pp. 1–7. [Google Scholar]
- Hanusik, A. Identification and risk assessment in carsharing. Sci. J. Silesian Univ. Technol. Ser. Transp. 2020, 109, 33–43. [Google Scholar] [CrossRef]
- Chaudhry, B.; Yasar, A.-U.-H.; El-Amine, S.; Shakshuki, E. Passenger safety in ride-sharing services. Procedia Comput. Sci. 2018, 130, 1044–1050. [Google Scholar] [CrossRef]
- Lee, M.; Choi, H.S.; Lee, H. Dark side of the sharing economy: Empirical study on the effect of car-sharing on the crashes of teenage drivers. In Proceedings of the AMCIS 2019 Proceedings, Virtual Communities and collaboration(VCC), Cancún, Mexico, 15–17 August 2019; Available online: https://aisel.aisnet.org/amcis2019/virtual_communities/virtual_communities/7/ (accessed on 20 January 2022).
- Park, S.-H.; Kim, J.-H.; Jun, M.-S. A Design of secure authentication method with bio-information in the car sharing environment. Adv. Comput. Sci. Ubiquitous Comput. 2016, 421, 205–210. [Google Scholar]
- Jing, C.; Zhi, J.; Yang, S.; Wang, W. Impact of driver age and experience in software usage on driving safety and usability of car-sharing software. J. Adv. Transp. 2021, 2021, 6633379. [Google Scholar] [CrossRef]
- Sharma, R.K.; Kumar, D.; Kumar, P. Systematic failure mode effect analysis (FMEA) using fuzzy linguistic modelling. Int. J. Qual. Reliab. Manag. 2005, 22, 986–1004. [Google Scholar] [CrossRef]
- Brzeziński, M.; Kijek, M.; Owczarek, P.; Głodowska, K.; Zelkowski, J.; Bartosiak, P. Aspects of improvement in exploitation process of passenger means of transport. J. Adv. Transp. 2018, 2018, 5062165. [Google Scholar] [CrossRef] [Green Version]
- Maryani, E.; Purba, H.H. Sunadi Analysis of aluminium alloy wheels product quality improvement through DMAIC method in casting process: A case study of the wheel manufacturing industry in Indonesia. J. Eur. Syst. Autom. 2021, 54, 55–62. [Google Scholar] [CrossRef]
- Ma, H.; Chu, X.; Li, Y. An integrated approach to identify function components for product redesign based on analysis of customer requirements and failure risk. J. Intell. Fuzzy Syst. 2019, 36, 1743–1757. [Google Scholar] [CrossRef]
- Valinejad, F.; Rahmani, D. Sustainability risk management in the supply chain of telecommunication companies: A case study. J. Clean. Prod. 2018, 203, 53–67. [Google Scholar] [CrossRef]
- Wang, Y.-M.; Chin, K.-S.; Poon, G.K.K.; Yang, J.-B. Risk evaluation in failure mode and effects analysis using fuzzy weighted geometric mean. Expert Syst. Appl. 2009, 36, 1195–1207. [Google Scholar] [CrossRef]
- Suo, B.; Zhao, L.; Yan, Y. A novel Dempster-Shafer theory-based approach with weighted average for failure mode and effects analysis under uncertainty. J. Loss Prev. Process Ind. 2020, 65, 104145. [Google Scholar] [CrossRef]
- Tay, K.M.; Lim, C.P. Fuzzy FMEA with a guided rules reduction system for prioritization of failures. Int. J. Qual. Reliab. Manag. 2006, 23, 1047–1066. [Google Scholar] [CrossRef]
- Liu, H.-C.; Liu, L.; Liu, N. Risk evaluation approaches in failure mode and effects analysis: A literature review. Expert Syst. Appl. 2013, 40, 828–838. [Google Scholar] [CrossRef]
- Peng, H.-M.; Wang, X.-K.; Wang, T.-L.; Liu, Y.-H.; Wang, J.-Q. Extended failure mode and effect analysis approach based on hesitant fuzzy linguistic Z-numbers for risk prioritisation of nuclear power equipment failures. J. Intell. Fuzzy Syst. 2021, 40, 10489–10505. [Google Scholar] [CrossRef]
- Efe, B. Analysis of operational safety risks in shipbuilding using failure mode and effect analysis approach. Ocean Eng. 2019, 187, 1–8. [Google Scholar] [CrossRef]
- Lo, H.-W.; Shiue, W.; Liou, J.J.H.; Tzeng, G.-H. A hybrid MCDM-based FMEA model for identification of critical failure modes in manufacturing. Soft Comput. 2020, 24, 15733–15745. [Google Scholar] [CrossRef]
- Luqman, A.; Akram, M.; Alcantud, J.C.R. Digraph and matrix approach for risk evaluations under Pythagorean fuzzy information. Expert Syst. Appl. 2021, 170, 114518. [Google Scholar] [CrossRef]
- Liu, Z.; Wang, X.; Sun, N.; Li, L.; Wang, D.; Liu, P. FMEA using the normalized projection-based TODIM-PROMETHEE II model for blood transfusion. Int. J. Fuzzy Syst. 2021, 23, 1680–1696. [Google Scholar] [CrossRef]
- Tversky, A.; Kahneman, D. Rational Choice and the Framing of Decisions. Mult. Criteria Decis. Mak. Risk Anal. Using Microcomput. 1989, 59, 81–126. [Google Scholar] [CrossRef]
- Wu, Z.; Liu, W.; Nie, W. Literature review and prospect of the development and application of FMEA in manufacturing industry. Int. J. Adv. Manuf. Technol. 2021, 112, 1409–1436. [Google Scholar] [CrossRef]
- Kano, N.; Seraku, N.; Takahashi, F. Attractive quality and must-be quality. J. Jpn. Soc. Qual. Control 1984, 14, 39–48. [Google Scholar]
- Herzberg, F. The Motivation to Work; John Wiley and Sons: New York, NY, USA, 1959. [Google Scholar]
- Liang, S.W.; Lu, H.P.; Kuo, T.K.A. Study on using the kano two-dimensional quality model to evaluate the service quality of government websites. J. Internet. Technol. 2014, 15, 149–162. [Google Scholar] [CrossRef]
- Matzler, K.; Hinterhuber, H.H.; Bailom, F.; Sauerwein, E. How to delight your customers. J. Prod. Brand Manag. 1996, 5, 6–18. [Google Scholar] [CrossRef]
- Chung, J.-C.; Huang, Y.-F.; Weng, M.-W.; Lin, J.-C. The Sustainable Innovation Design in Catering Service. Sustainability 2021, 14, 278. [Google Scholar] [CrossRef]
- Hwangbo, Y.; Yang, Y.-S.; Kim, M.-S.; Kim, Y. The effectiveness of kano-QFD approach to enhance competitiveness of technology-based SMEs through transfer intention model. Sustainability 2020, 12, 7885. [Google Scholar] [CrossRef]
- Ying, C.-S.; Li, Y.-L.; Chin, K.-S.; Yang, H.-T.; Xu, J. A new product development concept selection approach based on cumulative prospect theory and hybrid-information MADM. Comput. Ind. Eng. 2018, 122, 251–261. [Google Scholar] [CrossRef]
- Wu, Z.; Xu, J. Possibility Distribution-Based Approach for MAGDM with Hesitant Fuzzy Linguistic Information. IEEE Trans. Cybern. 2016, 46, 694–705. [Google Scholar] [CrossRef] [PubMed]
- Li, Y.-L.; Wang, R.; Chin, K.-S. New failure mode and effect analysis approach considering consensus under interval-valued intuitionistic fuzzy environment. Soft Comput. 2019, 23, 11611–11626. [Google Scholar] [CrossRef]
- Tzeng, G.-H.; Huang, J.-J. Multiple Attribute Decision Making: Methods and Applications; Springer: Berlin/Heidelberg, Germany, 1981. [Google Scholar] [CrossRef]
- Shannon, C.E. A Mathematical theory of communication. Bell Syst. Tech. J. 1948, 27, 379–423. [Google Scholar] [CrossRef] [Green Version]
- Liao, M.-S.; Liang, G.-S.; Chen, C.-Y. Fuzzy grey relation method for multiple criteria decision-making problems. Qual. Quant. 2012, 47, 3065–3077. [Google Scholar] [CrossRef]
- Macharis, C.; Springael, J.; De Brucker, K.; Verbeke, A. PROMETHEE and AHP: The design of operational synergies in multicriteria analysis: Strengthening PROMETHEE with ideas of AHP. Eur. J. Oper. Res. 2004, 153, 307–317. [Google Scholar] [CrossRef]
- Mareschal, B.; Brans, J.P.; Vincke, P. Promethee: A New Family of Outranking Methods in Multicriteria Analysis; ULB Institutional Repository 2013/9305; ULB-Universite Libre de Bruxelles: Washington DC, USA, 1984; Available online: https://EconPapers.repec.org/RePEc:ulb:ulbeco:2013/9305 (accessed on 20 January 2022).
- Angilella, S.; Pappalardo, M.R. Assessment of a failure prediction model in the European energy sector: A multicriteria discrimination approach with a PROMETHEE based classification. Expert Syst. Appl. 2021, 184, 115513. [Google Scholar] [CrossRef]
- Kahneman, D.; Tversky, A. Prospect theory: An analysis of decision under risk. Econometrica 1979, 47, 263–291. [Google Scholar] [CrossRef] [Green Version]
- Tversky, A.; Kahneman, D. Advances in prospect theory-Cumulative representation of uncertainty. J. Risk Uncertain. 1992, 5, 297–323. [Google Scholar] [CrossRef]
- Berger, C.; Blauth, R.; Berger, D. Kano’s methods for understanding customer-defined quality. Cent. Qual. Manag. J. 1993, 4, 3–36. [Google Scholar]
- Zhang, H.; Dong, Y.; Xiao, J.; Chiclana, F.; Herrera-Viedma, E. Consensus and opinion evolution-based failure mode and effect analysis approach for reliability management in social network and uncertainty contexts. Reliab. Eng. Syst. Safe. 2021, 208, 107425. [Google Scholar] [CrossRef]
- Baidu Tieba, China. 2021. Available online: https://tieba.baidu.com/f?kw=%E5%85%B1%E4%BA%AB%E6%B1%BD%E8%BD%A6&ie=utf-8&pn=0 (accessed on 1 September 2021).
- Autohome Website, China. 2021. Available online: https://sou.autohome.com.cn/zonghe?q=%B9%B2%CF%ED%B5%E7%B6%AF%C6%FB%B3%B5&mq=&pvareaid=3311224 (accessed on 1 September 2021).
- Sthapit, E.; Björk, P. Sources of value co-destruction: Uber customer perspectives. Tour. Rev. 2019, 74, 780–794. [Google Scholar] [CrossRef] [Green Version]
- Wu, X.; Liao, H. Customer-oriented product and service design by a novel quality function deployment framework with complex linguistic evaluations. Inf. Process. Manage. 2021, 58, 1–18. [Google Scholar] [CrossRef]
- Kumar, M.S.; Revankar, S.T. Development scheme and key technology of an electric vehicle: An overview. Renew. Sust. Energ. Rev. 2017, 70, 1266–1285. [Google Scholar] [CrossRef]
- Solangi, Y.A.; Longsheng, C.; Shah, S.A.A. Assessing and overcoming the renewable energy barriers for sustainable development in Pakistan: An integrated AHP and fuzzy TOPSIS approach. Renew. Energy 2021, 173, 209–222. [Google Scholar] [CrossRef]
- Prakash, C.; Barua, M.K. A combined MCDM approach for evaluation and selection of third-party reverse logistics partner for Indian electronics industry. Sustain. Prod. Consump. 2016, 7, 66–78. [Google Scholar] [CrossRef]
- Ghorabaee, M.K.; Zavadskas, E.K.; Turskis, Z.; Antucheviciene, J. A new combinative distance-based assessment (CODAS) method for multi-criteria decision making. Econ. Comput. Econ. Cybern. Stud. 2016, 50, 25–44. Available online: https://ftp://www.ipe.ro/RePEc/cys/ecocyb_pdf/ecocyb3_2016p25-44.pdf (accessed on 20 January 2022).


| Author | Research Topic | Research Content and Finding |
|---|---|---|
| Choi [20] | Relationship analysis of car sharing and car accidents | It analyzed the relationship between car sharing and accidents in urban and proved a positively correlation. Based on the findings, security services and measures were recommended as necessary. |
| Lee [24] | System design of electric car sharing with mobile technology | It designed an electric car sharing system from user perspective and presented necessary infrastructures of the system. |
| Arena [25] | Service design of EV sharing from consumer perspective | It studied service design for different types of EV sharing in hope of promoting the development of EV sharing. |
| He [26] | Service design of free-floating EV sharing from CSC perspective | It studied the service design problem for free-floating EV sharing systems and built a model including repositioning, recharging and fleet size determination to guarantee the service level. |
| Symeonidis [27] | Security and privacy assessment of P2P key-less car sharing system | It assessed security and privacy issues in P2P key-less car sharing system and provided a guide for secure system design. |
| Hanusik [28] | Identification and risk assessment in ICE car sharing | It identified and evaluated fourteen risks in car sharing from the operator’s perspective, and put forward management suggestions. |
| Chaudhry [29] | Passenger safety in ride-sharing mode | It analyzed the risks in ride-sharing mode and put forward suggestions to resist risks through security service optimization. |
| Lee [30] | Effect of car sharing on the crashes of teenage drivers | It discussed the safety and security issues of car sharing platforms and verified the correlation between the number of teenage drivers in sharing and the number of car crashes of teenage drivers. |
| Park [31] | Design of secure authentication method with bio-information | It designed a security service solution that using fingerprint information to unlock vehicles while preventing information leaks. |
| Jing [32] | Safety analysis of using car sharing software while driving | It studied the impact of driver age and experiences in software usage on driving safety, and proved that car sharing software has a significant negative impact on driving distraction and usability. |
| Linguistic Variable | Triangle Fuzzy Number |
|---|---|
| EL (Extremely Low) | (0.0000, 0.0000, 0.1250) |
| VL (Very Low) | (0.0000, 0.1250, 0.2500) |
| L (Low) | (0.1250, 0.2500, 0.3750) |
| SL (Slightly Low) | (0.2500, 0.3750, 0.5000) |
| F (Fair) | (0.3750, 0.5000, 0.6250) |
| SH (Slightly High) | (0.5000, 0.6250, 0.7500) |
| H (High) | (0.6250, 0.7500, 0.8750) |
| VH (Very High) | (0.7500, 0.8750, 1.0000) |
| EH (Extremely High) | (0.8750, 1.0000, 1.0000) |
| Expert Mutual Evaluation | Evaluated | ||||
|---|---|---|---|---|---|
| E1 | E2 | E3 | E4 | ||
| Evaluator | E1 | F | SH | VH | H |
| E2 | H | F | H | H | |
| E3 | H | SH | F | SH | |
| E4 | F | SH | SH | F | |
| Stages | Essential and Reliable Services | Service Failure Modes | Codes | |
|---|---|---|---|---|
| Registration stage | Effective information protection | Information abuse | FM1 | |
| Fair agreement service | Agreement trap | FM2 | ||
| Use stage | Starting part | Provide reliable quality EVs | Provide defective EVs | FM3 |
| Professional maintenance services | Careless maintenance | FM4 | ||
| Safe and convenient charging service | Unreliable charging service | FM5 | ||
| Clear identification of responsibility | Unclear identification of liability | FM6 | ||
| Driving part | Professional security identification | Lack of security identification | FM7 | |
| Reasonable and transparent charges | Unreasonable charges | FM8 | ||
| Sufficient safety equipment | Inadequate safety equipment | FM9 | ||
| Complete and adequate insurance | Inadequate vehicle insurance | FM10 | ||
| Stopping part | Convenient and safe parking service | Troubled parking | FM11 | |
| Timely and comprehensive safety alerts | Imperfect security alerts | FM12 | ||
| Convenient handling of violations | Complexity in handling violation | FM13 | ||
| Account cancellation stage | Quick and convenient deposit refund | Troubled in refunding deposit | FM14 | |
| Impartial dispute resolution service | Unfair treatment in dispute | FM15 | ||
| Real-time quality customer service | Poor customer service | FM16 | ||
| Linguistic Variables | Description of Grading Criteria |
|---|---|
| EL | Rarely needed and rarely problematic; seldom or never problematic services. |
| VL | Rarely needed and occasionally problematic; occasionally needed and rarely problematic. |
| L | Rarely needed and often problematic; occasionally needed and occasionally problematic. |
| SL | Rarely needed and not provided/always problematic; occasionally needed and often problematic. |
| F | Occasionally needed and not provided/always problematic; widely needed and rarely problematic. |
| SH | Widely needed and occasionally problematic; always needed and rarely problematic. |
| H | Widely needed and often problematic; always needed and occasionally problematic. |
| VH | Widely needed and always problematic/not provided; always needed and often problematic. |
| EH | Always needed but not provided or always problematic. |
| Linguistic Variables | Description of Grading Criteria |
|---|---|
| EL | Consumers can usually dispose with ease by themselves without the service. |
| VL | Consumers can dispose at a small cost or passively suffer a negligible loss. |
| L | Consumers can dispose at a medium cost or passively suffer a small loss. |
| SL | Consumers can dispose at a big cost or passively suffer a medium loss. |
| F | Consumers can dispose at a high cost; or passively suffer a noticeable loss. |
| SH | Consumers cannot dispose, passively suffer a high loss, or low accident possibility. |
| H | High accident probability, unpredictable loss, or endless troubles. |
| VH | Endangers the personal safety of consumers or may be widely transmitted. |
| EH | Endangers the safety of consumers and others and may cause great social impact. |
| Linguistic Variables | Description of Grading Criteria |
|---|---|
| EL | Service failures that consumers can intuitively detect and rarely ignore. |
| VL | Consumers can intuitively detect but occasionally ignore. |
| L | Consumers can intuitively detect but usually ignore. |
| SL | Consumers can intuitively detect but do not realize it until too late. |
| F | Consumers need to be very careful to detect and most ones will ignore it. |
| SH | Consumers need to be very careful to detect and rarely arouses suspicion. |
| H | Consumers cannot detect unless they have the expertise or plenty of patience and time. |
| VH | Consumers cannot detect and need to be certified by professional organizations. |
| EH | Professional organizations cannot easily identify or costs consumers more than the loss. |
| Risk Factor | Occurrence | Severity | Detection | Consensus Inspection | |||||||||
|---|---|---|---|---|---|---|---|---|---|---|---|---|---|
| Expert | E1 | E2 | E3 | E4 | E1 | E2 | E3 | E4 | E1 | E2 | E3 | E4 | Coefficient |
| FM1 | F | SH | SH | F | L | VL | L | F | SL | SL | F | L | 0.8681 |
| FM2 | L | VL | VL | L | F | SH | SL | F | SL | SL | L | F | 0.8889 |
| FM3 | SL | F | F | SH | SH | H | VH | EH | H | F | SH | SH | 0.8524 |
| FM4 | SL | F | F | SH | H | EH | H | SH | SH | H | H | SH | 0.8738 |
| FM5 | VL | L | L | VL | SH | F | SH | H | F | SL | SL | F | 0.9028 |
| FM6 | L | F | SL | F | H | F | F | H | EL | VL | L | EL | 0.8535 |
| FM7 | F | SL | SL | F | VH | H | H | SH | L | SL | SL | SL | 0.9097 |
| FM8 | SL | F | SL | F | F | SH | F | SL | L | VL | VL | L | 0.9028 |
| FM9 | SL | VL | L | SL | H | SH | SH | H | SL | F | SL | SH | 0.8750 |
| FM10 | SL | L | L | SL | SH | SH | F | H | SL | F | F | SH | 0.8889 |
| FM11 | SH | VH | H | SH | F | SL | L | SL | EL | VL | VL | EL | 0.8870 |
| FM12 | SL | L | SL | F | SL | SH | L | L | L | SL | L | L | 0.8681 |
| FM13 | SH | H | SH | H | L | SL | L | L | L | EL | VL | VL | 0.9141 |
| FM14 | H | SH | SH | F | H | F | SH | SH | L | L | SL | VL | 0.8750 |
| FM15 | F | SL | L | SL | SH | H | SH | VH | L | SL | VL | VL | 0.8611 |
| FM16 | F | SL | SH | SH | F | SL | F | SL | SL | VL | L | SL | 0.8750 |
| FMs | Occurrence | Severity | Detection | |||
|---|---|---|---|---|---|---|
| Integrated Fuzzy Value | Ranks | Integrated Fuzzy Value | Ranks | Integrated Fuzzy Value | Ranks | |
| FM1 | (0.4532, 0.5782, 0.7032) | 4 | (0.1338, 0.2588, 0.3838) | 16 | (0.2567, 0.3817, 0.5067) | 6 |
| FM2 | (0.0468, 0.1718, 0.2968) | 16 | (0.3863, 0.5113, 0.6363) | 11 | (0.2433, 0.3683, 0.4933) | 7 |
| FM3 | (0.3817, 0.5067, 0.6317) | 6 | (0.6919, 0.8169, 0.9151) | 1 | (0.4754, 0.6004, 0.7254) | 2 |
| FM4 | (0.3817, 0.5067, 0.6317) | 6 | (0.6877, 0.8127, 0.8930) | 2 | (0.5782, 0.7032, 0.8282) | 1 |
| FM5 | (0.0782, 0.2032, 0.3282) | 15 | (0.4820, 0.6070, 0.7320) | 7 | (0.2968, 0.4218, 0.5468) | 5 |
| FM6 | (0.3014, 0.4264, 0.5514) | 9 | (0.4687, 0.5937, 0.7187) | 9 | (0.0335, 0.1116, 0.2366) | 14 |
| FM7 | (0.2968, 0.4218, 0.5468) | 10 | (0.6183, 0.7433, 0.8683) | 3 | (0.2299, 0.3549, 0.4799) | 8 |
| FM8 | (0.3215, 0.4465, 0.5715) | 8 | (0.3930, 0.5180, 0.6430) | 10 | (0.0468, 0.1718, 0.2968) | 13 |
| FM9 | (0.1271, 0.2521, 0.3771) | 14 | (0.5468, 0.6718, 0.7968) | 5 | (0.3482, 0.4732, 0.5982) | 4 |
| FM10 | (0.1718, 0.2968, 0.4218) | 13 | (0.4933, 0.6183, 0.7433) | 6 | (0.3817, 0.5067, 0.6317) | 3 |
| FM11 | (0.6229, 0.7479, 0.8729) | 1 | (0.2366, 0.3616, 0.4866) | 14 | (0.0000, 0.0782, 0.2032) | 16 |
| FM12 | (0.2320, 0.3570, 0.4820) | 12 | (0.2792, 0.4042, 0.5292) | 13 | (0.1697, 0.2947, 0.4197) | 9 |
| FM13 | (0.5715, 0.6965, 0.8215) | 2 | (0.1697, 0.2947, 0.4197) | 15 | (0.0201, 0.1004, 0.2254) | 15 |
| FM14 | (0.4933, 0.6183, 0.7433) | 3 | (0.4754, 0.6004, 0.7254) | 8 | (0.1317, 0.2567, 0.3817) | 10 |
| FM15 | (0.2366, 0.3616, 0.4866) | 11 | (0.5982, 0.7232, 0.8482) | 4 | (0.1095, 0.2345, 0.3595) | 12 |
| FM16 | (0.3905, 0.5155, 0.6405) | 5 | (0.3035, 0.4285, 0.5535) | 12 | (0.1271, 0.2521, 0.3771) | 11 |
| Corresponding Demand Type | Backward Questions | |||||
|---|---|---|---|---|---|---|
| I like It | It Should Be | It Doesn’t Matter | I Can Stand It | I Don’t Like It | ||
| Forward questions | I like it | Q | A | A | A | O |
| It should be | R | I | I | I | M | |
| It doesn’t matter | R | I | I | I | M | |
| I can stand it | R | I | I | I | M | |
| I do not like it | R | R | R | R | Q | |
| Kano | A | M | O | I | Q | R | Type |
|---|---|---|---|---|---|---|---|
| FM1 | 5 | 173 | 103 | 25 | 31 | 3 | M |
| FM2 | 6 | 159 | 108 | 22 | 42 | 3 | M |
| FM3 | 3 | 156 | 143 | 14 | 20 | 4 | M |
| FM4 | 11 | 121 | 188 | 16 | 4 | 0 | O |
| FM5 | 11 | 94 | 207 | 16 | 9 | 3 | O |
| FM6 | 7 | 134 | 162 | 16 | 16 | 5 | O |
| FM7 | 68 | 66 | 139 | 41 | 22 | 4 | O |
| FM8 | 6 | 157 | 148 | 19 | 10 | 0 | M |
| FM9 | 25 | 110 | 164 | 24 | 12 | 5 | O |
| FM10 | 28 | 92 | 182 | 29 | 6 | 3 | O |
| FM11 | 30 | 76 | 207 | 19 | 7 | 1 | O |
| FM12 | 44 | 66 | 184 | 28 | 15 | 3 | O |
| FM13 | 26 | 70 | 204 | 32 | 4 | 4 | O |
| FM14 | 12 | 98 | 207 | 11 | 9 | 3 | O |
| FM15 | 7 | 113 | 192 | 23 | 5 | 0 | O |
| FM16 | 15 | 103 | 200 | 14 | 3 | 5 | O |
Publisher’s Note: MDPI stays neutral with regard to jurisdictional claims in published maps and institutional affiliations. |
© 2022 by the authors. Licensee MDPI, Basel, Switzerland. This article is an open access article distributed under the terms and conditions of the Creative Commons Attribution (CC BY) license (https://creativecommons.org/licenses/by/4.0/).
Share and Cite
Zhang, D.; Li, Y.; Li, Y.; Shen, Z. Service Failure Risk Assessment and Service Improvement of Self-Service Electric Vehicle. Sustainability 2022, 14, 3723. https://doi.org/10.3390/su14073723
Zhang D, Li Y, Li Y, Shen Z. Service Failure Risk Assessment and Service Improvement of Self-Service Electric Vehicle. Sustainability. 2022; 14(7):3723. https://doi.org/10.3390/su14073723
Chicago/Turabian StyleZhang, Dianfeng, Yanlai Li, Yiqun Li, and Zifan Shen. 2022. "Service Failure Risk Assessment and Service Improvement of Self-Service Electric Vehicle" Sustainability 14, no. 7: 3723. https://doi.org/10.3390/su14073723
APA StyleZhang, D., Li, Y., Li, Y., & Shen, Z. (2022). Service Failure Risk Assessment and Service Improvement of Self-Service Electric Vehicle. Sustainability, 14(7), 3723. https://doi.org/10.3390/su14073723