
Stock Assessment of Four Dominant Shark Bycatch Species in Bottom Trawl Fisheries in the Northern South China Sea


Abstract
:1. Introduction
2. Materials and Methods
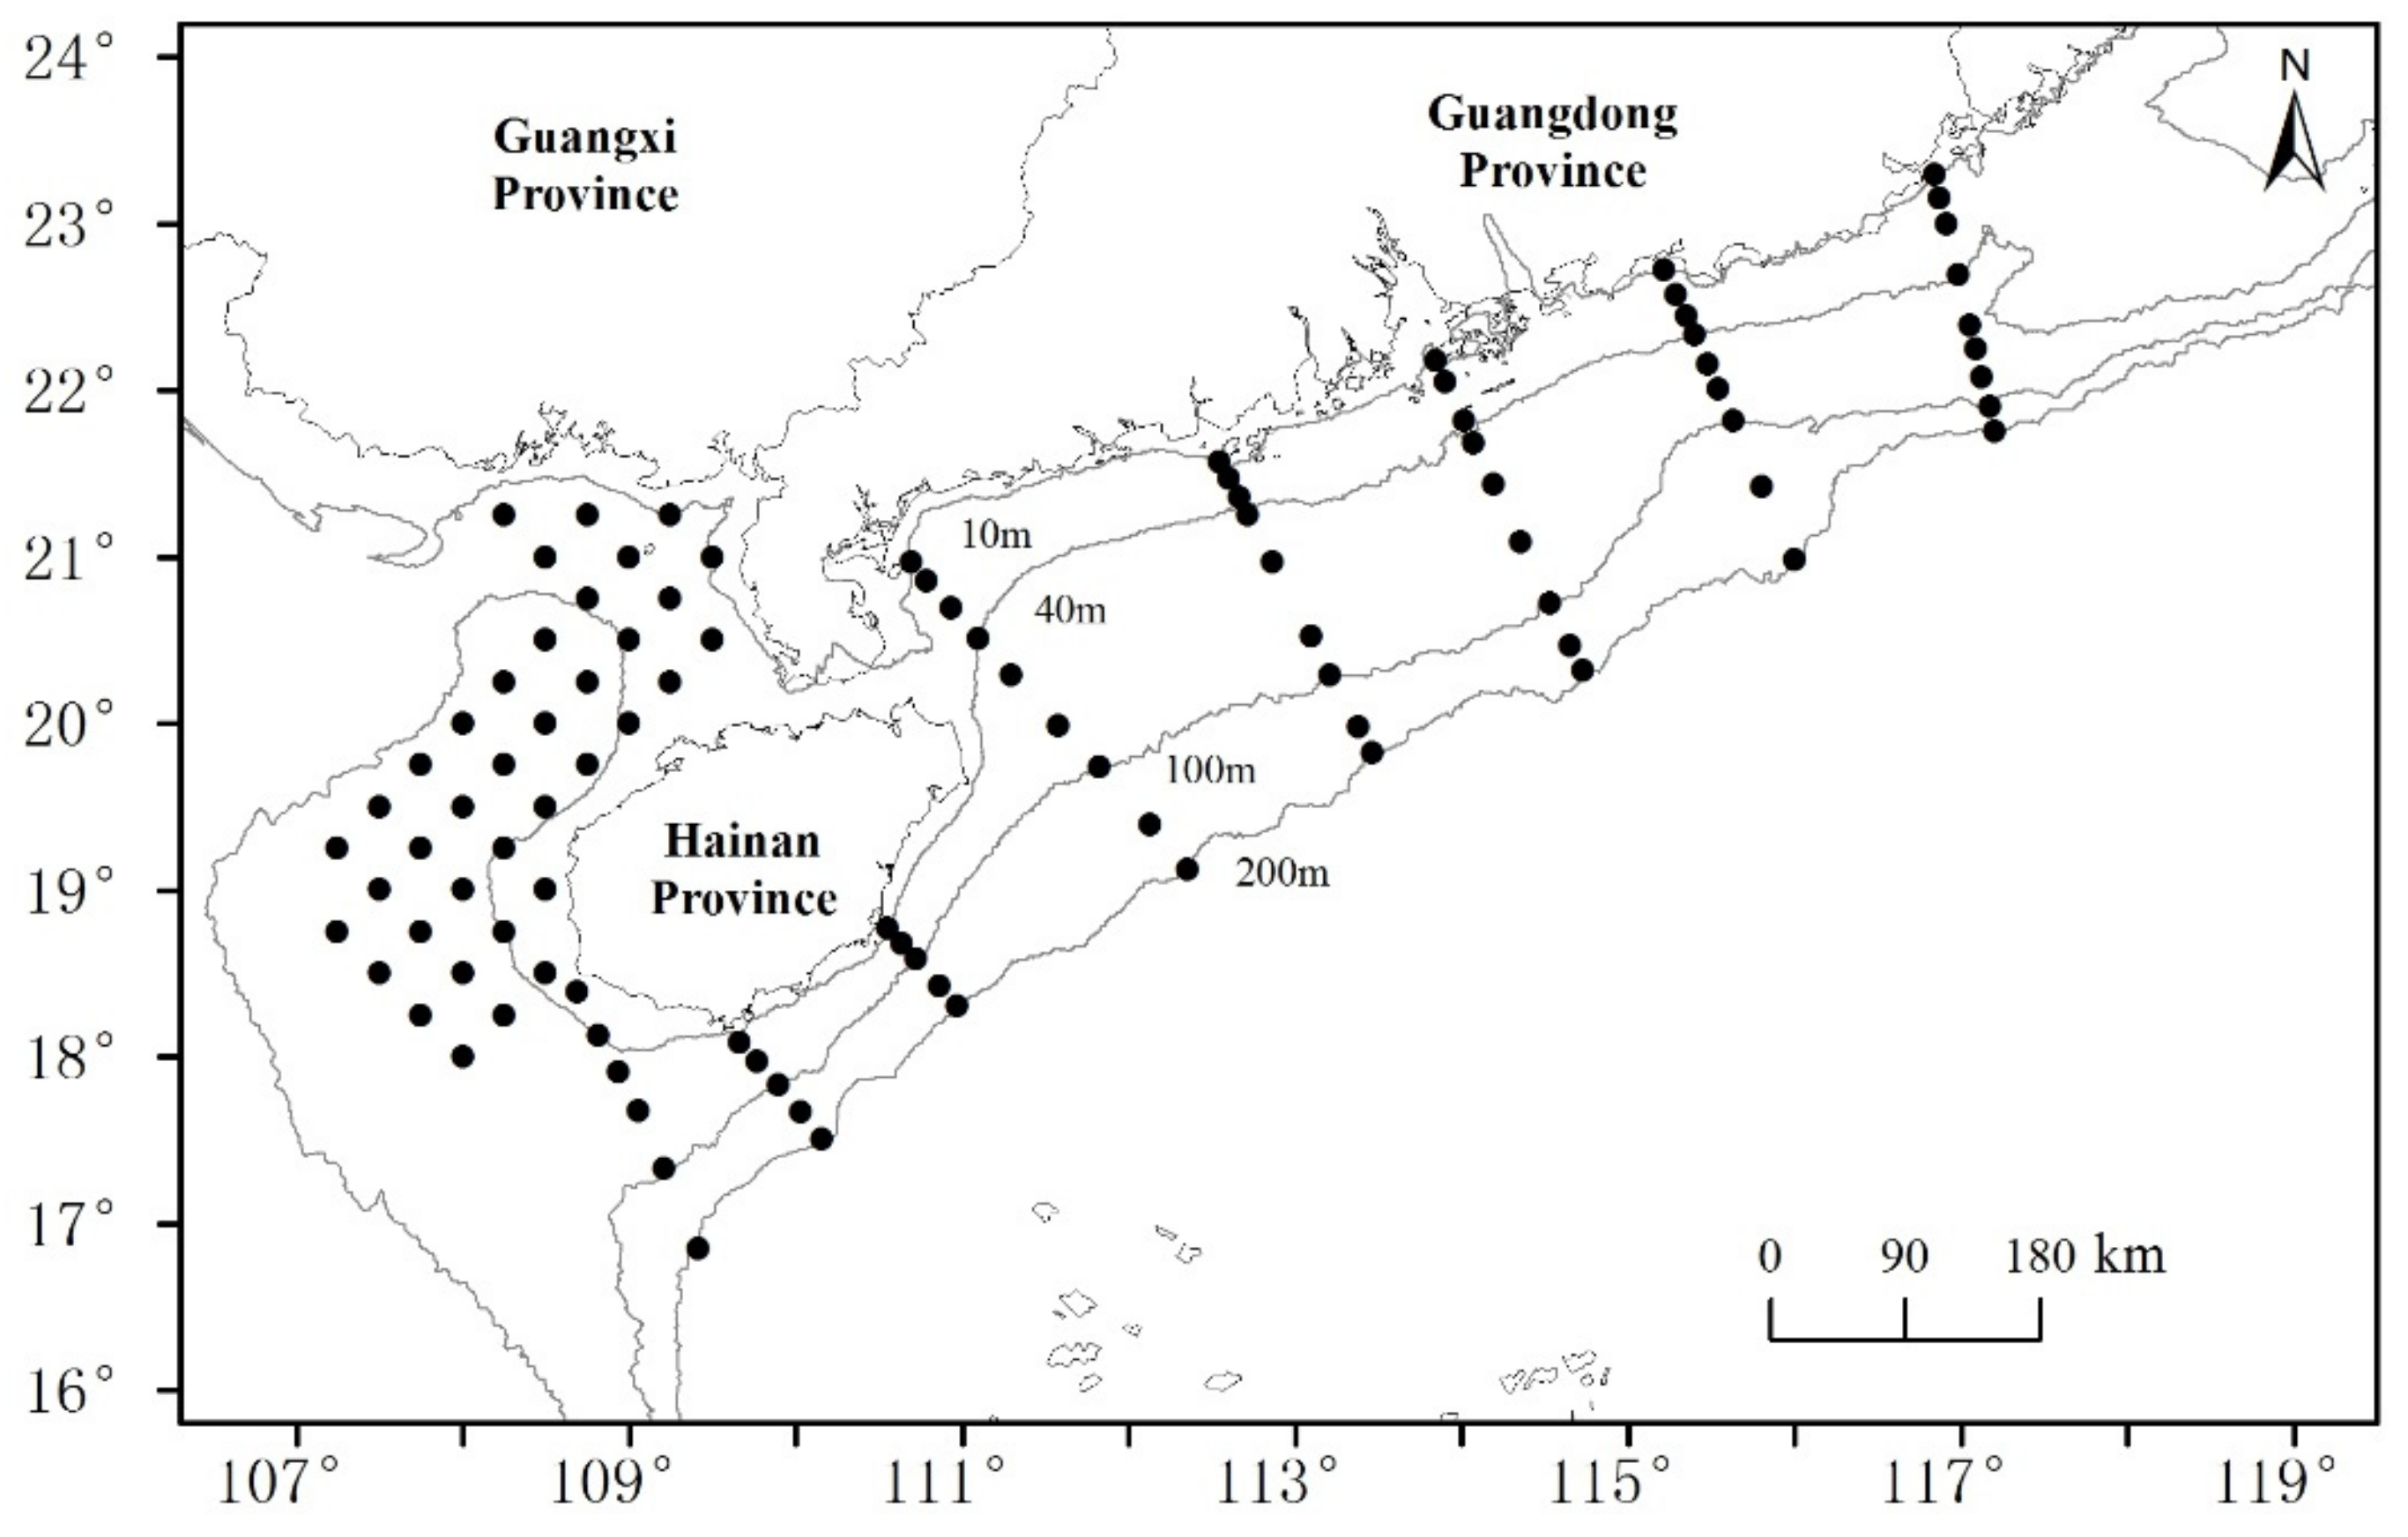
2.1. Data Resource
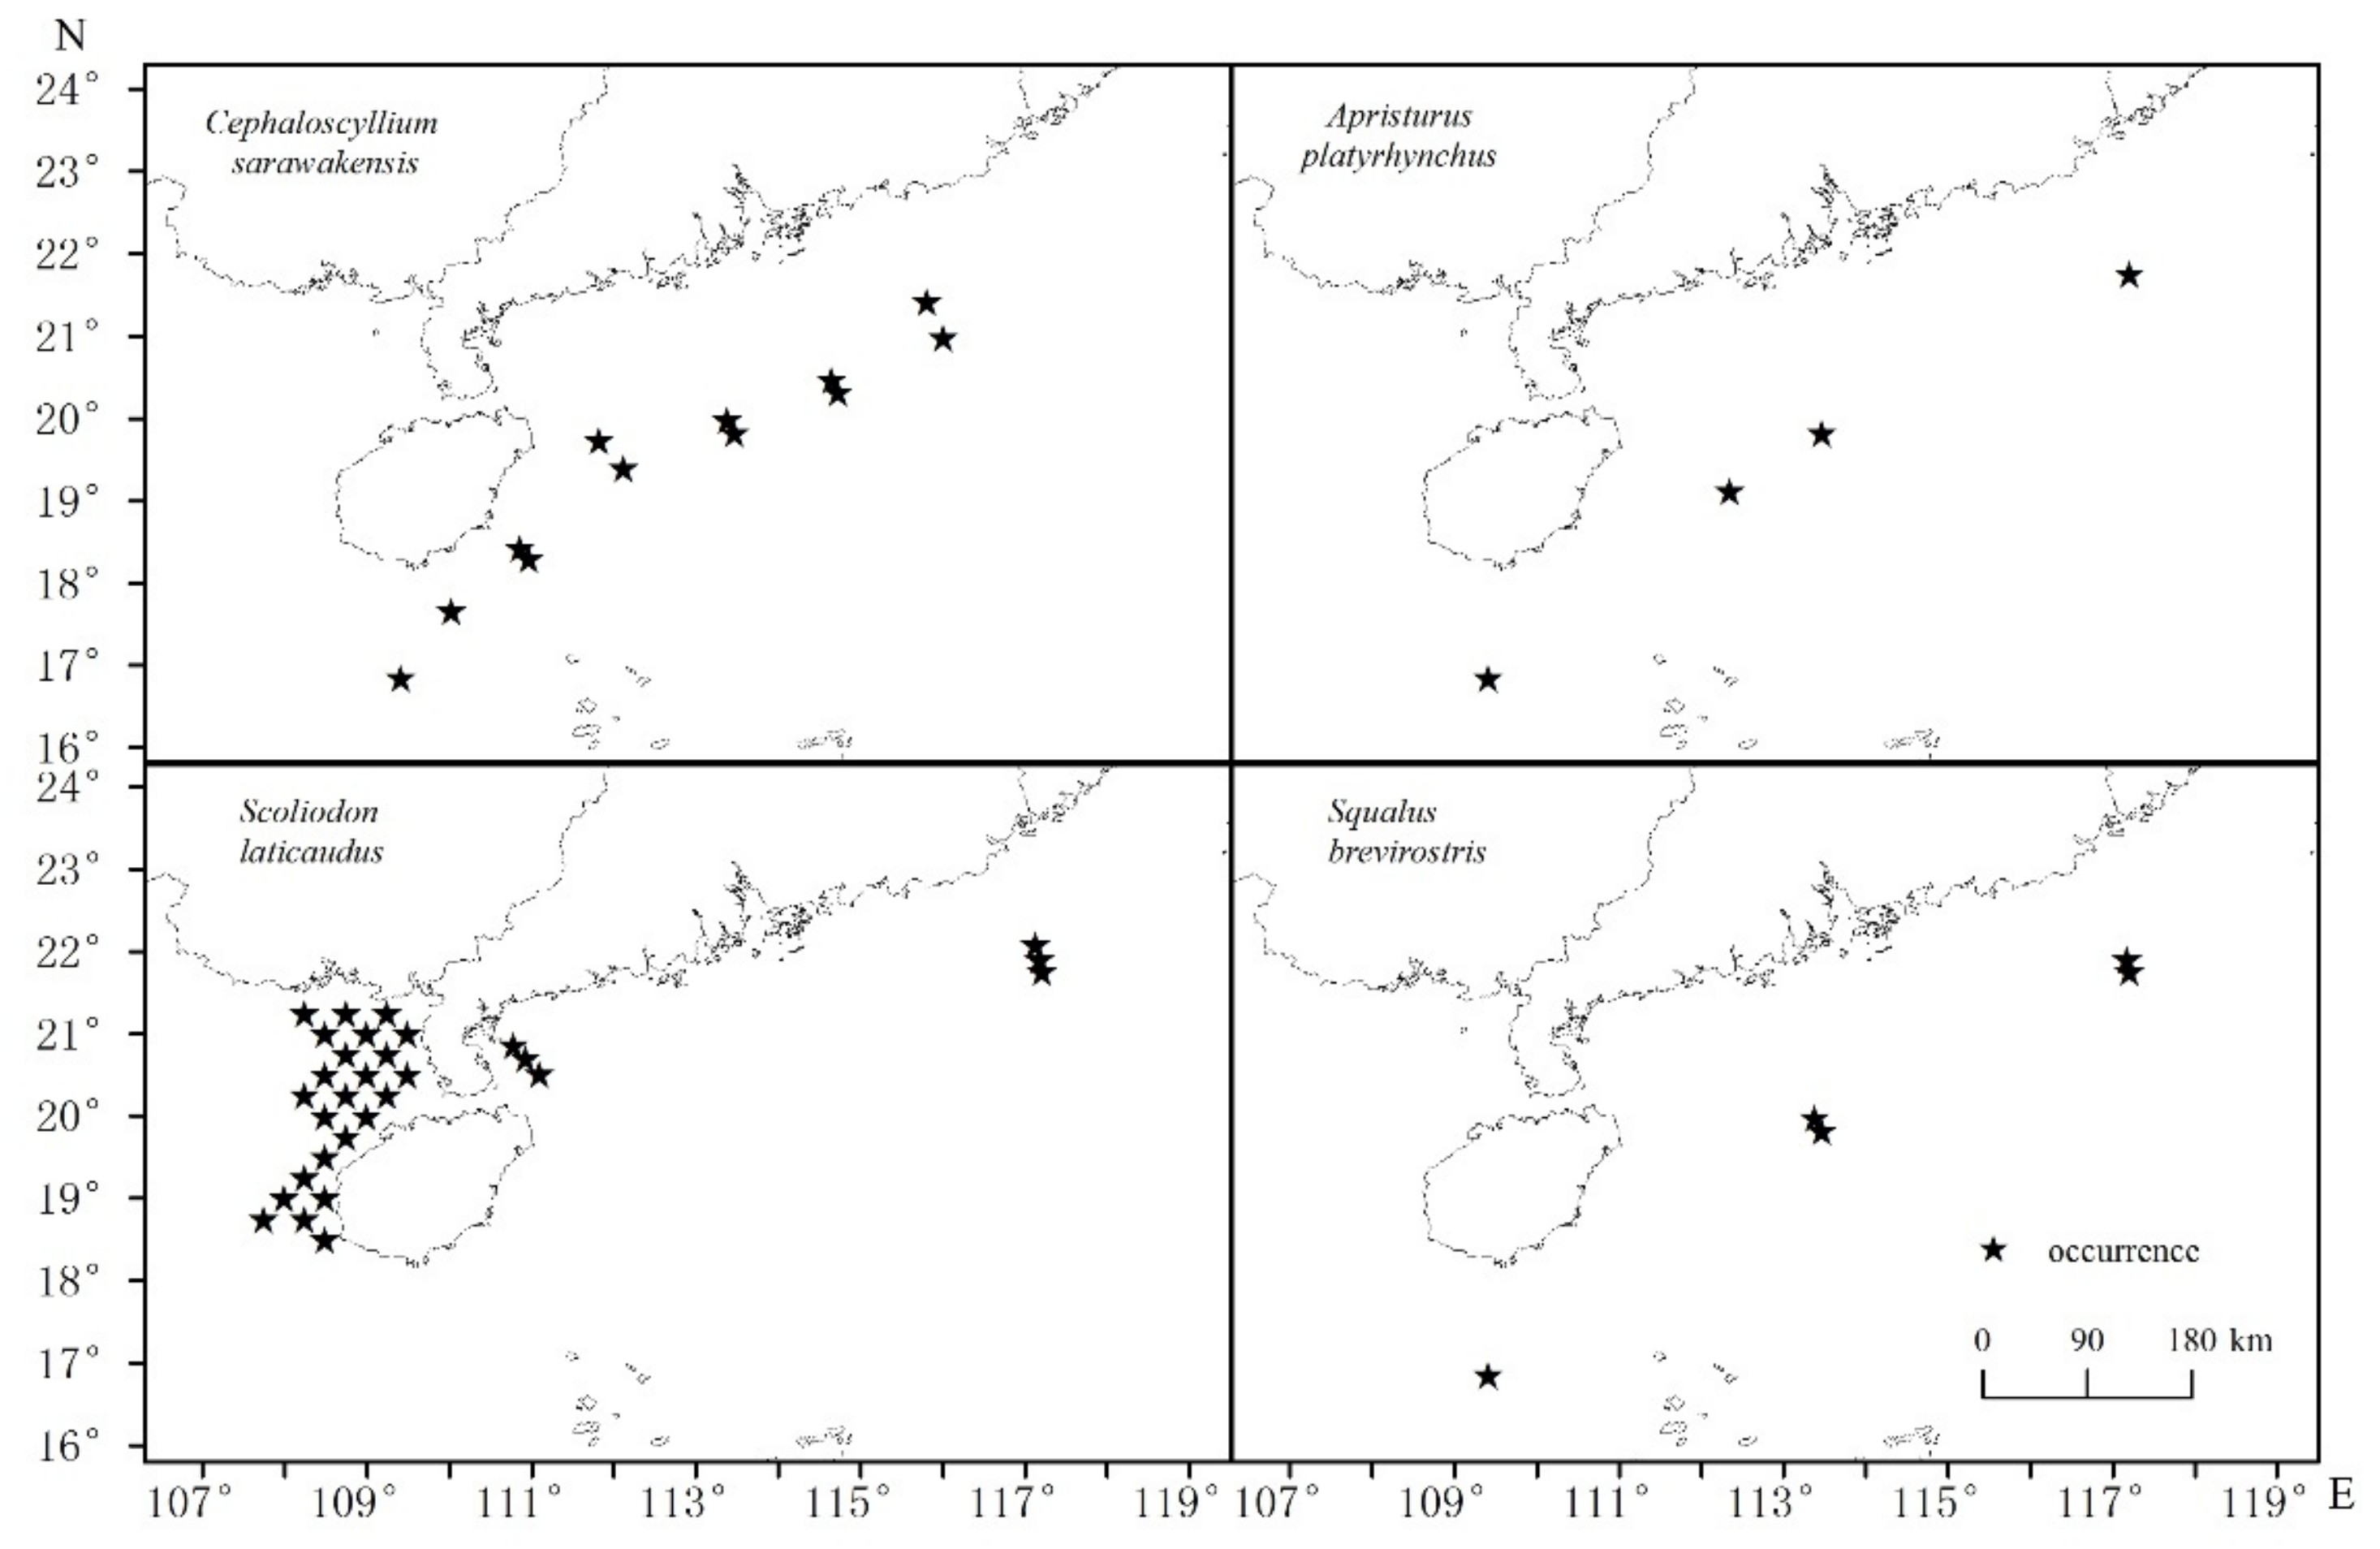
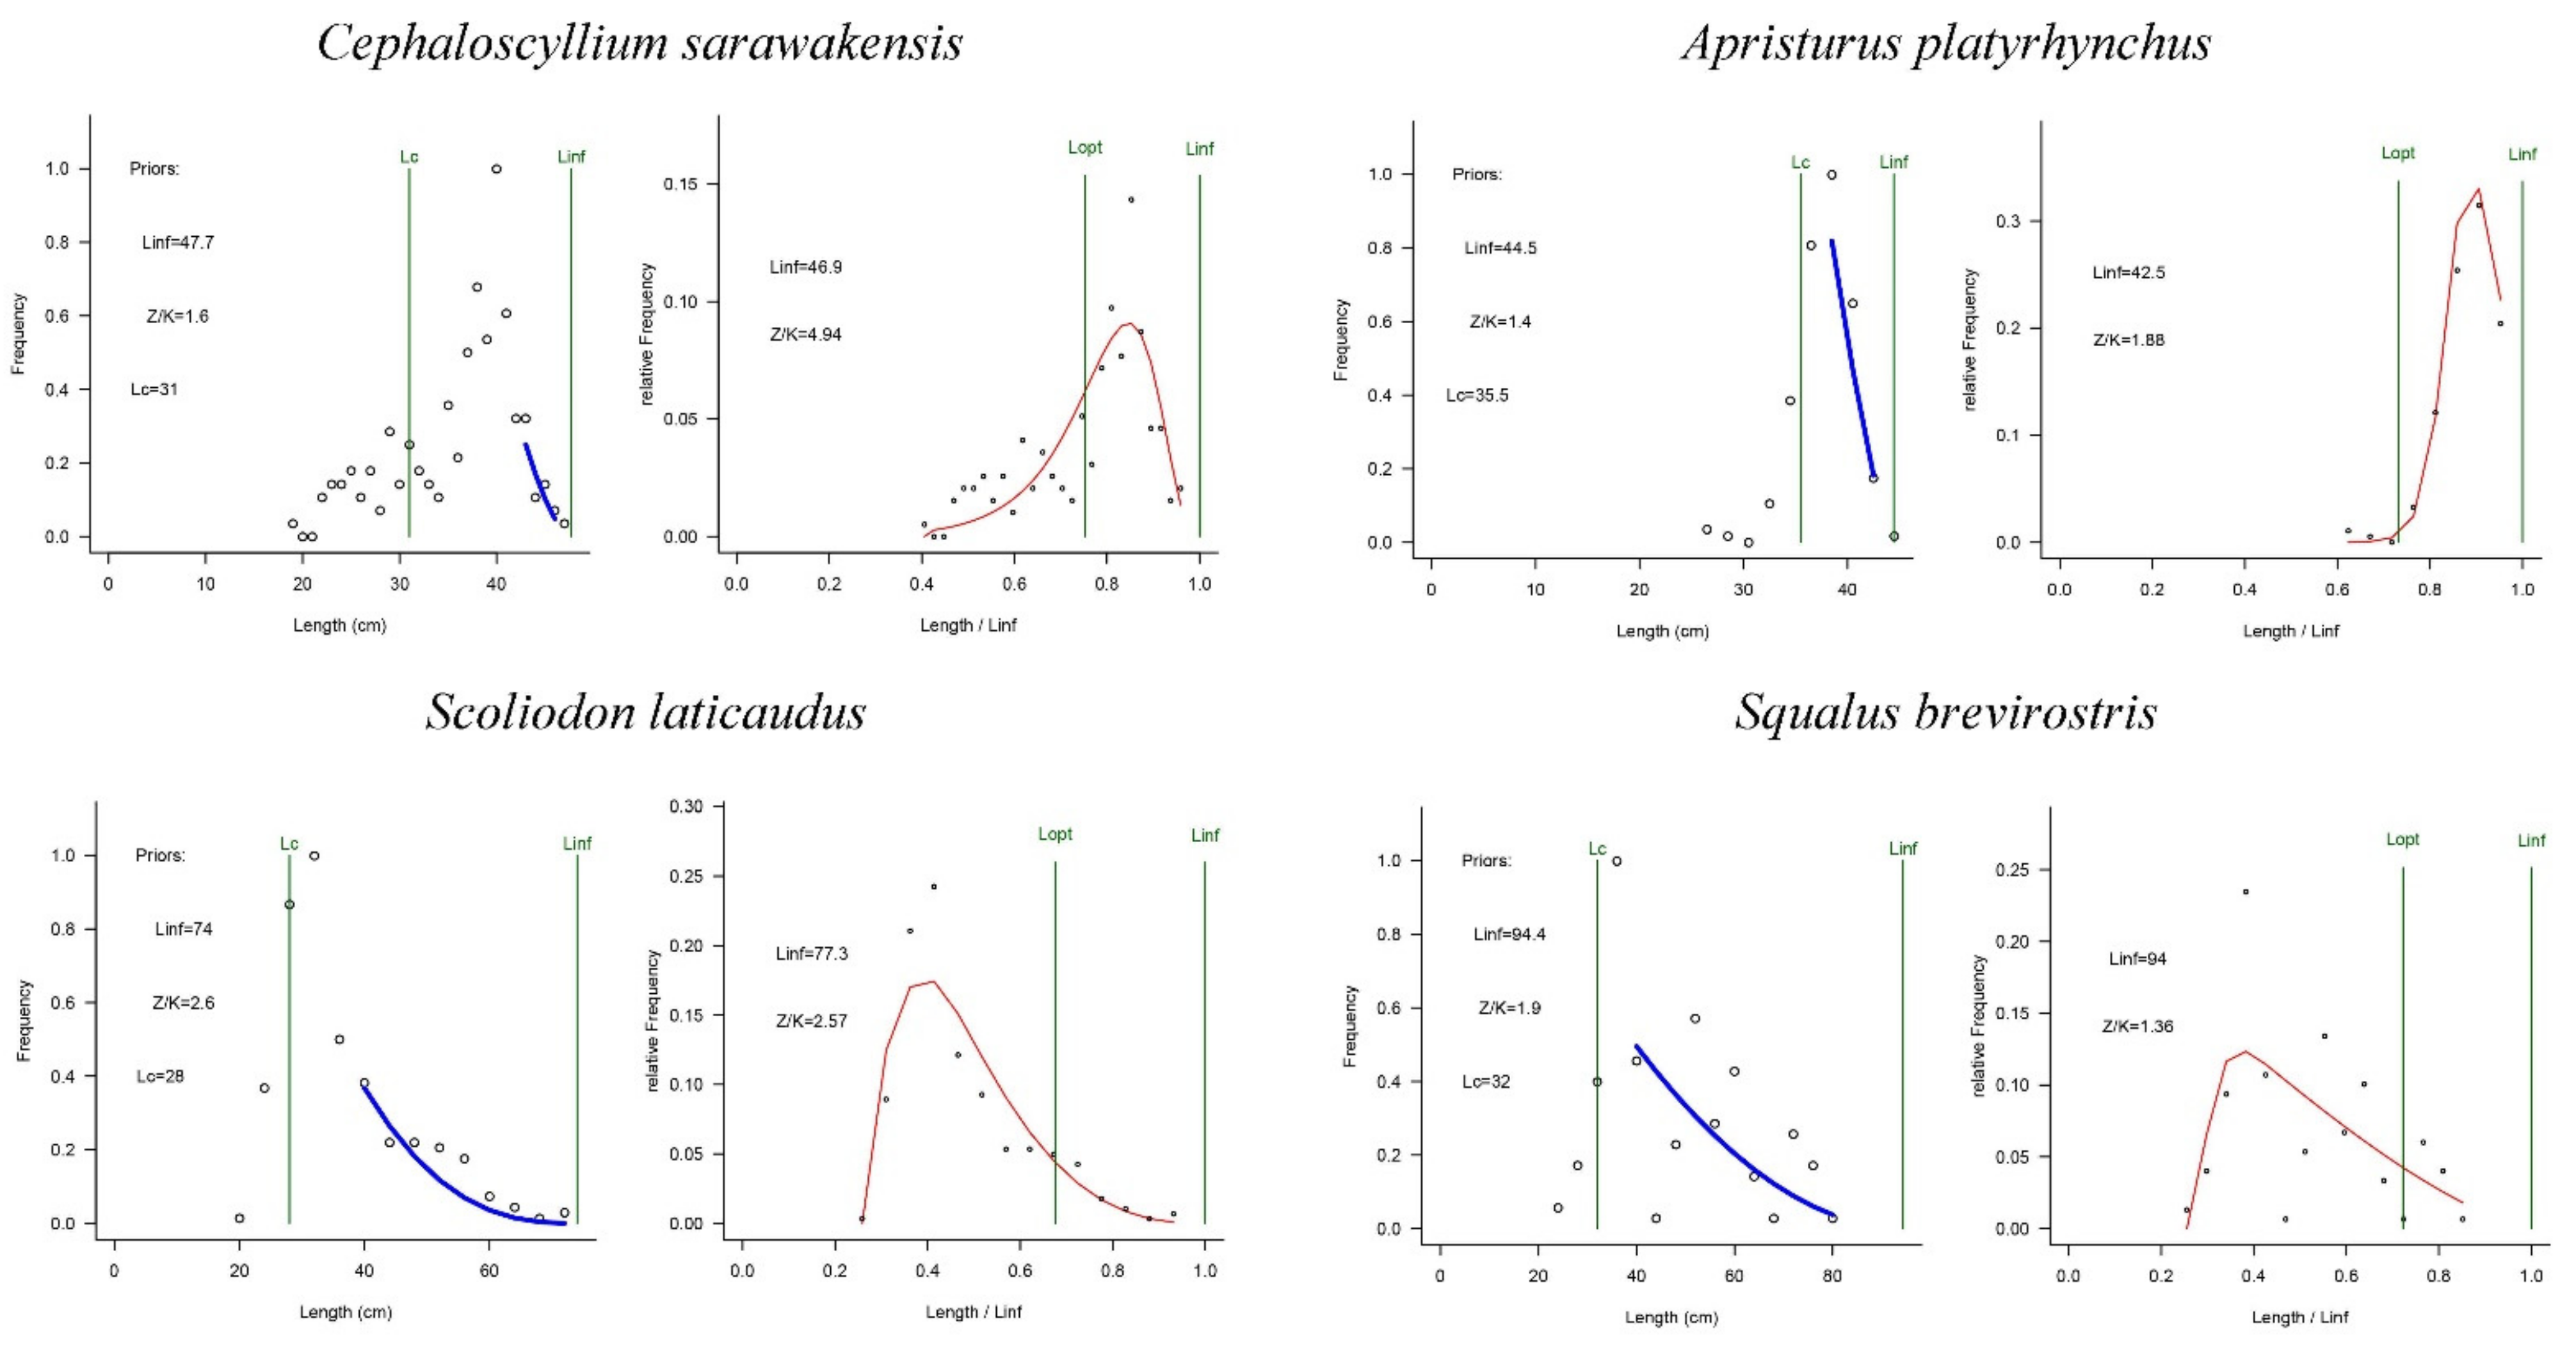
- Cephaloscyllium sarawakensis
- Apristurus platyrhynchus
- Scoliodon laticaudus
- Squalus brevirostris
2.2. LBB Method
3. Results
4. Discussion
Author Contributions
Funding
Institutional Review Board Statement
Informed Consent Statement
Data Availability Statement
Acknowledgments
Conflicts of Interest
References
- Dulvy, N.K.; Fowler, S.L.; Musick, J.A.; Cavanagh, R.D.; Kyne, P.M.; Harrison, L.R.; Carlson, J.K.; Davidson, L.N.; Fordham, S.V.; Francis, M. Extinction risk and conservation of the world’s sharks and rays. eLife 2013, 3, e00590. [Google Scholar] [CrossRef] [PubMed] [Green Version]
- Heupel, M.R.; Simpfendorfer, C.A. Importance of environmental and biological drivers in the presence and space use of a reef-associated shark. Mar. Ecol. Prog. Ser. 2014, 496, 47–57. [Google Scholar] [CrossRef]
- Heupel, M.R.; Knip, D.M.; Simpfendorfer, C.A.; Dulvy, N.K. Sizing up the ecological role of sharks as predators. Mar. Ecol. Prog. Ser. 2014, 495, 291–298. [Google Scholar] [CrossRef] [Green Version]
- Crooks, K.R.; Soule, M.E. Mesopredator release and avifaunal extinctions in a fragmented system. Nature 1999, 400, 563–566. [Google Scholar] [CrossRef]
- Estes, J.A.; Terborgh, J.; Brashares, J.S.; Power, M.E.; Berger, J.; Bond, W.J.; Carpenter, S.R.; Essington, T.E.; Holt, R.D.; Jackson, J.B.; et al. Trophic downgrading of planet Earth. Science 2011, 333, 301–306. [Google Scholar] [CrossRef] [Green Version]
- Penaherrera, C.; Llerena, Y.; Keith, I. Perceptions on the economic value of sharks for the daily diving tourism industry and the souvenir commerce in Santa Cruz Island. In Galapagos Report 2012; Charles Darwin Foundation, Galapagos National Park Directorate and Consejo de Gobierno de Galapagos: Galapagos, Ecuador, 2013. [Google Scholar]
- Pacoureau, N.; Rigby, C.; Kyne, P.M.; Sherley, R.B.; Dulvy, N.K. Half a century of global decline in oceanic sharks and rays. Nature 2021, 589, 567–571. [Google Scholar] [CrossRef]
- Costello, C.; Ovando, D.; Hilborn, R.; Gaines, S.D.; Deschenes, O.; Lester, S.E. Status and solutions for the world’s unassessed fisheries. Science 2012, 338, 517–520. [Google Scholar] [CrossRef] [Green Version]
- Davidson, L.N.K.; Krawchuk, M.A.; Dulvy, N.K. Why have global shark and ray landings declined: Improved management or overfishing? Fish Fish. 2015, 17, 438–458. [Google Scholar] [CrossRef]
- Taylor, B.M.; Houk, P.; Russ, G.R.; Choat, J.H. Life histories predict vulnerability to overexploitation in parrotfishes. Coral Reefs 2014, 33, 869–878. [Google Scholar] [CrossRef]
- Worm, B.; Davis, B.; Kettemer, L.; Ward-Paige, C.A.; Chapman, D.; Heithaus, M.R.; Kessel, S.T.; Gruber, S.H. Global catches, exploitation rates, and rebuilding options for sharks. Mar. Policy 2013, 40, 194–204. [Google Scholar] [CrossRef]
- Fong, Q.S.; Anderson, J.L. International shark fin markets and shark management: An integrated market preference–cohort analysis of the blacktip shark (Carcharhinus limbatus). Ecol. Econ. 2002, 40, 117–130. [Google Scholar] [CrossRef]
- Campana, S.E.; Joyce, W.; Manning, M.J. Bycatch and discard mortality in commercially caught blue sharks Prionace glauca assessed using archival satellite pop-up tags. Mar. Ecol. Prog. Ser. 2009, 387, 241–253. [Google Scholar] [CrossRef] [Green Version]
- Clarke, S.C.; Francis, M.P.; Griggs, L.H. Review of Shark Meat Markets, Discard Mortality and Pelagic Shark Data Availability, and a Proposal for a Shark Indicator Analysis; Ministry for Primary Industries: Wellington, New Zealand, 2013; Volume 65. [Google Scholar]
- Oliver, S.; Braccini, M.; Newman, S.J.; Harvey, E.S. Global patterns in the bycatch of sharks and rays. Mar. Policy 2015, 54, 86–97. [Google Scholar] [CrossRef]
- Campana, S.E. Transboundary movements, unmonitored fishing mortality, and ineffective international fisheries management pose risks for pelagic sharks in the northwest atlantic. Can. J. Fish. Aquat. Sci. 2016, 73, 1599–1607. [Google Scholar] [CrossRef]
- Clarke, S.C.; McAllister, M.K.; Milner-Gulland, E.J.; Kirkwood, G.P.; Michielsens, C.G.J.; Agnew, D.J.; Pikitch, E.L.; Nakano, H.; Shivji, M.S. Global estimates of shark catches using trade records from commercial markets. Ecol. Lett. 2006, 9, 1115–1126. [Google Scholar] [CrossRef]
- Ferretti, F.; Worm, B.; Britten, G.L.; Heithaus, M.R.; Lotze, H.K. Patterns and ecosystem consequences of shark declines in the ocean. Ecol. Lett. 2010, 13, 1055–1071. [Google Scholar] [CrossRef]
- Dulvy, N.; Simpfendorfer, C.; Davison, L.; Fordham, S.; Brautigam, A.; Sant, G.; Welch, D. Challenges and priorities in shark and ray conservation. Curr. Biol. 2017, 27, R565–R572. [Google Scholar] [CrossRef] [Green Version]
- Cortés, E.; Brooks, E.N.; Gedamke, T. Population dynamics, demography, and stock assessment. In Biology of Sharks and Their Relatives, 2nd ed.; Carrier, J.C., Musick, J.A., Heithaus, M.R., Eds.; CRC Press, Taylor & Francis Group: Miami, FL, USA, 2012; pp. 453–486. [Google Scholar]
- Zeller, D.; Pauly, D. Marine fisheries catch reconstruction: Definitions, sources, methods, and challenges. In Global Atlas of Marine Fisheries: A Critical Appraisal of Catches and Ecosystem Impacts; Island Press: Washington, DC, USA, 2016; pp. 12–29. [Google Scholar]
- Whitmarsh, D.; Palmieri, M.G. Aquaculture in the Coastal Zone: Pressures, Interactions and Externalities. In Aquaculture in the Ecosystem; Springer: Berlin/Heidelberg, Germany, 2008; pp. 251–269. [Google Scholar]
- Zhang, K.; Guo, J.; Xu, Y.; Jiang, Y.; Chen, Z. Long-term variations in fish community structure under multiple stressors in a semi-closed marine ecosystem in the South China Sea. Sci. Total Environ. 2020, 745, 140892. [Google Scholar] [CrossRef]
- Kbjg, A.; Ak, B.; Sp, A.; Saa, C.; Jmb, D.; Cra, E. Fishing for profit or food? Socio-economic drivers and fishers’ attitudes towards sharks in fiji. Mar. Policy 2019, 100, 249–257. [Google Scholar]
- Leeney, R.H.; Mana, R.R.; Dulvy, N.K. Fishers’ ecological knowledge of sawfishes in the Sepik and Ramu rivers, northern Papua New Guinea. Endanger. Species Res. 2018, 36, 15–26. [Google Scholar] [CrossRef] [Green Version]
- Booth, H.; Squires, D.; Milner-Gulland, E.J. The neglected complexities of shark fisheries, and priorities for holistic risk-based management. Ocean Coast. Manag. 2019, 182, 104994. [Google Scholar] [CrossRef]
- Dissanayake, N.G.; Frid, C.; Caswell, B.A. Biodiversity, trait composition and ecological functioning: Impacts of coastal urbanisation on subtropical mudflats. Mar. Freshw. Res. 2020, 71, 1043–1061. [Google Scholar] [CrossRef]
- Maz-Courrau, A.; López-Vera, C.; Galván-Magaña, F.; Escobar-Sánchez, O.; Rosíles-Martínez, R.; Sanjuán-Muñoz, A. Bioaccumulation and Biomagnification of Total Mercury in Four Exploited Shark Species in the Baja California Peninsula, Mexico. Bull. Environ. Contam. Toxicol. 2001, 88, 129–134. [Google Scholar] [CrossRef]
- Liu, Y.; Jiang, T.; Wang, X.H.; Duan, L.J.; Li, S.Y. Establishment and analysis of the Ecopath model of the ecosystem in the northern continental shelf of South China Sea. Acta Sci. Nat. Univ. Sunyatseni 2007, 46, 123–127. [Google Scholar]
- Wang, Y.; Yuan, W. Changes of demersal trawl fishery resources in northern south china sea as revealed by demersal trawling. S. China Fish. Sci. 2008, 4, 8. [Google Scholar]
- Li, M.; Huang, Z.R.; XU, Y.W.; Chen, Z.Z. Population genetic structure of brushtooth lizardfish (Saurida undosquamis) based on mitochondrial cytochrome b gene sequences. S. China Fish. Sci. 2019, 15, 41–48. [Google Scholar]
- Shu, L.M.; Qiu, Y.S. Biology analysis of Saurida tumbil in northern South China Sea. J. Fish. Sci. China 2004, 11, 5. [Google Scholar]
- Niu, S.F.; Wu, R.X.; Zhai, Y.; Zhang, H.R.; Chen, Y.H. Demographic history and population genetic analysis of Decapterus maruadsi from the northern South China Sea based on mitochondrial control region sequence. PeerJ 2019, 7, e7953. [Google Scholar] [CrossRef] [Green Version]
- Zhou, P.; Huang, C.; Fang, H.; Cai, W.; Li, D.; Li, X.; Yu, H. The abundance, composition and sources of marine debris in coastal seawaters or beaches around the northern South China Sea (China). Mar. Pollut. Bull. 2011, 62, 1998–2007. [Google Scholar] [CrossRef]
- Huang, Z.R.; Chen, Z.Z.; Zeng, X.G. Species composition and resources density of chondrichthyes in the continental shelf of northern South China Sea. J. Oceanogr. Taiwan Strait. 2009, 28, 38–44. [Google Scholar]
- Wang, X.; He, Y.; Du, F.; Liu, M.; Qiu, Y. Using LBB Tools to Assess Miter Squid Stock in the Northeastern South China Sea. Front. Mar. Sci. 2021, 7, 518–627. [Google Scholar] [CrossRef]
- Wang, Y.; Wang, Y.; Liu, S.; Liang, C.; Xian, W. Stock Assessment Using LBB Method for Eight Fish Species from the Bohai and Yellow Seas. Front. Mar. Sci. 2020, 7, 164. [Google Scholar] [CrossRef]
- Zhang, K.; Zhang, J.; Shi, D.; Chen, Z. Assessment of coral reef fish stocks from the Nansha Islands, South China Sea, using length-based Bayesian biomass estimation. Front. Mar. Sci. 2021, 7, 610707. [Google Scholar] [CrossRef]
- Yano, K.; Ahmad, A.; Gambang, A.C.; Idris, A.H.; Solahuddin, A.R.; Aznan, Z. Sharks and Rays of Malaysia and Brunei, Darussalam; SEAFDEC-MFRDMD: Kuala Terengganu, Malaysia, 2005; p. 557. [Google Scholar]
- Compagno, L.J.V. FAO Species Catalogue. Vol. 4. Sharks of the world. An annotated and illustrated catalogue of shark species known to date. Part 2-Carcharhiniformes. FAO Fish. Synop. 1984, 125, 251–655. [Google Scholar]
- Randall, J.E.; Lim, K.K.P. A checklist of the fishes of the South China Sea. Raffles Bull. Zool. Suppl. 2000, 8, 569–667. [Google Scholar]
- Froese, R.; Winker, H.; Coro, G.; Demirel, N.; Tsikliras, A.C.; Dimarchopoulou, D.; Scarcella, G.; Probst, W.N.; Dureuil, M.; Pauly, D. Corrigendum: A new approach for estimating stock status from length frequency data. ICES J. Mar. Sci. 2019, 76, 350–351. [Google Scholar] [CrossRef]
- Von Bertalanffy, L. A quantitative theory of organic growth (inquiries on growth laws. II). Hum. Biol. 1938, 10, 181–213. [Google Scholar]
- Quinn, T.J.; Deriso, R.B. Quantitative Fish Dynamics; Oxford University Press: New York, NY, USA, 1999. [Google Scholar]
- Amorim, P.; Sousa, P.; Jardim, E.; Menezes, G.M. Sustainability status of data-limited fisheries: Global challenges for snapper and grouper. Front. Mar. Sci. 2019, 6, 654. [Google Scholar] [CrossRef]
- MacLennan, D.N. Fishing gear selectivity: An overview. Fish. Res. 1992, 13, 201–204. [Google Scholar] [CrossRef]
- Ju, P.; Chen, M.; Tian, Y.; Zhao, Y.; Yang, S.; Xiao, J. Stock status estimating of 5 shark species in the waters around Taiwan using a length-based Bayesian biomass estimation (LBB) method. Front. Mar. Sci. 2020, 7, 632. [Google Scholar] [CrossRef]
- Kleiber, P.; Clarke, S.; Bigelow, K.; Nakano, H.; McAllister, M.; Takeuchi, Y. North Pacific Blue Shark Stock Assessment; U.S. Dep. Commer., NOAA: Washington, DC, USA, 2009; p. 74. [Google Scholar]
- Geng, Z.; Wang, Y.; Kindong, R.; Zhu, J.; Dai, X. Demographic and harvest analysis for blue shark (Prionace glauca) in the Indian Ocean. Reg. Stud. Mar. Sci. 2021, 41, 101583. [Google Scholar] [CrossRef]
- Chang, J.H.; Liu, K.M. Stock assessment of the shortfin mako shark (Isurus oxyrinchus) in the Northwest Pacific Ocean using per recruit and virtual population analyses. Fish. Res. 2009, 98, 92–101. [Google Scholar] [CrossRef]
- Zhang, R.; Lin, L.S.; Yuan, L.I.; Song, P.Q.; Chen, Y.J.; Zhang, J. Species composition and quantity distribution of sharks in the southwestern sea of the Nansha Islands and mouth of the Beibu Bay. Mar. Fish. 2018, 1, 27–37. [Google Scholar]
- Gutteridge, A.N.; Huveneers, C.; Marshall, L.J.; Tibbetts, I.R.; Bennett, M.B. Life-history traits of a small-bodied coastal shark. Mar. Freshwater Res. 2013, 64, 54–65. [Google Scholar] [CrossRef]
- Nakaya, K.; Kawauchi, J. A review of the genus Cephaloscyllium (Chondrichthyes: Carcharhiniformes: Scyliorhinidae) from Taiwanese waters. Zootaxa 2013, 3752, 101. [Google Scholar] [CrossRef] [PubMed] [Green Version]
- Riede, K. Global Register of Migratory Species: From Global to Regional Scales: Final Report of the RandD-Projekt 808 05 081; Federal Agency for Nature Conservation: Bonn, Germany, 2004. [Google Scholar]
- Thomas, S.; Purushottama, G.B.; Nataraja, G.D.; Kizhakudan, S.J. Fishery and biological characteristics of the spadenose shark Scoliodon laticaudus müller & henle, 1838 from the eastern Arabian Sea. Reg. Stud. Mar. Sci. 2020, 34, 101085. [Google Scholar]
- Sen, S.; Chakraborty, S.K.; Zacharia, P.U.; Dash, G.; Joe Kizhakudan, S.; Bharadiya, S.A.; Gohel, J.K. Reproductive strategy of spadenose shark, Scoliodon laticaudus muller and henle, 1839 along north-eastern Arabian Sea. J. Appl. Ichthyol. 2018, 34, 1304–1313. [Google Scholar] [CrossRef]
- Karim, E.; Qun, L.; Memon, A.M.; Baset, A.; Hoq, M.E.; Shamsuzzaman, M.M.; Das, A. Assessment of some demographic trends of spadenose shark (Scoliodon laticaudus) of the Bay of Bengal, Bangladesh. Indian J. Geo-Mar. Sci. 2017, 46, 1986–1995. [Google Scholar]
- Pauly, D.; Liang, C. The fisheries of the South China Sea: Major trends since 1950. Mar. Policy 2019, 121, 103584. [Google Scholar] [CrossRef]
- Hordyk, A.R.; Prince, J.D.; Carruthers, T.R.; Walters, C.J. Comment on ‘A new approach for estimating stock status from length frequency data’ by Froese et al. (2018). ICES J. Mar. Sci. 2019, 76, 457–460. [Google Scholar] [CrossRef]
- Al-Mamun, M.A.; Liu, Q.; Chowdhury, S.R.; Uddin, M.S.; Sultana, R. Stock Assessment for Seven Fish Species Using the LBB Method from the Northeastern Tip of the Bay of Bengal, Bangladesh. Sustainability 2021, 13, 1561. [Google Scholar] [CrossRef]


| Scientific Name | Common Name | Numbers |
|---|---|---|
| Triakis maculata (Kner and Steindachner, 1867) | Spotted houndshark | 4 |
| Squalus brevirostris (Tanaka, 1917) | Shortnose dogfish | 149 |
| Apristurus platyrhynchus (Tanaka, 1909) | Spatulasnout catshark | 182 |
| Scoliodon laticaudus (Müller and Henle, 1838) | Spadenose shark | 280 |
| Halaelurus buergeri (Müller and Henle, 1838) | Blackspotted catshark | 12 |
| Pristiophorus japonicus (Günther, 1870) | Japanese sawshark | 3 |
| Carcharhinus sorrah (Valenciennes, 1839) | Spot-tail shark | 13 |
| Galeus sauteri (Jordan and Richardson, 1909) | Blacktip sawtail catsharks | 94 |
| Chiloscyllium plagiosum (Anonymous (Bennett), 1830) | Whitespotted bambooshark | 5 |
| Cephaloscyllium fasciatum (Chan, 1966) | Reticulated swellshark | 12 |
| Cephaloscyllium sarawakensis (Yano, Ahmad and Gambang, 2005) | Sarawak pygmy swell shark | 195 |
| Eridacnis radcliffei (Smith, 1913) | Pygmy Ribbontail Cat Shark | 3 |
| Scientific Name | Min (mm) | Max (mm) | Class Interval | Numbers | Linf Prior | Z/K Prior | M/K Prior | F/K Prior | Lc Prior | Alpha Prior |
|---|---|---|---|---|---|---|---|---|---|---|
| Cephaloscyllium sarawakensis | 182 | 470 | 10 | 195 | 47.7 | 1.6 | 1.5 | 0.123 | 31.6 | 11.8 |
| Apristurus platyrhynchus | 258 | 442 | 20 | 182 | 44.5 | 1.4 | 1.5 | 0.300 | 36.2 | 33.4 |
| Scoliodon laticaudus | 200 | 700 | 40 | 280 | 74.0 | 2.6 | 1.5 | 1.120 | 28.6 | 18.5 |
| Squalus brevirostris | 237 | 772 | 40 | 149 | 94.4 | 1.9 | 1.5 | 0.437 | 32.6 | 41.6 |
| Scientist Name | Linf (cm) | Lc/Lc_opt | Z/K | B/B0 | B/BMSY | Status |
|---|---|---|---|---|---|---|
| Cephaloscyllium sarawakensis | 46.9 (46.6–47.5) | 1.40 | 4.97 (3.58–6.74) | 0.34 (0.13–0.6) | 0.86 (0.33–1.50) | Fully exploited |
| Apristurus platyrhynchus | 42.5 (41.8–43.3) | 1.30 | 1.88 (1.68–2.21) | 0.55 (0.28–1.10) | 1.40 (0.72–2.80) | Non-fully exploited |
| Scoliodon laticaudus | 77.3 (76.3–78.2) | 0.67 | 2.57 (2.44–2.72) | 0.34 (0.19–0.56) | 0.92 (0.52–1.50) | Fully exploited |
| Squalus brevirostris | 96.5 (95.2–98.1) | 0.49 | 1.40 (1.30–1.50) | 0.74 (0.08–1.70) | 1.90 (0.22–4.40) | Non-fully exploited |
| Class Interval (mm) | Linf (cm) | Lc/Lc_opt | Z/K | B/B0 | B/BMSY |
|---|---|---|---|---|---|
| 10 | 74.5 (73.5–75.8) | 0.57 | 3.38 (3.22–3.60) | 0.22 (0.13–0.34) | 0.61 (0.34–0.94) |
| 20 | 74.0 (73.0–75.1) | 0.59 | 2.50 (2.30–2.60) | 0.40 (0.15–0.65) | 1.10 (0.41–1.8) |
| 30 | 73.6 (72.3–74.7) | 0.61 | 2.40 (2.20–2.60) | 0.44 (0.18–0.80) | 1.20 (0.50–2.20) |
| 40 | 77.3 (76.3–78.2) | 0.67 | 2.57 (2.44–2.72) | 0.34 (0.19–0.56) | 0.92 (0.52–1.50) |
| 50 | 77.4 (76.5–78.5) | 0.57 | 2.40 (2.30–2.60) | 0.42 (0.20–0.62) | 1.10 (0.55–1.70) |
Publisher’s Note: MDPI stays neutral with regard to jurisdictional claims in published maps and institutional affiliations. |
© 2022 by the authors. Licensee MDPI, Basel, Switzerland. This article is an open access article distributed under the terms and conditions of the Creative Commons Attribution (CC BY) license (https://creativecommons.org/licenses/by/4.0/).
Share and Cite
Xu, Y.; Dai, X.; Huang, Z.; Sun, M.; Chen, Z.; Zhang, K. Stock Assessment of Four Dominant Shark Bycatch Species in Bottom Trawl Fisheries in the Northern South China Sea. Sustainability 2022, 14, 3722. https://doi.org/10.3390/su14073722
Xu Y, Dai X, Huang Z, Sun M, Chen Z, Zhang K. Stock Assessment of Four Dominant Shark Bycatch Species in Bottom Trawl Fisheries in the Northern South China Sea. Sustainability. 2022; 14(7):3722. https://doi.org/10.3390/su14073722
Chicago/Turabian StyleXu, Youwei, Xiaojie Dai, Zirong Huang, Mingshuai Sun, Zuozhi Chen, and Kui Zhang. 2022. "Stock Assessment of Four Dominant Shark Bycatch Species in Bottom Trawl Fisheries in the Northern South China Sea" Sustainability 14, no. 7: 3722. https://doi.org/10.3390/su14073722
APA StyleXu, Y., Dai, X., Huang, Z., Sun, M., Chen, Z., & Zhang, K. (2022). Stock Assessment of Four Dominant Shark Bycatch Species in Bottom Trawl Fisheries in the Northern South China Sea. Sustainability, 14(7), 3722. https://doi.org/10.3390/su14073722