Article

Assessing Phytosanitary Application Efficiency of a Boom Sprayer Machine Using RGB Sensor in Grassy Fields

1
Higher Institute of Agricultural Sciences, University of Sousse, 4042 Chott Meriem, Tunisia
2
Integrative Crop Ecophysiology Group, Plant Physiology Section, Faculty of Biology, University of Barcelona, 08028 Barcelona, Spain
3
CESAM—GRASP, Institute of Physics, University of Liege, Tilman, 4000 Liege, Belgium
*
Author to whom correspondence should be addressed.
Sustainability 2022, 14(6), 3666; https://doi.org/10.3390/su14063666
Submission received: 31 December 2021 / Revised: 16 March 2022 / Accepted: 17 March 2022 / Published: 21 March 2022
(This article belongs to the Section Environmental Sustainability and Applications)

Abstract

:
The systematic use of plant protection products is now being called into question with the growing awareness of the risks they can represent for the environment and human health. The application of precision agriculture technologies helps to improve agricultural production but also to rationalize input costs and improve ecological footprints. Here we present a study on fungicide application efficiency and its impact on the grass quality of a golf course green using the free open-source image analysis software FIJI (Image J) to analyze ground RGB (high-resolution digital cameras) and multispectral aerial imagery in combination with experimental data of spray pressure and hydraulic slot nozzle size of a boom sprayer machine. The multivariate regression model best explained variance in the normalized green-red difference index (NGRDI) as a relevant indicator of healthy turfgrass fields from the aerial, ground, and machine data set.

1. Introduction

The surface on which a sport is played makes a huge difference, not only in the way it is played but on player health, maintenance and even the likability of the local environment. There are many benefits to choosing a turfgrass yard or field over other options. Operating preventative fungicide applications may help keep your sward healthy and disease-free. Precision agriculture aims to apply a precise and appropriate amount of inputs of water, pesticides, fertilizers etc., to the crop at the right time for improving productivity and quality [1], which may considerably reduce the quantity of pesticides and savings in input costs [2]. The second benefit concerns environmental impacts [3]. Consequently, concerning crops, soils and farmers, precision agriculture has become a key element of sustainable agriculture [4,5] by reducing pressure on the environment through increasing machinery efficiency. For example, the use of GNSS (Global Navigation Satellite System) reduces agriculture fuel consumption, as when satellite imagery supports variable rate technology application of pesticides including sprayer machines and can eventually reduce the total amount used [3,6].
Current technological advancements allow the use of real-time sensors in the soil to collect and transmit data instantly without the need for human presence [7,8]. Precision agriculture has further been enabled by RGB (Red, Green, Blue) or multispectral cameras to capture multiple field images that can then be combined via photogrammetric methods to build orthophotos covering large areas. The multispectral images include several values per pixel besides the traditional red, green and blue values to process and analyze spectral vegetation indices that can provide detailed information on plant health, including fungal infections and treatment needs [9]. In phytosanitary applications, the majority of fungicide products are used in the form of a spray to protect turfgrass fields and optimize their quality [10]. The precise distribution of agrochemicals is essential to ensure effective intervention with a significant impact on both production costs and the environment.
Spray operation should use drop shadows to deliver the active component to the target area. Fungicide treatment effectiveness as a function of drop sizes and velocity has been the subject of an expansive disquisition and, despite the process complexity, some trends are well established [1,11]. As a rule of thumb, drops whose sizes exceed 300 µm in diameter tend to splash on the target shell. Among others, the parameters determining the splash characteristics are the drop kinetic energy and the area characteristics [12,13]. On the other hand, small driblets under 200 µm in diameter are prone to interact with the wind, which may beget their drift downwards from the target [1,11]. Still, nozzles are characterized by a wide distribution of drop size (span) involving implicit drifting or effectiveness losses due to splashing marvels. Therefore, the spray should contain optimal driblets regarding their droplet sizes and velocity. A better spray uniformity may ameliorate treatment effectiveness and reduce drift hazards. On this basis, reducing the extent of the drop size distribution is still a challenge in the field of precision phytosanitary treatment.
Spray pressure, nozzle size, and tractor speed for a boom sprayer are the main parameters determining boom flow rate, drop size, drift, and subsequently treatment application efficiency [10]. To solve this problem, remote sensing has become an essential toolset in the modernization of ground-based high throughput plant phenotyping (HTPP), ultimately including advances in yield, but including adaptation to abiotic stressors, biotic limiting conditions as vulnerability to diseases and pests, and indeed quality [14,15,16,17]. As a classical approach of remote sensing using satellites, unmanned aerial vehicle UAVs, visible and near-infrared (VNIR) imaging spectroscopy has proven a reasonably reliable ability in biophysical crop evaluations in agriculture [18,19] such as the normalized difference vegetative index (NDVI) [20] resulting from visible and near-infrared (NIR) reflectance that is strictly related to vegetation presence or vigor [21,22]. The main difficulties regarding the use of NDVI include its atmospheric impact, ease of saturation, and sensor quality [23].
Various RGB vegetation indices (RGB VIs), estimated from commercial RGB cameras, have proven their capability to predict yield, evaluate nutrient deficits, and measure disease impacts [24,25] as a less expensive alternative to scientific multispectral VNIR or thermal infrared (TIR) sensors [26]. RGB images can be treated using comparisons between red, green, and blue light as broadband reflectance values or through the use of alternative color spaces, as with the Breedpix code [27]. The normalized green–red difference index (NGRDI), which is closely related to vegetation presence or vigor, and the triangular greenness index (TGI), which estimates chlorophyll concentration in leaves and canopies, are both calculated from the treatment of R, G, and B as separate spectral bands [25]. In the hue–saturation–intensity (HSI) color space, where the hue (H) element describes color chroma crossing the visible spectrum in the form of an angle between 0° and 360° [14]. The percentage of pixels in the image in the hue range from 60° to 180° presents the green index area (GA), but the percentage of pixels in the image in the hue range from 80° to 180° presents the greener green area (GGA) excluding yellowish-green tones that might be partially stressed or senescent. The crop senescence index (CSI) is calculated from GA and GGA, providing strong segregation between resistant and sensitive genotypes in different treatments [14,20,28,29]. In the Commission Internationale de I’Edairage (CIE), CIELab color space model, dimension L* represents lightness, the a* factor presents green to red, and the b* factor expresses blue to yellow. Dimensions u* and v* in the CIELuv color space model are perceptibly homogeneous coordinates and symbolize axes like a* and b* in separating the color spectrum [30]. The CIElab and CIEluv color spaces can concurrently contrast the green vegetation amount with the reddish/brown soil background and yellowing caused by the foliar chlorophyll loss, both communal symptoms of nitrogen deficit. Already, for improving crop performance, RGB VIs have been used at both the canopy and leaf status [16,31,32].
In this current study, the defined remote sensing indices, hue, a*, u*, NGRDI, and NDVI are examined for their potential to ensure effective fungicide intervention with significant impact. Then, we evaluate the performance of a set of remote sensing RGB VIs from natural color images acquired at the ground level on a playing turf. Additionally, we evaluated how these different data contribute to improving multivariate model estimations of grass phytosanitary conditions in combination with the operating parameters of a boom pressure sprayer, such as spray pressure and nozzle size, to provide some improvements over traditional practices. This study aims to assess if defined remote sensing indices can be used to ensure effective fungicide intervention with significant impact and provide support in golf turf maintenance.

2. Materials and Methods

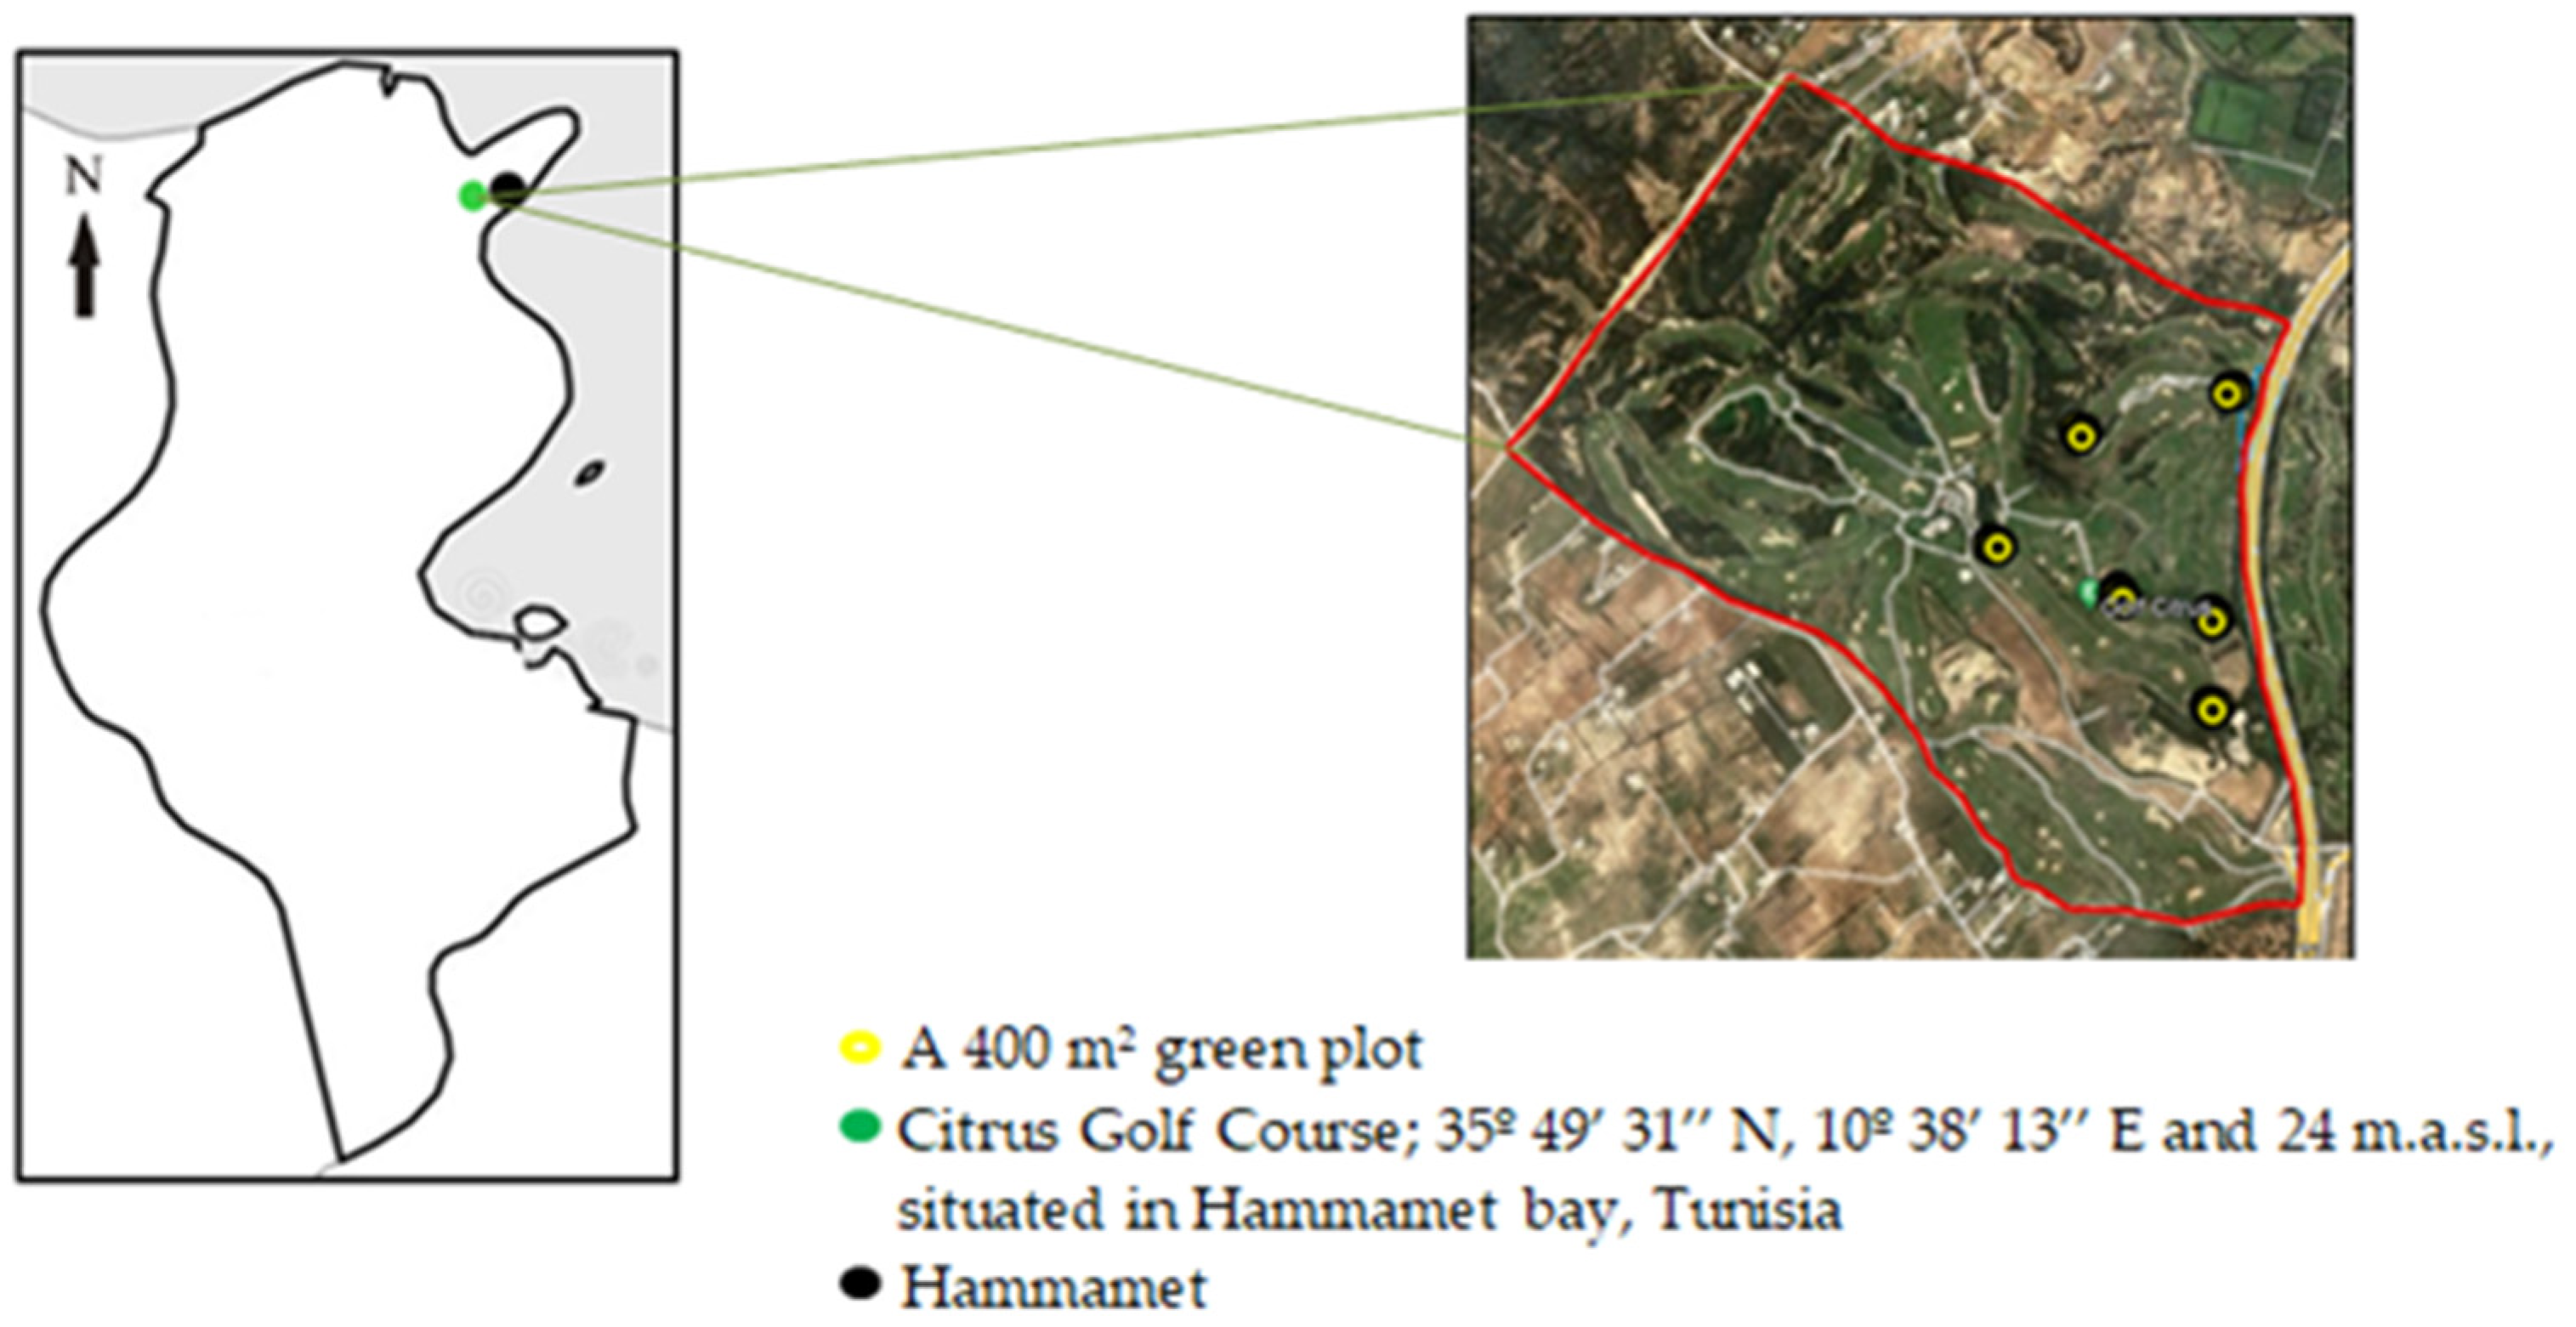
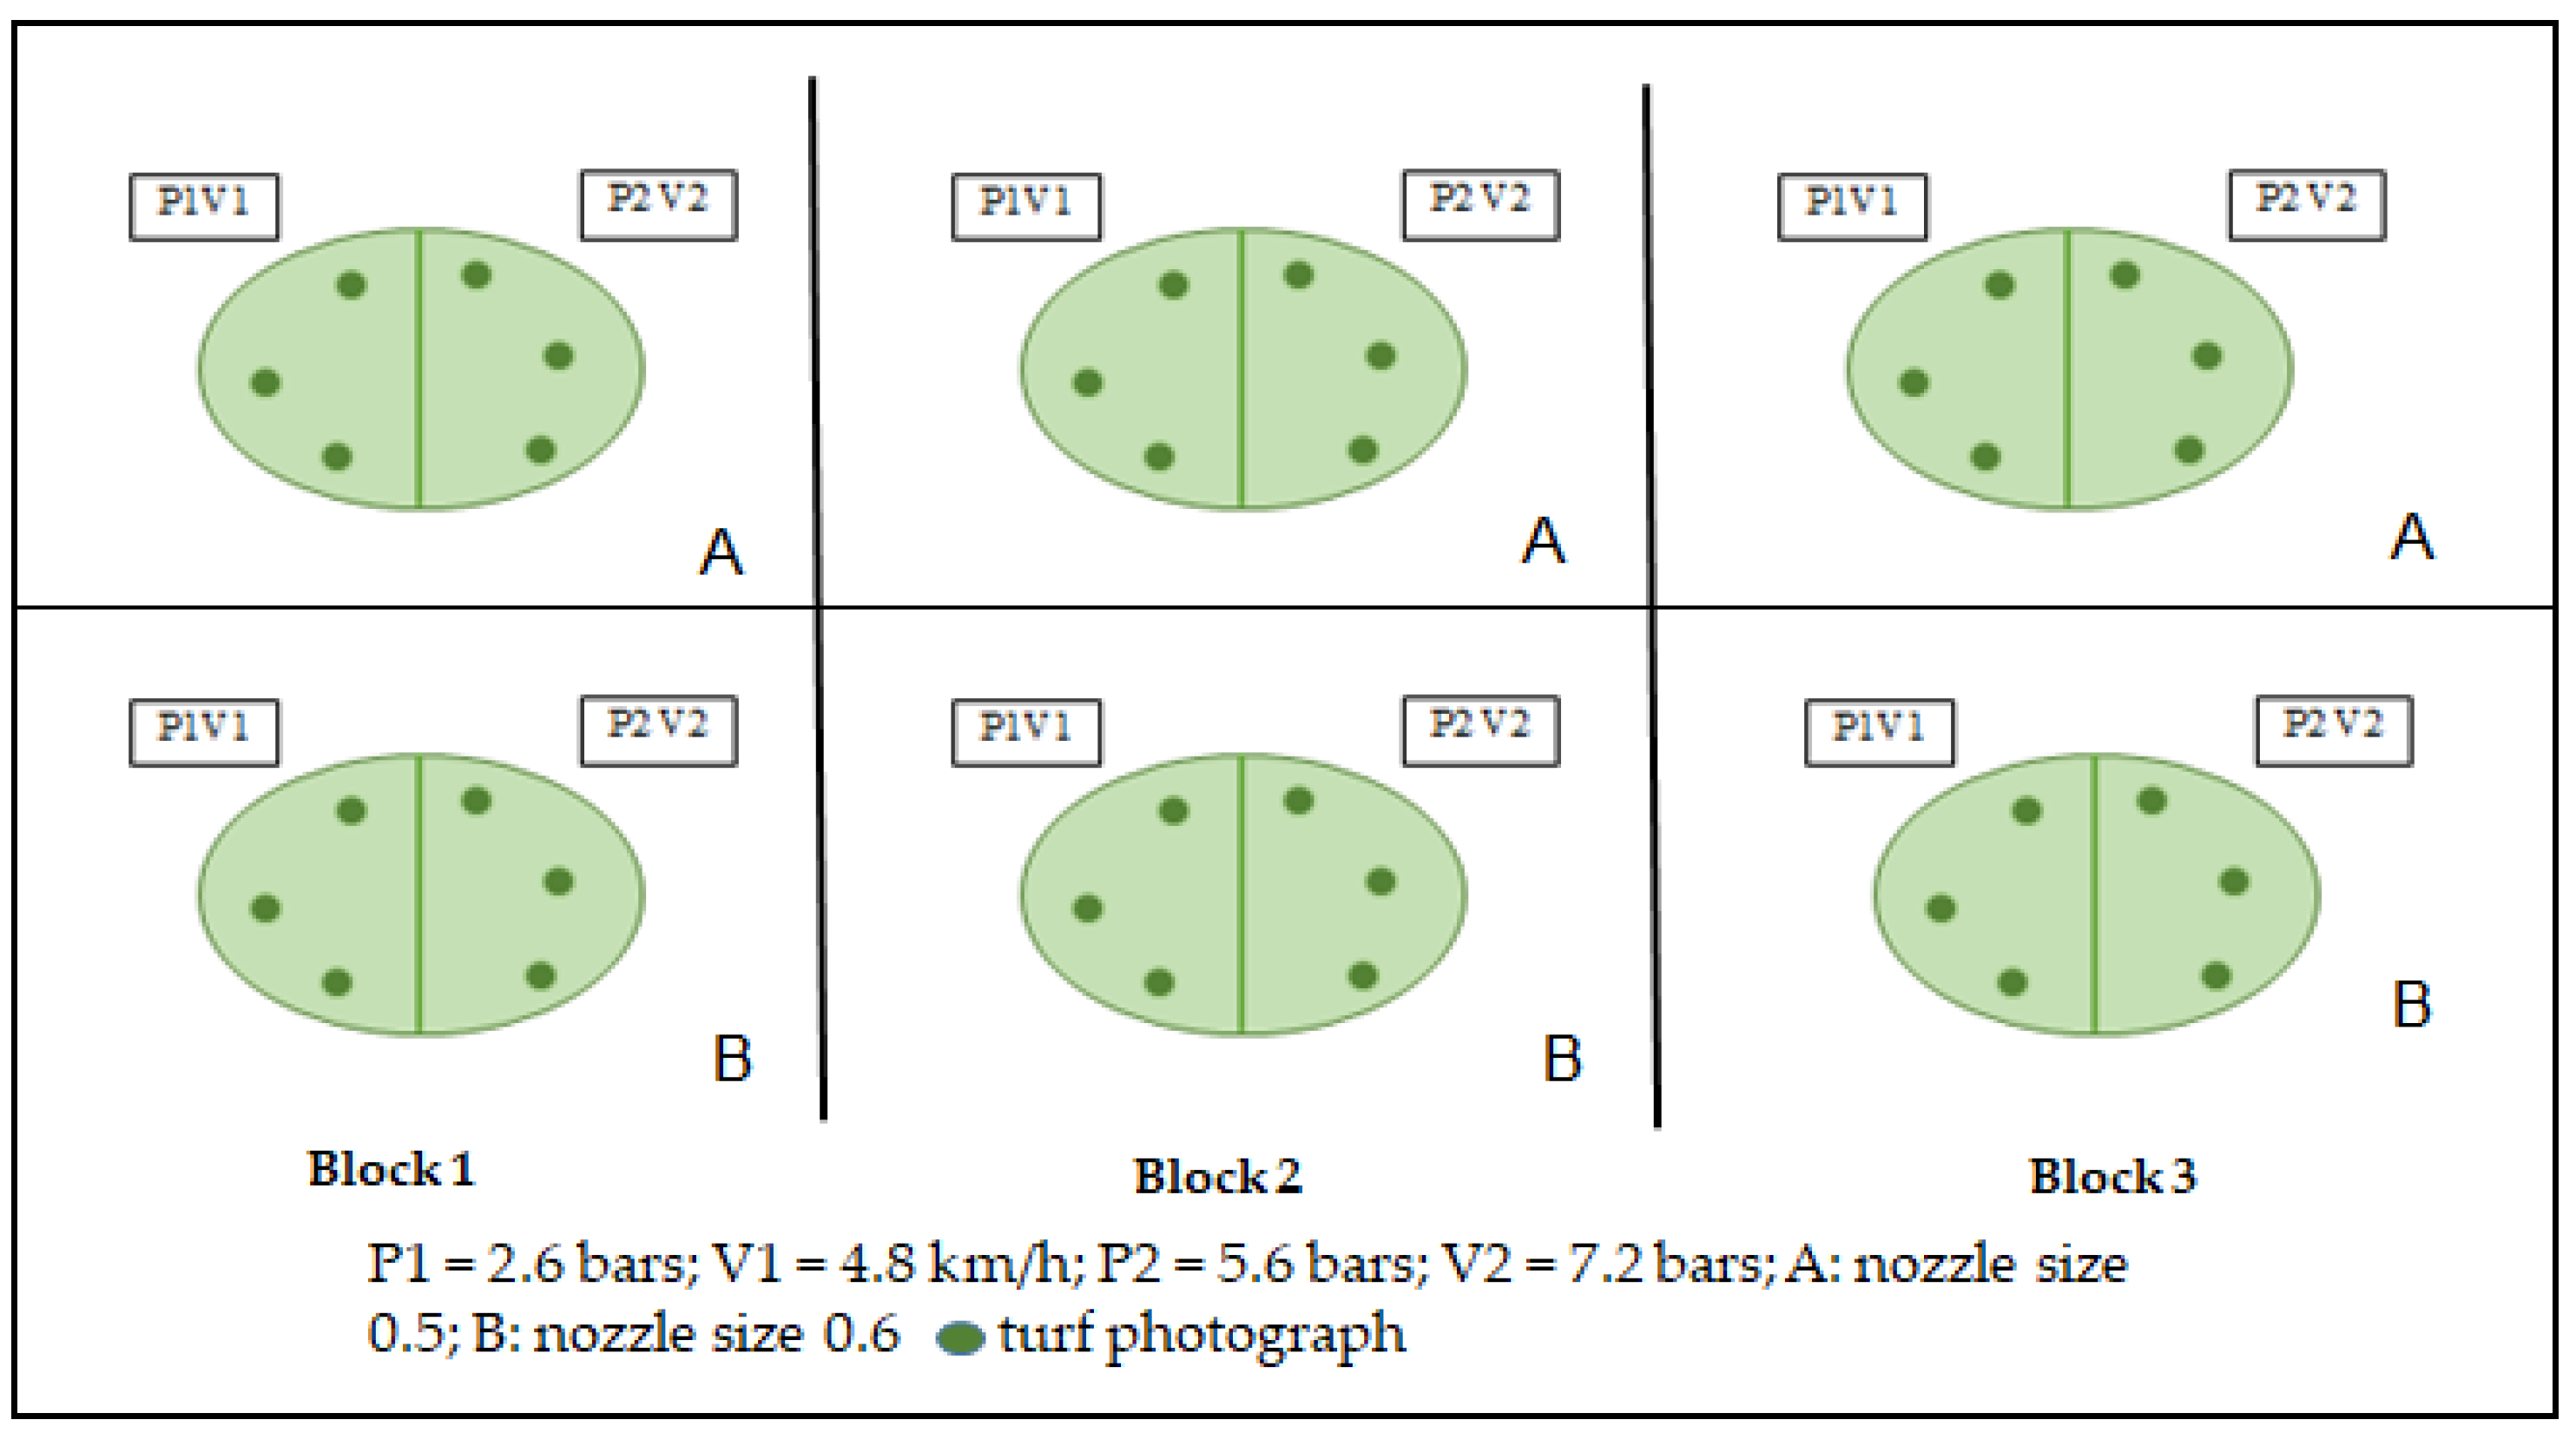
2.1. Experimental Conditions

The experimentation was carried out on a grass lawn of the Citrus Golf Course located in Hammamet, Tunisia (35°49′31′′ N, 10°38′13′′ E, 24 m.a.s.l) (Figure 1). The Golf course is characterized by sandy soil with a pH slightly below 6. It offers two remarkable 18-hole courses: the Olive trees course and the Forest course, whose main quality is the technical richness of the layout. All the courses represent 80 hectares of grassed land that is perfectly maintained throughout the year with a local weather station data recording mean temperature, humidity, and total rainfall of 19 °C, 66% and 380 mm, respectively. The experiment was carried out in six greens of the Forest course (Figure 1). Each green of 400 m2 area was divided into two experimental units for 12 units for both nozzle sizes. Three turf photographs were taken 5 days after the sprayer passage on each unit with 9 replications. Five treatment applications with a 10-day interval were performed from March to Mai 2021 (Figure 2). The control simple was a digital photograph taken per experimental unit with a Nikon D7500 camera about 125 cm above the grass canopy before treatment application. The infested turf presented low vegetation indices values compared to treated turf. In the golf course of Hammamet, only two nozzles 05 and 06 were used and thus compared in turf phytosanitary applications. For each fungal treatment, a combination of pressure-speed-nozzle size (Table 1) was tested to assess the treatment effectiveness of a boom pressure sprayer (BPS) with flat-jet nozzles and the health status of the grass turf using RGB remote sensing technology to avoid a considerable risk of contamination by spray drift and losses on the soil, a reason of increasing public care. To avoid external sources of variability, all the operating parameters were maintained as constant as possible in all treatments. The boom sprayer was calibrated to apply a constant rate of 300 l ha−1.
To ensure the quality of the product distribution, a check of the conventional hydraulic slot nozzles (CHS) status was carried out to eliminate defective nozzles and correct the clogging others at a spray pressure and an engine speed of 2.6 bars and 2000 rpm, respectively. If the average nozzle flow rate was less than the average flow rate −5% and greater than the average flow rate +5%, then the nozzle was changed (Table 2). The spray uniformity coefficient (Cu) was also tested before the treatments to ensure an even distribution over the whole plot passing the sprayer over the green and then measuring the volume collected in containers. The distribution under the nozzles was assessed by collecting the heights of the product applied in containers placed on the lawn following a grid of 1 × 1 m. The volumes applied in containers placed under the nozzles were collected at a 2 bars pressure and a 0.5 m height for the two nozzle sizes to compare their distribution quality.
Cu (%) = 100 (1 − ∑│Zi − ¯Z│/N * ¯Z)
  • Zi: average fungicide level at test tube i (mm);
  • ¯Z: average fungicide level applied to the treated area (mm);
  • N: number of observations.
If Cu < 70%, the distribution should be enhanced; if Cu > 70%, the distribution is uniform.

2.2. Data Collection

Remote sensing evaluations were performed on the grass turf greens in March, April, and May during the springer season of 2021 with the intensive cycles of turf maintenance. Weakened by the winter, the grass on a natural golf course needed special attention to grow as quickly as possible. Mechanical aeration of the soil to stimulate root development and promote fertilizer penetration was performed during this period. The turf should be sufficiently robust since fungal growth was favored. Preventive applications of a fungicide to problem areas were recommended every 10 days, followed by proximal and aerial remote sensing. For ground RGB VIs, vegetation indices were obtained from one picture taken at the ground level for each plot five days after treatment when the effects on the plant appear well (Figure 3). At the ground level, one digital photograph was taken per plot with a Nikon D7500 camera at about 125 cm above the grass canopy at a zenithal angle and focused near the center of each plot. The images were acquired with a resolution of 20.7 megapixels with a focal length of 12 mm with the aperture programmed in automatic mode at a resolution of 7087 × 4724 for a Ground Sample Distance (GSD) of 0.04 cm/pixel. The calibration photos were then imported and divided into the separate color channels of red, green, and blue, and in the CIELab color space as lightness, a*, and b* by the software FIJI. NDVI was measured in March, April, and May of 2021 at almost the same time as RGB data by Sentinel-2 satellite optical sensor with 13 spectral bands R, G, B, and NIR at 10m resolution.

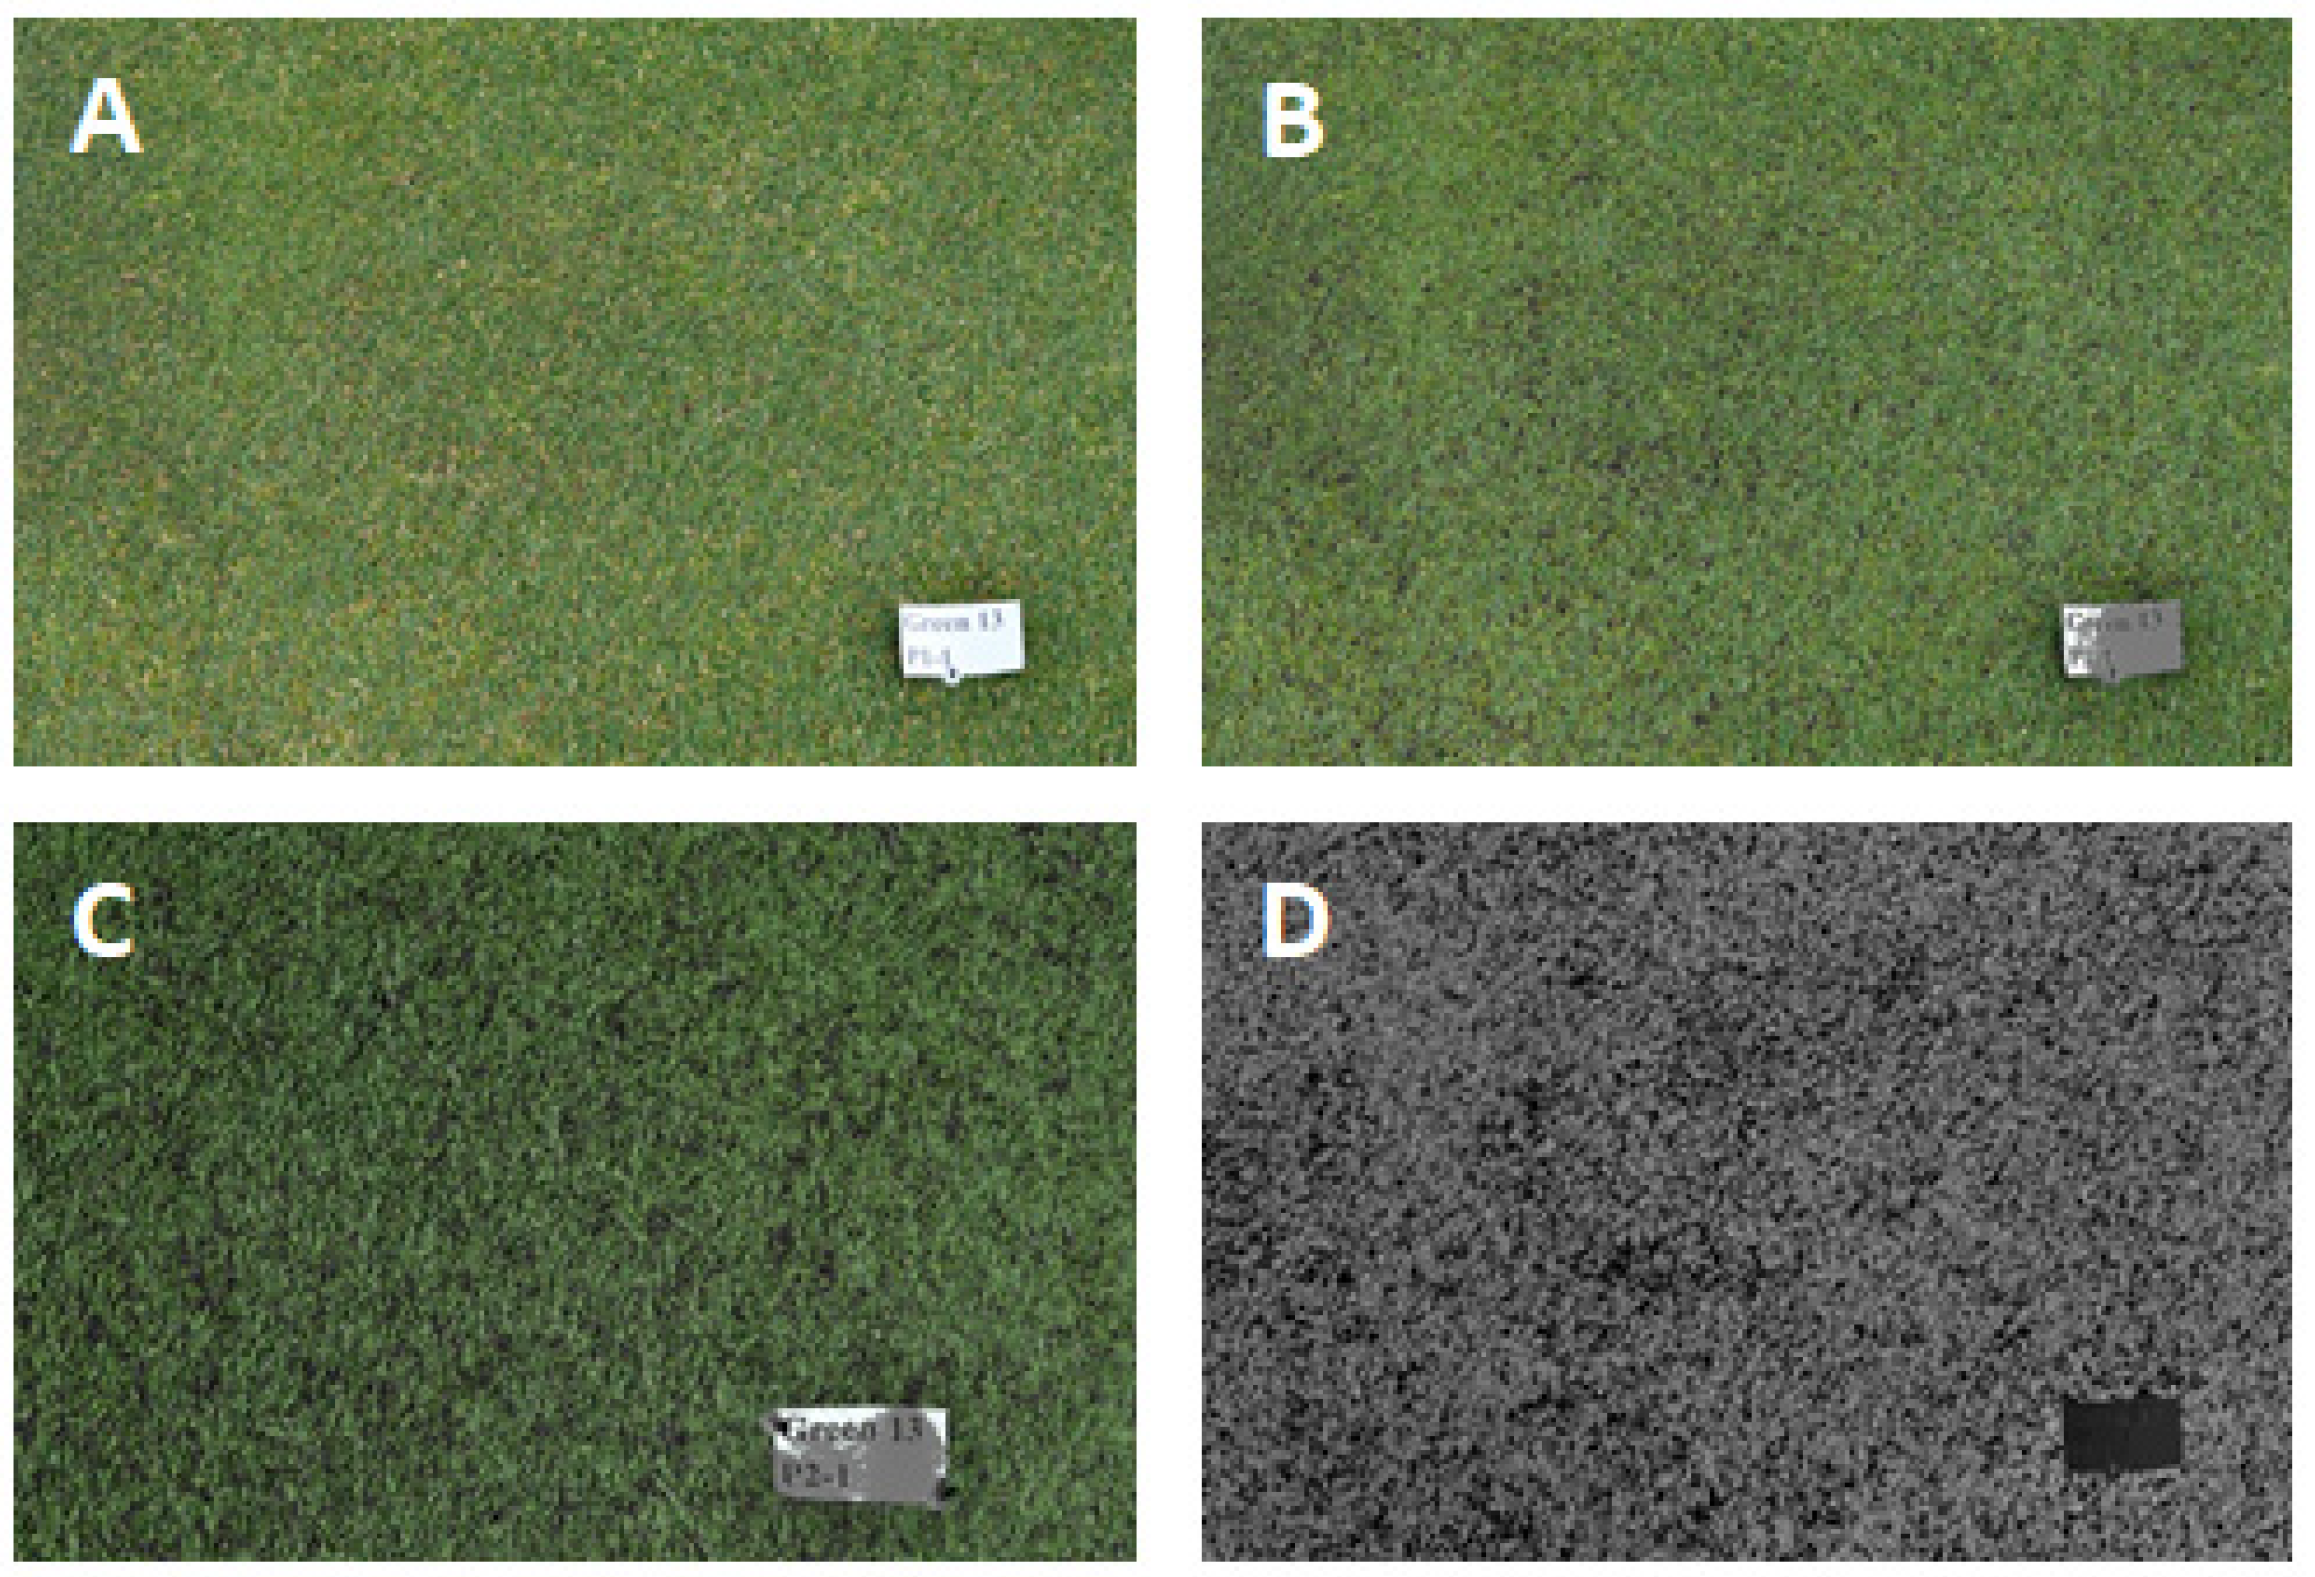
2.3. Image Processing

The ground RGB photos were captured in favorable climatic conditions and subsequently analyzed applying a Breedpix 0.2 software version edited to JAVA8 and incorporated as a section of the MaizeScanner, an open-source and open access FIJI plugin that provides the TGI and NGRDI indices from converted RGB values based on RGB broadband reflectance and also for color measurement from the HSI, CIELab and CIELuv color spaces.
TGI = −0.5 [190 × (R670 − R550) − 120 × (R670 − R480)]
We used digital camera bands of red, green, and blue broadband reflectance focused relatively at 670, 550, and 480 nm, respectively [33].
NGRDI = (R550 − R670)/(R550 + R670)
The absorption of chlorophyll at R670 differs between grass and soil through the difference between green and red light reflectance, knowing that R550 is the reflectance value of the green and R670 is the reflectance value of the red bands of the RGB camera. Considering variances in light intensity, the sum is normalized and ranges from −1.0 to 1.0. Extending from soil to healthy grass, NGRDI alters mainly between −0.2 and 0.5 [14,33,34].
CSI = 100 × (GA − GGA)/GA
CSI was calculated by FIJI software as already mentioned from GA and GGA where GA as a color space index is the percentage of pixels in the hue varying from 60 to 180° and from yellow to bluish-green, whereas GGA varies from 80 to 180° excepting yellowish-green tones that might be partially stressful or senescent [9,24].
The NDVI-Sentinel-2 is the normalized difference of the red and the NIR band, calculated as:
NDVI = (NIR − RED)/(NIR + RED)
NDVI is an effective index for quantifying green vegetation, which normalizes green leaf dispersing in NIR wavelengths via chlorophyll assimilation in red wavelengths. The NDVI values vary from −1 to 1. Negative values conform to water, while values close to zero (−0.1 to 0.1) conform to barren areas. Low and positive values from 0.2 to 0.4 correspond to grassy land, while high values closer to 1 indicate a positive estimate for live green plants of greater biomass [23]. On clear days, the amount of solar radiation scatter is inversely proportional to the fourth power of the wavelength (~λ−4, where λ is wavelength) (Figure 4). The differences in NDVI values among different objects are due to their relative differences in spectral responses (Figure 4).

2.4. Statistical Analysis

The SPSS 17 software was used for establishing statistical analysis. The grass treatments were analyzed using ANOVA and Fisher’s Least Significant Difference (LSD) tests (α = 0.05) to test the effects of spraying conditions on the application efficiency. The results of the canopy level image averages per picture taken at the ground level were compared with the canopy level whole plot averages of the Sentinel-2 images with Pearson correlation coefficients and ANOVA analyses. Correlation coefficients of the different remote sensing indices were additionally compared against NGRDI. Multiple regressions were calculated with NGRDI as the dependent variable and the different indices as independent variables.

3. Results and Discussion

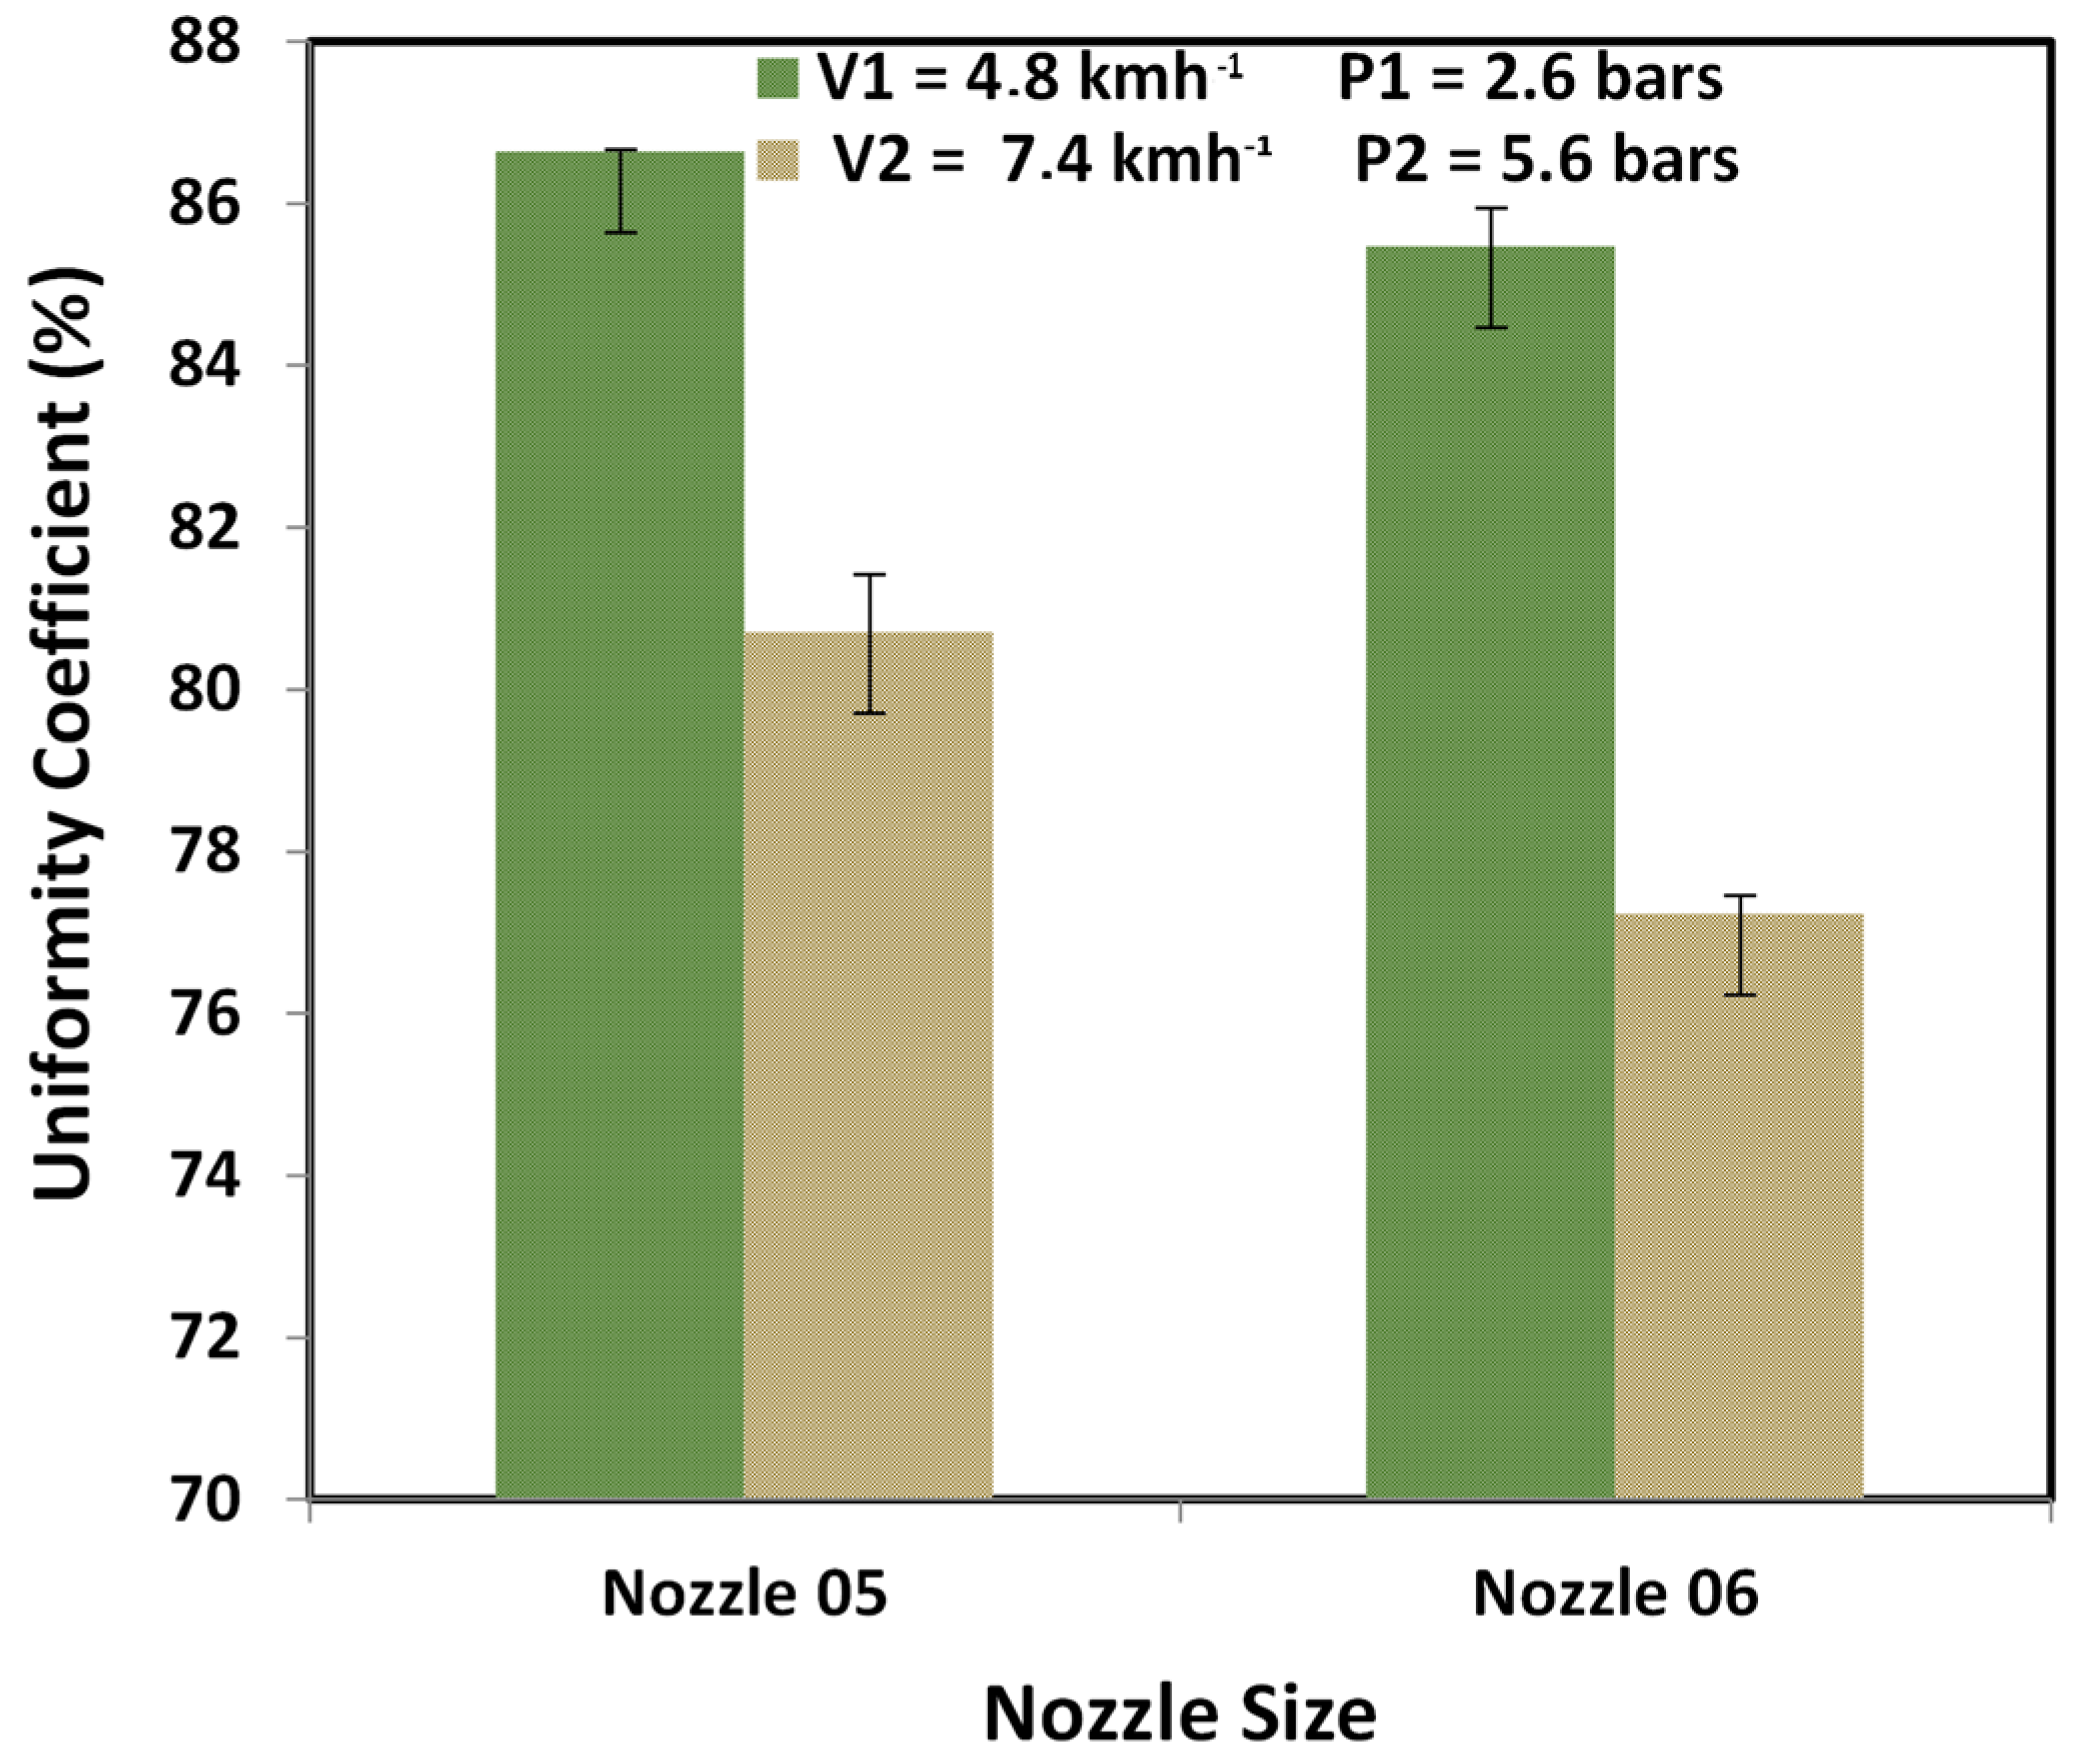
3.1. Nozzle Size and Pressure and Their Effect on the Uniformity Coefficient

The uniformity coefficient was calculated to evaluate the uniformity of the fungicide distribution during spraying using the formula mentioned in Section 2.1. This coefficient was used as an indicator of the performance of spray systems. It varies from 0 to 100%; the closer the coefficient is to 100%, the better the uniformity. According to the obtained results, for the brown nozzle size 05, the uniformity coefficient ranges from 86.64% at a pressure of 2.6 bars to 80.71% when the pressure was increased to 5.6 bars (Figure 5). However, for the second grey nozzle size 06, the variation in the distribution uniformity was greater and decreased from 85.47% at 2.6 bars to 77.23% at 5.6 bars. Consequently, the uniformity coefficient was sensitive to the pressure variation presenting an increased risk of drift with an increase in tractor forward speed for the two tested nozzles. The pressure is one of the variables that influence the spray characteristics [37], while its influence on kinetic energy distribution has rarely been mentioned [38]. It can be seen that the uniformity coefficient decreased with increasing working pressure. The statistical analysis demonstrates that working pressure and nozzle size have a significant effect on uniformity (p < 0.01).

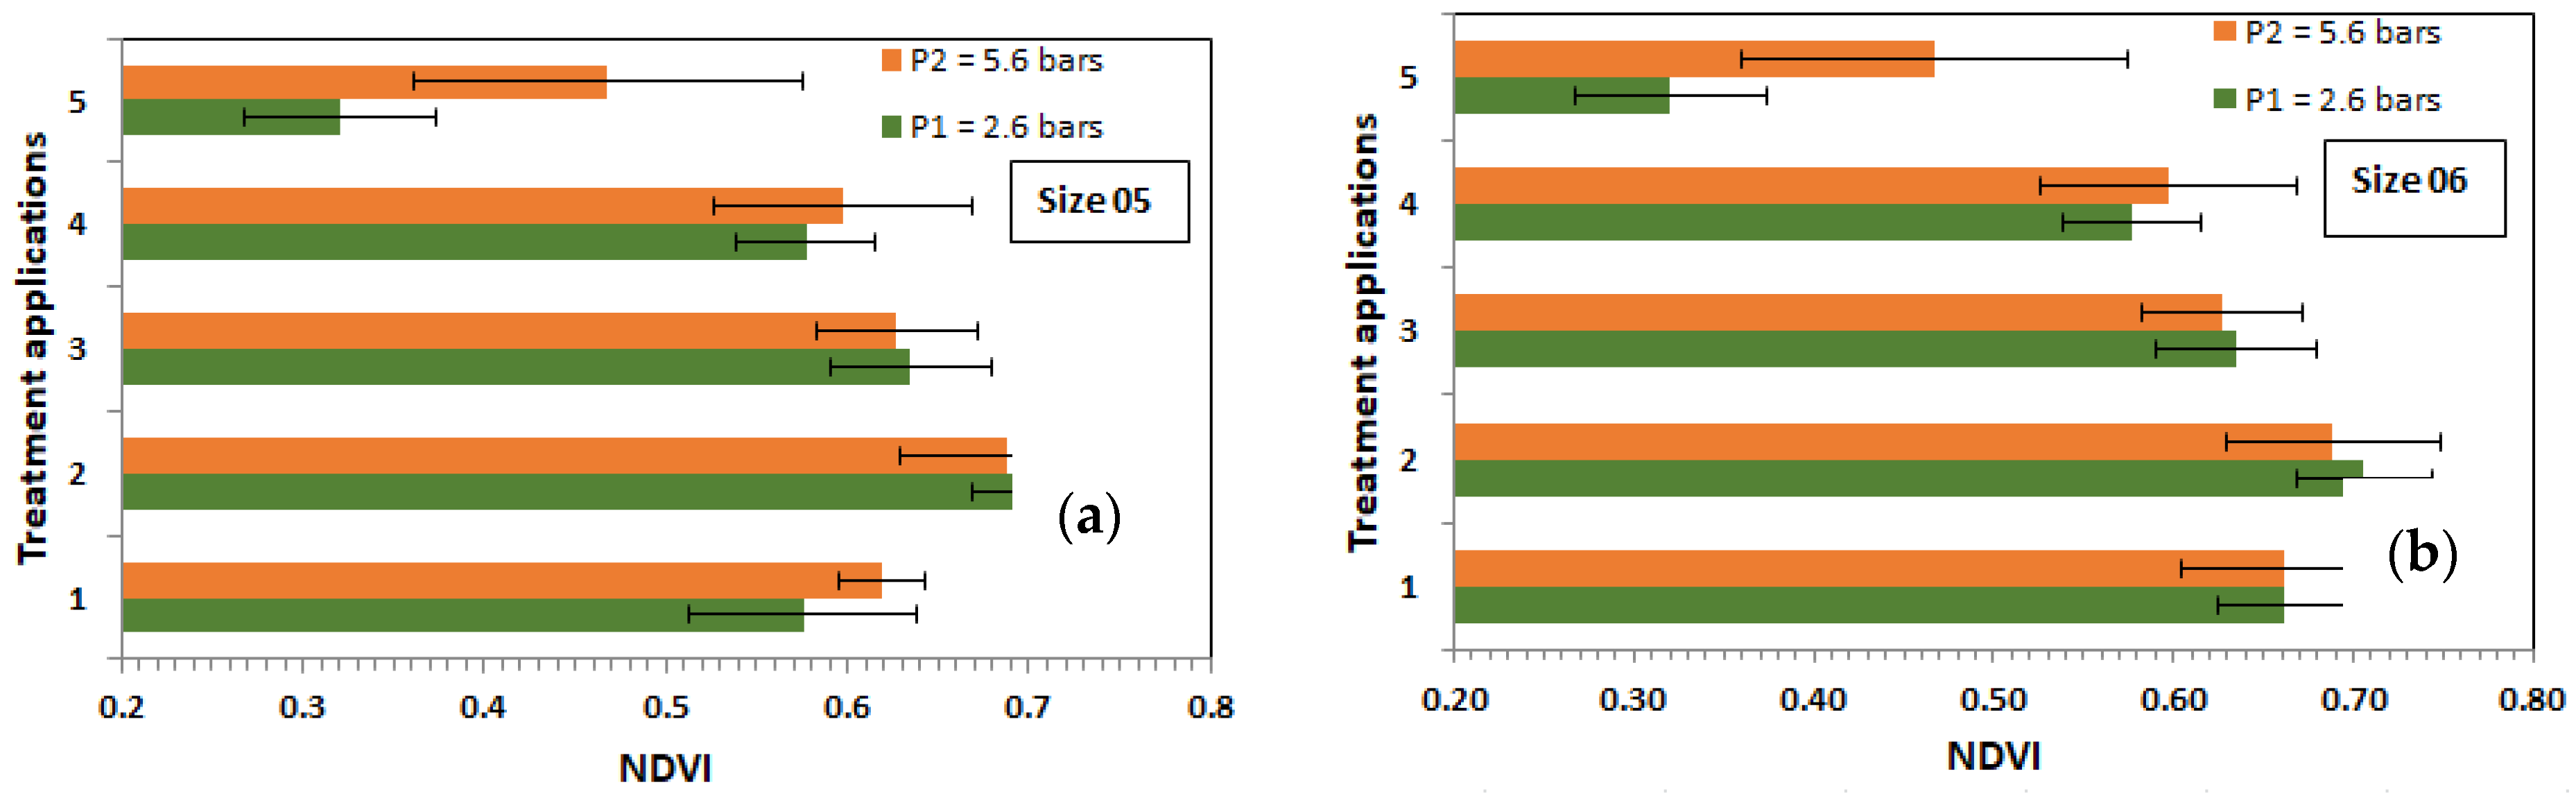
3.2. Effect of Nozzle Size on the Distribution Quality

Figure 6 shows that increasing the nozzle size was accompanied by increased spray rates and an increase in droplet size. In fact, the theoretical nozzle flow rate depends on the nozzle type and pressure. The type of nozzle is itself a function of the technical characteristics, including its size [11,39]. Irregular distribution of the spray mixture was noticed on the ground, which is why, for a boom equipped with this type of nozzle, an overlap between the contiguous jets is planned to compensate for this lack of spray mixture. This difference could be explained by the principle according to which the two types of nozzles work. In fact, for hydraulic slot nozzles, the reduction of the drift risk is achieved by operating at a low pressure to limit the production of fine droplets. However, it is reported that one of the direct consequences of limiting the working pressure is the reduction of the spray width. When changing from size 05 to size 06, the homogeneity of the sprayed liquid is affected. This decrease in distribution quality is related to the droplet size. For the size 06 and with a relatively low pressure of 2 bars, the spray becomes very sharp with a high volume of liquid collected at the nozzle axis, which explains the decrease of the treatment efficiency.

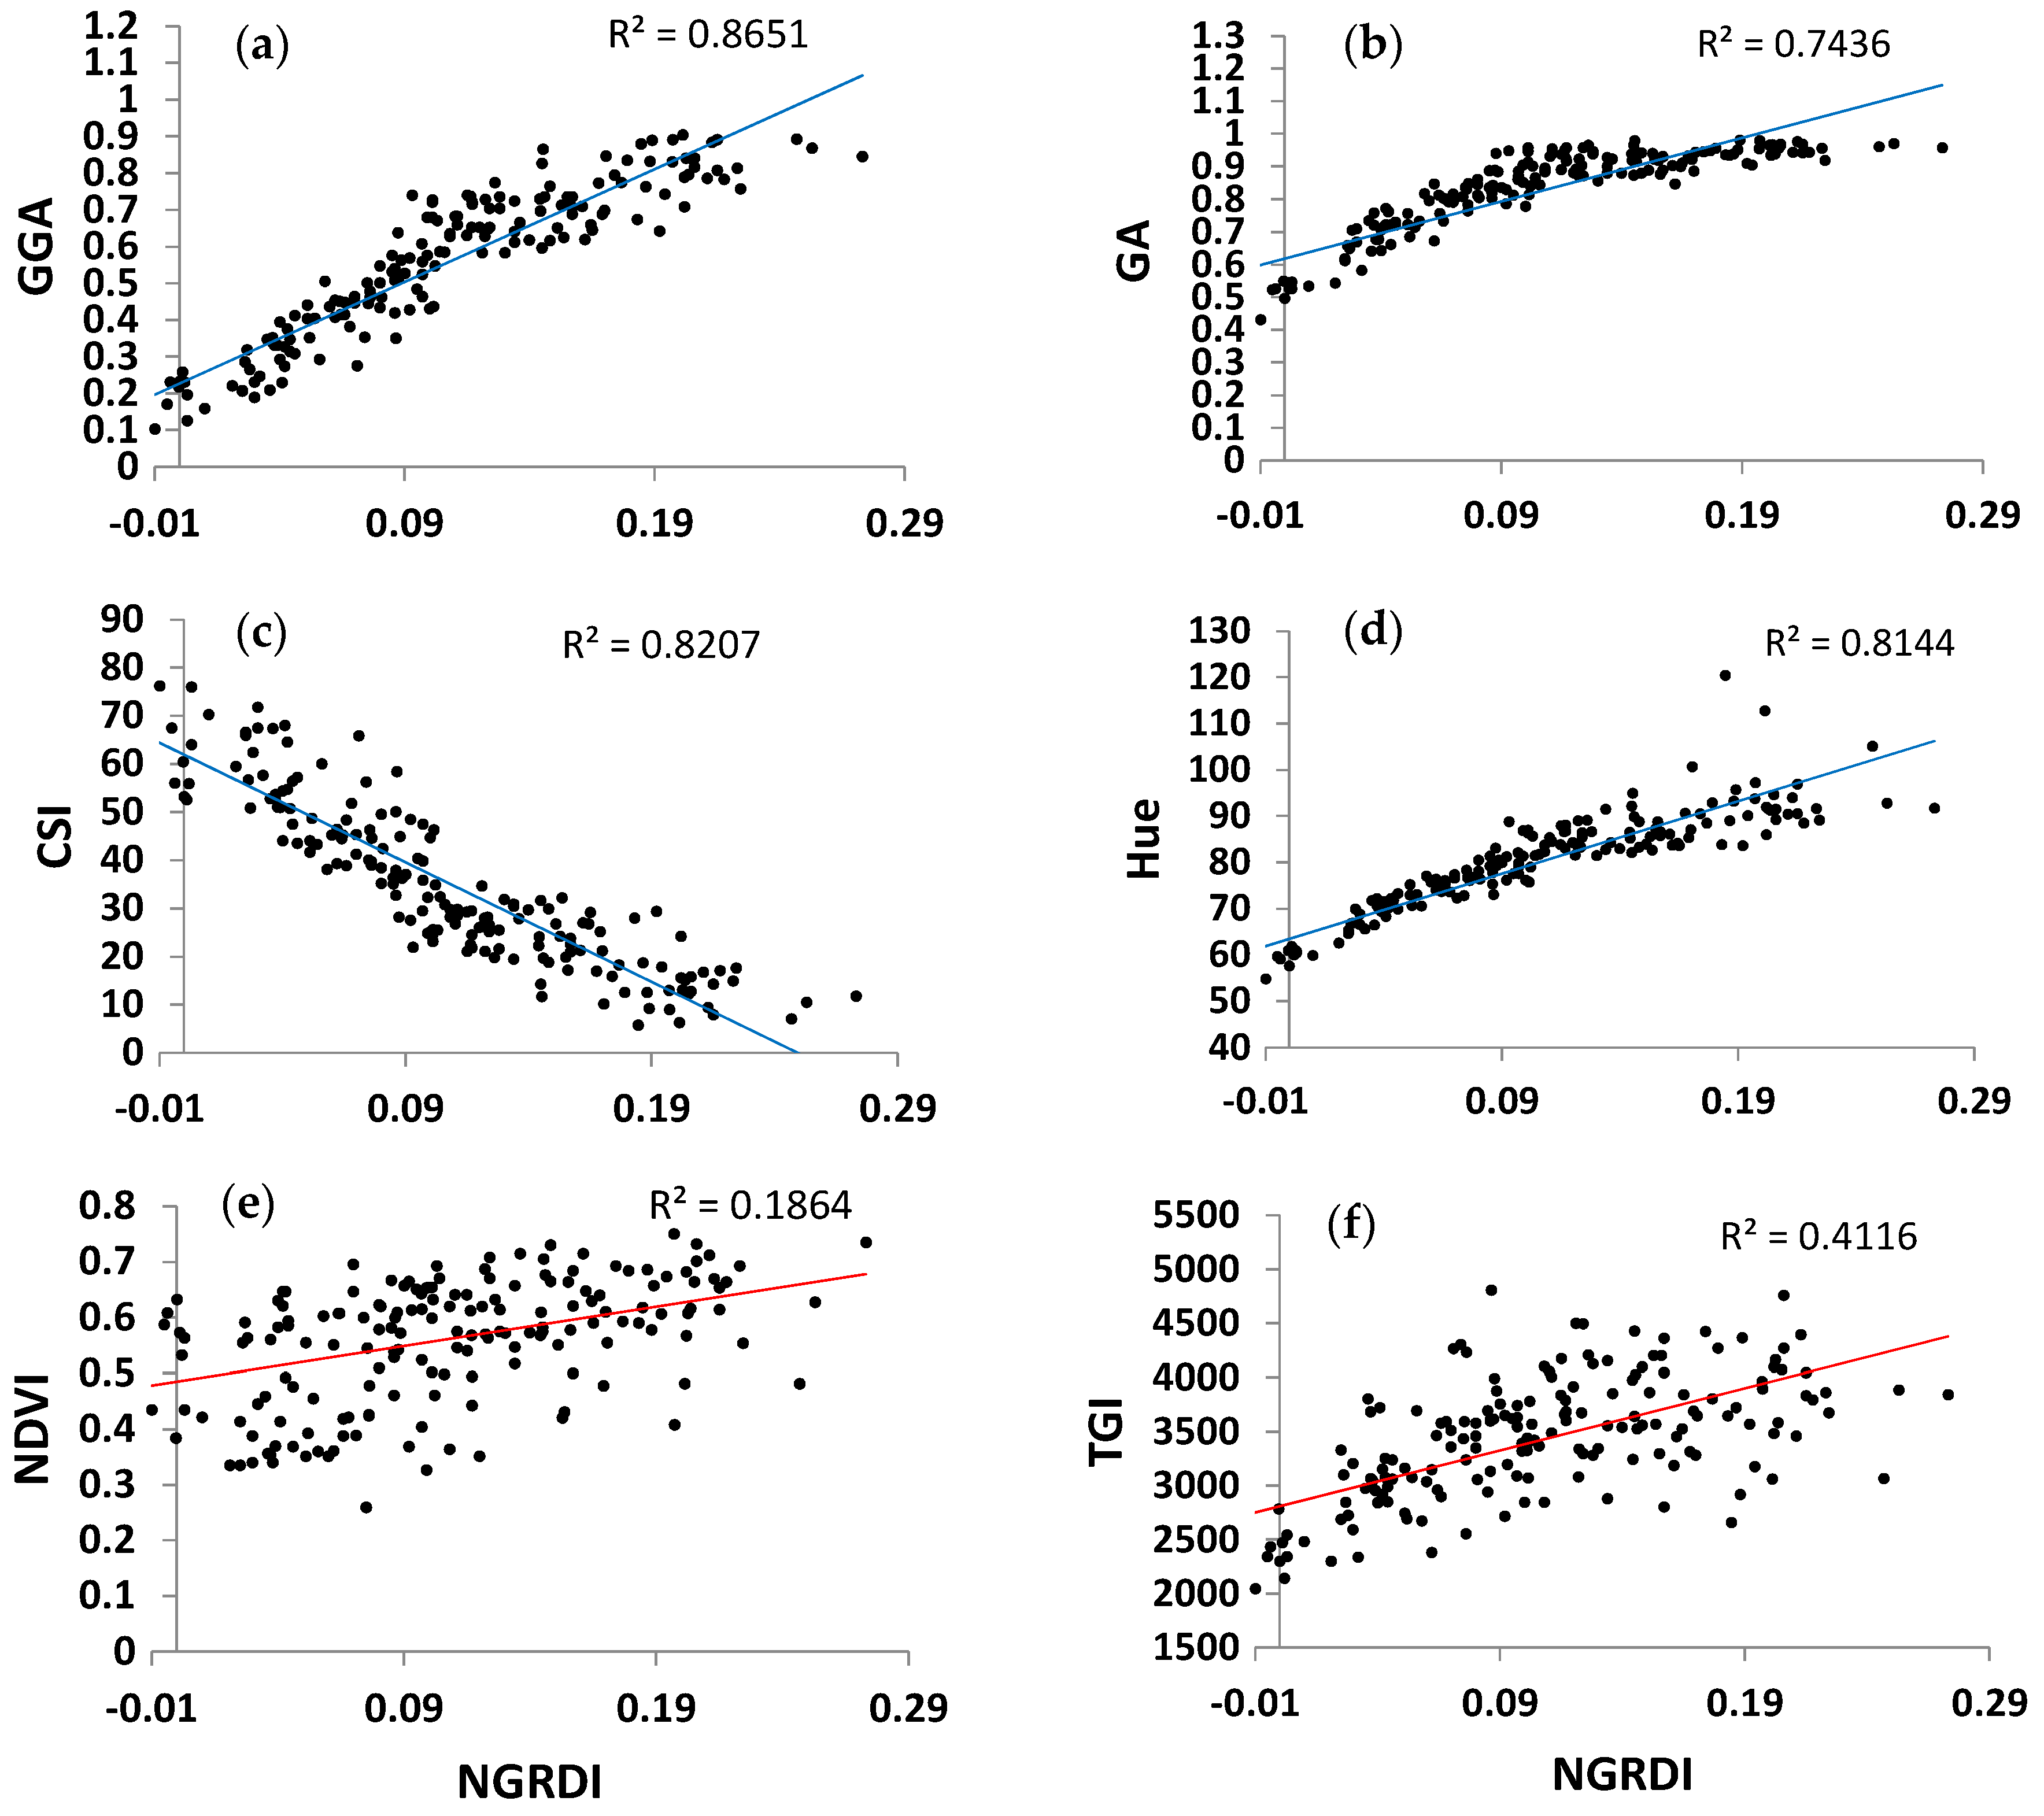
3.3. The Performance of Remote Sensing Indices Assessing Grass Healthy Status

Table 3 shows an increase of the GA index with the decrease of pressure and nozzle size. The average value ranged from 0.812 to 0.824 when the spray pressure decreased from 5.6 bars to 2.6 bars. GA average values also ranged from 0.795 to 0.841 when the nozzle size decreased from 06 bars to 05 bars. The photosynthetically active area, excluding senescent leaves, was captured by the GGA index. The GGA values following the different fungal treatments increased, especially after the second treatment operation, and reached a maximum value of 0.67 and a minimum value at the 4th treatment of 0.278. These results are in agreement with those reported by Boukhalfa et al. [13]—that the spray pressure has a direct effect on drift and thus on treatment efficiency and liquid uptake. An increase in tractor forward speed and pressure makes the droplets more and more sensitive to the microclimate. Indeed, the diameter of the droplets forming the spray spectrum can range from about 10 microns for the smallest to 800 microns or more for the largest. The finest droplets are very sensitive to drift, even in calm weather. They remain suspended in the air for a longer period because of their reduced mass and low speed. They are more constrained in their fall by aerodynamic friction forces and are therefore affected by air movement and weather conditions [10]. The CSI values tend to be higher following the 4th treatment operation of 57.127 at a low pressure of 2.6 bars.
Mechanical aeration of the turfgrass green favored the water and air penetration, reduced undesirable effects, stimulated the root development and tillering of the plant, and promoted the soil microbial activity, thus accelerating the organic matter decomposition. Similarly, aeration improved the density of the turf and increased the flexibility and elasticity of the plant cover, which accelerated the soil drying after rain or irrigation, provided easier access to nutrients, and improved disease resistance, justifying the decrease of GGA value following this maintenance operation. TGI index estimates the vegetation fraction of cultivated land, monitoring crop health or the crop chlorophyll content. Following the obtained results, the higher pressure of 5.6 bars decreased the grass chlorophyll content from 4500 and the 2500 TGI index with a maximum noted in treatment 2 and a minimum in treatment 5. For the two nozzle sizes, 05 and 06, NGRDI varied from 0.117 to 0.089, respectively. NDVI values were obtained from Sentinel-2 images processing using the QGIS software (Figure 7). NDVI results tend to decrease until 0.3 following the 5th treatment using the nozzle size 06. Borge et al. [40] proved that the variation of NDVI values is due to identifying some rust-infected areas in the Sentinel-2 multispectral images. These results coincide with those of Huang et al. [23] who showed that the NDVI application allows highlighting spectral differences, including turfgrass quality and color.
Table 4 mentioned the correlation between pressure, nozzle size, vegetation indices and levels of significance and showed that the sprayer parameters had a significant effect on the studied remote sensors variables from RGB and Sentinel-2 images. The highest averages were obtained at low pressure and size (Table 3). The NGRDI closely related to vegetation presence or vigor is used as a low-cost alternative to NDVI and considers the spectral characteristics of healthy green vegetation. This index is an effective way of detecting the green state of plants. It has the same principle as NDVI, but different bands are used. This is why we chose to use the NGRDI as a reference index to reduce the use of pesticides more gradually.
GA and GGA quantify the portion of green pixels to the total pixels of the image and is a reliable estimation of vegetation cover. The values of GA were consistently below 60%. Advances in digital photography allow for sufficiently high resolution for low-altitude aerial imaging to be a viable and economical monitoring tool for agriculture [41]. Additionally, other research showed higher correlations between RGB VIs and yield previous than NDVI under frequent data acquisitions during the crop growing cycle [42]. The RGB and NDVI data acquisition was promising, which may reduce the use of pesticides on grassy swards over better treatment efficiency.

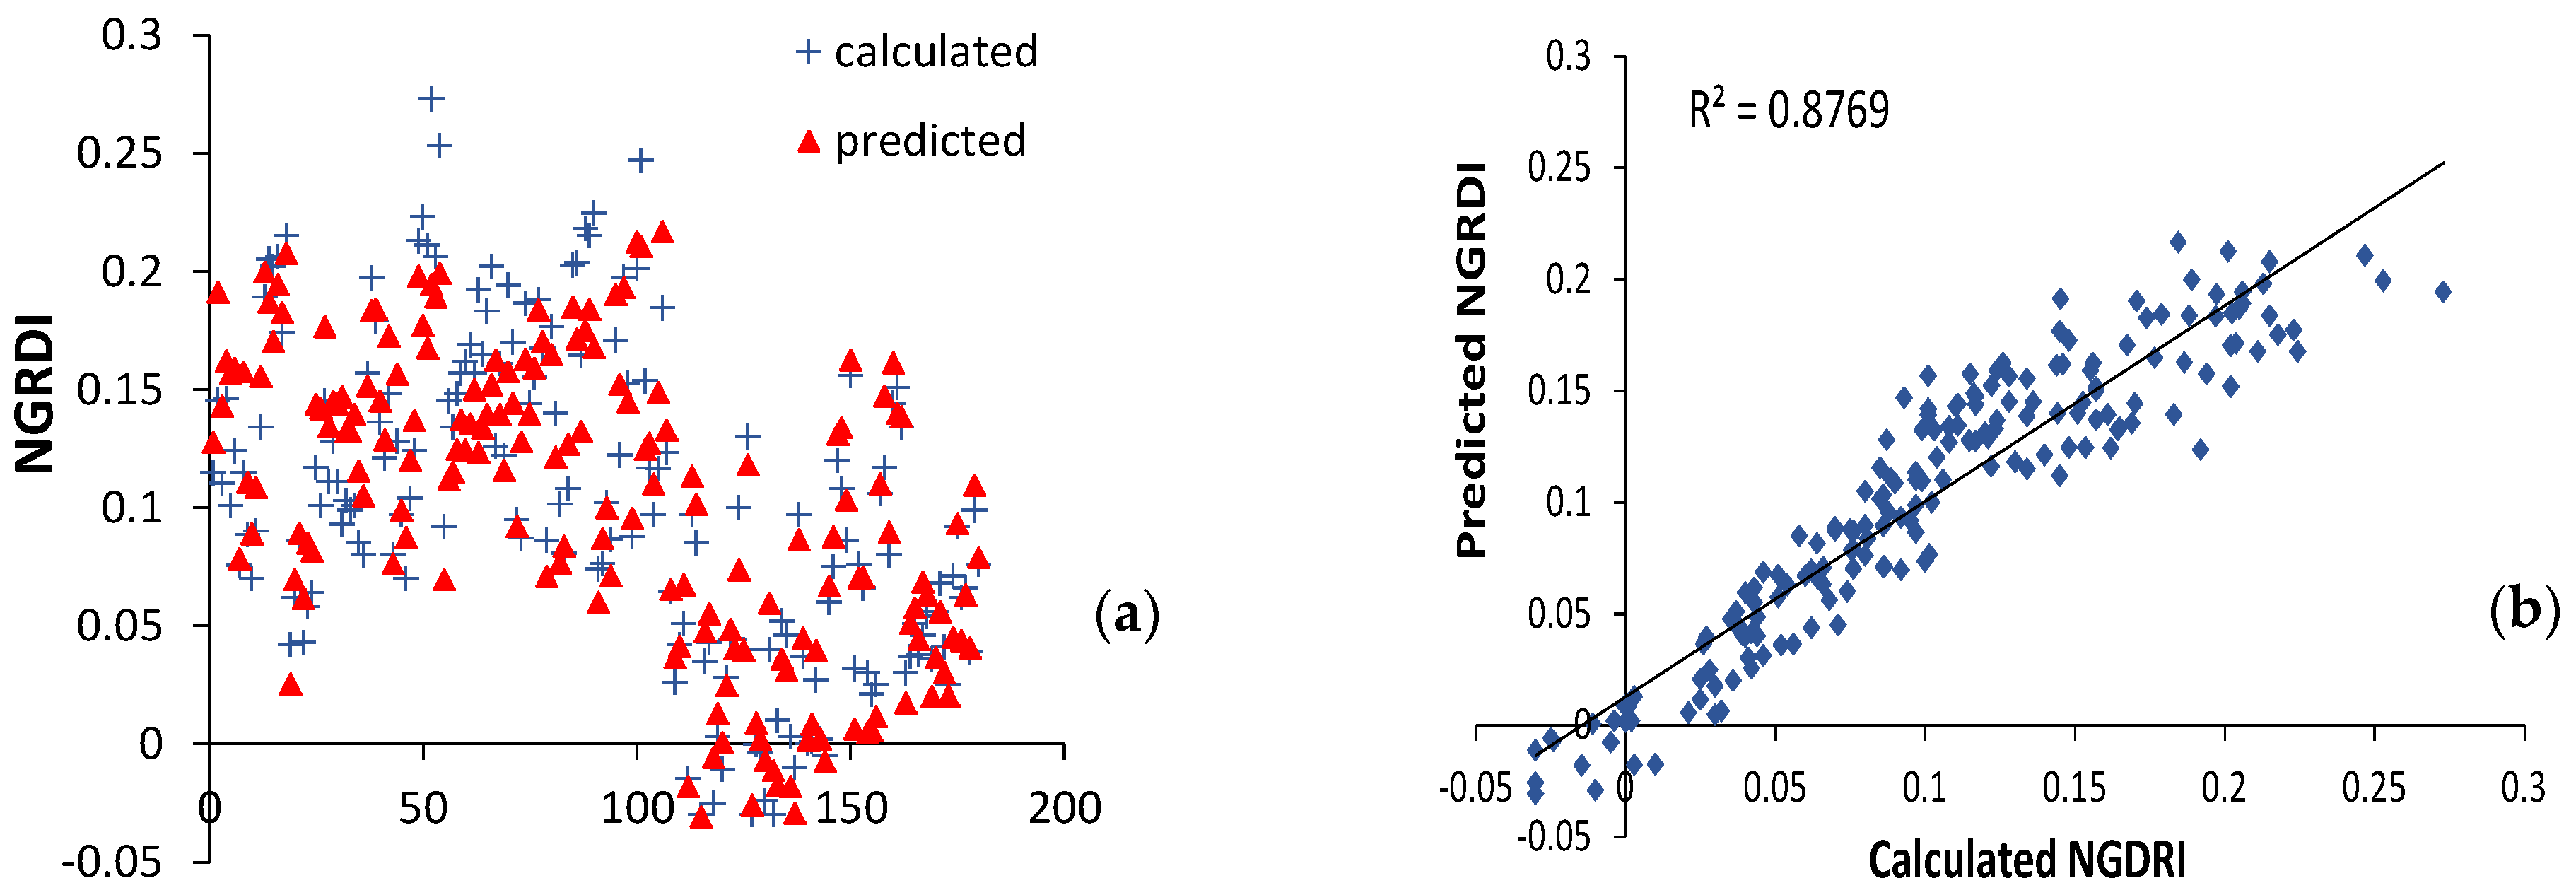
3.4. Multiple Linear Regression (MLR) Model

The summary of statistical characteristics of the data in NGRDI estimation is presented in Table 5. Hue values ranged between 48.371 and 120.353, with an average value of 79.568, which plays an important role in green NGRDI. Increased spray pressure and nozzle size can decrease NGRDI and make the treatment application less efficient. GGA and NDVI ranged between 0.056 and 0.904 and from 0.259 to 0.750, respectively. MLR is one of the statistical methods which attempts to model the correlation between involving RGB and multispectral variables and the response variable depending on linear equation into the observed data. The MLR model (Table 6) is:
NGRDI = Pressure × 0.08 + Size × 0.05 + Hue × 0.02 a × 0.01 + u × 0.01 + GGA × 0.248 + NDVI × 0.09 0.301
To estimate the efficiency of the used fungicide treatment application and the health status of the green through NGRDI, results of ANOVA and regression analysis of the selected input dataset using a standard Akaike information criterion (AIC) selection criterion are shown in Table 6. We further display the determination coefficient (R2), and the root mean squared error (RMSE). The presented model was significant at the p < 0.001 level.
Combining the spray data, remote sensing indices provided little improvement in the multivariate model explaining the application efficiency and the turfgrass health status using NGRDI, which may help to choose the suitable pressure and nozzle size in fungicide applications, thus reducing the use of pesticides and costs and mitigating the contribution to climate change. Thus, the implementation of ground RGB VIs combined with some operating spray parameters can result in substantial time cost savings, particularly when applied on a large scale.
Figure 8 and Figure 9 showed the relationship between remote sensing variables from RGB and Sentinel images, between the normalized green-red difference index (NGRDI) and input dataset since NGRDI was closely related to vegetation presence or vigor. It was used as a low-cost alternative and considered the spectral characteristics of healthy green vegetation. This index was an effective way of detecting the green state of plants. This is why we studied the relationship between the selected input data to predict NGRDI (selected as a relevant indicator of the spray treatment efficiency in the present research) from selected RGB indices, multispectral indices and spray parameters. Correlations between input indices were good. The highest correlation was obtained with GGA. The impacts of the percentage of pixels in the image in the hue range from 80° to 180°, and the hue on the grass healthy green were linear. So, they could be employed to predict NGRDI by MLR. The obtained results (Figure 9 and Table 6) showed that the MLR model had an agreeable prediction performance.
RGB VIs have been used extensively for crop management as well as crop breeding in a similar fashion, though the authors know of no research to date combining RGB VIs and nozzle size or tractor speed in a turfgrass study. In application to low-N phenotyping in maize by Buchaillot et al. in 2019 [14], viable uses of RGB color image analyzes from the ground or UAVs presented potential profits compared with currently used field sensors, specifically relative to the high quality of the RGB sensor calibrations directly from the factory and the time costs when applying to larger breeding platforms. Kefauver et al. in 2017 [29] showed that multivariate regression models explained 77.8, 71.6, and 82.7% of the variance in yield from the aerial, ground, and combined data sets, respectively, in a study applied to barley in Spain. Gracia-Romeo et al., 2018 [25] demonstrated the applicability of remote sensing approaches based on RGB images to assessing crop performance and hybrid choice combined with sustainable management practices. The results of previous studies using RGB VIs and comparisons with NDVI from multispectral sensors is comparable to the study presented here when applied to similar crops, though without the additional precision agriculture component included in this study.

4. Conclusions

Assessing golf course turfgrass quality using image processing methods and depending on different spray parameters has been highlighted here using simple and economical modern remote sensing information acquisition and monitoring technologies. Multispectral and RGB image-based vegetation indices showed good correlations, with NGRDI selected as the most relevant indicator to monitor the treatment efficiency and, therefore, the turf quality as a function of spray pressure, nozzle size, and forward speed. So, these different intertwined application mechanical properties were employed to predict NGRDI, as the best indicator of turfgrass health, by MLR to derive further insights. In fact, the treatment uniformity coefficient decreased with increasing working pressure and ranged from 86.64% at 2.6 bars to 80.71% at 5.6 bars for the size 0.5. The nozzle size also affected the treatment distribution quality. Using the nozzle size 0.6 increased the spray volume and the droplet size and therefore decreased the distribution quality and consequently the treatment efficiency. Regarding the GA index, the average value increased at the low pressure 2.6 bars and the size 0.5. The CSI values further increased to 57.127, following the low-pressure use. Moreover, the higher pressure of 5.6 bars decreased the grass chlorophyll from 4500 and 2500 through the TGI index. For the two nozzle sizes 05 and 06, NGRDI varied from 0.117 to 0.089, respectively. NDVI results equally tended to decrease until 0.3 using the size 0.6. The MLR model had an agreeable NGRDI prediction performance with an RMSE of 0.023 and a high correlation coefficient (R2 = 0.88). In summary, good results were obtained for estimating turfgrass vigor as a function of various treatment management parameters with the support of remote sensing technologies at different scales.

Author Contributions

K.A. led the writing, the statistical analyses of the manuscript, and coordinated the research project; N.E.H.B. led the design of the experimental trials and figure preparation; K.A., S.C., S.D., R.A. and S.C.K. contributed to the majority of the critical revision of the manuscript text. K.A., N.E.H.B. and M.B. all contributed significantly to the RGB. and multispectral data acquisition, data processing, and experimental data interpretation; M.L.B. and J.S. provided the FIJI software and led data processing techniques; N.T. Laboratory supervisor. All authors have revised the work for intellectual content and have contributed to and approved the final content. All authors have read and agreed to the published version of the manuscript.

Funding

This study was supported by the Higher Institute of Agricultural Sciences, University of Sousse, and the Research Laboratory Organic and Conventional Horticultural Species Management (LR21 AGR05). S.D. thanks F.R.S.-FNRS for financial support as a FNRS Senior Research Associate. S.C.K. is supported by the Ramon y Cajal RYC-2019-027818-I research fellowship from the Ministerio de Ciencia e Innovación, Spain.

Institutional Review Board Statement

Not applicable.

Informed Consent Statement

Not applicable.

Data Availability Statement

Not applicable.

Acknowledgments

The authors are grateful to the administrative and technical staff of the Hammamet Golf Course for their valuable support on the field trials.

Conflicts of Interest

The authors declare no conflict of interest.

Abbreviations

GPSGlobal positioning system
GNSSGlobal navigation satellite systems
VRTVariable-rate technology
RGBRed-green-blue
HTPPHight throughput plant phenotyping
VNIRVisible and near-infrared
NDVINormalized difference vegetative index
RGB VIsRed–green–blue vegetation indices
TIRThermal infrared
NGRDINormalized green–red difference index
TGITriangular greenness index
HISHue–intensity–saturation
HHue
GAGreen area
GGAGreener green area
CSICrop senescence index
BPSBoom pressure sprayer
CHSConventional hydraulic slot nozzle
CuUniformity coefficient
FLFlow rate
NIRNear-infrared
ANOVAAnalyses of variance
R2Determination coefficient
RMSERoot mean squared error
MLRMultiple linear regression
UAVUncrewed aerial vehicle

References

  1. Pontes, L.; Maire, V.; Schellberg, J.; Louault, F. Grass strategies and grassland community responses to environmental drivers: A review. Eur. J. Plant Pathol. 2015, 35, 1297–1318. [Google Scholar]
  2. Pepitone, J. Hacking the farm: How farmers use “digital agriculture” to grow more crops. CNN Money 2016. Available online: https://money.cnn.com/2016/08/03/technology/climate-corporation-digital-agriculture/index.html (accessed on 3 August 2016).
  3. Grell, M.; Barandun, G.; Asfour, T.; Kasimatis, M.; Collins, A.; Wang, J.; Guder, F. Determining and Predicting Soil Chemistry with a Point-of-Use Sensor Toolkit and Machine Learning Model. bioRxiv 2020, 9, 1–27. [Google Scholar] [CrossRef]
  4. McBratney, A.; Whelan, B.; Ancev, T. Future Directions of Precision Agriculture. Precis. Agric. 2005, 6, 7–23. [Google Scholar] [CrossRef]
  5. Whelan, B.M.; McBratney, A.B. Definition and Interpretation of potential management zones in Australia. In Proceedings of the 11th Australian Agronomy Conference, Geelong, Victoria, 2–6 February 2003; pp. 2–6. [Google Scholar]
  6. Schieffer, J.; Dillon, C. The economic and environmental impacts of precision agriculture and interactions with agro-environmental policy. Precis. Agric. 2015, 16, 46–61. [Google Scholar] [CrossRef]
  7. Sophocleous, M.; Georgiou, J. Precision agriculture: Challenges in sensors and electronics for real-time soil and plant monitoring. In Proceedings of the IEEE BIOCAS 2017 Biomedical Circuits and Systems Conference, Torino, Italy, 19–21 October 2017; pp. 1–4. [Google Scholar]
  8. Sophocleous, M. IoT Thick-Film Technology for Underground Sensors in Agriculture. 2016. Available online: https://www.fierceelectronics.com/components/iot-thick-film-technology-for-underground-sensors-agriculture (accessed on 23 November 2021).
  9. Kefauver, S.C.; El-Haddad, G.; Vergara-Diaz, O.; Araus, J.L. RGB picture vegetation indexes for High-Throughput Phenotyping Platforms (HTPPs). In Proceedings of the SPIE Conference on Remote Sensing for Agriculture, Ecosystems, and Hydrology XVII, Toulouse, France, 22–24 September 2015. [Google Scholar]
  10. Ouled Taleb Salah, S.; Duchesne, A.; De Cock, N.; Massinon, M.; Sassi, K.; Abrougui, K.; Lebeau, F.; Dorbolo, S. Experimental investigation of a round jet impacting a disk engraved with radial grooves. Eur. J. Mech. B Fluids 2018, 72, 302–310. [Google Scholar] [CrossRef] [Green Version]
  11. Ouled Taleb Salah, S.; De Cock, N.; Massinon, M.; Schiffers, B.; Dorbolo, S.; Lebeau, F. Étude des potentialités des systèmes d’application contrôlée des gouttes (CDA) pour les traitements phytosanitaires en céréaliculture (synthèse bibliographique). Biotechnol. Agron. Société Environ. 2016, 20, 287–298. [Google Scholar] [CrossRef]
  12. Rioboo, R.; Voué, M.; Vaillant, A.; De Coninck, J. Drop impact on porous superhydrophobic polymer surfaces. Langmuir 2008, 24, 14074–14077. [Google Scholar] [CrossRef]
  13. Boukhalfa, H.; Massinon, M.; Belhamra, M.; Lebeau, F. Contribution of spray droplet pinning fragmentation to canopy retention. Crop Prot. 2014, 56, 91–97. [Google Scholar] [CrossRef]
  14. Buchaillot, M.L.; Gracia-Romero, A.; Vergara-Diaz, O.; Mainassara, A.; Tarekegne, A.; Cairns, J.E.; Boddupalli, M.P.; Araus, J.L.; Kefauver, S.C. Evaluating Maize Genotype Performance under Low Nitrogen Conditions Using RGB UAV Phenotyping Techniques. Sensors 2019, 19, 1815. [Google Scholar] [CrossRef] [Green Version]
  15. Masuka, B.; Araus, J.L.; Das, B.; Sonder, K.; Cairns, J.E. Phenotyping for Abiotic Stress Tolerance in Maize. J. Integr. Plant Biol. 2012, 54, 238–249. [Google Scholar] [CrossRef] [PubMed]
  16. Araus, J.L.; Cairns, J.E. Field high-throughput phenotyping: The new crop breeding frontier. Trends Plant Sci. 2014, 19, 52–61. [Google Scholar] [CrossRef] [PubMed]
  17. Bänziger, M.; Edmeades, G.O.; Beck, D.; Bellon, M. Breeding for Drought and Nitrogen Stress Tolerance in Maize: From Theory to Practice; CIMMYT: El Batán, Mexico, 2000; Available online: https://repository.cimmyt.org/bitstream/handle/10883/765/68579.pdf?sequence=1&isAllowed=y (accessed on 23 November 2021).
  18. Carter, G.A. Reflectance wavebands and indices for remote estimation of photosynthesis and stomatal conductance in pine canopies. Remote Sens. Environ. 1998, 63, 61–72. [Google Scholar] [CrossRef]
  19. Chappelle, E.W.; Kim, M.S.; McMurtrey, J.E., III. Ratio analysis of reflectance spectra (RARS): An algorithm for the remote estimation of the concentrations of chlorophyll A, chlorophyll B, and carotenoids in soybean leaves. Remote Sens. Environ. 1992, 39, 239–247. [Google Scholar] [CrossRef]
  20. Tucker, C.J. Red and photographic infrared linear combinations for monitoring vegetation. Remote Sens. Environ. 1979, 8, 127–150. [Google Scholar] [CrossRef] [Green Version]
  21. Thenkabail, P.S.; Smith, R.B.; De Pauw, E. Hyperspectral vegetation indices and their relationships with agricultural crop characteristics. Remote Sens. Environ. 2000, 71, 158–182. [Google Scholar] [CrossRef]
  22. Thenkabail, P.S.; Smith, R.B.; De Pauw, E. Evaluation of narrowband and broadband vegetation indices for determining optimal hyperspectral wavebands for agricultural crop characterization. Photogramm. Eng. Remote Sens. 2002, 68, 607–622. [Google Scholar]
  23. Huang, S.; Tang, L.; Hupy, J.P.; Wang, Y.; Shao, G. A commentary review on the use of normalized difference vegetation index (NDVI) in the era of popular remote sensing. J. For. Res. 2021, 32, 1–6. [Google Scholar] [CrossRef]
  24. Vergara-Diaz, O.; Kefauver, S.C.; Elazab, A.; Nieto-Taladriz, M.T.; Araus, J.L. Grain yield losses in yellow-rusted durum wheat estimated using digital and conventional parameters under field conditions. Crop. J. 2015, 3, 200–210. [Google Scholar] [CrossRef] [Green Version]
  25. Gracia-Romero, A.; Vergara-Díaz, O.; Thierfelder, C.; Cairns, J.E.; Kefauver, S.C.; Araus, J.L. Phenotyping Conservation Agriculture Management Effects on Ground and Aerial Remote Sensing Assessments of Maize Hybrids Performance in Zimbabwe. Remote Sens. 2018, 10, 349. [Google Scholar] [CrossRef] [Green Version]
  26. Deshpande, A.; Razmjooy, N.; Estrela, V. Introduction to Computational Intelligence and Super-Resolution. In Computational Intelligence Methods for Super-Resolution in Image Processing Applications; Springer International Publishing: Cham, Switzerland, 2021; pp. 3–23. ISBN 978-3-030-67921-7. [Google Scholar]
  27. Casadesús, J.; Kaya, Y.; Bort, J.; Nachit, M.M.; Araus, J.L.; Amor, S.; Ferrazzano, G.; Maalouf, F.; Maccaferri, M.; Martos, V. Using vegetation indices derived from conventional digital cameras as selection criteria for wheat breeding in water-limited environments. Ann. Appl. Biol. 2007, 150, 227–236. [Google Scholar] [CrossRef]
  28. Zaman-Allah, M.; Vergara, O.; Araus, J.L.; Tarekegne, A.; Magorokosho, C.; Zarco-Tejada, P.J.; Cairns, J. Unmanned aerial platform-based multi-spectral imaging for field phenotyping of maize. Plant Methods 2015, 11, 35. [Google Scholar] [CrossRef] [Green Version]
  29. Kefauver, S.C.; Vicente, R.; Vergara-Díaz, O.; Fernandez-Gallego, J.A.; Kerfal, S.; Lopez, A.; Melichar, J.P.E.; Serret Molins, M.D.; Araus, J.L. Comparative UAV and Field Phenotyping to Assess Yield and Nitrogen Use Efficiency in Hybrid and Conventional Barley. Front. Plant Sci. 2017, 8, 01733. [Google Scholar] [CrossRef] [PubMed]
  30. Pinter, P.J.; Hatfield, J.L.; Schepers, J.S.; Barnes, E.M.; Moran, M.S.; Daughtry, C.S.T.; Upchurch, D.R. Remote Sensing for Crop Management. Photogramm. Eng. Remote Sens. 2003, 69, 647–664. [Google Scholar] [CrossRef] [Green Version]
  31. El-Shikha, D.M.; Barnes, E.M.; Clarke, T.R.; Hunsaker, D.J.; Pinter, P.J.; Waller, P.M.; Thompson, T.L. Remote sensing of cotton nitrogen status using the canopy chlorophyll content index (CCCI). Trans. ASABE 2008, 51, 73–82. [Google Scholar] [CrossRef]
  32. Trussell, H.J.; Vrhel, M.J.; Saber, E. Color image processing. IEEE Signal Process. Mag. 2005, 22, 14–22. [Google Scholar] [CrossRef]
  33. Hunt, E.R.; Doraiswamy, P.C.; McMurtrey, J.E.; Daughtry, C.S.T.; Perry, E.M.; Akhmedov, B. A visible band index for remote sensing leaf chlorophyll content at the Canopy scale. Int. J. Appl. Earth Obs. Geoinf. 2012, 21, 103–112. [Google Scholar] [CrossRef] [Green Version]
  34. Hunt, E.R.; Cavigelli, M.; Daughtry, C.S.T.; McMurtrey, J.E.; Walthall, C.L. Evaluation of digital photography from model aircraft for remote sensing of crop biomass and nitrogen status. Precis. Agric. 2005, 6, 359–378. [Google Scholar] [CrossRef]
  35. ASTER Spectral Library. Available online: http://speclib.jpl.nasa.gov (accessed on 23 December 2021).
  36. ESA Copernicus Sentinel-2. Available online: https://scihub.copernicus.eu (accessed on 23 December 2021).
  37. Zhang, L.; Merkley, G.P.; Pinthong, K. Assessing whole-field sprinkler irrigation application uniformity. Irrig. Sci. 2013, 31, 87–105. [Google Scholar] [CrossRef]
  38. Ge, M.S.; Wu, P.T.; Zhu, D.L.; Zhang, L. Analysis of kinetic energy distribution of big gun sprinkler applied to continuous moving hose-drawn traveler. Agric. Water Manag. 2018, 201, 118–132. [Google Scholar] [CrossRef]
  39. De Cock, N.; Massinon, M.; Ouled Taleb Salah, S.; Mercatoris, B.; RosariaVetran, M.; Lebeau, F. Dynamics of a thin radial liquid flow. Fire Saf. J. 2016, 83, 1–6. [Google Scholar] [CrossRef] [Green Version]
  40. Borge, N.H.; Leblanc, E. Comparing prediction power and stability of broadband and hyperspectral vegetation indices for estimation of green leaf area index and canopy chlorophyll density. Remote Sens. Environ. 2000, 76, 156–172. [Google Scholar] [CrossRef]
  41. Sankaran, S.; Khot, L.R.; Espinoza, C.Z.; Jarolmasjed, S.; Sathuvalli, V.R.; Vandemark, G.J.; Miklas, P.N.; Carter, A.H.; Pumphrey, M.O.; Knowles, R.R.N. Low-altitude, high-resolution aerial imaging systems for row and field crop phenotyping: A review. Eur. J. Agron. 2015, 70, 112–123. [Google Scholar] [CrossRef]
  42. Fernandez-Gallego, J.A.; Kefauver, S.C.; Vatter, T.; Gutiérrez, N.A.; Nieto-Taladriz, M.T.; Araus, J.L. Low-cost assessment of grain yield in durum wheat using RGB images. Eur. J. Agron. 2019, 105, 146–156. [Google Scholar] [CrossRef]
Figure 1. Google Earth image and position of the Citrus Golf course in Hammamet, Tunisia. The red box indicates the limit of the Golf, and the yellow points indicate experimental greens.
Sustainability 14 03666 g001
Figure 2. Design of experiments.
Sustainability 14 03666 g002
Figure 3. (A) Grass ground image from 125 cm or canopy level image averages. (B) Grass ground image from 125 cm showing the green area (GA). (C) Grass ground image from 125 cm with a greener green area (GGA). (D) Grass ground image from 125 cm with normalized green–red difference index (NGRDI).
Sustainability 14 03666 g003
Figure 4. Sentinel-2 a + b relative spectral response/spectral signature of grass. Source: ASTER spectral library [35] and ESA Copernicus Sentinel-2 [36] web portal.
Sustainability 14 03666 g004
Figure 5. Variation of the uniformity coefficient depending on pressure and nozzle size.
Sustainability 14 03666 g005
Figure 6. Effect of the hydraulic slot nozzle size on the boom transverse distribution at a 2 bars pressure and a 0.5 m height.
Sustainability 14 03666 g006
Figure 7. Effect of the hydraulic slot nozzle size on the Normalized Difference Vegetative Index (NDVI) at low and high pressures for the different treatment operations (a): size 05; (b): size 06.
Sustainability 14 03666 g007
Figure 8. Scatter plot displaying between normalized green-red difference index (NGRDI) and input dataset. (a): GGA, greener green area; (b): GA, green area; (c): CSI, crop senescence index; (d): Hue; (e): NDVI, normalized difference vegetative index; (f): TGI, triangular greenness index.
Sustainability 14 03666 g008
Figure 9. Comparison (a) and relationships (b) between the predicted by multiple linear regression (MLR) model and calculated NGRDI.
Sustainability 14 03666 g009
Table 1. Treatments.
Treatment12
SprayerBPSBPS
NozzleCHS AXI11005CHS AXI11006
Colour and SizeBrown 05Grey 06
Number of nozzles1111
Pressure (bar)5.62.6
Measured spray liq. flow rate (L min−1)3.41.9
Forward speed (km h−1)7.24.7
Spray volume (L ha−1)300300
PTO speed (rpm)540540
Table 2. Testing the nozzle status.
Nozzles 05L min−1StatusNozzles 06L min−1Status
13.48A11.96A
23.42A21.86A
33.42A31.84A
43.42A42A
53.3A51.8C
63.48A61.96A
73.3A71.86A
83.36A82A
93.3A91.96A
103.42A101.92A
113.48A111.92A
Total flow rate37.38 Total flow rate21.08
Average flow rate (FR)3.398 Average flow rate (FR)1.916
FR −5%3.22 FR −5%1.8202
FR +5%3.556 FR +5%2.011
A: accepted nozzle; C: changed nozzle.
Table 3. Remote sensing variables from RGB and Sentinel-2 images depending on spray pressure and nozzle size at a boom height of 0.5 m.
GAGGACSINGRDITGINDVI
Spray pressure2.60.824 ± 0.1410.543 ± 0.21236.726 ± 17.6120.099 ± 0.0613451.929 ± 557.0370.545 ± 0.111
5.60.812 ± 0.1580.545 ± 0.22636.066 ± 18.7540.107 ± 0.0713343.531 ± 626.0030.570 ± 0.104
Nozzle size050.841 ± 0.1420.587 ± 0.21733.018 ± 18.0680.117 ± 0.0683490.770 ± 596.1390.589 ± 0.104
060.795 ± 0.1540.501 ± 0.21339.773 ± 17.6800.089 ± 0.0623304.691 ± 578.9840.527 ± 0.104
Treatment operations10.902 ± 0.0630.656 ± 0.15228.062 ± 12.7940.115 ± 0.0463651.644 ± 446.7680.617 ± 0.063
20.908 ± 0.0450.680 ± 0.12125.548 ± 10.2600.158 ± 0.0473746.222 ± 426.3120.645 ± 0.065
30.905 ± 0.0540.672 ± 0.16026.377 ± 14.3310.145 ± 0.0513569.860 ± 469.7830.576 ± 0.072
40.612 ± 0.1590.278 ± 0.13857.127 ± 12.6180.025 ± 0.0412697.033 ± 412.1970.544 ± 0.075
50.763 ± 0.1010.433 ± 0.16644.865 ± 15.4460.072 ± 0.0383323.892 ± 544.3910.407 ± 0.075
Table 4. Remote sensors variables from RGB and Sentinel images correlations with operating parameters of the boom sprayer. Levels of significance: * p < 0.05; ** p < 0.01; *** p < 0.001. ns: non-significant.
Spray ParametersPressureNozzle Size
Remote Sensing Variablesrprp
Intensity−0.154*−0.015ns
Hue0.016ns0.159*
Saturation0.025ns−0.031ns
Lightness−0.173*0.011ns
a*0.049ns−0.209**
b*−0.125ns0.012ns
u*0.028ns−0.203**
v*−0.175**0.054ns
GA−0.039ns0.154*
GGA0.005ns0.197***
CSI−0.018ns−0.187*
NGRDI0.059ns0.216***
TGI−0.092ns0.157*
NDVI0.116ns0.287***
Table 5. Statistics of data set for the normalized green–red difference index (NGRDI) prediction.
MinimumMaximumMeanMedianSDSkewnessKurtosis
Hue48.371120.35379.56881.50111.486−0.2550.930
a*−22.840−4.189−15.582−16.2443.9630.6200.052
u*−17.4367.252−8.068−8.8555.3570.7130.228
GGA0.0560.9040.5440.5830.219−0.334−0.919
NDVI0.2590.7500.5580.5800.108−0.617−0.504
Pressure2.6005.6004.1004.1002.121
Size5.0006.0005.5005.5000.707
Table 6. Multilinear regression of NGRDI as the dependent variable comparing the different spray application parameters and remote sensing variables: Sentinel-2 and ground RGB VIs. R2, determination coefficient; RMSE, root mean squared error. Level of significance: *** p < 0.001.
EquationR2Durbin-Watson
Coefficient
RMSEFp-Level
NGRDI = Pressure * 0.08 + Size * 0.05 + Hue * 0.02 − a * 0.01 + u * 0.01 + GGA * 0.248 + NDVI * 0.09 − 0.3010.880.870.023175.05***
Publisher’s Note: MDPI stays neutral with regard to jurisdictional claims in published maps and institutional affiliations.

