Article

Kinetics and Adsorption Equilibrium in the Removal of Azo-Anionic Dyes by Modified Cellulose

by
Ángel Villabona-Ortíz
1,
Kelly J. Figueroa-Lopez
2,* and
Rodrigo Ortega-Toro
3
1
Process Design and Biomass Utilization Research Group (IDAB), Chemical Engineering Department, University of Cartagena, Avenida del Consulado St. 30, Cartagena de Indias 130015, Colombia
2
Novel Materials and Nanotechnology Group, Institute of Agrochemistry and Food Technology (IATA), CSIC, Calle Catedrático Agustín Escardino Benllonch 7, 46890 Valencia, Spain
3
Food Engineering Department, Food Packaging and Shelf Life Research Group (FP&SL) and Complex Fluids Engineering and Food Rheology Research Group (IFCRA), Universidad de Cartagena, Cartagena de Indias 130015, Colombia
*
Author to whom correspondence should be addressed.
Sustainability 2022, 14(6), 3640; https://doi.org/10.3390/su14063640
Submission received: 27 January 2022 / Revised: 26 February 2022 / Accepted: 5 March 2022 / Published: 20 March 2022
(This article belongs to the Section Sustainable Materials)

Abstract

:
This study introduces a new and bio-friendly adsorbent based on natural and cetyltrimethylammonium chloride (CTAC)-modified adsorbent prepared from wheat straw residues for the removal of Congo red (CR) and tartrazine azo-anionic dyes from aqueous solution. The adsorbent was characterized by thermogravimetric analysis (TGA), calorimetric differential (DSC), scanning electron microscopy with energy-dispersive X-ray spectroscopy (SEM/EDX), and pH point of zero charge (pHPZC) techniques. It was found that decreasing the adsorbent dose and increasing the initial concentration favors the removal of tartrazine and Congo red. Tartrazine adsorption capacities were 2.31 mg/g for the cellulose extracted from wheat residues (WC) and 18.85 mg/g for the modified wheat residue cellulose (MWC) for tartrazine as well as 18.5 mg/g for WC and 19.92 for MWC during Congo red (CR) adsorption, respectively. Increasing the initial and decreasing the adsorbent dose concentration favored the adsorption process. From time effect analysis, it was found that the equilibrium time was reached at 120 min when modified wheat cellulose was used and at 480 min when wheat cellulose was used. The kinetics of adsorption were described by pseudo-second-order in all cases with R2 > 0.95. The obtained data equilibrium from this research was well-fitted by the Freundlich isotherm model.

1. Introduction

Rapid industrial development, urbanization, and reckless exploration of various natural and anthropogenic resources are primarily responsible for the pollution of water, air, and soil, and the discharge of contaminated effluents into the environment, resulting in damage to public health and the environment [1]. Water pollution refers to environmental degradation and occurs due to the large amounts of chemicals released by various industrial sectors such as textile, rubber, tanneries, cosmetics, printing, paper, dyes, plastics, petrochemicals, medicine, and food processing units into the water system [2].
Among the various contaminants discharged into the aqueous environment, dyes or colorants are deposited through effluents from multiple industries (paints, paper, textiles, leather, resins, medicines, cosmetics, plastics, food, and industrial dyes) [3]. Continuous discharge of wastewater containing dyes to the environment may adversely affect human health due to its toxicity, potential carcinogenicity, bioaccumulation capacity in aquatic biota, and mutagenicity [4]. Effluents tinted by the action of dyes have a low biological oxygen demand (BOD) value and a higher chemical oxygen demand (COD) value; they thus not only affect the esthetic nature but also hinder the penetration of sunlight into the water flow and therefore obstruct the photosynthetic action [5]. At present, more than 10,000 types of dyes are available globally, with an annual production of 700,000 tons [6]. The textile industry uses around 3600 dyes and 8000 different chemicals in various processes, including bleaching, dyeing, printing, and finishing [7]. Therefore, the removal of color from waste effluents becomes environmentally relevant. Dyeing industries use large volumes of water and dyes, dumping 8% to 20% colorants into effluents from textile industries [8]. Thus, tons of colorants are dumped into the environment as aquatic waste daily.
Congo red (CR) and tartrazine are most famous for their multiple applications. The CR or sodium salt 3,3′-([1,1′-biphenyl]-4,4′-diyl)bis(4-aminonaphthalene-1-sulfonic acid) disodium is a diazo-anionic dye with a molecular weight of 696.665 g/mol. It has been reported that this dye could be highly toxic to living beings by causing carcinogenesis, mutagenesis, teratogenesis, respiratory damage, allergies, and problems during pregnancy because it metabolizes harmful chemicals such as benzidine and turns out to be a potent human carcinogen [9]. On the other hand, tartrazine or trisodium 1-(4-sulfonatophenyl)-4-(4-sulfonatophenylazo)-5-pyrazolone-3-carboxylate has a molecular weight of 534.3 g/mol, is a bright yellow to bright orange anionic azo-dye, and is a petroleum derivative [10]. It is a highly water-soluble dye that can cause allergies and toxicity in humans, act as a catalyst in various behavioral problems such as hyperactivity, and cause asthma, migraines, eczema, thyroid cancer, and lupus [11].
Due to the toxicological effects of the colorants mentioned, wastewater containing them is a topic of worldwide interest. Various recovery techniques, including advance oxidative degradation [12], electrocoagulation, membrane filtration, biochemical degradation, flocculation, chemical precipitation, reverse osmosis, electrodialysis, and ion-exchange methods, have been used to retain organic contaminants from water [10]. Alternatively, one of the most popular methods, such as adsorption, is considered the most promising technique. It presents a profitable approach, robust and universal for the elimination of toxic pollutants from the aquatic environment [13].
It should be clarified that the success of the adsorption technology depends on many factors, including the development of an adsorbent that has the ideal porous structure to retain contaminating molecules on the solid surface, since during the adsorption process, the accumulation of particles dissolved in a solvent on the surface of an adsorbent occurs. Thus, cellulose-based adsorbents have been commonly modified to increase their ability to retain substances of anionic origin and enhance their selectivity. Several adsorbents have been implemented in the removal of CR and tartrazine from water solutions, such as polyaniline nanocomposites/γ alumina [14], bionanocomposites [15], hydrogels from pineapple shells [16], cellulose modified with cetyltrimethylammonium bromide [3], glutaraldehyde, and polyvinyl alcohol [17], NiFe2O4 and multi-walled carbon nanotubes [18], methyltrioctylammonium chloride [19] and iron oxide nanoparticles using Spirulina platensis [20]. Despite major advances in this field, new dye adsorbents need to be developed to overcome the limitations of existing materials, such as low adsorption capacity and complexity of synthesis.
Techniques such as quaternization have been applied to increase the selectivity of lignocellulosic bio-adsorbents. This method consists of an etherification reaction, in which a quaternary ammonium salt reacts with the active cellulose centers to obtain a positively charged adsorbent [19]. Quaternary nitrogen salts such as N,N-dimethylformamide have been used for the quaternization of bio-adsorbents [21], 2,3 epoxypropyl trimethyl ammonium chloride [19], cetyltrimethylammonium bromide [3], and epichlorohydrin [22]. In this study, cetyltrimethylammonium chloride (CTAC) was chosen as a cellulose modifier agent; CTAC is a cationic surfactant with a quaternary ammonium head and a C16 alkyl tail [23]. However, no research has been conducted on the potential contribution of these surfactants to the adsorption of anionic dyes from cellulose fibers, although one of the advantages of using CTAC as a cellulose fiber modifying agent for anionic dye is its biodegradability by suitable microorganisms [23].
On the other hand, wheat crop residues are left on the site after harvesting, being a vector for the transmission of pests and foul odors. Wheat residues are reported to consist of three main polymeric components: cellulose (33.0 to 45.1%), hemicelluloses (9.2 to 32.0%), and lignin (8.0 to 37.4%), with high levels of ash and silica [24]. Due to its high lignocellulose content, which has little digestibility, these residues have not been used in animal diets [25]. In this regard, the current study aims to obtain an effective adsorbent based on this eco-friendly and safe natural waste modified with CTAC for the sequestration of CR and tartrazine from aqueous solutions. The adsorbents were characterized by thermogravimetric analysis (TGA), calorimetric differential (DSC), scanning electron microscopy with energy-dispersive X-ray spectroscopy (SEM/EDX), and pH point of zero charge (pHPZC). The effect of adsorbent dose and initial concentration over adsorption capacity was analyzed, studying the kinetics and adsorption equilibrium. The valorization of wheat straw as adsorbent represents an economic advantage because it is an abundant residue in Colombian food industries; it has shown great potential for the removal of diazoanionic dyes, such as tartrazine and CR. Moreover, as cellulose, neither cellulose extracted from wheat straw nor modified with CTAC has been reported on previously as an adsorbent—the reason why all this would be a contribution to the state of the art.

2. Materials and Methods

2.1. Materials and Reagents

CR, tartrazine, sodium hydroxide (NaOH), and hydrochloric acid (HCl) had an analytical grade and were acquired from Sigma Aldrich Pvt. Ltd. (St Louis, MO, USA) (purity > 99%). The CR stock solution (1000 mg/L) was prepared by dissolving the dye’s required amount in distilled water. All glass items were thoroughly cleaned, rinsed with deionized water, and dried in a kiln at 50–55 °C. The working solutions were prepared from the stock solution using distilled water. The remaining concentration of the dyes in the solution was made by UV/Vis spectrophotometry in model UV 1700 Hach DR 2700 by Shimadzu® (Kyoto, Japan). The SEM-EDS structural analysis was performed in a TESCAN® model F E-MEB LYRA 3 electron scanning microscope (Brno, Czech Republic), with gold coating, 10 kV voltage, and 1 kx magnification. The modification of the cellulose was carried out using 25% cetyltrimethylammonium chloride (CTAC). The concentration of the remaining dyes was determined in a Biobase infrared spectrophotometer model BK-UV1900 (Shandong, Jinan, China).
For the experimentation, a multilevel factorial experimental design of three levels of adsorbent dose (3, 5, and 7 g/L) and three variations of contaminant concentration (40, 70, and 100 mg/L) were considered, keeping constant the pH, particle size, temperature, and agitation rate. The anionic dyes tartrazine and CR were removed from synthetic water, using the two biomaterials, for 36 experiments. A target was made with the wheat residues without modification to determine the synthesis’s viability and later cellulose modification. The final concentration after CR and tartrazine adsorption essays was determined by infrared spectrophotometry at 427 and 500 nm, respectively.

2.2. Methods

2.2.1. Mechanical Treatment of Biomass

The wheat residues were provided as a rejection product after the flour was obtained. Initially, they were washed multiple times with deionized water to remove impurities and coloring agents, dried at 60 °C in the oven to a constant mass, and the size reduction was performed in a blade mill. The size was classified in a shaker-type sieve using a series of stainless steel sieves, with opening sizes of 8 mm, 6.3 mm, 4.75 mm, 3.35 mm, 2.362 mm, 2 mm, 1.7 mm, 1 mm, 0.5 mm, and 0.355 mm [26]. The pretreated biomass was characterized by SEM-EDS analysis.

2.2.2. Cellulose Extraction

The cellulose was extracted by placing 20 g of wheat residues in contact with distilled water in a ratio of 2% w/v and shaken mechanically for 10 min. The mixture was filtered, the filtrate was discarded, and 500 mL of a 4% w sodium hydroxide solution was added and agitated at 200 rpm at 80 °C for 2 h. The sample was then washed with distilled water; NaOH treatment was repeated and rewashed until the washing water was clear. The cellulose obtained was dried at room temperature for 8 h. Lignin, polyphenols, and proteins were removed by adding to the sample obtained a solution with 50 g of NaClO2, 500 mL of distilled water, and 50 mL of acid. The mixture was shaken for 24 h at 30 °C. The extracted cellulose was dried for 3 h at 60 °C [27,28].

2.2.3. Quaternization with CTAC

Quaternization was performed by impregnating the cellulose with cetyltrimethylammonium chloride, a quaternary ammonium salt surfactant, and an etherifying agent that changes the surface of the cellulose. A ratio of 10 mL of cetyl was used at a concentration of 100 mmol/L for each gram of wheat cellulose (WC). The mixture was kept in magnetic agitation for 24 h at 250 rpm. A thorough washing neutralized the obtained material until a pH of 7 or close to 7 was obtained [23]. The synthesized cellulose was characterized by thermogravimetric analysis (TGA) and calorimetric differential (DSC) in an SDT Q600 TA Instrument using an inert atmosphere with a nitrogen flow of 4 cm3/min, in a temperature range of 30 to 600 °C at a heating rate with a ramp function of 10 °C/min. Before and after the modification, the cellulose morphology using a cationic surfactant, CTAC, was performed by SEM-EDS scanning electron microscopy. The distribution of charges on the surface and subsequently evaluating its capacity to remove anionic contaminants was carried out by determining the pH point zero charge (pHpzc) [29].

2.3. Adsorption Tests

The adsorption experiments were carried out according to the proposed design of the experiments. A synthetic stock solution of CR and tartrazine was prepared at 1000 mg/L. The experiments were conducted by varying the adsorbent dose (3, 5, and 7 g/L) and the initial concentration of CR and tartrazine (40, 70, and 100 mg/L) at 30 °C and 200 rpm. pH was fixed from the pHpzc results. The solution was placed in contact with the adsorbent in 5 mL test tubes, in an orbital shaker Thermo Scientific model MAXQ 4450, with a shaking of 250 rpm, at room temperature for 24 h. The remaining CR and tartrazine concentration was determined by infrared spectrophotometry at 427 and 500 nm, respectively. The adsorption capacity of the bio-adsorbent (qt) and the removal efficiency (R) were determined with Equations (1) and (2).
q t [ m g g ] = ( C 0 C f ) V m
R [ % ] = ( C 0 C f ) C o 100
where C 0 ( m g L ) is the initial concentration of colorant in the dissolution; C f ( m g L ) is the concentration of dye after adsorption time; V   ( L ) is the volume of solution, and m   ( g ) is the bio-adsorbent mass used in the tests.
The statistical analysis was performed using Statgraphics Centurion XVIII.I.II software, determining the effect of each of the variables on the material removal efficiency, based on the analysis of variance.

2.4. Adsorption Kinetics

The kinetic study was conducted to analyze the effect of time on removing and possible mechanisms involved in the process [30]. For this, tests were performed at the best conditions of adsorbent dose and initial dye concentration at 150 rpm and room temperature. Aliquots were taken at different time intervals (5, 10, 20, 30, 60, 120, 240, 480, 720, and 1440 min), and the remaining dye concentration was determined. The experimental data were adjusted to the non-linear form of pseudo-first-order [16], pseudo-second-order [31], Elovich [2] and Weber–Morris intraparticle diffusion models [32]. Kinetic evaluated models are summarized in Table 1.

2.5. Adsorption Isotherms

Adsorption isotherms describe adsorbate–adsorbent interactions, a critical factor to optimize the use of adsorbents [2]. The isotherms represent the equilibrium of adsorption, which is done through the ratio of the absorbed quantity to the pressure or concentration of equilibrium at a constant temperature [31]. They also reflect the process through which the analyte that binds to the sorbent is at an equilibrium state with the ionic species that remain dissolved in the solution. At the best experimental conditions of adsorbent dose, the tests for the determination of isotherms were performed varying the sample’s initial concentration (25, 50, 75, 100, and 125 mg/L), at the best experimental conditions of adsorbent dose using the bio-adsorbents prepared from coconut mesocarp, for 24 h at 150 rpm and room temperature. The experimental data were fitted to the non-linear form of the models of Langmuir [3], Freundlich [19] and Dubinin–Radushkevich [33], as shown in Table 2.

3. Results and Discussion

3.1. Characterization of Biomaterials

Thermogravimetric analysis (TGA) and differential scanning calorimetry (DSC) analysis characterized the synthesized cellulose to analyze its behavior toward temperature changes and establish the extracted material’s quality, taking into account the volatile compounds [34]. The surface structure and elemental composition of wheat residues, WC, and MWC were investigated by SEM-EDS [31].

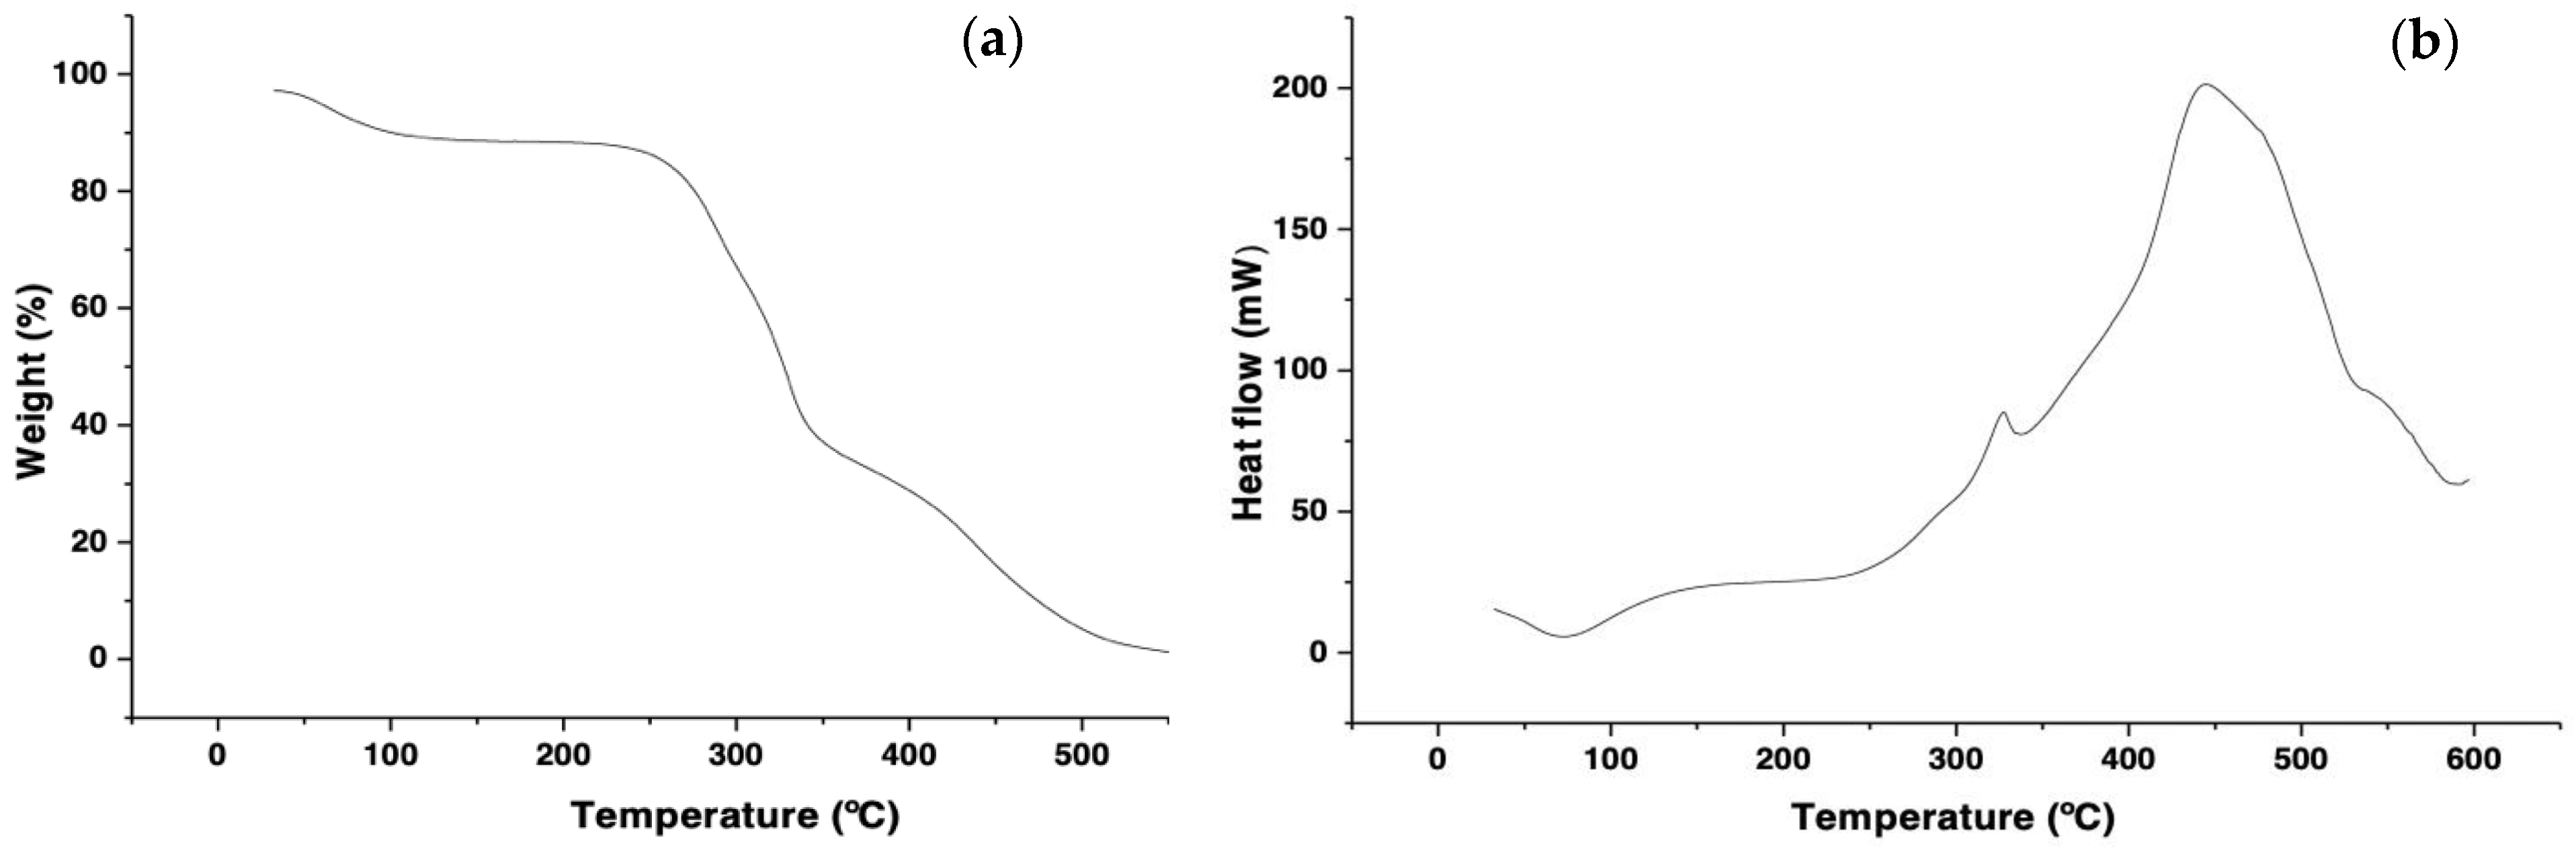
3.1.1. TGA and DSC Analysis

The thermogravimetric analysis provides information on the composition of a sample. It monitors its temperature performance in a specific atmosphere and records the sample’s weight loss when exposed to a combination of temperature, heating rate, and reaction atmosphere [34]. Figure 1 shows the TGA and DSC analysis of the cellulose extracted from wheat residues.
A decrease of about 9.85% in weight was observed between 75 °C and 140 °C, due to the moisture content present in the experimental sample [35]. Moreover, about 50% mass loss was associated with hemicellulose and lignin’s corresponding degradation at temperatures between 180 °C and 340 °C [36]. Subsequently, from 340 °C a cellulose degradation occurs, with the degradation of 42.5% w. Between 400 and 600 °C, there is no significant decrease in mass in the sample, which is attributed to the absence of degradable non-cellulosic substances such as lignin and the possible presence of stable oxides at high temperatures [21,36]. The results show that the sample is constituted in a more significant proportion by cellulose [37]. The DSC shows that the cellulose obtained has an endothermic peak around 80 °C associated with water evaporation. From 320 to 350 °C, an exothermic pyrolysis reaction peak occurred, corresponding to the melting of cellulose polymer crystals, which could be caused by the reactions or mechanisms involved in the pyrolysis of the three components. Previously, it has been indicated that the carbonization process was highly exothermic while volatilization was endothermic [36]. The non-appearance of a peak between 222–228 °C means that the hemicellulose was removed during the extraction of the cellulose from the coconut mesocarp [36].

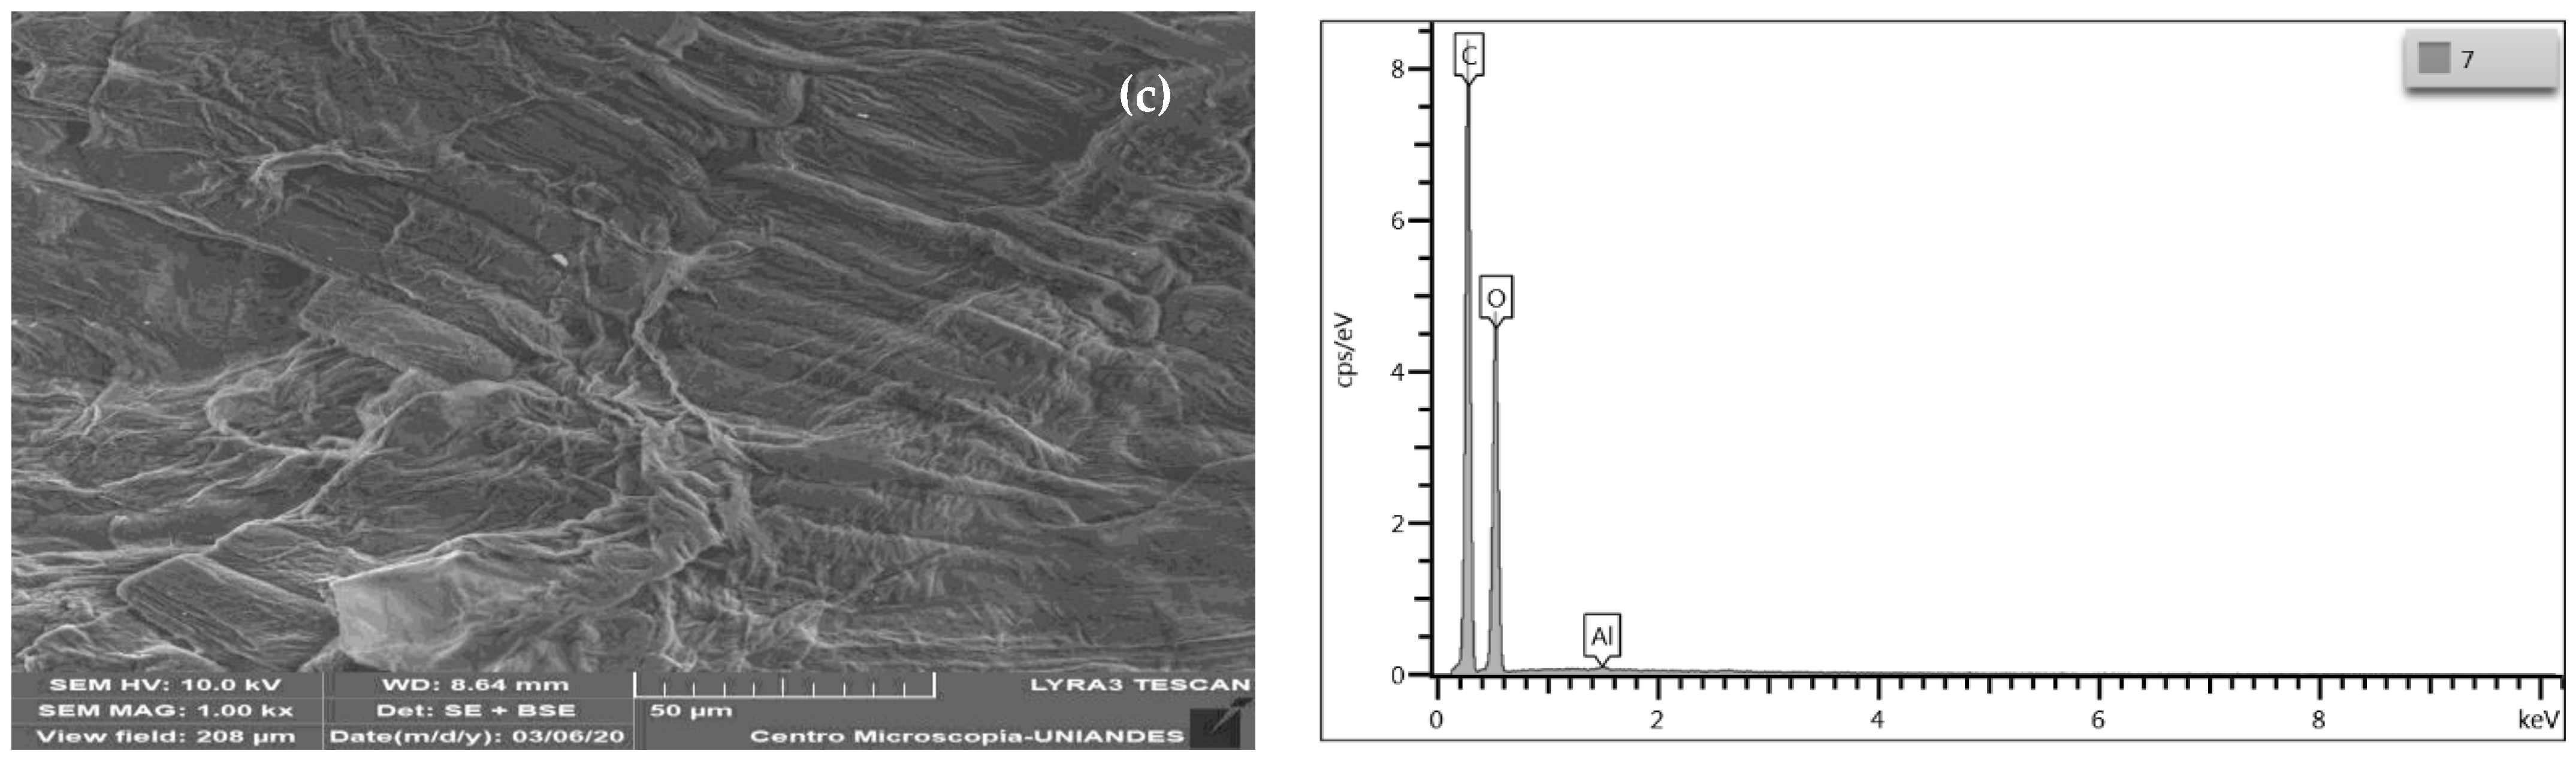
3.1.2. Structural Analysis

SEM analysis of wheat residues (Figure 2a) shows the characteristic structure of lignocellulosic materials, with folds and surface roughness; an irregular exposed area is displayed with the presence of fiber fragments, folds, heterogeneous spirals, and heterogeneous spirals. The presence of fiber fragments is due to the presence of cellulose, hemicellulose, and lignin in the structure of wheat residues, which benefits the adsorptive capacities of the material due to the presence of carboxyl, amino, and hydroxyl functional groups, which can retain cationic contaminants due to their negative net electrostatic charge [38].
The cellulose extracted from the wheat residues (WC) shows the presence of laminar folds, which is attributed to the delignification of the biomass (Figure 2b) [39], as well as filaments owing to the removal of non-cellulosic components during the pretreatments used, delignification processes, and alkaline treatment [40]. According to the EDS spectrum, the elements with a more significant presence in CC are carbon (50.74% w) and oxygen (49.08% w), with slight traces of sodium (0.18% w); the disappearance of magnesium, phosphorus, sulfur, chlorine, and potassium, due to the treatment with NaOH, is necessary for the elimination of the lignin and hemicelluloses of the wheat residues (Figure 2a) [39]. After the modification with CTAC, there is progression of the folds in the exposed structure of the bio-adsorbent [41], although there is also a change in the material’s exposed surface after the modification, increasing the material’s roughness [36]. EDS does not show that this has been successful; there was an increase in the presence of carbon (54.41% w) and a decrease in the amount of oxygen (45.40% w) and traces of aluminum (0.18% w) in the peak intensity 1.5 keV. Similar behavior was found when modifying magnetic biochar with cetyltrimethylammonium bromide, finding that the presence of this modification is not evident in the EDS spectrum [42]. Similarly, the modification of cellulose nanocrystals obtained from kenaf with cetyltrimethylammonium bromide was also not evident by SEM-EDS analysis [43].
Considering the surface properties of the extracted cellulose fibers (Figure 2), its use for different applications is feasible. It could be used as polymers for manufacturing packaging materials individually or to improve the mechanical properties of biopolymers synthesized from starch to synthesize biofilms, while taking into account that the use of starch as a film material has some drawbacks due to poor mechanical, thermal, and gas barrier properties and the weak resistance to water that limits its application, particularly in the presence of water and humidity [44]. Furthermore, the polysaccharide structure of starch and cellulose has a similar chemical structure that allows for the formation of hydrogen bonds between both components without harmful effects on human health [45]. Improved thermal stability of biopolymers in food coating films has only been reported by adding cellulose fibers [46].

3.1.3. pH Point Zero Charge

The adsorbents’ pH point zero charges (pHpzc) were determined to establish the ideal pH for anion adsorption. The study of pHPZC is also important to identify the adsorption mechanism and thus to consider the nature of the interactions. For wheat residues, 4.92 and 4.69 for WC, and 5.38 for MWC were found; therefore, it was decided to have an operating pH of 4 for both dyes to have a positively charged surface. Considering that these behave as cationic matrices at pH < pHpzc, if the solution’s pH is increased it would be negatively charged by the deprotonation of the surface functional groups, and it would then reject the interaction with anionic dyes under study by electrostatic forces [31]. In addition, at pH > pHPZC the adsorbent surface has a greater tendency to adsorb cationic pollutants because of its negative surface [31]. Considering the above, it would be expected that the adsorption mechanism controlling the elimination process of CR and tartrazine from water using wheat straw residues would be controlled by chemiadsorption, involving electrostatic interaction between the anionic dyes and the adsorbents’ active centers [9].

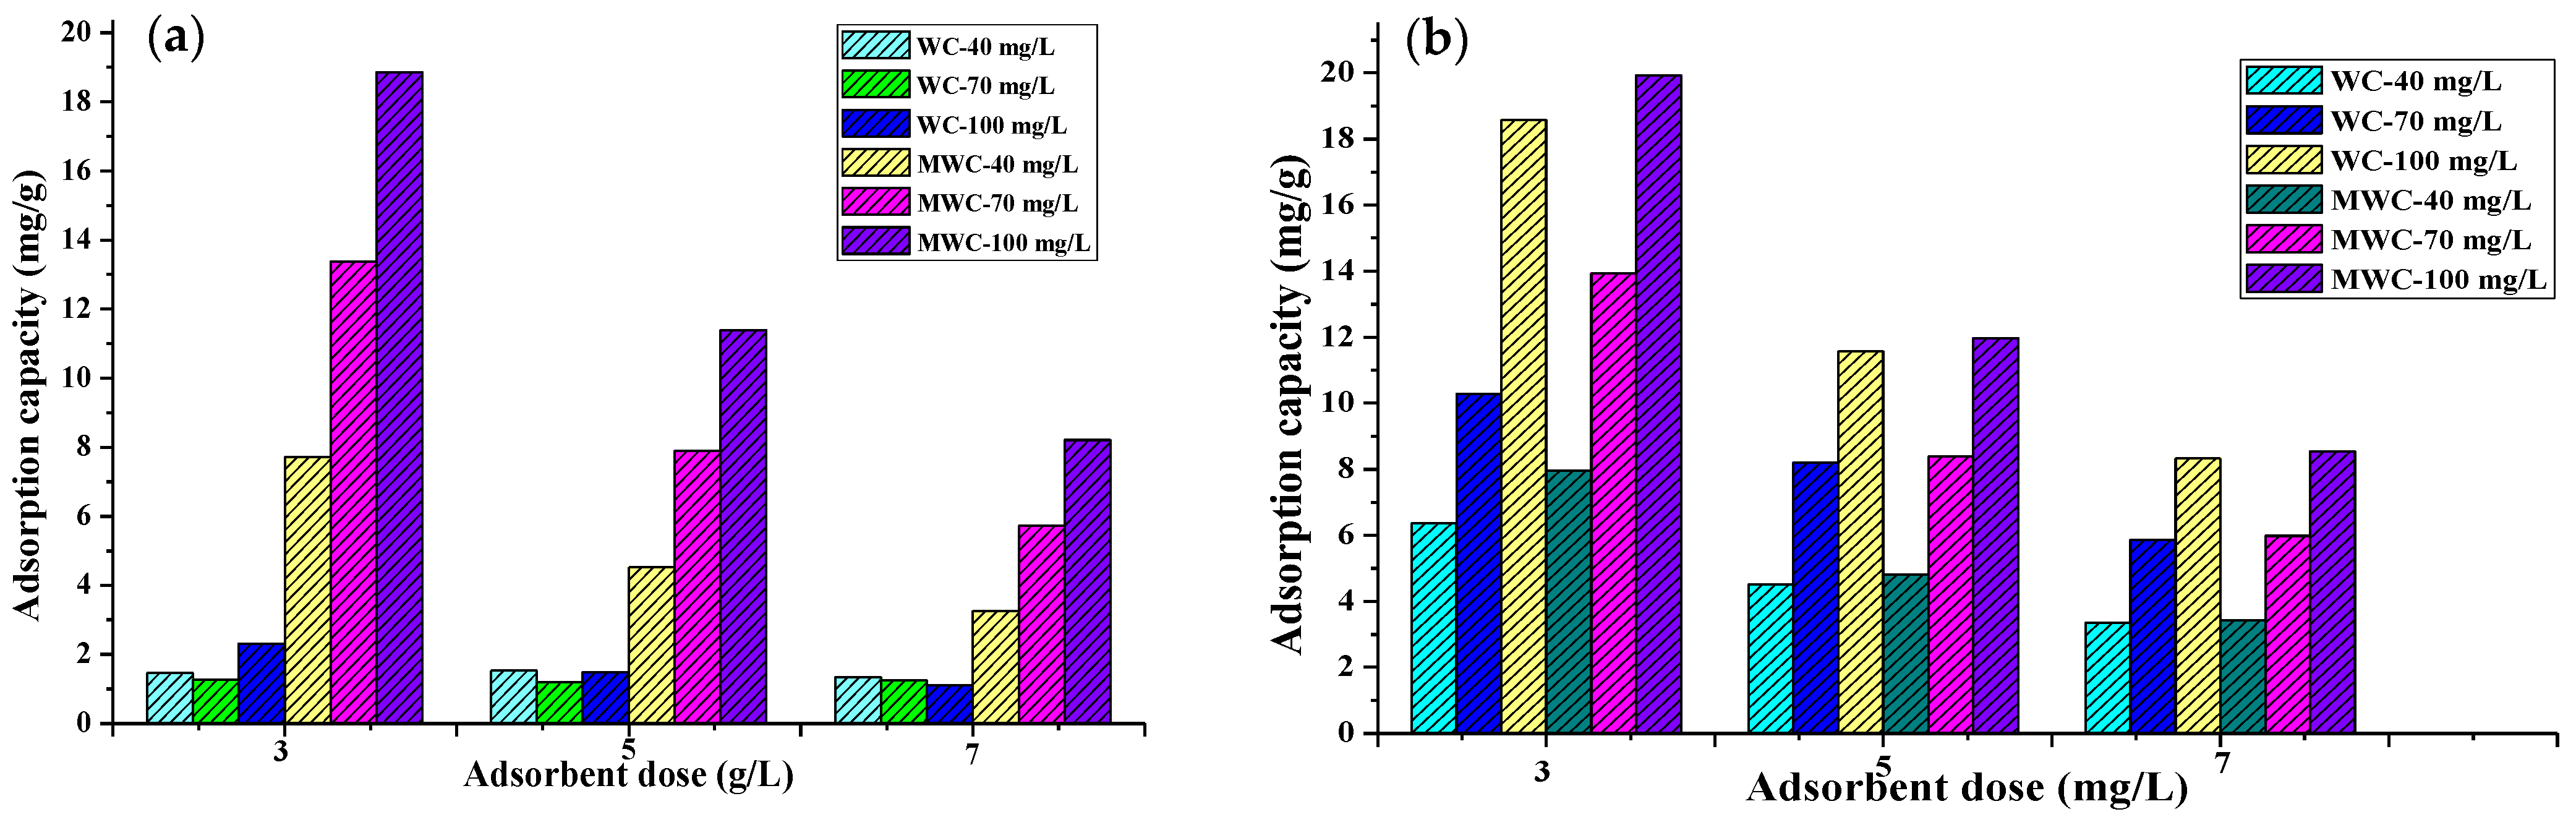
3.2. Effect of Adsorbent Dose and Initial Concentration

The adsorbent dose is a parameter that directly influences the number of active sites available for pollutant adsorption, and therefore the efficiency of the process [47]. On the other hand, the initial solute concentration is the driving force behind the exchange mechanisms and mass transfer involved in adsorption [30]. During the tartrazine adsorption tests, adsorption capacities and negative efficiencies were obtained, showing that the raw biomass contributes yellow color to the solution; in addition, these results could be due to the negative charge of the biomaterial due to the presence in its structure of hydroxyl, carbonyl and carboxyl groups (present in lignocellulosic materials), which have negative charges and would repeal the interactions between the dye and the active centers, decreasing the efficiency and adsorption capacity. However, the removal of CR with residual wheat biomass showed removal efficiencies between 62 and 91% and adsorption capacities between 2.15 and 10.76 mg/g; nevertheless, these results are low for an adsorption process. This fact shows the need to modify the structure of lignocellulosic biomaterials to increase the efficiency and adsorption capacity of the dyes under study. Thus, Figure 3 and Figure 4 summarize the effect of the adsorbent dose and initial concentration over the removal efficiency and adsorption capacity of WC and WMC when eliminating CR and tartrazine.
It was found that the adsorption efficiency of Congo red on WC increased from 79% to 97% with the change of the initial concentration from 40 mg/L to 100 mg/L; when using MWC, it increased from 98% to 99.99% when the initial concentration of Congo red increased from 40 mg/L to 70 mg/L; the decrease in the adsorbent dose and the increase in the initial concentration caused an increase in the removal efficiency by the MWC from 98.88% to 99.8%. The efficient performance of biomaterials in removing the dye is due to the reactive nature of the dye [8] since it quickly binds to any fibrous material. When removing tartrazine, WC presented a maximum adsorption peak of almost 40% for a dose of 5 g/L and a contaminant concentration of 40 mg/L. This low removal percentage is because the surface of the cellulose is anionic due to the presence of OH- groups [39]. This behavior on the part of raw biomass and cellulose demonstrates the need to treat biomaterials to increase the adsorption sites of anionic pollutants. When using the MWC, a significant increase in the removal efficiency of tartrazine was evidenced, achieving removal percentages >95% in all cases, with a positive influence of the initial tartrazine concentration, which would favor diffusive phenomena and mass transfer from the solution to the free surface of the adsorbent [45]. However, the effect of the adsorbent dose was negative since it caused division in the concentration gradient between the concentration of solute in the solution and the superficial of the adsorbent [47]. Therefore, there would be competition between solute ions for limited available binding sites, electrostatic interactions, overlapping or aggregation of adsorption sites, low surface area, interference between binding sites, and contact with lower ions at higher adsorbent densities [39]. It is observed that for the same initial concentration of dye, if we increase the dose of the adsorbent, the equilibrium concentration in the medium will undoubtedly be lower, and consequently, the apparent adsorption capacity decreases; this, due to the increase in the availability of active centers and the decrease in dye in the solution, would leave empty adsorption sites in the adsorbent [36].
Regarding the adsorbent dose effect, it was found that the lowest amount of bio-adsorbent used (15 mg) in the removal of RC and tartrazine reached the best adsorption capacity results. The decrease in the amount of adsorbed dye (mg/g) with the increasing adsorbent mass is due to the division in the flux or concentration gradient between the solute concentration in the solution and the solute concentration on the surface of the adsorbent [48]. The ideal is to use the least amount of material to remove as much contaminant as possible during an adsorption process to maximize results and decrease costs. Increasing the adsorbent mass increases in the percentage removal of both dyes because of the rise of active sites on the adsorbent surface [19]. However, when it is about adsorption capacity, this aspect may decrease because of the unsaturated active centers at the end of the process due to high availability and low quantity of contaminant for removal. The two bio-adsorbents synthesized presented this pattern concerning the amount of adsorbent used during dye removal.
On the other hand, the increase in adsorption capacity was proportional to the contaminant’s initial concentration, for both dyes, with the best results when using MWC, thus affecting the adsorption rate but not the equilibrium itself. This fact is because the initial concentration is the driving force of the diffusive and mass transfer processes; its increase therefore causes an increase in adsorption; in addition, as the initial concentration increased, the number of collisions between the ions of the dye and the adsorbent also increased, thus improving the adsorption process [49].
From Figure 3, the overall efficient performance of MWC is evident, with removal percentages >95% in all cases, possibly because the surface was protonated, thus increasing the available adsorption sites as evidenced by the change in its exposed structure (Figure 2c) concerning WC (Figure 2b). There was no marked selectivity of the adsorbents for any of the dyes. However, RC’s removal was superior to that of tartrazine due to the dye’s reactive nature. It easily sticks to any protonated material [50].
For evaluating the modified cellulose with CTAC stability in aqueous media, it was washed several times to remove unbound surfactant molecules on the surface of the CNC particles, and thus the adsorbent does not introduce any surfactant molecules into the solution. The number of cycles required to wash all the unbound surfactant molecules from the surface of MCNC depends on the amount of surfactant used for the modification; then, the MWC required four cycles to wash all the unbound surfactant molecules from its surface. These results are similar to those found when using cellulose modified with CTAB, a surfactant similar in nature to CTAC [3].

3.3. Statistical Analysis

From the results obtained, the F-factor values shown in Table 3 and Table 4 were determined for the percentage eliminations of tartrazine and CR onto WC and MW. A confidence level for the p-value of 95% was established. Therefore variables with a p-value of less than 0.05 are considered significant [5]. It was found that the adsorption of the tartrazine on WC showed statistical significance for the adsorbent dose (A), the initial concentration of tartrazine (B), and their interactions AB and BB [9]. Similar results were found regarding adsorbent dose and initial concentration when using a carbon/metal composite for removing acid green and reactive yellow 186 [51].

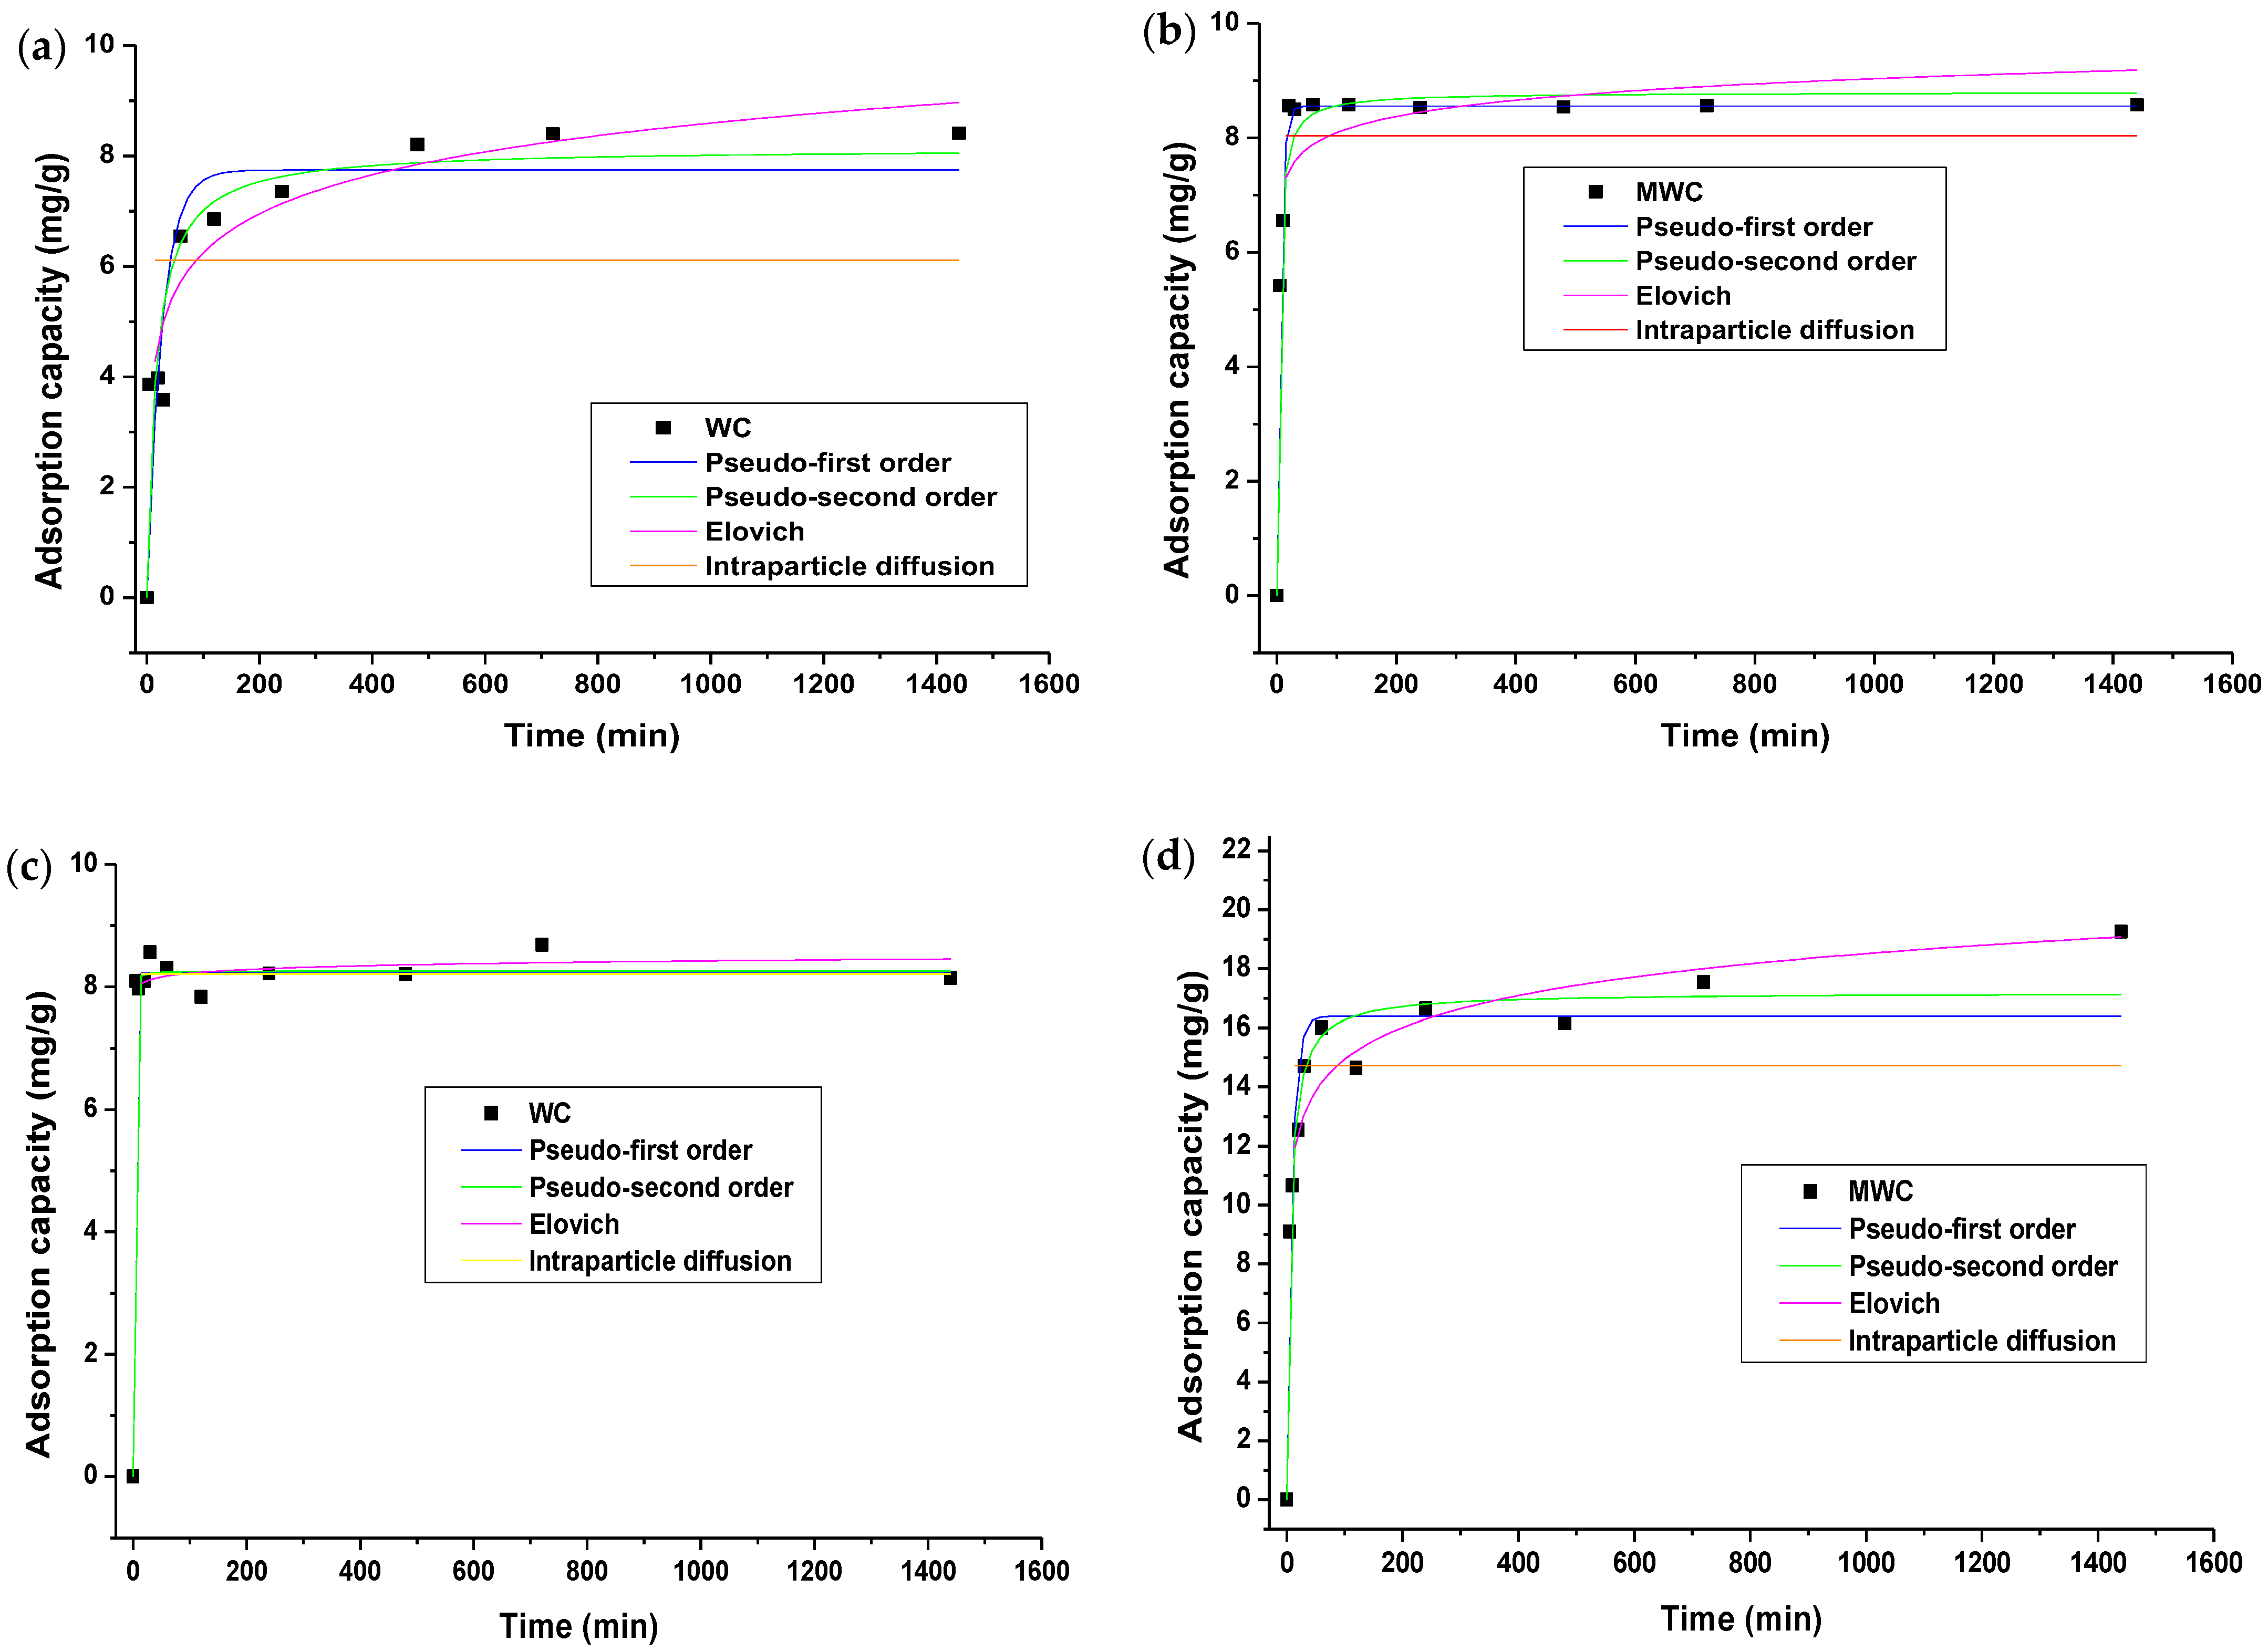
3.4. Adsorption Kinetics

Adsorption kinetics were studied to determine the effect of contact time on the process and the possible mechanisms during removal [32]. The fitting of the experimental data by non-linear regressions to the Elovich, pseudo-first-order, pseudo-second-order, and Weber–Morris intraparticle diffusion models is shown in Figure 5.
It was observed in the removal of the two dyes that the adsorption occurs rapidly in the initial minutes, being this more plausible when using MWC, presenting this adsorbent a better behavior with the two dyes, showing the success of the modification process with CTAC. It was found that the equilibrium time is reached at about 120 min with MWC and 480 min with WC; the higher adsorption rate presented when using WMC could be due to the greater availability of active centers in the unsaturated material, as well as the availability of anions [52].
In the process of adsorption, the driving force is the concentration gradient. The process happens in stages: (1) External mass transfer of the solute from the solution through the boundary layer to the surface of the adsorbent (film diffusion); (2) Diffusion of the solute through the solid matrix of the adsorbent (intraparticle diffusion), associated with interparticle mass transfer (pore volume diffusion or surface diffusion); (3) Adsorption of the solute molecules at the active sites and is considered as the equilibrium reaction which occurs rapidly [53]. Due to the succession of multiple stages and reactions that occur during the process, the kinetic and equilibrium study is performed to identify the mechanisms and limiting steps of the solid-liquid adsorption process [14].
Fitting to kinetic models enables a quantitative understanding of the adsorption process because it helps describe the process and stablish the adsorption mechanism [31]. Pseudo-first-order kinetic models were applied in the present investigation [5], pseudo-second-order [53], Elovich [2], and Weber–Morris Intraparticle Diffusion [32], to study the adsorption mechanism of CR and tartrazine dyes. According to the parameters in Table 5, it can be said that all models satisfactorily fitted the kinetics of tartrazine on WC, according to the R2 > 0.98 in all cases; therefore, it can be said that the process is controlled by diffusive and chemisorption phenomena. The value of parameter k3 of the Weber–Morris Intraparticle Diffusion model suggests a high diffusion rate during the process. The graph did not cut the origin; therefore, diffusion is not the limiting step. The process occurs in several stages: in the first minutes, there is surface adsorption or transport of CR molecules from the massive phase to the adsorbent surface [32]. Then, intraparticle diffusion of CR anions into the pores of the adsorbent particles occurs. Finally, the equilibrium stage showed gradual adsorption dominated by porous diffusion, resulting in a multilayer process. Consequently, interparticle diffusion participates in the adsorption process but cannot control CR molecules’ overall adsorption. Therefore, more than one mechanism drives the adsorption mechanism [2]. When using MWC in the removal of tartrazine, it was found that pseudo-second-order and Elovich describe the experimental data well, with an excellent approach to the experimental value of qe by that calculated by the model. The parameter α of the Elovich model was higher in MWC than in WC, suggesting that the reduction in adsorption rate with increasing amount adsorbed is more significant in MWC than in WC, in agreement with that reported when using Attalea funifera fibers [48].
The kinetics of CR on WC was Elovich’s model (R2 de 0.9344). By contrast, when using MWC, the models that present an excellent fitting are pseudo-first- and pseudo-second-order (Table 1). As with tartrazine, the fitting to the Elovich model assumes that the adsorption surface is heterogeneous. The high value of α suggests that adsorption occurred rapidly in the initial minutes (Figure 5c). By contrast, the high value recorded for β indicates that desorption can be easily achieved in this system, facilitating the recovery of the contaminant and reuse of the biomaterial [48]. The adsorption rate constants of the pseudo-first and pseudo-second-order models express that the adsorption process occurs more rapidly on the MWC.
From Figure 5, and considering the fitting to the evaluated kinetic models, the mechanism of tartrazine and CR adsorption onto WC is controlled by chemical adsorption and diffusive phenomena involving mass transfer, considering that experiments were developed at pH < pHPZC to enhance the adsorption capacity of the adsorbent. As a result of the kinetic adjustment to the evaluated models, it was proven that the availability of the adsorption sites has huge influence on the adsorption rate [9]. It can be said that, other than the adsorption of CR by modified cellulose particles, the surfactant and CR molecules are attracted to each other by electrostatic forces resulting in the precipitation of the CR-CTAC complex; the above results are similar to those reported by Ranjbar et al. [3].
The kinetic adjustment to the pseudo-second-order may describe the breakthrough curve in a continuous system; an overall adsorbate material balance could do the above to obtain simple analytical expressions for the adsorbate breakthrough curve in a fixed bed of adsorbent. Then, the obtained equations can be used for scale-up and design of fixed-bed adsorption columns for removing contaminants from water and wastewater. The above mentioned is recommended, considering that practical adsorption systems generally operate in the fixed-bed mode for treating large volumes of polluted water [54].

3.5. Adsorption Equilibrium

The adsorption equilibrium study was carried out to analyze the process’s behavior in response to changes in the initial concentration, keeping the adsorbent dose, pH, and contact time constant. The experimental data were also adjusted to the Langmuir, Freundlich, and Dubinin–Radushkevich models to identify the pollutant removal mechanisms [55]. The fitting to Langmuir, Freundlich, and Dubinin–Radushkevich is presented in Figure 6; parameters are presented in Table 5.
From the parameters in Table 6, it can be said that the model that best fits the experimental adsorption equilibrium data of tartrazine and CR on WC and MWC is the Freundlich model, indicating that the process occurs by chemisorption in the presence of multilayers, with different adsorption energies and non-uniform heat distribution, due to the heterogeneity of the active centers of the two adsorbents. Strong bonds first occupy the active adsorption sites, and this strength decreases as the ions occupy them [27]. The kf is higher when the dyes’ adsorption on MWC occurs, indicating its higher selectivity for these than WC. The values of Freundlich’s constant n are in the range 1–10 only when CR is higher on MWC, indicating that the chemical bonds formed between the adsorbents and this dye are strong, which could be due to the reactive nature of the pollutant and the modification of the biomaterial [28]. The E parameter of the Dubinin–Radushkevich model is higher for MWC when removing both dyes, indicating that the ion exchange process is higher in modified cellulose than in natural cellulose [27]. Values below 8 kJ/mol represent the process’s physical nature, while values between 8 and 16 kJ/mol indicate the chemical process. The data provided in Table 2 showed that removing the dyes on both adsorbents occurred due to chemical interactions involving the functional groups and electron transfer between the adsorbate and adsorbents. The removal of tartrazine has been previously reported as showing that the Freundlich model best describes the process, using bentonite modified with hexadecyltrimethylammonium bromide [14] and activated Carbon from Lantana camara [50]. Langmuir was a better fit using activated carbon made from Moringa [5].
Table 7 shows the Langmuir parameter qmax data reported for removing tartrazine and CR with adsorbents of a different nature. It shows the adsorption capacity of tartrazine on MWC. Concerning the RC, the results obtained in the present study are in the average for bio-adsorbents of lignocellulosic origin.

4. Conclusions

In this work, favorable results were obtained using bio-adsorbents prepared from wheat residues in the adsorption of tartrazine and CR. From TGA and DSC it was established that wheat residues are a valuable source for cellulose extraction. The modification with CTAC was effective and showed promising results as an adsorbent of tartrazine and Congo red due to the protonation of the adsorbent surface. Decreasing the adsorbent dose and increasing the initial concentration favored the removal of contaminants, achieving tartrazine removals of 2.31 mg/g on WC and 18.85 mg/g on MWC, and for CR of 18.5 mg/g on WC and 19.92 mg/g with MWC with removal percentages above 95% with the quaternate biomass in all cases. Adsorption kinetics showed that equilibrium was reached at 120 and 480 min when MWC and WC were used, respectively. The obtained results (highest R2) verified that the pseudo-second-order model is the best-fitted model for this adsorption. The experimental data are well-fitted with the Freundlich isotherm model. From these findings, in future studies we expect to model the mass transfer interactions between sorbate and adsorbent, as well as to simulate scale adsorption packed columns and perform technology transfer.

Author Contributions

Conceptualization, K.J.F.-L. and Á.V.-O.; data curation, Á.V.-O. and K.J.F.-L.; formal analysis, Á.V.-O., R.O.-T. and K.J.F.-L.; funding acquisition, Á.V.-O.; investigation, Á.V.-O. and K.J.F.-L.; methodology, Á.V.-O. and R.O.-T.; project administration, Á.V.-O. and R.O.-T.; resources, Á.V.-O., R.O.-T. and K.J.F.-L.; software, Á.V.-O.; supervision, Á.V.-O. and R.O.-T.; validation, Á.V.-O. and K.J.F.-L.; visualization, Á.V.-O. and K.J.F.-L.; writing—original draft, Á.V.-O.; writing—review and editing, R.O.-T. and K.J.F.-L. All authors have read and agreed to the published version of the manuscript.

Funding

This research received no external funding.

Institutional Review Board Statement

Not applicable.

Informed Consent Statement

Not applicable.

Data Availability Statement

Not applicable.

Acknowledgments

The authors would like to acknowledge the Universidad de Cartagena for financing this research and providing the materials, equipment, and laboratory facilities required to conduct this research project successfully.

Conflicts of Interest

The authors declare no conflict of interest.

References

  1. Salahuddin, N.; Abdelwahab, M.A.; Akelah, A.; Elnagar, M. Adsorption of Congo red and crystal violet dyes onto cellulose extracted from Egyptian water hyacinth. Nat. Hazards 2021, 105, 1375–1394. [Google Scholar] [CrossRef]
  2. Sharma, A.; Siddiqui, Z.M.; Dhar, S.; Mehta, P.; Pathania, D. Adsorptive removal of congo red dye (CR) from aqueous solution by Cornulaca monacantha stem and biomass-based activated carbon: Isotherm, kinetics and thermodynamics. Sep. Sci. Technol. 2019, 54, 916–929. [Google Scholar] [CrossRef]
  3. Ranjbar, D.; Raeiszadeh, M.; Lewis, L.; MacLachlan, M.J.; Hatzikiriakos, S.G. Adsorptive removal of Congo red by surfactant modified cellulose nanocrystals: A kinetic, equilibrium, and mechanistic investigation. Cellulose 2020, 27, 3211–3232. [Google Scholar] [CrossRef]
  4. Gao, Y.; Deng, S.Q.; Jin, X.; Cai, S.L.; Zheng, S.R.; Zhang, W.G. The construction of amorphous metal-organic cage-based solid for rapid dye adsorption and time-Dependent dye separation from water. Chem. Eng. J. 2019, 357, 129–139. [Google Scholar] [CrossRef]
  5. Reck, I.M.; Paixão, R.M.; Bergamasco, R.; Vieira, M.F.; Vieira, A.M.S. Removal of tartrazine from aqueous solutions using adsorbents based on activated carbon and Moringa oleifera seeds. J. Clean. Prod. 2018, 171, 85–97. [Google Scholar] [CrossRef]
  6. Elgarahy, A.M.; Elwakeel, K.Z.; Elshoubaky, G.A.; Mohammad, S.H. Untapped Sepia Shell–Based Composite for the Sorption of Cationic and Anionic Dyes. Water Air Soil Pollut. 2019, 230, 1–23. [Google Scholar] [CrossRef]
  7. Hussain, I.; Li, Y.; Qi, J.; Li, J.; Wang, L. Nitrogen-Enriched carbon sheet for Methyl blue dye adsorption. J. Environ. Manag. 2018, 215, 123–131. [Google Scholar] [CrossRef]
  8. Javaid, R.; Qazi, U.Y. Catalytic oxidation process for the degradation of synthetic dyes: An overview. Int. J. Environ. Res. Public Health 2019, 16, 2066. [Google Scholar] [CrossRef] [Green Version]
  9. Karaman, C.; Karaman, O.; Show, P.L.; Karimi-Maleh, H.; Zare, N. Congo red dye removal from aqueous environment by cationic surfactant modified-Biomass derived carbon: Equilibrium, kinetic, and thermodynamic modeling, and forecasting via artificial neural network approach. Chemosphere 2022, 290, 133346. [Google Scholar] [CrossRef]
  10. Ranjbari, S.; Ayati, A.; Tanhaei, B.; Al-Othman, A.; Karimi, F. The surfactant-ionic liquid bi-functionalization of chitosan beads for their adsorption performance improvement toward Tartrazine. Environ. Res. 2022, 204, 111961. [Google Scholar] [CrossRef]
  11. Wu, L.; Xu, Y.; Lv, X.; Chang, X.; Ma, X.; Tian, X.; Shi, X.; Li, X.; Kong, X. Impacts of an azo food dye tartrazine uptake on intestinal barrier, oxidative stress, inflammatory response and intestinal microbiome in crucian carp (Carassius auratus). Ecotoxicol. Environ. Saf. 2021, 223, 112551. [Google Scholar] [CrossRef] [PubMed]
  12. Mahmoodi, N.M.; Taghizadeh, A.; Taghizadeh, M.; Abdi, J. In situ deposition of Ag/AgCl on the surface of magnetic metal-organic framework nanocomposite and its application for the visible-light photocatalytic degradation of Rhodamine dye. J. Hazard. Mater. 2019, 378, 120741. [Google Scholar] [CrossRef]
  13. Elgarahy, A.M.; Elwakeel, K.Z.; Mohammad, S.H.; Elshoubaky, G.A. Multifunctional eco-friendly sorbent based on marine brown algae and bivalve shells for subsequent uptake of Congo red dye and copper(II) ions. J. Environ. Chem. Eng. 2020, 8, 103915. [Google Scholar] [CrossRef]
  14. Otavo-Loaiza, R.A.; Sanabria-González, N.R.; Giraldo-Gómez, G.I. Tartrazine Removal from Aqueous Solution by HDTMA-Br-Modified Colombian Bentonite. Sci. World J. 2019, 2019, 2042563. [Google Scholar] [CrossRef] [PubMed]
  15. Mahmoodi, N.M.; Oveisi, M.; Taghizadeh, A.; Taghizadeh, M. Synthesis of pearl necklace-like ZIF-8@chitosan/PVA nanofiber with synergistic effect for recycling aqueous dye removal. Carbohydr. Polym. 2020, 227, 115364. [Google Scholar] [CrossRef] [PubMed]
  16. Dai, H.; Huang, Y.; Zhang, H.; Ma, L.; Huang, H.; Wu, J.; Zhang, Y. Direct fabrication of hierarchically processed pineapple peel hydrogels for efficient Congo red adsorption. Carbohydr. Polym. 2019, 19, 115599. [Google Scholar] [CrossRef] [PubMed]
  17. Hou, T.; Guo, K.; Wang, Z.; Zhang, X.F.; Feng, Y.; He, M.; Yao, J. Glutaraldehyde and polyvinyl alcohol crosslinked cellulose membranes for efficient methyl orange and Congo red removal. Cellulose 2019, 26, 5065–5074. [Google Scholar] [CrossRef]
  18. Jiang, R.; Zhu, H.Y.; Fu, Y.Q.; Zong, E.M.; Jiang, S.T.; Li, J.B.; Zhu, J.Q.; Zhu, Y.Y. Magnetic NiFe2O4/MWCNTs functionalized cellulose bioadsorbent with enhanced adsorption property and rapid separation. Carbohydr. Polym. 2021, 252, 117158. [Google Scholar] [CrossRef]
  19. Shiralipour, R.; Larki, A. Pre-concentration and determination of tartrazine dye from aqueous solutions using modified cellulose nanosponges. Ecotoxicol. Environ. Saf. 2017, 135, 123–129. [Google Scholar] [CrossRef]
  20. Shalaby, S.M.; Madkour, F.F.; El-Kassas, H.Y.; Mohamed, A.A.; Elgarahy, A.M. Green synthesis of recyclable iron oxide nanoparticles using Spirulina platensis microalgae for adsorptive removal of cationic and anionic dyes. Environ. Sci. Pollut. Res. 2021, 28, 65549–65572. [Google Scholar] [CrossRef]
  21. Fan, C.; Zhang, Y. Adsorption isotherms, kinetics and thermodynamics of nitrate and phosphate in binary systems on a novel adsorbent derived from corn stalks. J. Geochem. Explor. 2018, 188, 95–100. [Google Scholar] [CrossRef]
  22. Al-Jubory, F.K.; Mujtaba, I.M.; Abbas, A.S. Preparation and characterization of biodegradable crosslinked starch ester as adsorbent. AIP Conf. Proc. 2020, 2213, 020165. [Google Scholar] [CrossRef]
  23. Xia, F.; Yang, H.; Li, L.; Ren, Y.; Shi, D.; Chai, H.; Ai, H.; He, Q.; Gu, L. Enhanced nitrate adsorption by using cetyltrimethylammonium chloride pre-loaded activated carbon. Environ. Technol. 2019, 1–11. [Google Scholar] [CrossRef]
  24. Paudel, S.R.; Banjara, S.P.; Choi, O.K.; Park, K.Y.; Kim, Y.M.; Lee, J.W. Pretreatment of agricultural biomass for anaerobic digestion: Current state and challenges. Bioresour. Technol. 2017, 245, 1194–1205. [Google Scholar] [CrossRef] [PubMed]
  25. Naik, D.L.; Sharma, A.; Chada, R.R.; Kiran, R.; Sirotiak, T. Modified pullout test for indirect characterization of natural fiber and cementitious matrix interface properties. Constr. Build. Mater. 2019, 208, 381–393. [Google Scholar] [CrossRef]
  26. Tejada-Tovar, C.; Villabona-Ortíz, Á.; Gonzalez-Delgado, Á.D. Adsorption of azo-anionic dyes in a solution using modified coconut (Cocos nucifera) mesocarp: Kinetic and equilibrium study. Water 2021, 13, 1382. [Google Scholar] [CrossRef]
  27. Al-Ghouti, M.A.; Da’ana, D.A. Guidelines for the use and interpretation of adsorption isotherm models: A review. J. Hazard. Mater. 2020, 393, 122383. [Google Scholar] [CrossRef]
  28. Shen, Z.; Zhang, Y.; McMillan, O.; Jin, F.; Al-Tabbaa, A. Characteristics and mechanisms of nickel adsorption on biochars produced from wheat straw pellets and rice husk. Environ. Sci. Pollut. Res. 2017, 24, 12809–12819. [Google Scholar] [CrossRef] [Green Version]
  29. Herrera-Barros, A.; Tejada-Tovar, C.; Villabona-Ortíz, A.; Gonzalez-Delgado, A.D.; Benitez-Monroy, J. Cd (II) and Ni (II) uptake by novel biosorbent prepared from oil palm residual biomass and Al2O3 nanoparticles. Sustain. Chem. Pharm. 2020, 15, 100216. [Google Scholar] [CrossRef]
  30. Sahnoun, S.; Boutahala, M. Adsorption removal of tartrazine by chitosan/polyaniline composite: Kinetics and equilibrium studies. Int. J. Biol. Macromol. 2018, 114, 1345–1353. [Google Scholar] [CrossRef]
  31. Mohebali, S.; Bastani, D.; Shayesteh, H. Equilibrium, kinetic and thermodynamic studies of a low-cost biosorbent for the removal of Congo red dye: Acid and CTAB-acid modified celery (Apium graveolens). J. Mol. Struct. 2019, 1176, 181–193. [Google Scholar] [CrossRef]
  32. Parvin, S.; Biswas, B.K.; Rahman, M.A.; Rahman, M.H.; Anik, M.S.; Uddin, M.R. Study on adsorption of Congo red onto chemically modified egg shell membrane. Chemosphere 2019, 236, 124326. [Google Scholar] [CrossRef] [PubMed]
  33. Xu, C.; Wang, H.; Yang, W.; Ma, L.; Lin, A. Expanded Graphite Modified by CTAB-KBr/H3PO4 for Highly Efficient Adsorption of Dyes. J. Polym. Environ. 2018, 26, 1206–1217. [Google Scholar] [CrossRef]
  34. Xu, J.; Krietemeyer, E.F.; Boddu, V.M.; Liu, S.X.; Liu, W.C. Production and characterization of cellulose nanofibril (CNF) from agricultural waste corn stover. Carbohydr. Polym. 2018, 192, 202–207. [Google Scholar] [CrossRef] [PubMed]
  35. Danmallam, A.A.; Dabature, W.L.; Pindiga, N.Y.; Magaji, B.; Aboki, M.A.; Ibrahim, D.; Zanna, U.A.S.; Muktar, M.S. The Kinetics of the Adsorption Process of Cr (VI) in Aqueous Solution Using Neem Seed Husk (Azadirachta indica) Activated Carbon. Phys. Sci. Int. J. 2020, 24, 1–13. [Google Scholar] [CrossRef]
  36. Herlina Sari, N.; Wardana, I.N.G.; Irawan, Y.S.; Siswanto, E. Characterization of the Chemical, Physical, and Mechanical Properties of NaOH-treated Natural Cellulosic Fibers from Corn Husks. J. Nat. Fibers 2018, 15, 545–558. [Google Scholar] [CrossRef]
  37. Tasrin, S.; Mohamed, M.F.S.; Padmanaban, V.C.; Selvaraju, N. Surface modification of nanocellulose using polypyrrole for the adsorptive removal of Congo red dye and chromium in binary mixture. Int. J. Biol. Macromol. 2020, 151, 322–332. [Google Scholar] [CrossRef]
  38. Aiyesanmi, A.F.; Adebayo, M.A.; Arowojobe, Y. Biosorption of Lead and Cadmium from Aqueous Solution in Single and Binary Systems Using Avocado Pear Exocarp: Effects of Competing Ions. Anal. Lett. 2020, 53, 2868–2885. [Google Scholar] [CrossRef]
  39. Li, Y.; Xiao, H.; Pan, Y.; Wang, L. Novel Composite Adsorbent Consisting of Dissolved Cellulose Fiber/Microfibrillated Cellulose for Dye Removal from Aqueous Solution. ACS Sustain. Chem. Eng. 2018, 6, 6994–7002. [Google Scholar] [CrossRef]
  40. Beroual, M.; Mehelli, O.; Boumaza, L.; Trache, D.; Tarchoun, A.F.; Derradji, M.; Khimeche, K. Synthesis and Characterization of Microcrystalline Cellulose from Giant Reed Using Different Delignification Processes; Springer: Singapore, 2021. [Google Scholar]
  41. Mohamed Pauzan, A.S.; Ahad, N. Biomass Modification Using Cationic Surfactant Cetyltrimethylammonium Bromide (CTAB) to Remove Palm-Based Cooking Oil. J. Chem. 2018, 2018. [Google Scholar] [CrossRef]
  42. Wang, H.; Wang, S.; Gao, Y. Cetyl trimethyl ammonium bromide modified magnetic biochar from pine nut shells for efficient removal of acid chrome blue K. Bioresour. Technol. 2020, 312, 123564. [Google Scholar] [CrossRef] [PubMed]
  43. Zainuddin, N.; Ahmad, I.; Kargarzadeh, H.; Ramli, S. Hydrophobic kenaf nanocrystalline cellulose for the binding of curcumin. Carbohydr. Polym. 2017, 163, 261–269. [Google Scholar] [CrossRef] [PubMed]
  44. Othman, S.H.; Edwal, S.A.M.; Risyon, N.P.; Basha, R.K.; Talib, R.A. Water sorption and water permeability properties of edible film made from potato peel waste. Food Sci. Technol. 2017, 37, 63–70. [Google Scholar] [CrossRef] [Green Version]
  45. Othman, S.H.; Majid, N.A.; Tawakkal, I.S.M.A.; Basha, R.K.; Nordin, N.; Shapi’i, R.A. Tapioca starch films reinforced with microcrystalline cellulose for potential food packaging application. Food Sci. Technol. 2019, 39, 605–612. [Google Scholar] [CrossRef] [Green Version]
  46. Yang, W.; Qi, G.; Kenny, J.M.; Puglia, D.; Ma, P. Effect of Cellulose Nanocrystals and Lignin Nanoparticles on Mechanical, Antioxidant and Water Vapour Barrier Properties of Glutaraldehyde Crosslinked PVA Films. Polymers 2020, 12, 1364. [Google Scholar] [CrossRef]
  47. Madan, S.; Shaw, R.; Tiwari, S.; Tiwari, S.K. Adsorption dynamics of Congo red dye removal using ZnO functionalized high silica zeolitic particles. Appl. Surf. Sci. 2019, 487, 907–917. [Google Scholar] [CrossRef]
  48. Marques, B.S.; Frantz, T.S.; Sant’Anna Cadaval Junior, T.R.; Pinto, L.A.d.A.; Dotto, G.L. Adsorption of a textile dye onto piaçava fibers: Kinetic, equilibrium, thermodynamics, and application in simulated effluents. Environ. Sci. Pollut. Res. 2019, 26, 28584–28592. [Google Scholar] [CrossRef]
  49. Mondal, N.K.; Kar, S. Potentiality of banana peel for removal of Congo red dye from aqueous solution: Isotherm, kinetics and thermodynamics studies. Appl. Water Sci. 2018, 8, 157. [Google Scholar] [CrossRef] [Green Version]
  50. Goscianska, J.; Ciesielczyk, F. Lanthanum enriched aminosilane-grafted mesoporous carbon material for efficient adsorption of tartrazine azo dye. Microporous Mesoporous Mater. 2019, 280, 7–19. [Google Scholar] [CrossRef]
  51. Mahmoodi, N.M.; Taghizadeh, M.; Taghizadeh, A. Activated carbon/metal-organic framework composite as a bio-based novel green adsorbent: Preparation and mathematical pollutant removal modeling. J. Mol. Liq. 2019, 277, 310–322. [Google Scholar] [CrossRef]
  52. Litefti, K.; Freire, M.S.; Stitou, M.; González-Álvarez, J. Adsorption of an anionic dye (Congo red) from aqueous solutions by pine bark. Sci. Rep. 2019, 9, 16530. [Google Scholar] [CrossRef] [PubMed] [Green Version]
  53. Jiang, Z.; Hu, D. Molecular mechanism of anionic dyes adsorption on cationized rice husk cellulose from agricultural wastes. J. Mol. Liq. 2019, 276, 105–114. [Google Scholar] [CrossRef]
  54. Hubbe, M.A.; Azizian, S.; Douven, S. Implications of apparent pseudo-second-order adsorption kinetics onto cellulosic materials: A review. BioResources 2019, 14, 7582–7626. [Google Scholar] [CrossRef]
  55. Tan, C.H.C.; Sabar, S.; Hussin, M.H. Development of immobilized microcrystalline cellulose as an effective adsorbent for methylene blue dye removal. S. Afr. J. Chem. Eng. 2018, 26, 11–24. [Google Scholar] [CrossRef]
  56. Rani, K.C.; Naik, A.; Chaurasiya, R.S.; Raghavarao, K.S.M.S. Removal of toxic Congo red dye from water employing low-cost coconut residual fiber. Water Sci. Technol. 2017, 75, 2225–2236. [Google Scholar] [CrossRef] [PubMed]
Figure 1. Thermograms of (a) TGA and (b) DSC of wheat cellulose.
Sustainability 14 03640 g001
Figure 2. SEM and EDS micrographs of (a) wheat residues, (b) wheat cellulose (WC), and (c) modified wheat cellulose (MWC).
Sustainability 14 03640 g002aSustainability 14 03640 g002b
Figure 3. Effect of initial concentration and adsorbent dosage on removal efficiency of (a) tartrazine and (b) CR on natural cellulose and modified cellulose from wheat residues.
Sustainability 14 03640 g003
Figure 4. Effect of initial concentration and adsorbent dosage on removing (a) tartrazine and (b) CR on natural cellulose and modified cellulose from wheat residues.
Sustainability 14 03640 g004
Figure 5. Adsorption kinetics of (a) tartrazine on WC, (b) tartrazine on MWC, (c) CR on WC, and (d) CR on MWC.
Sustainability 14 03640 g005
Figure 6. Adsorption isotherms of (a) tartrazine on WC, (b) tartrazine on MWC, (c) CR on WC, and (d) CR on MWC.
Sustainability 14 03640 g006aSustainability 14 03640 g006b
Table 1. Non-linear kinetic models for evaluating tartrazine and Congo red removal.
Kinetic ModelEquationParameters
Pseudo-first-order q t = q e ( 1 e k 1 t ) k1 (min−1): kinetic constant of pseudo-first-order
Pseudo-second-order q t = t 1 q e 2 k 2 + t q e k2 (g/mg min): kinetic constant of pseudo-first-order
Elovich q t = 1 β ln ( α β ) + 1 β ln ( t ) β (g/mg): exponent indicating the capacity of adsorption
α (mg/g min): Elovich constant indicating the rate of adsorption
Table 2. Adsorption isotherm models.
ModelEquationParameters
Langmuir q e = q max b C e 1 + b C e qmax (mg/g): maximum amount of analyte removed per unit weight of biomass
b (L/mg): constant related to the affinity of the binding sites with the contaminant
Ce (mg/L): concentration of the remaining contaminant in solution
Freundlich q e = k F C e 1 n kF (mg/g): adsorption capacity indicator
n: indicates the effect of concentration on adsorption capacity and represents the adsorption intensity
Dabunin–Radushkevich q e = q D R × e K D R ε e
ε = R T × ln ( 1 + 1 C e )
E = 1 2 K D R
ε2: l Polanyi’s potential which is based on temperature
KDR (mol2/kJ2): Dubinin–Radushkevich constant related to adsorption energy
E (kJ/mol): average adsorption energy per molecule of adsorbate required to transfer one mole of the ion from the solution to the adsorbent surface
Table 3. ANOVA for the removal efficiency of tartrazine on bio-adsorbents prepared from wheat residues.
SourceBio-adsorbent
WCMWC
Sum of SquaresF-Ratiop-ValueSum of SquaresF-Ratiop-Value
A: Adsorbent dosage197.02194.140.00230.020.080.799
B: Initial concentration450.202215.130.00072.779.920.05
AA1.46500.700.461.936.920.078
AB93.936544.890.00682.398.540.06
BB76.037136.330.00920.381.360.33
Total error6.2782 0.84
Total (corrected)824.94 8.37
Table 4. ANOVA for the removal efficiency of CR on bio adsorbents prepared from wheat residues.
SourceBio-adsorbent
WCMWC
Sum of SquaresF-Ratiop-ValueSum of SquaresF-Ratiop-Value
A:Adsorbent dosage361.10611.610.040.042.620.20
B:Initial concentration46.21951.490.310.3823.110.01
AA77.5822.490.210.169.810.05
AB50.32981.620.290.021.280.34
BB21.67060.700.470.010.890.42
Total error93.2971 0.05
Total (corrected)650.205 0.07
Table 5. Fitting parameters to adsorption kinetic models.
Kinetic ModelParametersTartrazineCR
WCMWCWCMWC
Pseudo-first-orderqe (mg g−1)8.2216.397.748.56
k1 (min−1)0.820.110.040.18
SS0.470.630.550.09
R20.990.9120.790.99
Pseudo-second-orderk2 (mg g−1 min−1)0.830.010.010.04
qe2 (mg g−1)8.2617.198.148.79
SS1.040.490.490.15
R20.990.960.880.98
Elovichβ (g mg−1)5.08 × 1037236.614.631.58 × 106
α (mg g−1 min−1)11.420.650.982.44
SS6.010.0783.030.84
R20.990.960.930.91
Intraparticle diffusionk3 (min1/2)8.2114.736.108.0357
SS0.080.940.620.3343
R20.990.690.470.8401
Where qe (mg g−1) is the adsorption capacity at equilibrium time, k1 (min−1) is the pseudo-first-order kinetic rate constant, k2 (g−1 min−1) is the pseudo-second-order kinetic rate constant, α (mg g−1 min−1) is the Elovich constant, β (g mg−1) is the exponent in Elovich’s equation; SS: sum of squares, k3 is the intraparticle diffusion rate constant and R2 is the coefficient of determination.
Table 6. Adsorption isotherm parameters.
ModelParametersTartrazineCR
WCMWCWCMWC
Langmuirqmax (mg g−1)83.10752.19131.63253.13
b (L mg−1)6.017 × 10−40.0030.721.98
R20.710.790.820.87
SS0.060.0322.302.40
FreundlichKF (mg g−1 (L mg−1)1/n)0.0472.213.01134.81
n0.990.992.463.79
R20.950.990.9620.99
SS0.451.491.510.98
Dubinin–RadushkevichqDR (mg/g)5.1932.29230.66237.43
KDR (mol2/kJ2)1.90 × 10−45.05 × 10−61.35 × 10−66.81 × 10−6
E (KJ/mol)51.24314.74609.28270.94
R20.790.880.790.77
SS0.783.461.0011.05
Where qmax (mg g−1) is the maximum adsorption capacity, b (L mg−1) is the Langmuir constant related to the adsorption heat, kF (mg g−1 (L mg−1)1/n) and n are the Freundlich’s rate constants referred to the adsorption capacity and intensity, respectively; qDR (mg g−1) Dubinin–Radushkevich’s adsorption capacity, KDR (mol2 kJ−2) is the Dubinin–Radushkevich’s rate constant, and E (KJ mol−1) average adsorption energy per molecule of adsorbate required to transfer one mole of the ion from the solution to the surface of the adsorbent; SS: sum of squares.
Table 7. qmax of tartrazine and CR according to the Langmuir model using various adsorbents.
ContaminantAdsorbentqmax (mg/g)Reference
TartrazineWMC752.19Present study
Chitosan/polyaniline compounds584[30]
Cellulose nano sponges modified with methyltriotrioctyl ammonium chloride180[19]
Moringa seed activated carbon91.27[5]
WC83.10Present study
Modified bentonite with hexadecyltrimethylammonium bromide40.79[14]
Activated babassu coconut carbon19.20[5]
Babassu coconut kernel Activated Carbon11.99
Congo redCellulose nanocrystals modified with cetyltrimethylammonium bromide448.43[3]
NaOH-modified water hyacinth cellulose nanocrystals181.8[1]
Hydrogel from pineapple peel extracted by bleaching138.89[16]
MWC137.14Present study
WC131.63
Coconut residues128.94[56]
Hydrogel from water-extracted pineapple peel114.19[16]
Cornulaca activated carbon78.19[2]
Hydrogel made from pineapple peel extracted with NaOH77.52[16]
Hydrogel from pineapple peel extracted with bleached-NaOH75.19[16]
Cornulaca biomass43.42[2]
Publisher’s Note: MDPI stays neutral with regard to jurisdictional claims in published maps and institutional affiliations.

