Article

The Nexus among Energy Consumption, Economic Growth and Trade Openness: Evidence from West Africa

1
School of Economics and Management, China University of Petroleum (Beijing), Beijing 102249, China
2
Darla Moore Business School, University of South Carolina, Columbia, SC 29208, USA
*
Author to whom correspondence should be addressed.
Sustainability 2022, 14(6), 3630; https://doi.org/10.3390/su14063630
Submission received: 22 February 2022 / Revised: 14 March 2022 / Accepted: 16 March 2022 / Published: 19 March 2022

Abstract

:
The West African region has experienced high economic development. With the increasing energy consumption and emissions, how to coordinate the relationship among energy consumption, trade opening, and economic growth, and how to develop a low-carbon development pattern are becoming the most important issues in West Africa. This paper uses the tri-variable Toda-Yamamoto model to investigate the dynamic interactions among energy consumption, economic growth, and trade in West Africa. The findings indicate that, first, the positive impact of energy consumption on economic growth in West Africa has shown a significant lag effect, and energy consumption has a strong trade-dependent relationship to economic promotion. Trade opening and economic growth in West Africa are mutually reinforcing in the long run. Next, the role of foreign trade in boosting economic growth is more significant in countries with lower levels of economic development. Finally, when replacing the energy consumption indicator with CO2 emissions, the results remain robust. Considering the regional development differences, grouping countries by GDP per capita reveals that there exists a bilateral causal relationship between energy consumption and trade openness in the higher economic development group. The impact of trade openness on economic growth is more remarkable in countries with lower levels of economic development in West Africa. The findings have important implications for policymakers in understanding the economic development pattern of West Africa. It is necessary for West African countries to develop an integrated energy and trade policy in order to maintain long-term sustainable economic growth.

1. Introduction

The Economic Community of West African States (ECOWAS) is the largest multilateral economic cooperation organization in Africa. On 19 June 2021, ECOWAS held a summit in Accra, Ghana, and decided to issue a unified currency in 2027, which will be called the “ECO”.As a pioneer of continental integration in Africa, the West African region has experienced high economic growth, with a regional GDP of $737.689 billion in 2020, which accounts for 31.11% of the total GDP of Africa [1]. The economy of the West African region is dominated by agriculture and the mining industry, with crude oil exports accounting for 6.5% of the world’s total [2] As one of the pillars of modern economic and social development, energy plays an important role in promoting regional economic growth. West Africa’s rich agricultural, mining and oil resources have contributed to its export-oriented economic model. Against the backdrop of expanding trade openness and increasingly severe energy consumption constraints, whether West Africa’s economy can grow steadily is of great concern to scholars. Energy consumption in West African countries has brought about a large amount of carbon dioxide emissions, as shown in Figure 1 and Figure 2, The relationship among energy consumption, economic growth, and trade openness is gradually becoming one of the key issues for economic and social development in West Africa.
Against the backdrop of the new trade model of “African sectoral trade” for national economic and social development, Africa has further expanded its foreign trade not only to the Western world but also to its neighboring regions. In the present day, the exports of West Africa come mainly from the exploitation of oil in various countries. It ranks as the third largest crude oil-exporting region following Saudi Arabia and Russia. Crude oil exports of ECONWAS accounted for 6.5% of the world’s total in 2020. In the meantime, the import of refined oil products is about 5 times more than exports. The share of primary, secondary and tertiary sectors in the West African region is 22.57%, 24.99% and 51.91% in 2020, as shown in Figure 1 and Figure 2.
On the other hand, the energy consumption of West African countries brings about a large amount of carbon dioxide emissions, as shown in Figure 3 and Figure 4. Due to the rich natural resource reserves, Nigeria and Ghana have the highest energy consumption and carbon emissions among West African countries. They are the top oil and gold producers in Africa, accounting for approximately 60% and 10% of West Africa’s total GDP respectively, making them the two largest economies in West Africa. Following Nigeria and Ghana, Côte d’Ivoire, Cameroon, Cameroon, and Senegal are the other three large economies in West Africa in terms of energy consumption and carbon emissions [3]. It can be found that the economic development of the West African region is related to energy consumption and carbon emissions. With the increasing energy consumption and emissions due to population growth, urbanization, industrialization, and the pressure of global emissions reduction under the Paris Agreement, how to coordinate the relationship among energy consumption, trade opening, and economic growth, and how to develop a low-carbon development pattern are becoming the most important issues in West Africa.
The relationship among energy consumption, trade development, and economic growth has been a popular topic in the academic sphere. The relationship among these three has generated a great deal of research interest. However, few empirical studies have attempted to examine the causal relationship among energy, trade, and economy at the country level in the West African region. Another fact that should not be overlooked is that there are significant differences in the level of economic development among the countries in the West African region.However, most previous studies have ignored the uneven economic development in Africa [4,5,6]. Taking the per capita USD 1000 as the limit, this paper divides the countries in West Africa region into two groups. Benin (BEN), Cote d’Ivoire (CIV), Cameroon (CMR), Cabo Verde (CPV), Ghana (GHA), Mauritania (MRT), Nigeria (NGA), and Senegal (SEN) belonging to the group with high economic development, which contribute 75.28% and 63.48% to total energy consumption and total trade, respectively. Burkina Faso (BFA), Gambia (GMB), Guinea-Bissau (GNB), Mali (MLI), Niger (NER), Sierra Leone (SLE), and Togo (TGO) belong to the group with a lower level of economic development, which contribute 24.72% and 36.52% to total energy consumption and total trade, respectively.
This paper fills research gaps by exploring the interactions among energy consumption, economic growth and foreign trade in West Africa. 15 countries in West Africa are included in the sample. Guinea and Liberia are omitted because are not included due to data availability. Considering the differences in regional economic development, this paper also examines the relationship in regions with higher and lower levels of economic development. The main contribution of this research lies in the investigation of causal relationships between energy consumption, trade openness, and economic development in the West African region and the comparison of two sub-panels. The findings have important implications for policymakers in understanding the economic development pattern of West Africa. The rest of this study is structured as follows: Section 2 provides a review of the existing literature; Section 3 outlines the model, methodology, and data; Section 4 reports and discusses the empirical results; Section 5 summarizes the study and provides policy implications.

2. Literature Review

2.1. The Relationship between Energy Consumption and Economic Growth

A large body of research has focused on the nexus between energy consumption and economic growth. The relationship between energy consumption and economic growth can be categorized into four hypotheses: the neutral hypothesis (no causality), the conservation hypothesis (one-way causality of economic growth on energy consumption), the growth hypothesis (one-way causality of energy consumption on economic growth) and the feedback hypothesis (existence of two-way causality) [7,8,9]. Some scholars have argued that energy consumption is necessary for economic growth because energy is a direct input in the production process [6,10,11,12,13]. Under this hypothesis, there is a unilateral Granger causal relationship between energy consumption and economic growth. It suggests that the national economy is dependent on energy. Insufficient energy supply will limit economic growth. A number of scholars have also concluded that there is not a causal relationship between energy consumption and economic growth, which implies that the country’s economy is not fully dependent on energy and policies focused on energy conservation will not harm the country’s economic growth [7]. Many scholars have found a bilateral relationship between energy consumption and economic growth. A significant increase in energy consumption will promote the growth of the whole economy, and a significant increase in economic growth will directly lead to a decrease in overall energy consumption [9]. Ozturk et al. investigated the relationship between energy consumption and economic growth in low- and middle-income economies. The results indicate that there is a bilateral relationship between energy consumption and GDP for low- and middle-income countries [14].
Some scholars have also investigated the case of the African region. The causal relationship between economic growth and energy and consumption in the African region has shown significant differences with other regions. Odhiambo used energy prices as an additional variable to determine the relationship between energy consumption and economic growth by considering whether energy prices cause changes in both energy consumption and economic growth [15]. Kahsai et al. divided sub-Saharan Africa into two groups, which are low-income and middle-income countries [16]. The results show that the hypothesis of neutrality persists in the short run for low-income countries, while there is a bilateral causal relationship between economic growth and energy consumption for both groups in the long run. Other researchers have investigated individual countries in Africa and find a unidirectional causal relationship between energy consumption and economic growth [11,12].

2.2. The Nexus between Energy Consumption and Trade Openness

Previous research has shown a significant negative relationship between energy consumption and international trade in different regions. They argued that the increase in the volume of trade greatly increases the need for clean and renewable energy consumption [17,18]. However, some studies on developing countries have shown that energy consumption positively affects trade openness in low-, middle-, and high-income developing countries. There is a bidirectional causal relationship between energy consumption and trade openness [19]. Sardorsky analyzed the case of eight South American countries and found a bilateral Granger causality between international trade and energy consumption. The long-run elasticity suggests that a 1 percent increase in exports per capita is associated with a 0.11 percent increase in energy consumption per capita [18]. Although the literature on the nexus between energy consumption and trade in West Africa is less investigated, current research has demonstrated a positive relationship between the two factors. Adeniyi and Adewuyi investigated the case of several countries in West Africa. The results showed that there exists a positive relationship between energy consumption and international trade in Ghana, Togo, Nigeria, and Senegal, but there is no correlation in Benin and Côte d’Ivoire. Further, country-level analysis showed that the impact of intra-West African trade on fossil fuel consumption in West African countries is significant and diverse [20]. A similar study by Najarzadeh et al. (2015) for 10 OPEC countries showed a statistically significant relationship between energy consumption and trade [21].
The investigation on the relationship among the variables of energy consumption, economic growth and trade openness have received a lot of attention from researchers in the last few years. However, most studies are based on time series analysis of individual countries and regions [22]. Some scholars have used Granger causality to test the feedback hypothesis among various factors such as economic growth and energy consumption, economic growth and trade, and energy consumption and trade in the short, medium and long term [23]. In most developed countries, the increase in trade promotes economic growth, which in turn increases imports, and the increase in energy consumption has a significant impact on economic growth. In Asia, a densely populated continent, increased energy consumption has a significant impact on trade openness and economic growth. Increased trade openness has had a positive impact on economic growth and energy consumption. The findings proved that the shift in energy consumption regulation policies was effective and that increased trade openness played an important role in the country’s development.
Despite the rich investigation on the relationship among energy consumption, economic growth and trade openness by scholars, there is still room for further research. In the case of Africa, energy consumption varies greatly across countries and regions due to geography, resource distribution, and political factors. A research from a regional perspective can directly reflect local development patterns. This paper uses the panel data approach to explore the dynamic relationship among energy consumption, economic growth and trade openness of different countries in West Africa. The findings are valuable for understanding the main drivers of economic growth in Africa and to explore whether energy supply has impact economic growth. It is beneficial for policymakers to make more effective policies in order to improve well-being in Africa.

2.3. The Nexus between Trade Openness and Economic Growth

The nexus between international trade and economic growth is of great interest to scholars. Bhattacharya and Bhattacharya (2016), Tahir and Azid (2018) argued that there is a bilateral and positive relationship between the foreign trade openness and economic growth, suggesting that international integration is a favorable strategy to facilitate economic growth in the long run [24,25]. In contrast, the short-run effects have shown a negative short-term adjustment, suggesting that trade openness may be more difficult for an economy undergoing short-term adjustment [26].
A large body of literature focused on Asian countries suggests a bilateral and positive relationship between economic growth and trade. Ray has found a two-way causal link between foreign exports and economic growth in India and central Asia [27]. Chinese research results have shown that there is a significant positive correlation between exports, imports and economic growth [28,29]. Similar studies on sub-Saharan Africa have shown that exports have a positive relationship with economic growth. However, imports have no significant effect on economic growth in the region. Abdullahi et al. (2016) investigated the case of West Africa and found that a one percent increase in the export variable would lead to a 5.11 percent increase in GDP growth [30]. On the other hand, the impact of imports on GDP growth was positive but insignificant, while foreign exchange had a negative impact on GDP growth. A similar survey in Nigeria showed that international trade has a significant positive impact on the development of Nigeria. Imports, exports and its trade openness all have a huge impact on the economy. This implies that any policy on trade openness will have a direct impact on the economies of countries [31]. Furthermore, a study on Nigeria attempted to fill the last knowledge gap on the relationship between trade openness and economic growth by incorporating institutional quality. The results showed that export trade has a significant positive effect on economic growth, while import and export trade has a positive or negative effect on economic growth. Furthermore, the negative long-run effect of import trade on economic growth in Nigeria decreases as the quality of institutions improves [32]. Some scholars have argued that there is a non-linear relationship between trade openness and economic growth in sub-Saharan Africa. The results showed that there is an inverted U-curve effect on the trade threshold, where the greater the trade openness below the threshold, the greater the impact on economic growth. If trade openness is above the threshold, the greater the trade openness, the smaller the impact of trade on economic growth [33]. In general, exports have a positive impact on economic growth in the long run, while imports produce different directions and sizes of changes in economic growth depending on the period and volume.

3. Methodology and Data

Andriansyah and Messinis extends the Dumitrescu et al. bivariate stationary Granger causality test in heterogeneous panels to a tri-variate version in the Toda-Yamamoto framework [34,35]. A ternary K-order panel vector autoregressive (VAR) equation at time t ( t = 1 ,   ,   T ) is constructed to represent the energy consumption (EC), economic growth which is measured by GDP, and trade openness (TO) of country i . This paper aims to test the Granger causality between the other two variables while controlling for one of the variables. The general dynamic interaction among energy consumption, GDP and trade openness at time t for each country i is measured using a third-order tri-variate panel vector autoregression (VAR) model, as shown in Equations (1)–(3). Referring to Andriansyah and Messinis, Toda-Yamamoto’s Wald causality test is extended to three variables [34]. The requirement that the independent and dependent variables be stationary or have the same order is relaxed.
G D P i , t = α 1 i + p = 1 k β 1 i , p G D P i , t p + p = 1 k γ 1 i , p E C i , t p + P = 1 k δ 1 i , P E x i , t p + ε 1 i , t
E C i , t = α 2 i + p = 1 k β 2 i , p G D P i , t p + p = 1 k γ 2 i , p E C i , t p + P = 1 k δ 2 i , P E x i , t p + ε 2 i , t
T O i , t = α 3 i + p = 1 k β 3 i , p G D P i , t p + p = 1 k γ 3 i , p E C i , t p + P = 1 k δ 3 i , P T O i , t p + ε 3 i , t
where ε 1 i , t ,     ε 2 i , t and ε 3 i , t denote individual white noise error terms, which are assumed to be independently and normally distributed, i.e., ( ε l i , t ) = 0 and E ( ε l i , t 2 ) = σ l i 2 , l = 1 , 2 , 3 . The error terms are independently distributed across countries, i.e., E ( ε l i , t , ε l j , s ) = 0 , i j ,   t , s . The model is assumed to use heterogeneous panel data, where α 1 i , α 2 i and α 3 i are fixed over time. The lag order K is constant in the equation and K > 0 . β l i , p , γ l i , p , and δ l i , p ( l = 1 , 2 , 3 ) can vary in one or more equations. In a bivariate setting with both variables y i and x 1 i being stationary, a general K -th order panel VAR equation can be written as
y i , t = a i + k = 1 K β i ( k ) y i , t k + k = 1 K γ i ( k ) x 1 i , t k + ε i , t
with   K ,   β i = ( β i ( 1 ) , , β i ( k ) ) ,     γ i = ( γ i ( 1 ) , , γ i ( k ) ) . The coefficients of a i ,     β i ( k ) and   γ i ( k ) are constant in the time dimension. The residuals are independently and normally distributed. The homogeneous non-causal hypothesis is tested by the following null and alternative hypotheses (Dumitrescu et al., 2012) [35]:
H 0 : γ i = 0   i = 1 , , N
H 1 : γ i = 0   i = 1 , , N 1
γ j 0   j = N 1 + 1 , N 1 + 2 , , N
Under the H 0 assumption all N are causally unrelated, while under H 1   there are N N 1 causal relations. N 1 is unknown but satisfies the condition 0 N 1 / N < 1 . The null hypothesis can be written as R θ i = 0 , where is R = [ 0 : I K ] a contrast matrix consisting of a horizontally concatenated (K,K + 1) null matrix 0 and a (K,K) identify matrix I K , θ i = ( α i   β i   γ i ) . Dumitrescu and Hurlin showed that under the hypothesis, the panel Wald test statistic Z N , T H n c will asymptote to a normal distribution with mean 0 and variance equal to 1 as T [35].
Z N , T H n c = N 2 K ( W N , T H n c K )
Where W N , T H n c = ( 1 N ) i = 1 N W i , T and W i , T is a single Wald test statistic with cross-sectional units corresponding to a single test H 0 : γ i = 0 and is calculated as follows:
w i , T = θ ^ i R [ σ ^ i 2 R ( Z i Z i ) 1 R ] 1 R θ ^ i = θ ^ i R [ R ( Z i Z i ) 1 R ] 1 R θ ^ i ε ^ i ε ^ i ( T 2 K 1 )
θ i ^ and ε i ^ are the OLS estimates of θ i and residuals from the regression (4). σ ^ i 2 is the variance estimate of ε i ^ , Z i = [ e : Y I ; X l i ] , is a ( T , 2 K + 1 ) matrix consisting of horizontally connected ( T , 1 ) unit vector, a ( T , K ) matrix Y i and a ( T , K ) matrix X 1 i . For a fixed dimension T, the above normal distribution still holds; however, the panel statistic needs to be normalized and standardized to   z ˜ N H n c .
z ˜ N H n c = N × ( T 2 K 5 ) 2 K × ( T K 3 ) × [ ( T 2 K 3 ) ( T 2 K 1 ) × W N , T H n c K ]
In a tri-variate setting with an additional explanatory variable X 2 i , Y i ,   X 1 i and X 2 i can be non-stationary variables with different orders, as shown by the following VAR ( K + m ) linear model:
Y i , t = α i + p = 1 K + m β i , P Y 1 , t P + p = 1 K + m γ i , P X 1 i , t p + p = 1 K + m δ i , P X 2 i , t p + ε i , t
with   Y i = [ y i , 1 : y i , 2 : , y i , K + m ]
X 1 i = [ x 1 i , 1 : x 1 i , 2 : , x 1 i , K + m ]
X 2 i = [ x 2 i , 1 : x 2 i , 2 : , x 2 i , K + m ]
Y i ,   X 1 i are all endogenous with the maximum order m . X 2 i is constant when the Granger causality test of X 1 i on Y i is conducted. If the total lag order is defined as T = K + m , Z i * = [ e : Y i : X 1 i : X 2 i ] is a ( T , 3 T l a g + 1 ) matrix. And θ i * = ( α l i β l i γ l i δ l i ) is a ( 3 T l a g + 1 , 1 )   matrix, and R * = [ 0 : I K : 0 ] is a ( k , 3 T l a g + 1 ) matrix. θ ^ i * and ε ^ i * are the OLS estimates of θ and the residuals of the regression model, respectively. σ ^ i * 2 is the variance estimate of ε ^ i * . Considering the fact that the rank of R * remains the same as the rank of R, the panel causality test of Dumitrescu and Hurlin (2012) can be applied in heterogeneous panels by correcting W i , T , Z N , T H n c and Z ˜ N , T H n c for the Wald statistic as follows. The bootstrapping technique is presented in the appendix.
W i , T * = θ ^ i * R * [ σ ^ i * 2 R * ( Z i * Z i * ) 1 R * ] 1 R * θ ^ i * = θ ^ i * R * [ R * ( Z i * Z i * ) 1 R * ] 1 R * θ ^ i * ε ^ i * ε ^ i * / ( T 3 T l a g 1 )
Z N , T H n c * = N 2 K ( W N , T H n c * K )
Z ˜ N H n c * = N × ( T 3 T l a g 5 ) 2 K × ( T 2 K 3 m 6 ) × [ ( T 3 T l a g 3 ) ( T 3 T l a g 1 ) × W N , T H n c * K ]

4. Data and Empirical Analysis
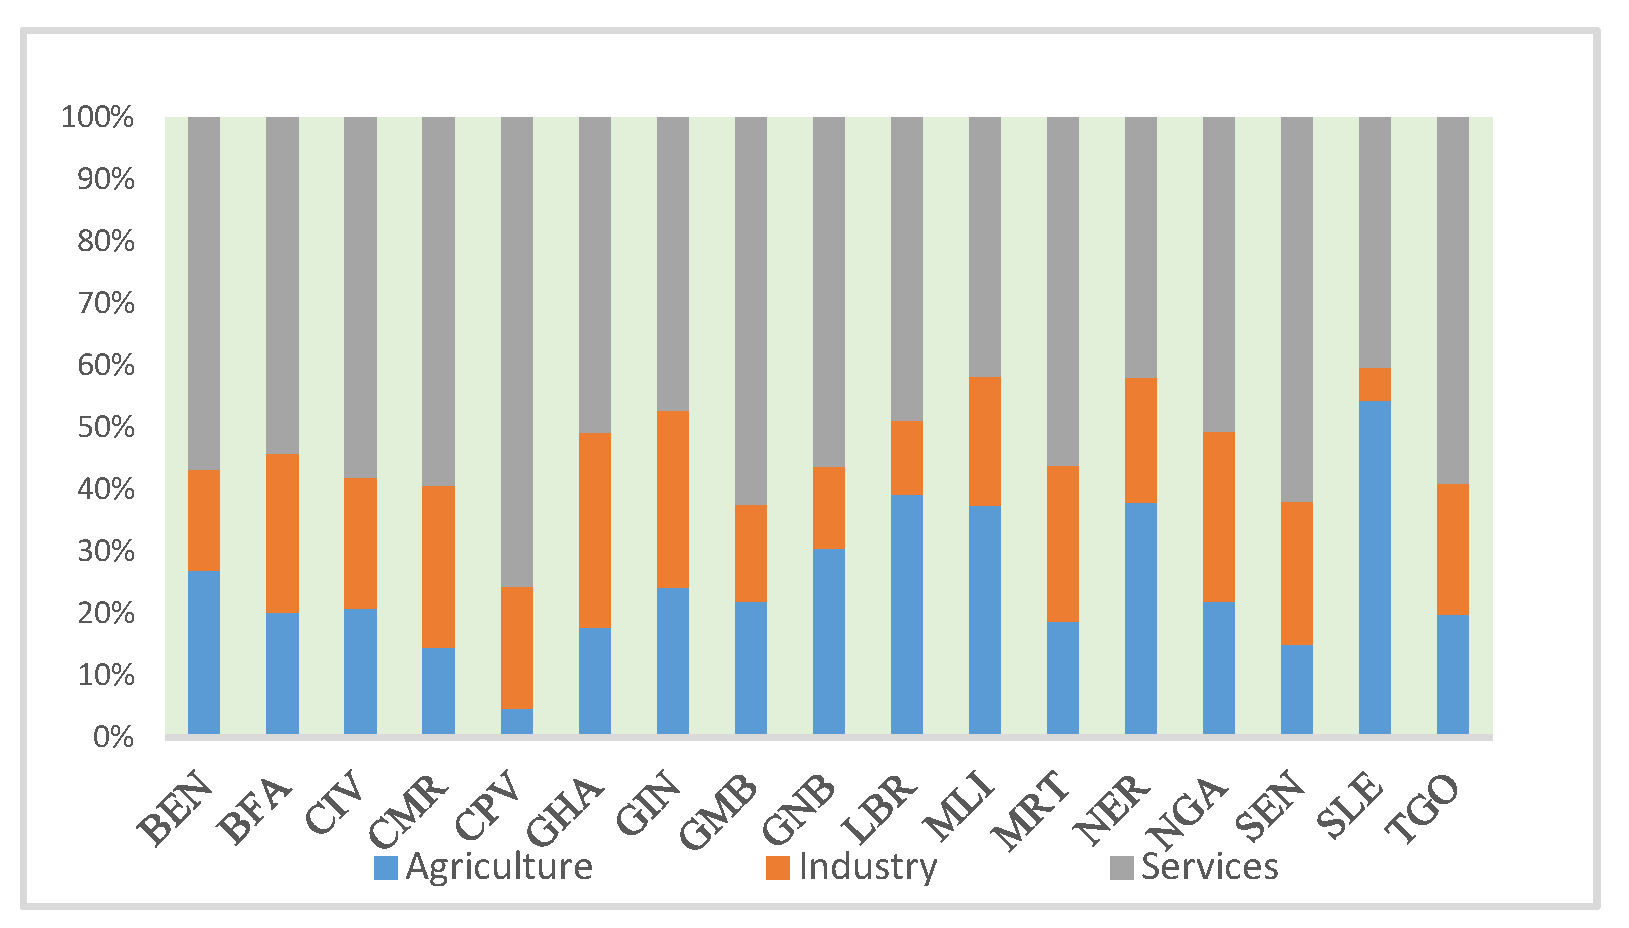
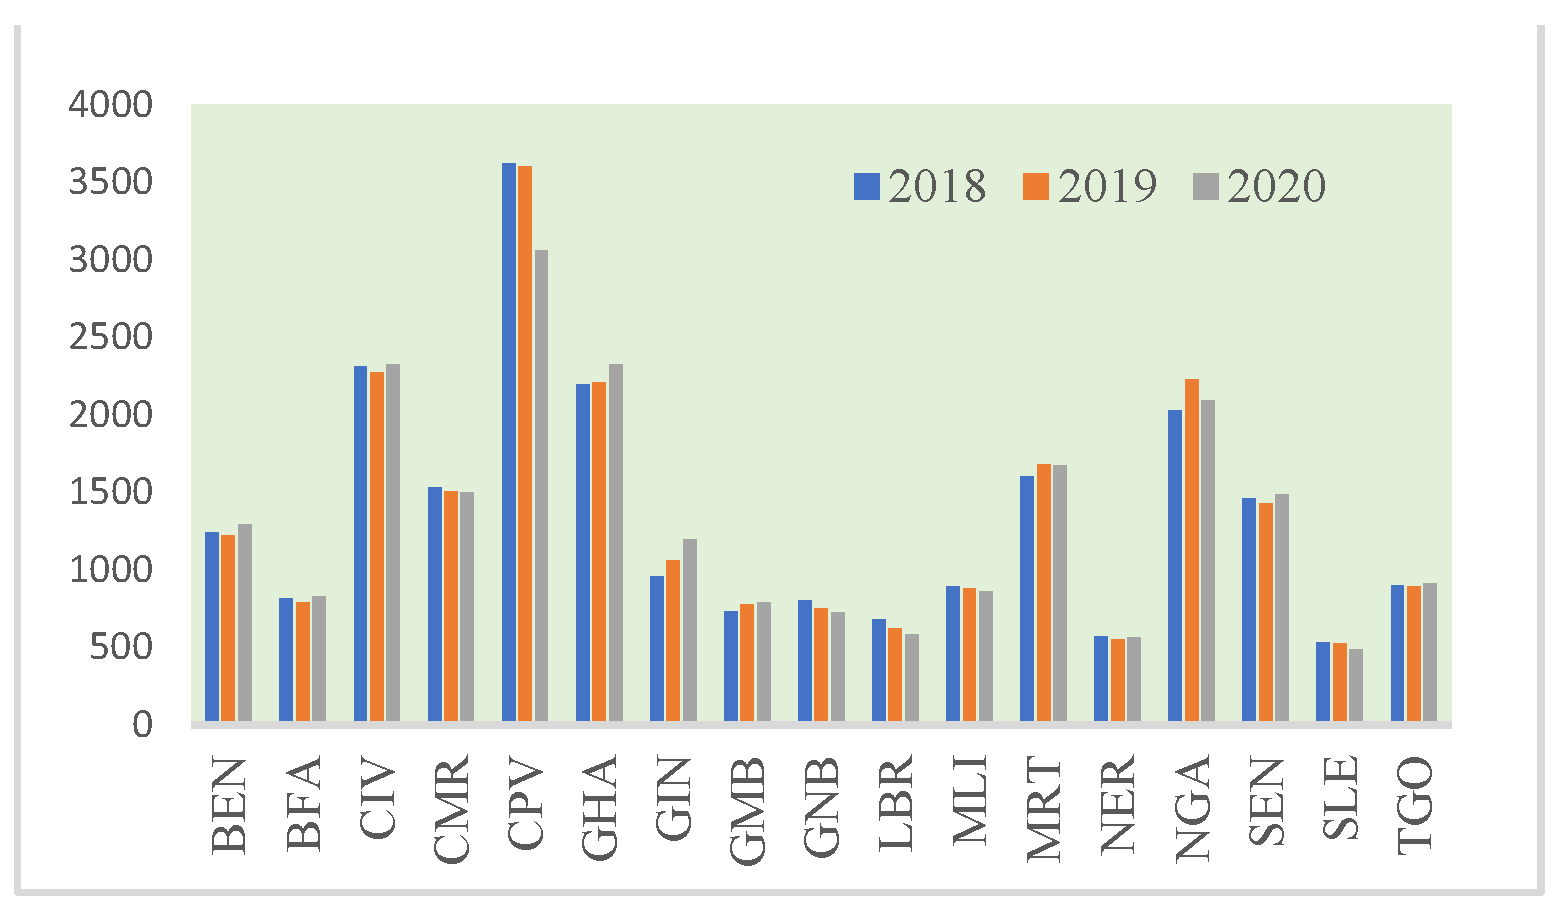
4.1. Data

In this research, the annual data from 1980–2018 of 15 West African countries including Benin, Burkina Faso, Côte d’Ivoire, Cameroon, Cape Verde, Gambia, Ghana, Guinea-Bissau, Mali, Mauritania, Niger, Nigeria, Senegal, Sierra Leone, and Togo were used. There are 17 countries in West Africa, but data for Guinea and Liberia are unavailable. Data weree collected from the World Bank. The indicator for economic growth is GDP per capita (current US$), the indicator for energy consumption is kg of oil equivalent per capita. The adjusted trade dependence ratio was used to measure the trade openness. First, the trade value was calculated by deducting the non-tradable components from total GDP. Then, the trade openness was measured by the ratio of trade value to total GDP in a given year. The adjusted trade dependence ratio can reduce the bias caused by the different composition of GDP in each country.

4.2. Panel Unit Root Test and Co-Integration Test

All three time series data were log-transformed in order to normalize the distributions. Three different unit root tests, LLC, ADF-Fisher and Phillips-Perron (PP), are used to test the stationarity of time series data. The results are shown in Table 1. It indicates that energy consumption is stationary in level, while economic growth and trade openness both have unit roots in level. After the first-order difference, all-time series are tested to be stationary.
Based on the Akaike Information Criterion (AIC), Schwarz’s Bayesian information criterion (BIC), and Quinn information criterion (HQIC) criteria, the maximum lag of K = 1 or K = 2 is concluded. This result is in line with Andriansyah and Messinis [34]. Then, the Johansen co-integration test is used to test the hypothesis of no co-integration in heterogeneous panels as shown in Table 2. It includes the within-dimension tests and between-dimension tests. The results indicate that the null hypothesis of no co-integration is significantly rejected in both tests. There exists a co-integration relationship among energy consumption, economic growth and foreign trade openness in the panel.

4.3. Panel Causality Analysis

In order to investigate the causality relationship among economic growth, energy consumption and international trade in West Africa, Table 3 illustrates the tri-variable Toda-Yamamoto panel test results with 1-period and 2-period lag The results with k = 1 and k = 2 are reported in order to avoid the stochastic disturbance
Table 3 illustrates that there is no significant causal relationship between economic growth and trade openness with one-period lag. At the same time, there exists a bilateral and positive relationship with two-period lag. These findings imply that trade openness and economic growth are mutually reinforcing and have significant lagged effects. This result supports the trade-oriented growth hypothesis that a high level of trade liberalization will promote economic growth. It is in line with Menyah et al., Nguena, who argued that sustained expansion of foreign trade is a priority for African countries to achieve sustained economic growth. Along with the growing market, the trade environment in West Africa is improving [36,37]. As shown in Figure 1, trade as a percentage of GDP has shown an increasing trend from 1980 to 2018 (WDI 2020). It can be partly attributed to the expansion of intra-African economic and trade cooperation. The standard monetary policy implemented by the West African States (ECOWAS) is an effective form of further deepening intra-regional trade cooperation and integration [38,39]. Although African export trading firms are characterized by small size and low export value, Kamugang argued that with deeper regional integration in West Africa, the impact of export costs, export time, and customs procedures on trade risk significantly decreases [40]. Regional integration will facilitate firms to export from small to large volumes. On the other hand, energy consumption and economic growth have shown a bilateral causal relationship with each other. Economic development boosts energy consumption, suggesting that the rapid economic development in West Africa will stimulate the growth of energy demand and maintain sustained and stable economic growth. This result is consistent with Aïssa et al., Akinlo and Okafor, which proved the long-run positive impact of energy consumption on economic growth. West Africa is also facing growing energy demand and energy security issues [41,42,43]. Energy security is a significant issue that hinders the industrialization and development of West African countries, especially among low-income countries [44,45]. Despite the region’s abundant energy resources, the resource wealth has not been translated into energy security [3]. A proper understanding and management of the relationship between energy consumption and economic growth are essential for the long-term planning of the West African economy, energy development strategies, and the formulation of relevant policies and regulations.
In two-period lag, the significance of Z ˜ N H n c is far lower than that of Z N , T H n c , which indicates that the effect of economic development on energy consumption through trade openness is significant. Miller and Upadhyay argued that the level of trade openness must reach a specific scale before it can significantly affect energy consumption [46]. Therefore, it can be concluded that the economy of scale effect, capital formation effect and resource allocation effect in West Africa will be constrained by the size of trade. After controlling for energy consumption in a tri-variate framework, the significance of Z ˜ N H n c is substantially lower than Z N , T H n c , which indicates that foreign trade affects economic growth by significantly influencing energy consumption and hence economic growth; this reflects the high dependence of economic growth on energy consumption in West Africa. In other words, while West Africa increases its energy consumption level through foreign trade, it also increases the economic growth indirectly. Similarly, after controlling for trade, the significance of Z ˜ N H n c , the contribution of energy consumption to economic growth, is substantially lower than Z N , T H n c . It indicates that the role of trade cannot be ignored when considering the impact of energy consumption on economic growth in West Africa.
The economic development pattern of West Africa is characterized by energy-intensive industries. The export products are mainly primary energy products. The trade volume of the mining industry accounts for about three-fourths of the total exports of West Africa. Considering the rich mineral and oil resources, the increase in trade openness has directly contributed to the growth of energy exports in West Africa. On the one hand, the production and export of primary products have significantly promoted industrialization in West Africa. Lash and Madani investigated other economies that are characterized by primary product exports, such as Thailand and ASEAN, and concludes that trade in primary products such as mineral resources can effectively achieve economic growth [47,48]. On the other hand, the energy consumption has shown a remarkable trade dependence characteristic of economic growth promotion in West Africa. The huge dependence on fossil fuel exports and the lack of economic diversification may be a great challenge for sustainable economic growth in West Africa. This finding is in line with Ang, Halicioglu, Hossain, Farhani and Ozturk, Kasman and Duman, and Ansari et al. [49,50,51,52,53,54]. Finally, the results in Table 3 show that trade openness has a significant unilateral causality impact on energy consumption. It is in line with the findings for sub-Saharan Africa. Odhiambo [15] and Ben Jebli et al. argued that as the trade volume increases, the energy consumption in West African increases [55,56]. The energy security and efficiency should be of concern to regulators.

4.4. Panel Analysis Group by GDP Per Capital

There exist large variances in economic structure in West African region, which hinders the region’s achievement of macroeconomic convergence and economic growth [57]. Referring to Li and Lin and Oo, in which countries are grouped by income, we used the boundary of US$1000 per capita to classify the West African region into the higher economic development group, including BEN, CIV, CMR, CPV, GHA, MRT, NGA, and SEN, and the lower economic development group, including BFA, GMB, GNB, MLI, NER, SLE, and TGO [58,59]. The results are shown in Table 4. Unlike the results for West Africa as a whole, the results in Table 4 show a bilateral causal relationship between energy consumption and trade openness in the higher economic development group, with energy consumption also being a driver of trade growth. This finding is in line with previous results. Nnaji et al. argued that shocks to energy consumption in Nigeria have a positive effect on exports in the long run [60]. Adewuyi suggests that there is a significant positive feedback effect between international trade and energy consumption in Senegal, Ghana, and Benin [61]. Table 5 demonstrates that the contribution of trade openness to economic growth in West Africa is more remarkable in countries with lower levels of economic development. Oo (2015) investigated the case of ASEAN countries and found that international trade can effectively promote economic growth in low-income countries [59].
In order to further validate the causal relationship among economy, energy, and trade for different countries in West Africa, we illustrate the results for selected countries, as shown in Table 5. Controlling for energy consumption, there is strong evidence that international trade promotes economic growth in Cape Verde (CPV), Guinea-Bissau (GNB), Niger (NER) and Sierra Leone (SLE), Ghana (GHA), Mauritania (MRT), Benin (BEN), and Mali (MLI). This finding is in line with the results of panel analysis. A common characteristic of these countries is that they are major exporters of agricultural and mineral products and importers of industrial products. Ghana and Mali are famous for rich gold production. Countries such as Ghana and Benin are major exporters of agricultural raw materials. On the other hand, there is no causal relationship between trade openness and economic growth in Nigeria, Cote d’Ivoire, and Senegal, which suggests that the neutrality hypothesis holds in these countries. The export volume of these countries, especially the service exports, is significantly higher than that of other countries in West Africa. Among the countries with lower levels of economic growth, trade opening in Gambia (GMB), Burkina Faso (BFA), Niger (NER), and Sierra Leone (SLE) has significantly promote energy consumption, which is consistent with the results of high economic growth countries.

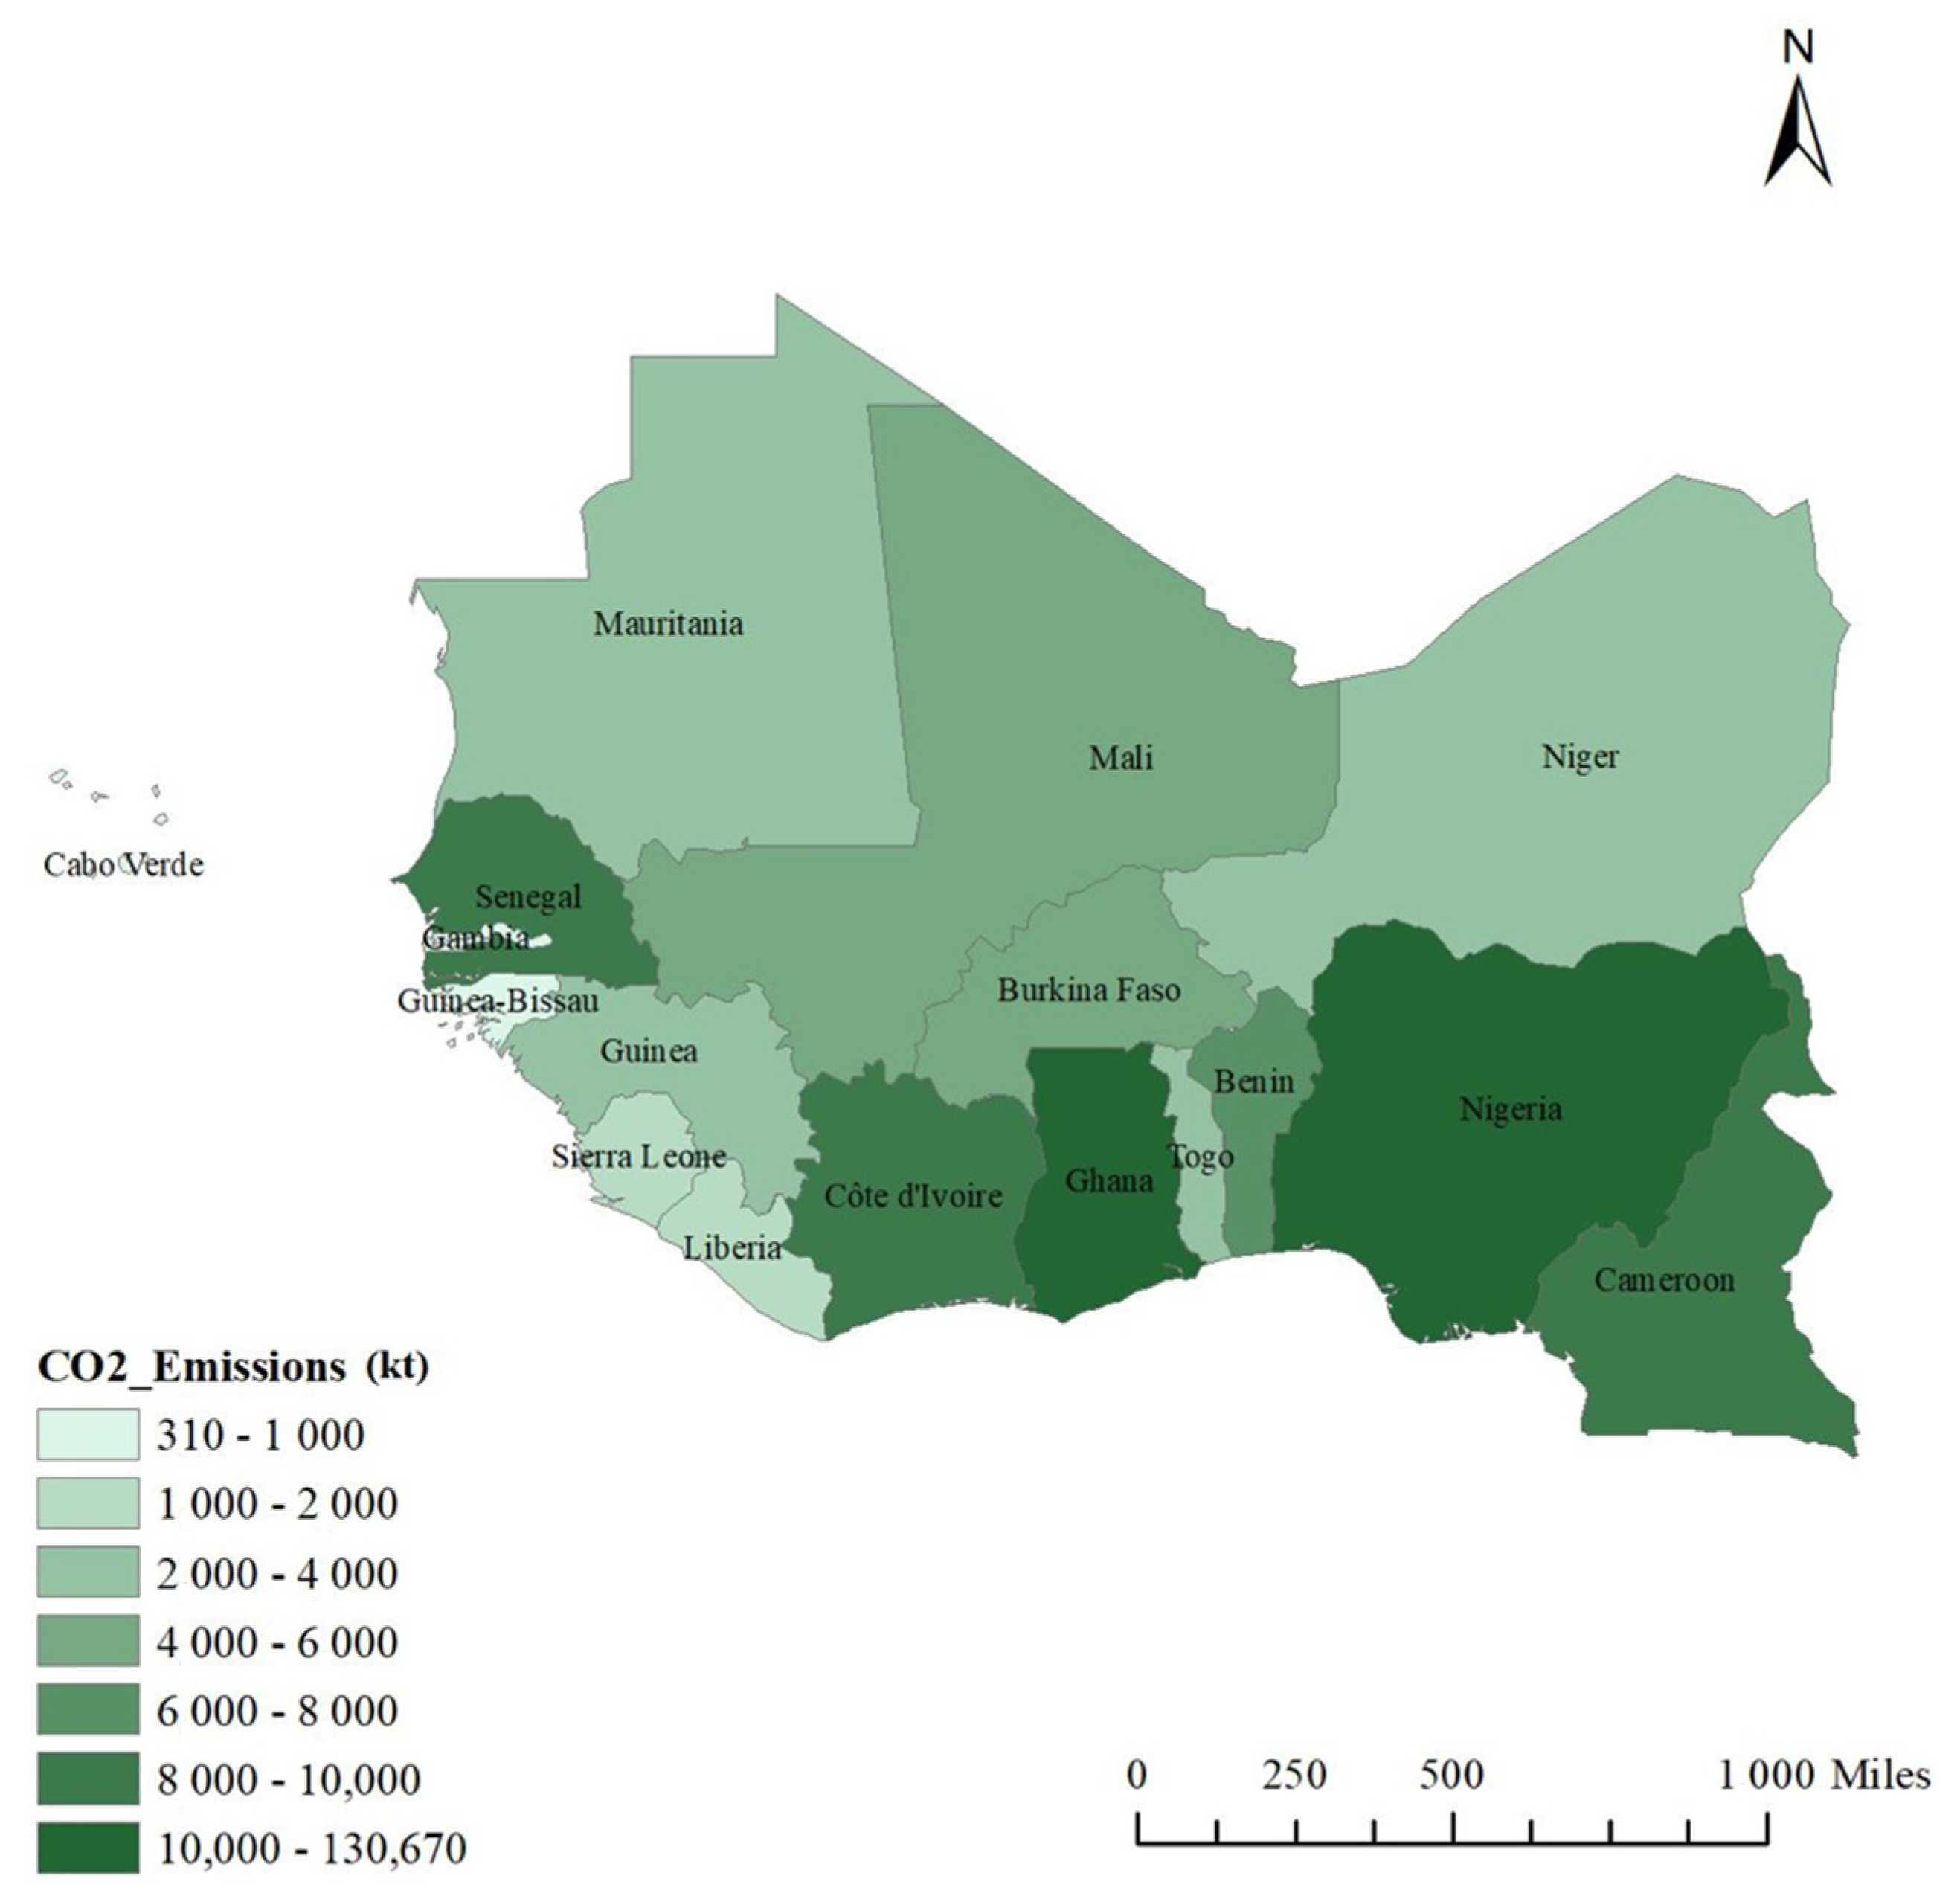
4.5. Panel Causal Analysis of CO2 Emissions

The consumption of fossil fuels increases carbon emissions while promoting economic growth, as shown in Table 6. At the same time, economic growth will inevitably increase energy use, which correspondingly promotes investment in cleaner production. Economic growth in West Africa is highly energy-intensive, with associated pollution problems. The investigation on the economic growth-carbon emissions-trade nexus provides a basis framework to understanding the sustainable development path. Adewuyi et al. (2017) has found a significant correlation between carbon dioxide emissions and energy consumption in West Africa [61]. Under the economic growth-carbon emissions-international trade tri-variable framework, total carbon emissions in West Africa have shown a bilateral causal relationship with economic growth and international trade. It indicates that economic growth leads to increased emissions, and the increase in carbon emissions promotes economic growth and foreign trade. In other words, with the rapid growth of the economy and trade, the increasing consumption of carbon-based energy in West Africa is inevitably accompanied by carbon emissions. Economic growth and foreign trade are the main drivers of the rise in carbon emissions. At the same time, the growth of the economy and trade needs to be driven by the growth of fossil energy consumption. The findings are in line with investigations on India, Ghana, Nepal, and Estonia by Yang and Zhao, Appiah, Regmi and Rehman, Hundie [62,63,64,65]. Fossil fuels including oil and natural gas current accounts for more than 80% of total energy consumption in West Africa (Source: IEA. https://www.iea.org/regions/africa (accessed on 17 March 2022)).
Table 7 indicates there exists a bilateral causal relationship between carbon emissions and international trade in West Africa, which is consistent with the results in the higher economic development group. This finding is consistent with the results of all countries in Table 7, and indicates that the contribution of countries with high economic development to trade and emissions is quite high in West Africa. On the other hand, the relationship among carbon emissions, economic growth and international trade showed an obvious lag effect for countries with low economic development, as shown in Table 7 When k = 1, there exists a unilateral relationship between carbon emissions and economic growth and between carbon emissions and trade, which is in line with the results in Section 4.4. The difference between the results in Table 7 and Table 4 is that there is only a one-way impact of economic growth on carbon emissions. It implies that economic growth promotes clean energy consumption and the wide usage of renewable energy in West Africa. When k = 2, economic growth, trade openness and carbon emissions showed the close interconnections among them in the long run.

5. Conclusions

The West African region has experienced high economic development. How to achieve sustainable growth is of great concern to many scholars. This paper uses the tri-variable Toda-Yamamoto model to investigate the dynamic interactions among energy consumption, economic growth, and trade. In contrast to the traditional Granger causality test, the Toda-Yamamoto tri-variable model allows for the existence of unit roots and reduces the bias in testing from the nature of the sample size. The possibility of controlling for one of the variables under the triple framework facilitates rich and meaningful conclusions.
The findings indicate that, first, the positive impact of energy consumption on economic growth in West Africa has shown a significant lag effect, and energy consumption is a strong trade-dependent characteristic of economic growth promotion. Trade opening and economic growth in West Africa are mutually reinforcing in the long run. Next, the role of foreign trade in boosting economic growth is more significant in countries with lower levels of economic development. At the same time, trade openness reinforces the dependence of West African economic growth on energy consumption. Finally, when replacing the energy consumption indicator with CO2 emissions, the results remain robust. Considering the regional development differences, grouping countries by GDP per capita reveals that there exists a bilateral causal relationship between energy consumption and trade openness in the higher economic development group. On the other hand, the impact of trade openness on economic growth is more remarkable in countries with lower levels of economic development in West Africa. These findings are meaningful and beneficial for policymakers.
In the context of Africa’s expanding trade openness and increasing energy consumption constraints, it is necessary for West African countries to develop an integrated energy and trade policy in order to maintain long-term sustainable economic growth. First, it is necessary to adjust the structure of export trade and actively promote the upgrading of processing trade in order to promote regional integration and trade facilitation. West Africa’s economic growth is highly dependent on trade, especially in countries with lower levels of economic development. It is also necessary to promote the ECOWAS regional agenda, deepen trade cooperation, and increase engagement with the private sector in trade facilitation reforms. Second, it is helpful for West African countries to improve energy consumption and restructure the energy mix. Since approximately 80% or more of the energy mix in West Africa is fossil energy, carbon emissions in West Africa are an essential problem. Last, in the context of global carbon emissions reduction, it is also necessary to actively develop non-fossil energy and set appropriate emissions reduction targets. The findings and suggestions are useful for policymakers in actively participating in the international division of labor and promoting the processing trade in West Africa. Furthermore, improving energy efficiency is conducive to reducing the excessive dependence of economic growth on energy. It is beneficial to change the current single economic development model, optimize energy consumption, and coordinate regional development. A balanced strategy between economic development and reduced emissions is then beneficial for West African countries.
Finally, it should be noted that, due to the data availability, some countries in West Africa, such as Guinea and Liberia, were not included in this research. A more comprehensive dataset, especially seasonal and monthly datasets, will capture more variations, which makes the results more persuasive. In addition, in the context of the global low carbon strategy, West Africa is also witnessing transition in energy consumption structure, and non-fossil energy is playing a more crucial role [41,56]. Further investigation on the impact of renewable energy and intra-regional trade will shed light on the potential impact of trade and provide meaningful findings for policymakers in West Africa.

Author Contributions

Conceptualization, M.Q., J.X. and N.B.A.; methodology, M.Q. and J.X.; software, J.X.; validation, M.Q. and N.B.A.; formal analysis, M.Q., J.X. and N.B.A.; investigation, M.Q. and J.X.; resources, M.Q. and N.B.A.; data curation, N.B.A.; writing—original draft preparation, J.X., N.B.A. and S.W.; writing—review and editing, S.W. and F.X.; visualization, J.X. and H.Z.; supervision, M.Q.; project administration, M.Q.; funding acquisition, M.Q. All authors have read and agreed to the published version of the manuscript.

Funding

This research is supported by the National Social Science Fund of China (20BJY233).

Institutional Review Board Statement

Not applicable.

Informed Consent Statement

Not applicable.

Data Availability Statement

The data is collected from the World Bank data base and IEA reports.

Conflicts of Interest

The authors declare no conflict of interest.

References

  1. WDI. World Development Indicators; World Bank Data Base: Washington, DC, USA, 2020. [Google Scholar]
  2. BP. BP Statistical Review of World Energy; BP: London, UK, 2021. [Google Scholar]
  3. International Energy Agency. Africa Energy Outlook 2019 World Energy Outlook Special Report; International Energy Agency: Paris, France, 2019.
  4. Adewuyi, A.O.; Adeniyi, O. Trade and consumption of energy varieties: Empirical analysis of selected West Africa. Renew. Sustain. Energy Rev. 2015, 47, 354–366. [Google Scholar] [CrossRef]
  5. Ali, M.; Yu, Q. Assessment of the impact of renewable energy policy on sustainable energy for all in West Africa. Renew. Energy 2021, 180, 544–551. [Google Scholar]
  6. Ouedraogo, N.S. Energy consumption and economic growth: Evidence from the economic community of West African States (Ecowas). Energy Econ. 2013, 36, 637–647. [Google Scholar] [CrossRef]
  7. Asafu-Adjaye, J. The Relationship between Energy Consumption, Energy Prices and Economic Growth: Time Series Evidence from Asian Developing Countries. Energy Econ. 2000, 22, 615–625. [Google Scholar] [CrossRef] [Green Version]
  8. Jumbe, C. Cointegration and causality between electricity consumption and GDP: Empirical evidence from Malawi. Energy Econ. 2004. [CrossRef]
  9. Belke, A.; Dreger, C.; Haan, F.D. Energy Consumption and Economic Growth: New Insights into the Cointegration Relationship; Discussion Papers of DIW Berlin; RWI Essen: Essen, Germany, 2010. [Google Scholar]
  10. Eggoh, J.C.; Bangake, C.; Rault, C. Energy consumption and economic growth revisited in African countries. CESifo Work. Pap. Ser. 2011, 39, 7408–7421. [Google Scholar]
  11. Wandji, Y. Energy consumption and economic growth: Evidence from Cameroon. Energy Policy 2013, 61, 1295–1304. [Google Scholar] [CrossRef]
  12. Onakoya, A.B.; Onakoya, A.O.; Jimi-Salami, O.A.; Odedairo, B.O. Energy consumption and Nigeria economic growth: An empirical analysis. Eur. Sci. J. 2013, 9, 25–40. [Google Scholar]
  13. Azam, M.; Khan, A.Q.; Bakhtyar, B.; Emirullah, C. The causal relationship between energy consumption and economic growth in the ASEAN-5 countries. Renew. Sustain. Energy Rev. 2015, 47, 732–745. [Google Scholar] [CrossRef]
  14. Ozturk, I.; Asian, R.; Kalyoncu, R. Energy consumption and economic growth relationship: Evidence from panel data for low- and middle-income countries. Energy Policy 2010, 38, 4422–4428. [Google Scholar] [CrossRef]
  15. Odhiambo, N.M. Energy consumption, prices and economic growth in three SSA countries: A comparative study—ScienceDirect. Energy Policy 2010, 38, 2463–2469. [Google Scholar] [CrossRef]
  16. Kahsai, M.S.; Nondo, C.; Schaeffer, P.V.; Gebremedhin, T. Income level and the energy consumption–GDP nexus: Evidence from Sub-Saharan Africa. Energy Econ. 2012, 34, 739–746. [Google Scholar] [CrossRef]
  17. Koengkan, M. The positive impact of trade openness on consumption of energy: Fresh evidence from Andean community countries. Energy 2018, 158, 936–943. [Google Scholar] [CrossRef]
  18. Sadorsky, P. Energy consumption, output and trade in South America. Energy Econ. 2012, 34, 476–488. [Google Scholar] [CrossRef]
  19. Bashir, F.; Chaudhry, I.S.; Bakar, A. A Panel Data Analysis of Energy Consumption and Trade Openness in Developing Countries. Pak. J. Soc. Sci. 2016, 36, 373–386. [Google Scholar]
  20. Adeniyi, O.; Adewuyi, A.O. Energy consumption and sectoral trade in selected West African economies. Int. J. Glob. Energy Issues 2019, 42, 81. [Google Scholar] [CrossRef]
  21. Najarzadeh, R.; Reed, M.; Khoshkhoo, A.; Gallavani, A. Trade and energy consumption in the OPEC countries. J. Econ. Coop. Dev. 2015, 36, 89–102. [Google Scholar]
  22. Dogan, E. The Relationship between Economic Growth, Energy Consumption and Trade. Bull. Energy Econ. 2015, 4, 70–80. [Google Scholar]
  23. Parsa, H.; Sajjadi, S.Z. Exploring the Trade Openness, Energy Consumption and Economic Growth Relationship in Iran by Bayer and Hanck Combined Cointegration and Causality Analysis. Iran. Econ. Rev. 2017, 21, 829–845. [Google Scholar]
  24. Bhattacharya, M.; Bhattacharya, S.N. International Trade and Economic Growth: Evidences From The BRICS. J. Appl. Econ. Bus. Res. 2016, 6, 150–160. [Google Scholar]
  25. Tahir, M.; Azid, T. The relationship between international trade openness and economic growth in the developing economies: Some new dimensions. J. Chin. Econ. Foreign Trade Stud. 2008, 8, 123–139. [Google Scholar] [CrossRef]
  26. Gries, T.; Redlin, M. Trade Openness and Economic Growth: A Panel Causality Analysis. Work. Pap. CIE 2012, 1, 1–19. [Google Scholar]
  27. Ray, S. A Causality Analysis on the Empirical Nexus between Export and Economic Growth: Evidence from India. Int. Aff. Glob. Strategy 2011, 1, 24–38. [Google Scholar]
  28. Kong, Q.; Peng, D.; Ni, Y.; Jiang, X.; Wang, Z. Trade openness and economic growth quality of China: Empirical analysis using ARDL model. Financ. Res. Lett. 2021, 38, 101488. [Google Scholar] [CrossRef]
  29. Hye QM, A.; Wizarat, H.; Lau, W.Y. The Impact of Trade Openness on Economic Growth in China: An Empirical Analysis. J. Asian Financ. Econ. Bus. 2016, 3, 27–37. [Google Scholar]
  30. Abdullahi, A.O.; Safiyanu, S.S.; Soja, T. International Trade and Economic Growth: An Empirical Analysis of West Africa. J. Econ. Financ. 2016, 7, 12–15. [Google Scholar]
  31. Azeez, B.A.; Dada, S.O.; Aluko, O.A. Effect of international trade on Nigeria economic growth: The 21st Century experience. Int. J. Econ. 2014, 2, 1–8. [Google Scholar]
  32. Omoke, P.C.; Opuala–Charles, S. Trade openness and economic growth nexus: Exploring the role of institutional quality in Nigeria. Cogent Econ. Financ. 2020, 9, 1868686. [Google Scholar] [CrossRef]
  33. Zahonogo, P. Trade and economic growth in developing countries: Evidence from sub-Saharan Africa. J. Afr. Trade 2017, 3, 41–56. [Google Scholar] [CrossRef]
  34. Andriansyah, A.; Messinis, G. Stock Prices, Exchange Rates and Portfolio Equity Flows: A Toda-Yamamoto Panel Causality Test. J. Econ. Stud. 2019, 46, 399–421. [Google Scholar] [CrossRef]
  35. Dumitrescu, E.I.; Hurlin, C.; Pham, V. Backtesting Value-at-Risk: From Dynamic Quantile to Dynamic Binary Tests. Finance 2012, 33, 79–112. [Google Scholar] [CrossRef] [Green Version]
  36. Menyah, K.; Nazlioglu, S.; Wolde-Rufael, Y. Financial development, trade openness and economic growth in African countries: New insights from a panel causality approach. Econ. Model. 2014, 37, 386–394. [Google Scholar] [CrossRef]
  37. Nguena, C.L. The Role of Foreign Trade in Economic Growth and Individual Heterogeneity Problem in Panel Data: The Case of African Countries; Mpra Paper; University Library of Munich: Munich, Germany, 2012. [Google Scholar]
  38. Adam, A.M.; Chaudhry, I.S. The currency union effect on intra-regional trade in Economic Community of West African States (ECOWAS). J. Int. Trade Law Policy 2014, 13, 102–122. [Google Scholar] [CrossRef]
  39. Ezekwesili, C.E. Can the Monetary Integration of ECOWAS Improve Intra-Regional Trade? CMC Senior Theses, CMC Sr. Claremont McKenna College, Claremont, CA, USA, 2011; p. 279. [Google Scholar]
  40. Kamuganga, D.N. Does Intra-Africa Regional Trade Cooperation Enhance Africa’s Export Survival? Graduate Institute of International and Development Studies Working Paper: Geneva, Switzerland, 2012; p. 533. [Google Scholar]
  41. Aïssa, M.S.B.; Jebli, M.B.; Youssef, S.B. Output, renewable energyconsumption and trade in Africa. Energy Policy 2014, 66, 11–18. [Google Scholar] [CrossRef] [Green Version]
  42. Akinlo, A.E. Energy consumption and economic growth: Evidence from 11 Sub-Sahara African countries. Energy Econ. 2009, 30, 2391–2400. [Google Scholar] [CrossRef]
  43. Okafor, H.O. Testing the Relationship between Energy Consumption and Economic Growth: Evidence from Nigeria and South Africa. J. Econ. Sustain. Dev. 2012, 3, 111–124. [Google Scholar]
  44. Kwakwa, P.A.; Aboagye, S. Energy consumption in Ghana and the story of economic growth, industrialization, trade openness and urbanization. Asian Bull. Energy Econ. Technol. 2017, 1, 182–191. [Google Scholar]
  45. Op, A.; Eoa, B.; Wb, C. Factors characterising energy security in West Africa: An integrative review of the literature. Renew. Sustain. Energy Rev. 2021, 148, 111259. [Google Scholar]
  46. Miller, S.M.; Upadhyay, M.P. The effects of openness, trade orientation, and human capital on total factor productivity. J. Dev. Econ. 2000, 63, 399–423. [Google Scholar] [CrossRef]
  47. Lash, N.A. Primary product exports and growth: The case of Thailand. J. Dev. Stud. 1970, 4, 525–532. [Google Scholar]
  48. Madani, D.H. Regional Integration and Industrial Growth among Developing Countries—The Case of Three ASEAN Members; Policy Research Working Paper Series; World Bank Publications: Washington DC, USA, 2001. [Google Scholar]
  49. Ang, J.B. CO2, Emissions, Energy Consumption, and Output in France. Energy Policy 2007, 35, 4772–4778. [Google Scholar] [CrossRef]
  50. Halicioglu, F. An Econometric Study of CO2, Emissions, Energy Consumption, Income and Foreign Trade in Turkey. Energy Policy 2009, 37, 1156–1164. [Google Scholar] [CrossRef] [Green Version]
  51. Hossain, M.S. Panel estimation for CO2 emissions, energy consumption, economic growth, trade openness and urbanization of newly industrialized countries. Energy Policy 2011, 39, 6991–6999. [Google Scholar] [CrossRef]
  52. Farhani, S.; Ozturk, I. Causal relationship between CO2 emissions, real GDP, energy consumption, financial development, trade openness, and urbanization in Tunisia. Environ. Sci. Pollut. Res. 2015, 22, 15663–15676. [Google Scholar] [CrossRef] [PubMed]
  53. Kasman, A.; Duman, S.Y. CO2 emissions, economic growth, energy consumption, trade and urbanization in new EU member andcandidate countries: A panel data analysis. Econ. Model. 2015, 44, 97–103. [Google Scholar] [CrossRef]
  54. Ansari, M.A.; Khan, N.A.; Ganaie, A.A. Does foreign direct investment impede environmental quality in Asian countries? A panel data analysis. OPEC Energy Rev. 2019, 43, 109–135. [Google Scholar] [CrossRef]
  55. Odhiambo, N.M. Trade Openness and Energy Consumption in Sub-Saharan African Countries: A Multivariate Panel Granger Causality Test. Energy Rep. 2021, 7, 7082–7089. [Google Scholar] [CrossRef]
  56. Ben Jebli, M.; Ben Youssef, S.; Ozturk, I. The Role of Renewable Energy Consumption and Trade: Environmental Kuznets Curve Analysis for Sub-Saharan Africa Countries. Afr. Dev. Rev. 2015, 27, 288–300. [Google Scholar] [CrossRef] [Green Version]
  57. John, N.I.; Amabuike, I.L.; Ajaba, J.A.; Sodipo, J.A.; Enegesi, L.B. Financial system, trade concentration and economic growth in West African Monetary Zone (WAMZ). Int. J. Res. Bus. Soc. Sci. 2020, 9, 426–436. [Google Scholar]
  58. Li, X.; Lin, B. Global convergence in per capita CO2 emissions. Renew. Sustain. Energy Rev. 2013, 24, 357–363. [Google Scholar] [CrossRef]
  59. Oo, S.S. How Does Aid For Trade Contribute To ASEAN’s Trading? Hiroshima University, Graduate School for International Development and Cooperation (IDEC): Hiroshima, Japan, 2015; Volume 5, pp. 1–32. [Google Scholar]
  60. Nnaji, C.E.; Chukwu, J.O.; Nnaji, M. Does Domestic Energy Consumption Contribute to Exports? Empirical Evidence from Nigeria. Int. J. Energy Econ. Policy 2013, 3, 297–306. [Google Scholar]
  61. Adewuyi, A.O.; Awodumi, O.B. Biomass energy consumption, economic growth and carbon emissions: Fresh evidence from West Africa using a simultaneous equation model. Energy 2017, 119, 453–471. [Google Scholar] [CrossRef]
  62. Yang, Z.; Zhao, Y. Energy consumption, carbon emissions, and economic growth in India: Evidence from directed acyclic graphs. Econ. Model. 2014, 38, 533–540. [Google Scholar] [CrossRef]
  63. Appiah, M.O. Investigating the multivariate Granger causality between energy consumption, economic growth and CO2 emissions in Ghana. Energy Policy 2018, 112, 198–208. [Google Scholar] [CrossRef]
  64. Regmi, K.; Rehman, A. Do carbon emissions impact Nepal’s population growth, energy utilization, and economic progress? Evidence from long- and short-run analyses. Environ. Sci. Pollut. Res. Int. 2021, 28, 55465–55475. [Google Scholar] [CrossRef] [PubMed]
  65. Hundie, S.K. Income inequality, economic growth and carbon dioxide emissions nexus: Empirical evidence from Ethiopia. Environ. Sci. Pollut. Res. Int. 2021, 28, 43579–43598. [Google Scholar] [CrossRef] [PubMed]
Figure 1. Sectoral composition of GDP.
Sustainability 14 03630 g001
Figure 2. GDP per capita in West Africa.
Sustainability 14 03630 g002
Figure 3. Energy consumption in West Africa.
Sustainability 14 03630 g003
Figure 4. CO2 emissions in West Africa.
Sustainability 14 03630 g004
Table 1. Unit root test.
LLCADFPP
Level
ln ( EC ) −2.4601 ***45.7222 **45.3835 **
(0.0069)(0.0330)(0.0355)
ln ( GDP ) −0.117623.3152 25.4368
(0.4532)(0.8021)(0.7035)
ln ( TO ) −1.5449149.0478 48.7281
(0.0612)(0.0155)(0.0167)
First Difference
Δ Ln ( EC ) −23.0042 ***379.010 ***545.396 ***
(0.000)(0.000)(0.000)
Δ Ln ( GDP ) −16.1620 ***281.362 ***305.271 ***
(0.000)(0.000)(0.000)
Δ Ln ( TO ) −18.1125 ***338.058 ***774.822 ***
(0.000)(0.000)(0.000)
Note: Z-statistic is in parentheses, ** p < 0.05, *** p < 0.01.
Table 2. The Johansen co-integration tests in heterogeneous panels.
Common AR CoefficientIndividual AR Coefficien
Within-DimensionBetween-Dimension
StatisticProb.StatisticProb.
Panel ADF−1.590508 *0.0559−1.950543 **0.0256
Panel PP−1.877852 **0.0302−1.290546 *0.0984
Notes: Null hypothesis is no co-integration, user-specified lag length is 1. The Z-statistic is in parentheses, * p < 0.10, ** p < 0.05.
Table 3. Tri-variate Toda–Yamamoto results for Granger causality test in heterogeneous panels.
Asymptotic Wald StatisticsBootstrap Critical Values
1%5%10%
Panel A: K = 1, m = 1
G D P i , t Trade   Openness i , t
Z N , T H n c 1.31960.77030.33590.1602
Z   ˜ N H n c 1.06600.55100.1438−0.0210
G D P i , t Energy   Consumption i , t
Z N , T H n c 3.8878 ***1.63191.08300.8001
  Z   ˜ N H n c 3.4737 ***1.35870.84420.5789
Energy   Consumption i , t G D P i , t
Z N , T H n c −0.7304−1.2750−1.2122−1.1724
  Z   ˜ N H n c −0.8559−1.3665−1.3076−1.2703
Energy   Consumption i , t Trade   Openness i , t
Z N , T H n c 1.5814−0.8962−1.1260−1.2143
  Z   ˜ N H n c 1.3114−1.0113−1.2268−1.3096
Trade   Openness i , t G D P i , t
Z N , T H n c 1.61660.88850.42880.1831
  Z   ˜ N H n c 1.34440.66180.23080.0005
Trade   Openness i , t Energy   Consumption i , t
Z N , T H n c 3.9896 ***2.39291.61661.2760
  Z   ˜ N H n c 3.5691 ***2.07221.34441.0251
Panel B: K = 2, m = 1
G D P i , t Trade   Openness i , t
Z N , T H n c 4.4974 ***3.90303.34683.0559
  Z   ˜ N H n c 1.7910 *1.51971.26581.1330
G D P i , t Energy   Consumption i , t
Z N , T H n c 8.2333 ***7.26415.70085.0756
  Z   ˜ N H n c 3.4964 ***3.05402.34042.0550
Energy   Consumption i , t G D P i , t
Z N , T H n c 4.5720 ***1.42041.16231.0145
  Z   ˜ N H n c 1.8251 *0.38650.26860.2012
Energy   Consumption i , t Trade   Openness i , t
Z N , T H n c 2.2596 **0.2410−0.1955−0.4423
  Z   ˜ N H n c 0.7695−0.1519−0.3512−0.4638
Trade   Openness i , t G D P i , t
Z N , T H n c 7.6154 ***0.92280.55670.3939
  Z   ˜ N H n c 3.2143 ***0.1593−0.0078−0.0821
Trade   Openness i , t Energy   Consumption i , t
Z N , T H n c 8.1886 ***2.22460.93450.4031
  Z   ˜ N H n c 3.4760 ***0.75360.1647−0.0779
Notes: Null hypothesis is no co-integration, user-specified lag length is 1. The Z-statistic is in parentheses, * p < 0.10, ** p < 0.05, *** p < 0.01.
Table 4. (a) Toda–Yamamoto Granger causality for the group of high economic growth countries; (b) Toda–Yamamoto Granger causality for the group of low economic growth countries.
(a)
Asymptotic Wald StatisticsBootstrap Critical Values
1%5%10%
Panel A: K = 1, m = 1
G D P i , t Trade   Openness i , t
Z N , T H n c 1.15850.93470.44590.2224
Z ˜ N H n c 0.96110.75130.29310.0835
G D P i , t Energy   Consumption i , t
Z N , T H n c 2.8875 **1.40760.58250.2414
Z ˜ N H n c 2.5821 **1.19460.42110.1013
Energy   Consumption i , t G D P i , t
Z N , T H n c −0.7629−1.4832−1.4327−1.4042
Z ˜ N H n c −0.8402−1.5155−1.4682−1.4414
Energy   Consumption i , t Trade   Openness i , t
Z N , T H n c 2.3478 **−0.3595−0.5549−0.6548
Z ˜ N H n c 2.0761 **−0.4620−0.6453−0.7389
Trade   Openness i , t G D P i , t
Z N , T H n c 0.5998−0.4369−0.5353−0.5842
Z ˜ N H n c 0.4373−0.5346−0.6268−0.6726
Trade   Openness i , t Energy   Consumption i , t
Z N , T H n c 2.4320 **3.61242.58662.0865
Z ˜ N H n c 2.1550 **3.26172.29991.8311
Panel B: K = 2, m = 1
G D P i , t Trade   Openness i , t
Z N , T H n c 2.9953 ***7.12206.40806.0654
Z ˜ N H n c 1.1760 ***3.05982.73382.5774
G D P i , t Energy   Consumption i , t
Z N , T H n c 6.0337 ***11.31169.24868.4460
Z ˜ N H n c 2.5630 **4.97224.03053.6641
Energy   Consumption i , t G D P i , t
Z N , T H n c 4.5675 ***1.67541.40451.2706
Z ˜ N H n c 1.8937 *0.57350.44980.3887
Energy   Consumption i , t Trade   Openness i , t
Z N , T H n c 5.0730 ***2.36821.73701.4723
Z ˜ N H n c 2.1244 **0.88970.60160.4808
Trade   Openness i , t G D P i , t
Z N , T H n c −0.0496−1.1080−0.8875−0.7452
Z ˜ N H n c −0.2139−0.6970−0.5964−0.5314
Trade   Openness i , t Energy   Consumption i , t
Z N , T H n c 8.3847 ***4.81953.05172.2863
Z ˜ N H n c 3.6361 ***2.00871.20170.8524
(b)
Asymptotic Wald StatisticsBootstrap Critical Values
1%5%10%
Panel A: K = 1, m = 1
G D P i , t Trade   Openness i , t
Z N , T H n c 0.69210.82650.51870.3578
Z ˜ N H n c 0.53190.65800.36940.2185
G D P i , t Energy   Consumption i , t
Z N , T H n c 2.6147 ***1.89351.55091.3483
Z ˜ N H n c 2.3343 **1.65821.33711.1471
Energy   Consumption i , t G D P i , t
Z N , T H n c −0.2662−0.4975−0.4088−0.3567
Z ˜ N H n c −0.3664−0.5833−0.5002−0.4514
Energy   Consumption i , t Trade   Openness i , t
Z N , T H n c −0.2043−1.5210−1.4532−1.4067
Z ˜ N H n c −0.3084−1.5428−1.4793−1.4357
Trade   Openness i , t G D P i , t
Z N , T H n c 8.4977 ***1.02410.82850.7413
Z ˜ N H n c 7.8497 ***0.84310.65980.5780
Trade   Openness i , t Energy   Consumption i , t
Z N , T H n c 3.2302 **0.31450.10650.0013
Z ˜ N H n c 2.9114 **0.1780−0.0171−0.1157
Panel B: K = 2, m = 1
G D P i , t Trade   Openness i , t
Z N , T H n c 3.4296 ***−1.2128−1.5165−1.6741
Z ˜ N H n c 1.3866−0.7326−0.8711−0.9431
G D P i , t Energy   Consumption i , t
Z N , T H n c 5.7121 ***−0.8587−1.1591−1.2932
Z ˜ N H n c 2.4285−0.5709−0.7080−0.7692
Energy   Consumption i , t G D P i , t
Z N , T H n c 1.7946 *1.13570.80950.6290
Z ˜ N H n c 0.64030.33950.19060.1082
Energy   Consumption i , t Trade   Openness i , t
Z N , T H n c −2.0561 **−3.4734−3.1729−3.0068
Z ˜ N H n c −1.1175−1.7645−1.6273−1.5515
Trade   Openness i , t G D P i , t
Z N , T H n c 11.1843 ***0.84410.55470.4430
Z ˜ N H n c 4.9265 ***0.20640.07430.0233
Trade   Openness i , t Energy   Consumption i , t
Z N , T H n c 3.1115 ***−0.9496−1.2971−1.4620
Z ˜ N H n c 1.2414−0.6124−0.7710−0.8463
Notes: Null hypothesis is no co-integration, user-specified lag length is 1. The Z-statistic is in parentheses, * p < 0.10, ** p < 0.05, *** p < 0.01.
Table 5. Tri-variate Toda–Yamamoto Granger causality for selected countries (EC, energy consumption; TO, trade openness).
G D P i , t EC i , t G D P i , t TO i , t EC i , t G D P i , t EC i , t TO i , t TO i , t G D P i , t TO i , t EC i , t
Panel A: K = 1, m = 1
high economic development
CPV5.0081.37614.778 ***0.0176.372 **0.463
CIV0.1535.661 **0.9860.1371.8491.524
GHA1.4100.1600.2260.2311.7331.051
NGA0.6760.0010.2660.2480.0712.412
MRT8.724 **4.2282.6553.2751.6483.853
CMR0.7430.0020.0941.7420.6100.427
SEN2.845 *2.6800.7610.1900.0990.381
BEN1.6121.7840.2750.2750.6030.149
low economic development
TGO1.7032.4261.2921.3040.1270.905
MLI6.334 **2.2210.7691.1142.56610.463 ***
BFA0.0110.2960.0040.5970.0371.929
GNB0.0760.6680.9550.0408.792 ***0.121
GMB1.1930.6960.6490.0710.3962.460
NER0.26310.446 ***1.5970.1193.077 *7.431 ***
SLE0.0100.0290.9682.760 *4.092 **15.486 ***
Panel B: K = 2, m = 1
high economic development
CPV4.737 *6.184 **7.909 **0.4184.2470.116
CIV3.1974.5632.2050.4982.1161.395
GHA3.4213.19916.292 ***13.680 ***19.126 ***3.610
NGA4.1190.9131.5850.6272.2971.419
MRT0.1887.886 ***0.0050.4716.391 ***3.991 **
CMR4.4960.8150.8401.5952.0571.028
SEN2.6863.0071.2861.4311.0140.195
BEN1.6208.099 **0.1268.413 **0.476 **3.764
low economic development
TGO3.5864.2722.7730.9620.4861.282
MLI0.1966.286 **0.1052.2578.383 **4.333
BFA1.4070.5155.9990.9370.9376.487 **
GNB0.3560.1211.7563.1098.957 **0.773
GMB3.6146.682 **0.2500.9241.0086.573 **
NER0.54313.118 ***0.9203.5805.329 *5.952 *
SLE4.843 *0.1760.1805.962 *4.754 *18.671 ***
Notes: Null hypothesis is no co-integration, user-specified lag length is 1. The Z-statistic is in parentheses, * p < 0.10, ** p < 0.05, *** p < 0.01.
Table 6. Toda–Yamamoto Granger causality among GDP, trade openness and CO2 emissions.
Asymptotic Wald StatisticsBootstrap Critical Values
1%5%10%
Panel A: K = 1, m = 1
G D P i , t Trade   Openness i , t
Z N , T H n c 0.7143−0.5501−0.6976−0.7806
Z ˜ N H n c 0.4985−0.6869−0.8251−0.9030
G D P i , t CO 2   Emissions i , t
Z N , T H n c 3.0695 ***0.32880.0415−0.1077
Z ˜ N H n c 2.7065 ***0.1371−0.1323−0.2721
CO 2   Emissions i , t G D P i , t
Z N , T H n c 2.6108 ***0.77400.53270.4190
Z ˜ N H n c 2.2764 **0.55450.32820.2216
CO 2   Emissions i , t Trade   Openness i , t
Z N , T H n c 2.2540 **0.75530.58860.4977
Z ˜ N H n c 1.9420 *0.53700.38060.2954
Trade   Openness i , t G D P i , t
Z N , T H n c −0.0143−0.5938−0.4407−0.3564
Z ˜ N H n c −0.1846−0.7279−0.5843−0.5053
Trade   Openness i , t CO 2   Emissions i , t
Z N , T H n c 4.9484 ***1.08570.89220.7820
Z ˜ N H n c 4.4679 ***0.84670.66530.5620
Panel B: K = 2, m = 1
G D P i , t Trade   Openness i , t
Z N , T H n c 2.4226 **8.31297.51657.0861
Z ˜ N H n c 0.84393.53273.16922.9727
G D P i , t CO 2   Emissions i , t
Z N , T H n c 6.7664 ***−2.1057−2.4429−2.6044
Z ˜ N H n c 2.8268 ***−1.2231−1.3771−1.4508
CO 2   Emissions i , t G D P i , t
Z N , T H n c 6.7533 ***4.21053.82783.6038
Z ˜ N H n c 2.8208 ***1.66011.48541.3832
CO 2   Emissions i , t Trade   Openness i , t
Z N , T H n c 7.7495 ***−0.2701−0.6708−0.8760
Z ˜ N H n c 3.2756 ***−0.3852−0.5681−0.6618
Trade   Openness i , t G D P i , t
Z N , T H n c 1.24990.0334−0.2766−0.4385
Z ˜ N H n c 0.3086−0.2467−0.3882−0.4621
Trade   Openness i , t CO 2   Emissions i , t
Z N , T H n c 6.5912 ***0.36820.0507−0.1444
Z ˜ N H n c 2.7468 ***−0.0938−0.2388−0.3278
Notes: Null hypothesis is no co-integration; user-specified lag length is 1. The Z-statistic is in parentheses, * p < 0.10, ** p < 0.05, *** p < 0.01.
Table 7. (a): Toda–Yamamoto Granger causality for the group of high economic growth countries. (b): Toda–Yamamoto Granger causality for the group of high economic growth countries.
(a)
Asymptotic Wald StatisticsBootstrap Critical Values
1%5%10%
Panel A: K = 1, m = 1
G D P i , t Trade   Openness i , t
Z N , T H n c −0.7030−1.1312−1.0673−1.0339
Z ˜ N H n c −0.7841−1.1855−1.1256−1.0943
G D P i , t CO 2   Emissions i , t
Z N , T H n c 2.7408 ***−0.0489−0.4099−0.5509
Z ˜ N H n c 2.4445 ***−0.1709−0.5093−0.6415
CO 2   Emissions i , t G D P i , t
Z N , T H n c 2.1664 **1.95331.64211.5114
Z ˜ N H n c 1.9060 *1.70621.41451.2920
CO 2   Emissions i , t Trade   Openness i , t
Z N , T H n c 2.6290 ***0.69180.49490.3972
Z ˜ N H n c 2.3397 **0.52360.33890.2474
Trade   Openness i , t G D P i , t
Z N , T H n c 0.2468−0.3949−0.5055−0.5665
Z ˜ N H n c 0.1064−0.4952−0.5989−0.6561
Trade   Openness i , t CO 2   Emissions i , t
Z N , T H n c 2.1266 **−0.1604−0.2823−0.3427
Z ˜ N H n c 1.8686 **−0.2754−0.3896−0.4463
Panel B: K = 2, m = 1
G D P i , t Trade   Openness i , t
Z N , T H n c 2.0599 **10.32259.26238.7702
Z ˜ N H n c 0.74904.52074.03683.8121
G D P i , t CO 2   Emissions i , t
Z N , T H n c 1.35595.04994.60194.3504
Z ˜ N H n c 0.42772.11391.90941.7946
CO 2   Emissions i , t G D P i , t
Z N , T H n c 1.9665 **−0.4362−0.7590−0.9205
Z ˜ N H n c 0.7064 **−0.3904−0.5378−0.6115
CO 2   Emissions i , t Trade   Openness i , t
Z N , T H n c 12.5591 ***0.1932−0.3067−0.5253
Z ˜ N H n c 5.5417 ***−0.1031−0.3313−0.4310
Trade   Openness i , t G D P i , t
Z N , T H n c 3.4143 ***1.42201.06950.8876
Z ˜ N H n c 1.36730.45780.29690.2139
Trade   Openness i , t CO 2   Emissions i , t
Z N , T H n c 2.6334 ***−0.9488−1.2735−1.4514
Z ˜ N H n c 1.0108−0.6244−0.7726−0.8538
(b)
Asymptotic Wald StatisticsBootstrap Critical Values
1%5%10%
Panel A: K = 1, m = 1
G D P i , t Trade   Openness i , t
Z N , T H n c 1.7972 *0.0124−0.1654−0.2753
Z ˜ N H n c 1.5680−0.1053−0.2720−0.3751
G D P i , t CO 2   Emissions i , t
Z N , T H n c 1.56331.24960.92030.7510
Z ˜ N H n c 1.34861.05460.74590.5872
CO 2   Emissions i , t G D P i , t
Z N , T H n c 1.5057−0.5905−0.7342−0.8117
Z ˜ N H n c 1.2947−0.6705−0.8052−0.8779
CO 2   Emissions i , t Trade   Openness i , t
Z N , T H n c 0.48900.79070.61270.5254
Z ˜ N H n c 0.34150.62440.45750.3756
Trade   Openness i , t G D P i , t
Z N , T H n c −0.28480.06630.23670.3415
Z ˜ N H n c −0.3840−0.05470.10490.2033
Trade   Openness i , t CO 2   Emissions i , t
Z N , T H n c 4.9703 ***2.01311.75901.6400
Z ˜ N H n c 4.5427 ***1.77041.53211.4206
Panel B: K = 2, m = 1
G D P i , t Trade   Openness i , t
Z N , T H n c 1.34421.86361.58911.4137
Z ˜ N H n c 0.43470.67180.54650.4664
G D P i , t CO 2   Emissions i , t
Z N , T H n c 8.4362 ***1.65351.20980.9984
Z ˜ N H n c 3.6720 ***0.57580.37330.2768
CO 2   Emissions i , t G D P i , t
Z N , T H n c 7.8027 ***−1.9786−2.3103−2.5024
Z ˜ N H n c 3.3828 ***−1.0821−1.2335−1.3212
CO 2   Emissions i , t Trade   Openness i , t
Z N , T H n c −2.0822 **−1.9053−1.6619−1.5101
Z ˜ N H n c −1.1294−1.0487−0.9376−0.8683
Trade   Openness i , t G D P i , t
Z N , T H n c −1.8204 **−2.3362−2.1696−2.0643
Z ˜ N H n c −1.0099−1.2453−1.1693−1.1212
Trade   Openness i , t CO 2   Emissions i , t
Z N , T H n c 6.8334 ***2.19361.82911.6704
Z ˜ N H n c 2.9404 ***0.82240.65600.5836
Notes: Null hypothesis is no co-integration; user-specified lag length is 1. The Z-statistic is in parentheses, * p < 0.10, ** p < 0.05, *** p < 0.01.
Publisher’s Note: MDPI stays neutral with regard to jurisdictional claims in published maps and institutional affiliations.

