1. Introduction
The multimodal analysis method basically allows interactions between data by fusing various data such as text, voice, image, and sensor data. This multimodal analysis can analyze people’s various emotions and behaviors based on the collected data. Single data-based analysis shows low accuracy due to biased characteristics but multimodal analysis solves this problem by fusing multiple data, so it is increasingly being applied in research. In particular, it is mainly used to supplement the accuracy through additional data in abstract fields such as sensing emotion through the human voice.
Recently, as the untact environment has increased in prevalence due to COVID-19, the Metaverse and SNS are receiving increased attention. Since the Metaverse and SNS are remote communication methods, it is very important to recognize emotional information [
1,
2]. In particular, as the untact environment continues, the number of people suffering from depressive disorder is increasing due to the increase in time spent alone.
According to the World Health Organization (WHO), 322 million people currently suffer from depressive disorder, and this number is increasing rapidly each year [
3]. Furthermore, as shown in
Table 1, the number of patients diagnosed with depressive disorder is steadily increasing in Korea.
Table 1 shows the data on people who received treatment for a depressive disorder by year for 2016–2020 provided by the Health Insurance Review and Assessment Service. Depressive disorders are disease codes F30–F39 and {F30–F39} is the sum of all codes corresponding to depressive disorders. When {F30–F39} was confirmed, the number of depressive disorders increased by 32.7% from 2016 to 2020. Methods for identifying these depressive disorders rely on mental health questionnaires and consultations with doctors. However, there is a limit in that it is not possible to receive medical services or an earlier diagnosis due to rejection caused by the social stigma associated with mental disorders. To solve this problem, mental care services that automatically detect depression through emotional analysis have been proposed [
4,
5,
6].
The mental care service performs mental health management such as detecting depression by checking a person’s mental health status through wearable devices and smartphones, on which research on depression detection is based. Existing depression research has been conducted to detect depression through the human voice, text, and facial expressions. However, there is a limitation that high-accuracy depression detection was not possible because single data was used.
This paper proposes a multimodal data-based attention mechanism depression detection model to improve the low-accuracy problem with the depression detection model using single data.
The proposed model converts text data into an embedding vector using the BERT tokenizer. The transformed embedding vector is obtained by fine-tuning and learning the pre-trained BERT-CNN model to obtain a feature vector.
Speech data are converted into a log-mel spectrogram through preprocessing that converts it into a digital signal for learning; features are extracted through a CNN model and learned through Bidirectional Long Short-Term Memory (BiLSTM) to which an attention mechanism is applied. Speech data are converted into log-mel spectrograms through a preprocessing operation that converts them into digital signals for training. The preprocessed data are transformed into feature vectors through CNN and BiLSTM with an applied attention mechanism. As a result, feature vectors derived from speech and text data are passed to a Fully Connected (FC) layer to determine whether depression is present.
By applying the proposed model, we aim to design and implement a high-performance detection model that can improve upon the low accuracy of existing systems and avoid feature vector loss through attention mechanisms.
2. Related Work
2.1. Depression Detection
Depression is usually accompanied by features such as voice, video, and text because it affects the patient’s speech state or sentences [
7,
8,
9]. Based on these various characteristics, it is used in research to detect suicide and depression [
10]. Methods for detecting depression include using a support vector machine, a naive Bayes classifier, and a deep learning model by extracting features based on speech and text, but a depression detection model using single data has been the mainstream. In addition, a multimodal analysis method that can combine and use data composed of different types of information to improve accuracy is being studied [
11,
12,
13].
2.1.1. Text Data Classification
Classification based on text data generally extracts feature vectors through a preprocessing process and analyzes them through learning through a deep learning model. Classification using text data mainly uses models based on CNNs or Recurrent Neural Networks (RNNs). A CNN has strengths in extracting and learning features from spatiotemporal data but has limited ability to reflect the features of text data, which is time-series data. The RNN model is a specialized model for time-series data and is more often used than CNN but as the data lengthens problems with gradient loss and explosion occur [
14,
15]. Models to solve this problem include a Long Short-Term Memory (LSTM) network and a BiLSTM model. The LSTM model erases unnecessary information by adding an input gate, a forget gate, and an output gate to the memory cell of the hidden layer. Afterward, the problem of gradient loss and explosion was alleviated by passing the necessary information to the next state. BiLSTM is an improvement upon the LSTM model that includes a temporal element to reflect all information of the past, present, and future [
16]. LSTM and BiLSTM are being actively used in studies related to text data classification and in research on the detection of depression. Al Hanai, T. et al. used LSTM to confirm that depression was detectable in three cases ((1) with questions, (2) without questions, and (3) with only responses) during a personal interview process [
17]. Wu, J.L. et al. used a deep learning framework that combined word embedding, BiLSTM, and CNN to classify sentiment labels in a text [
18]. A transformer is a model that follows the encoder–decoder structure of seq2seq and implements it only through attention, greatly improving the previous problems [
15]. BERT uses these transformers and is a language model pre-trained with unlabeled text data such as Wikipedia (2.5 billion words) and BooksCorpus (800 million words) [
19].
High accuracy can be expected because BERT performs fine-tuning that reads hyperparameters with additional training for other problems through a pre-trained model based on unlabeled data. In addition, BERT consists of a transformer structure using attention, so it is safer than the existing model for the problem of gradient loss and explosion. The BERT model shows excellent performance in classification and regression problems and shows good performance when a feature vector is extracted and used in combination with BiLSTM [
15].
2.1.2. Sound Data Classification
The most commonly used processes for classifying speech data are the mel spectrogram, log-mel spectrogram, and Mel Frequency Cepstrum Coefficient (MFCC) [
20]. Obtaining these types of data requires changing the raw analog data into a digital form. Therefore, analog data are converted into a digital signal through a sampling process that converts an analog waveform into a digital form, quantization that determines how accurately each sampled point is expressed, and an encoding process that expresses digital information in binary. Classification studies have been conducted using converted raw speech data, but a limitation has been found that is similar to the performance of mel spectrogram when trained with a large amount of speech data [
21]. In addition, research on a voice data classification model that combines CNN and RNN based recursive models is in progress [
22,
23].
2.1.3. Video Data Classification
Depression detection studies using video data have continued. In particular, the main study aimed to identify depression by making it a singular factor that depressed patients had facial expressions that were different from those of ordinary people when faced with the same situation. Cohn et al. conducted a study on whether depression could be recognized by facial movements [
24]. Depression was detected with the SVM model by collecting video and audio data and preprocessing with manual FACS coding and active appearance modeling. Manual FACS showed an accuracy of 88% and active appearance modeling confirmed an accuracy of 79%. Mclntyre et al. further classified action units and region units and confirmed the detection of depression through detailed facial segmentation [
25]. Wang et al. extracted the features of the main movements of the eyes, eyebrows, and lips among facial dynamics information from the video and classified features using the SVM model, confirming a depression detection accuracy of 78.85% [
26]. However, a relatively small amount of video data was available due to privacy protection, which is prone to overfitting in model training using deep networks; a sequential fusion method of face shape and dynamics has been proposed to solve this problem. Chen et al. attempted to derive depression by fusing the subject’s facial appearance and facial mechanics that can be characterized by optical flow [
27]. In the process of convergence, excellent performance was confirmed using a two-stream network architecture with a backbone structure.
2.1.4. Multimodal Classification
In multimodal classification, different types of data such as text and voice combine and complement each other. Since this method shows higher accuracy than the existing single data use, much current research uses it [
13,
28,
29,
30]. Kim et al. implemented a personal recommendation system for users through multimodal analysis combining text data and rating scores [
28]. Liu et al. improved the existing accuracy through multimodal emotion recognition for audio and video data based on the improved AlexNet network and attention mechanism [
29]. Zhang et al. performed emotion recognition using multimodal data and domain knowledge through Dueling Deep-Q-network (DDQN) based on a Gated Recurrent Unit (GRU) layer and obtained excellent performance for most emotions [
31].
2.2. Attention Mechanism
Sequence data are mainly trained by using a recursive model such as an RNN and the positions of the input and output sequences are generally considered for calculation. In the backpropagation algorithm process, the gradient gradually decreases toward the input layer in the process of the backpropagation algorithm, so weights are not properly updated in the layers close to the input layer. Conversely, as the gradient gradually increases toward the input layer, a gradient exploding phenomenon occurs in which the weights become abnormally large. In addition, there is a problem that information loss occurs in the process of compressing all information of data input to a fixed size vector of an output sequence. One method to solve this problem is an attention mechanism [
15,
29], which works by obtaining and applying an attention score from a recursive model such as an RNN. Ji et al. proposed a model that uses a relational network to enhance text representation using vocabulary-based emotion scores [
32]. In addition, we demonstrated the efficiency of the text classification model by using the method of assigning priority in the relation module through the attention mechanism.
3. System Overview
This paper proposes an attention depression detection model based on multimodal analysis. Multimodal analysis using attention improves the biased data problem of existing single data and increases the weighting for important vectors, enabling high-accuracy depression detection.
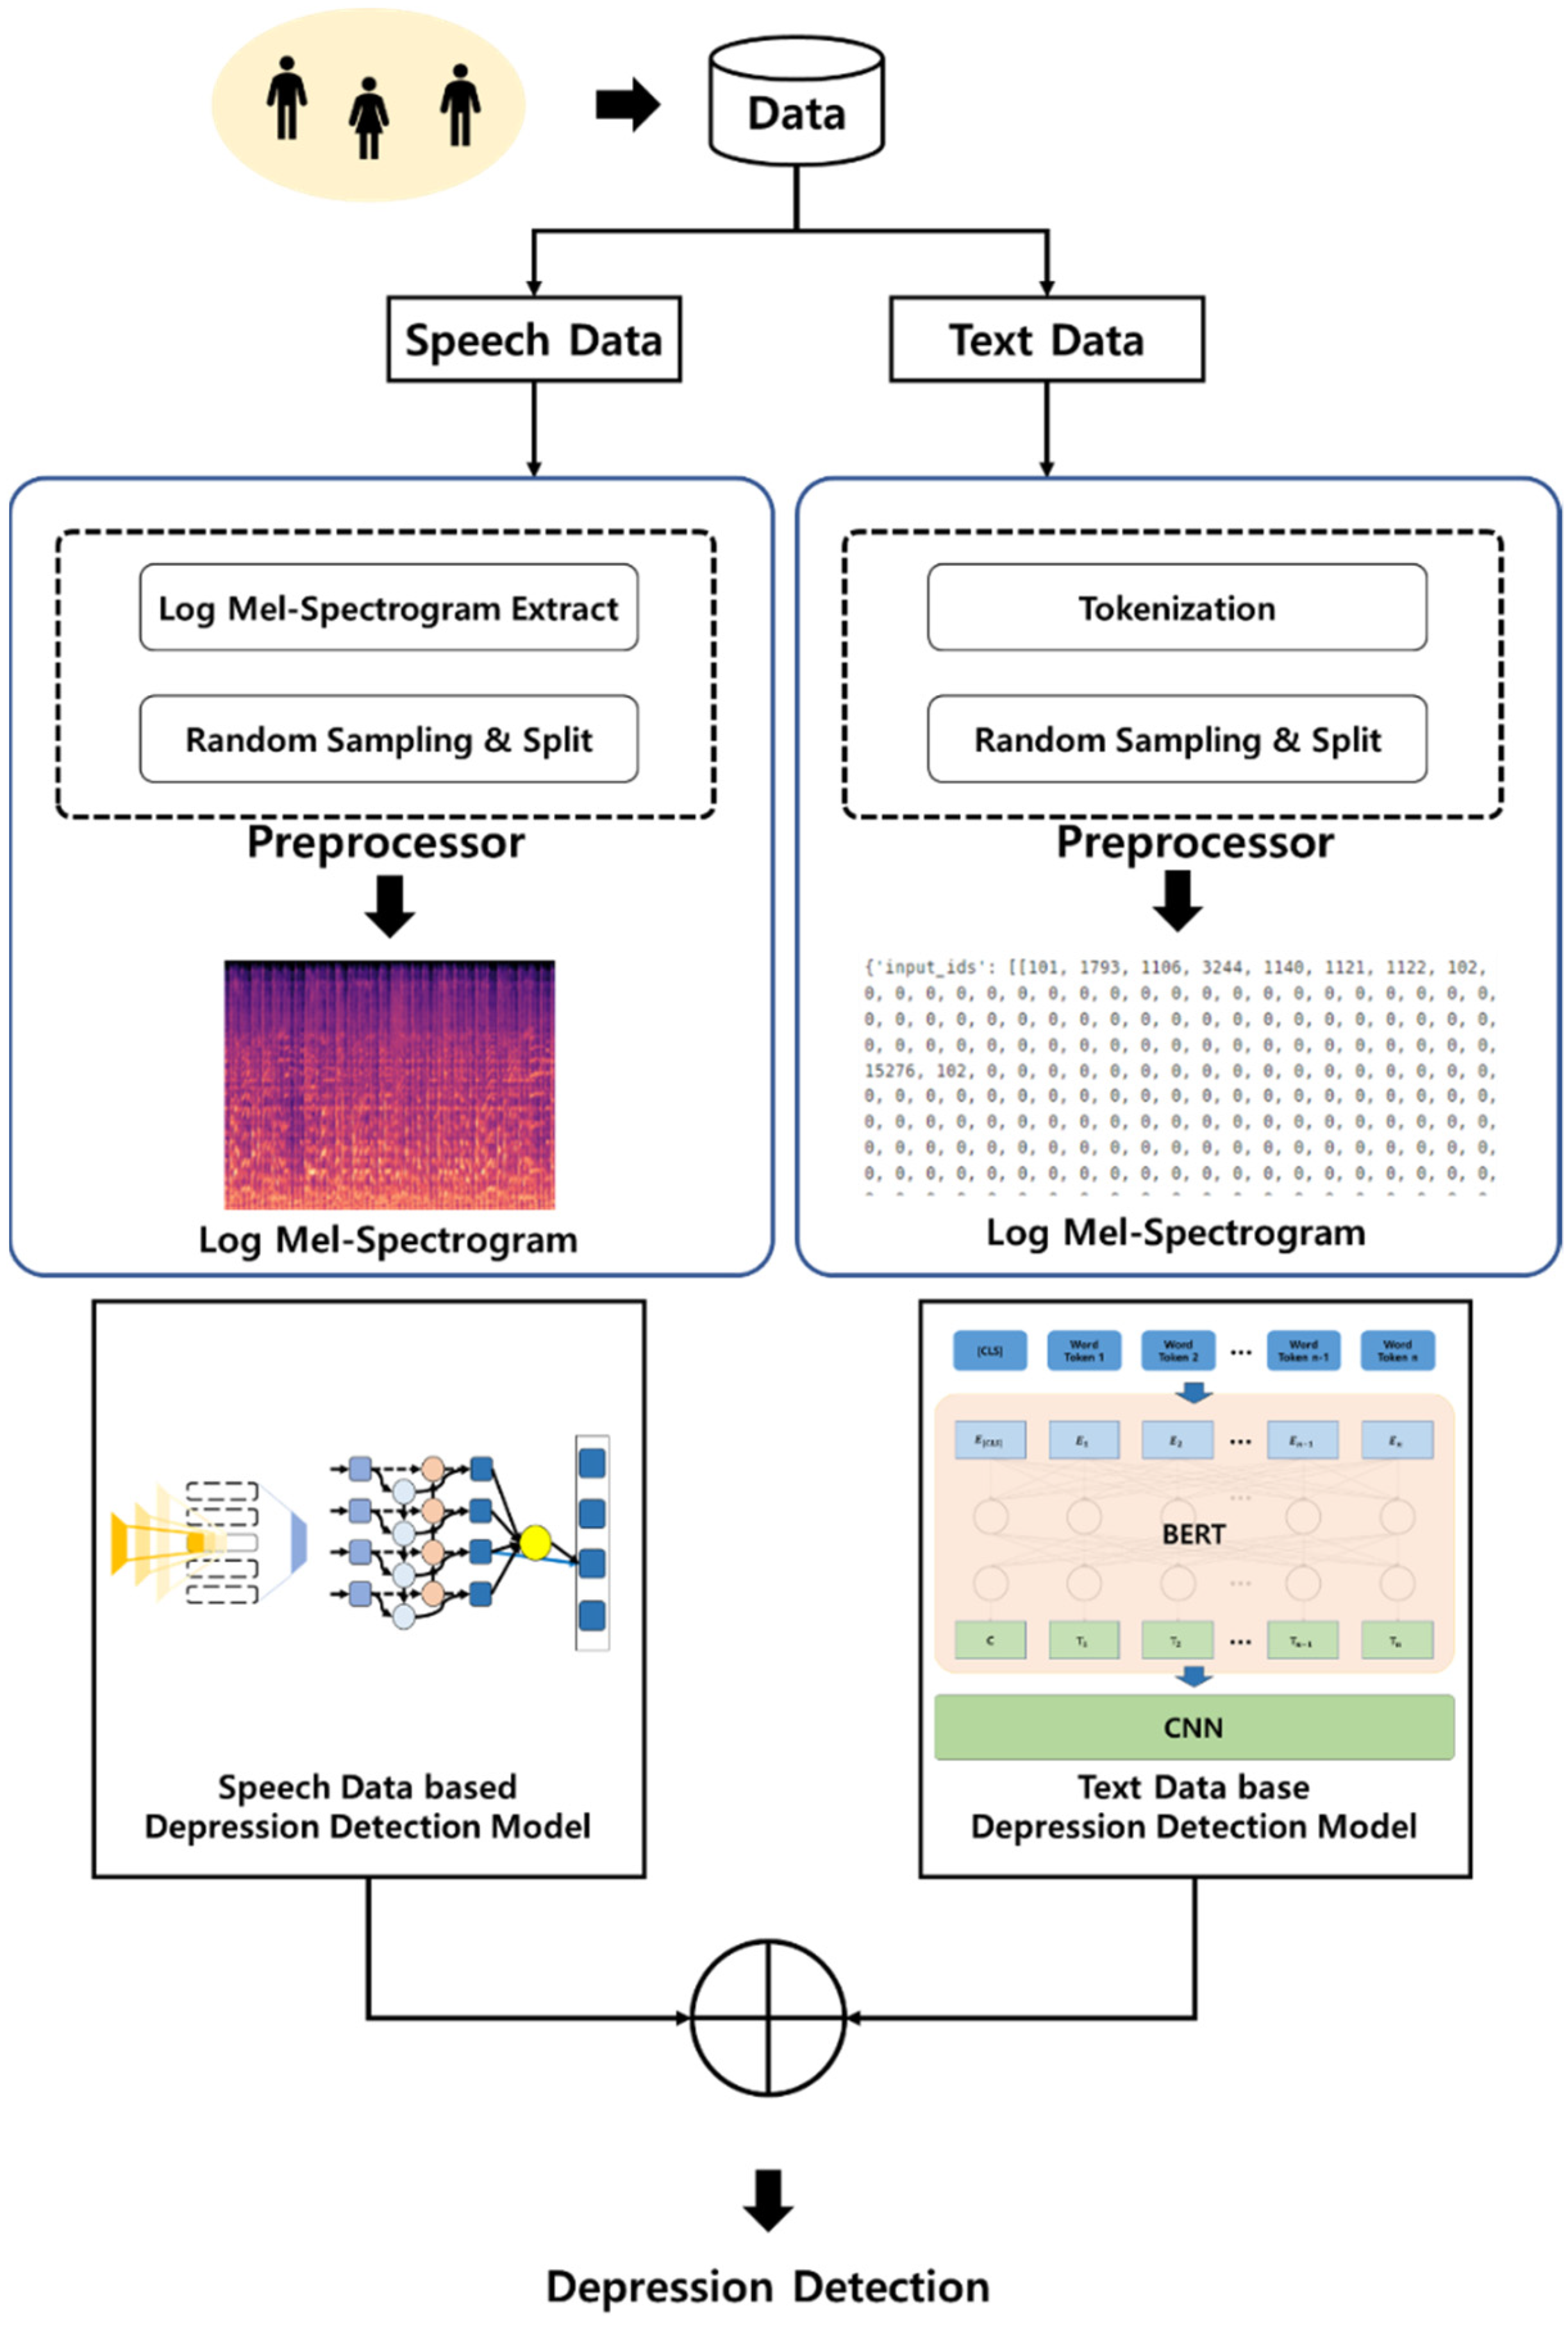
Figure 1 is a schematic diagram of the multimodal analysis-based attention depression detection model proposed in this paper. Speech and text data collected from humans have onomatopoeia removed and are delivered to each preprocessor. From the speech data, log-mel spectrograms are extracted through the preprocessor, and training data are generated through random sampling and segmentation. The generated training data are trained through a CNN-BiLSTM model suitable for feature extraction and time-series data. Text data are tokenized using the transformers tokenizer in the preprocessor and transformed into an embedding vector through stopword removal. The embedding vector fine-tunes the training of the pre-trained BERT-CNN model. By connecting the feature vectors of the models based on speech and text data, they are finally binary classified into “depression” and “non-depression”.
4. System Implementation Method
4.1. Text Analysis Model
The text analysis model is configured as shown in
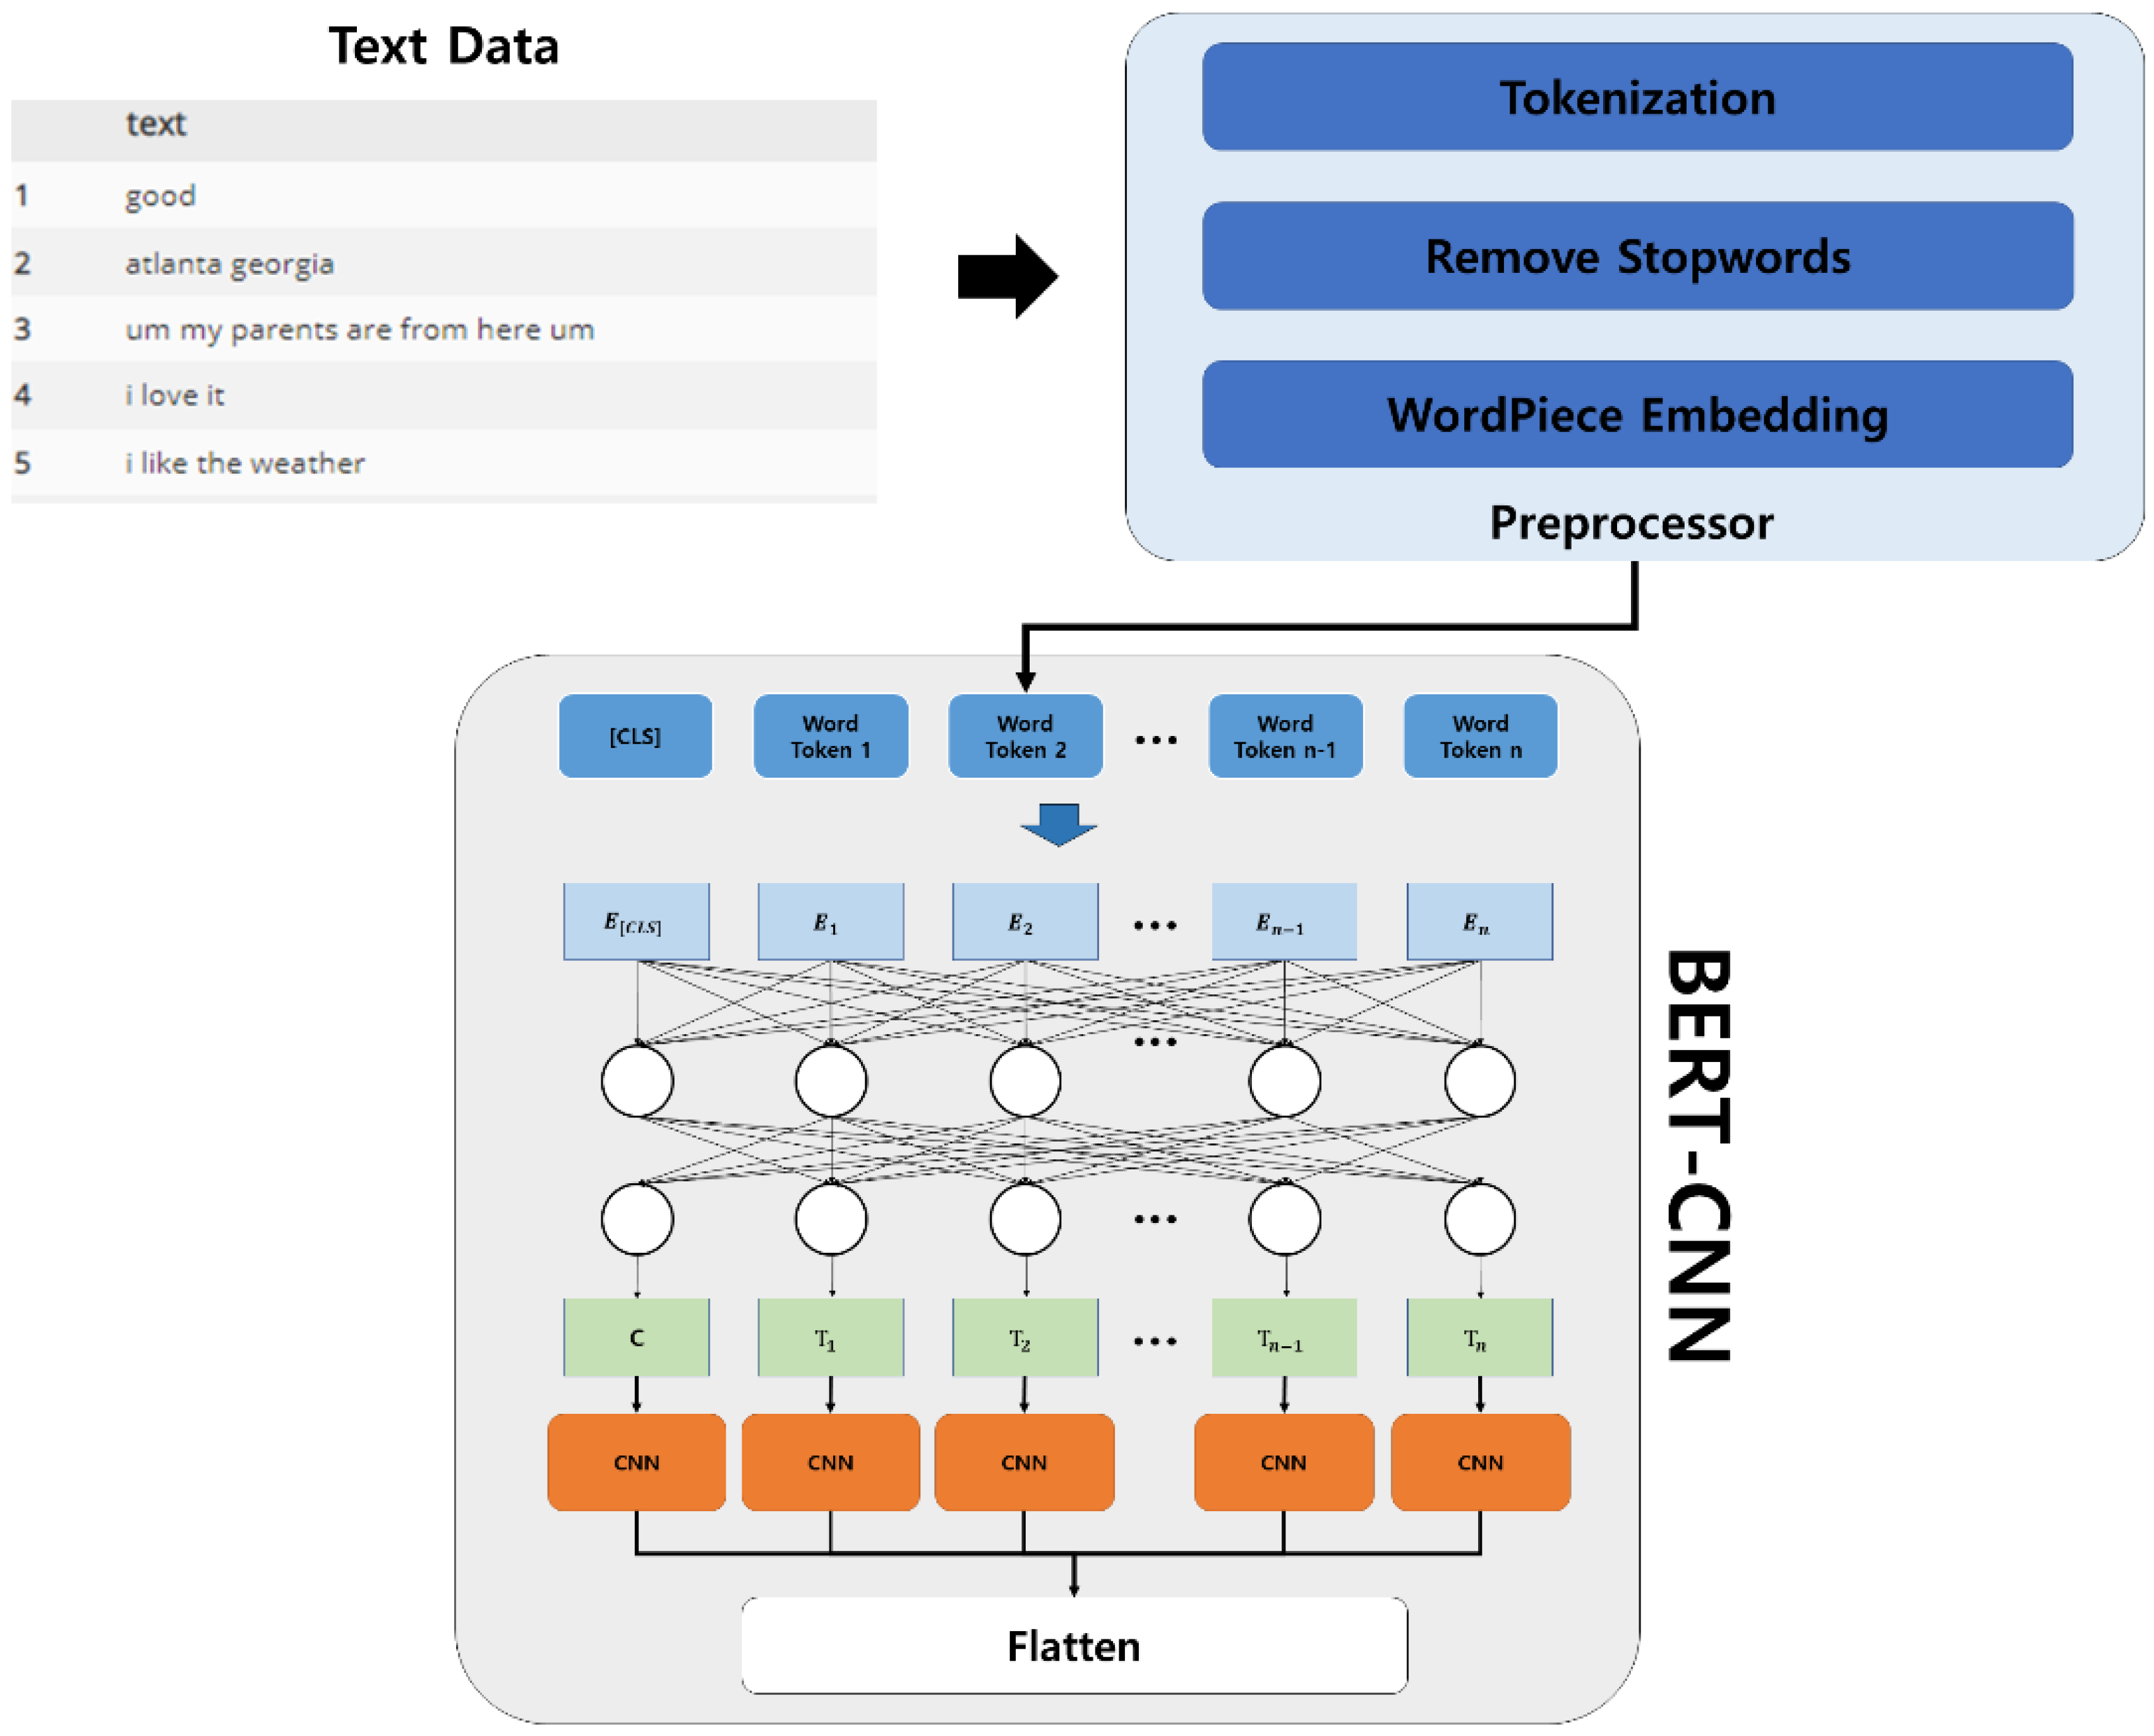
Figure 2 and consists of text preprocessing and BERT-CNN models. Text data collected from people need preprocessing into an input form suitable for a deep learning model.
The preprocessing tasks are tokenization, stopword removal, and WordPiece embedding. Tokenization divides a given corpus into units called tokens based on punctuation and rules. Separated tokens remove stopwords to only use those that contain meaningful information. Tokens with stopwords removed are then converted into embedding vectors using WordPiece embeddings. Detecting depression requires an attention mechanism that highlights the emotional information contained in the embedding vector. BERT is a model based on self-attention and transformers that shows high performance in achieving a specific purpose through a fine-tuning process after pre-training. The preprocessed embedding vector is input data for the learning model to obtain a context vector that reflects the context and word characteristics.
4.2. Speech Analysis Model
The voice analysis model is composed as shown in
Figure 3 it consists of a CNN-BiLSTM model based on voice data preprocessing and an attention mechanism. Speech data collected from people need preprocessing in the form of input to a deep learning model.
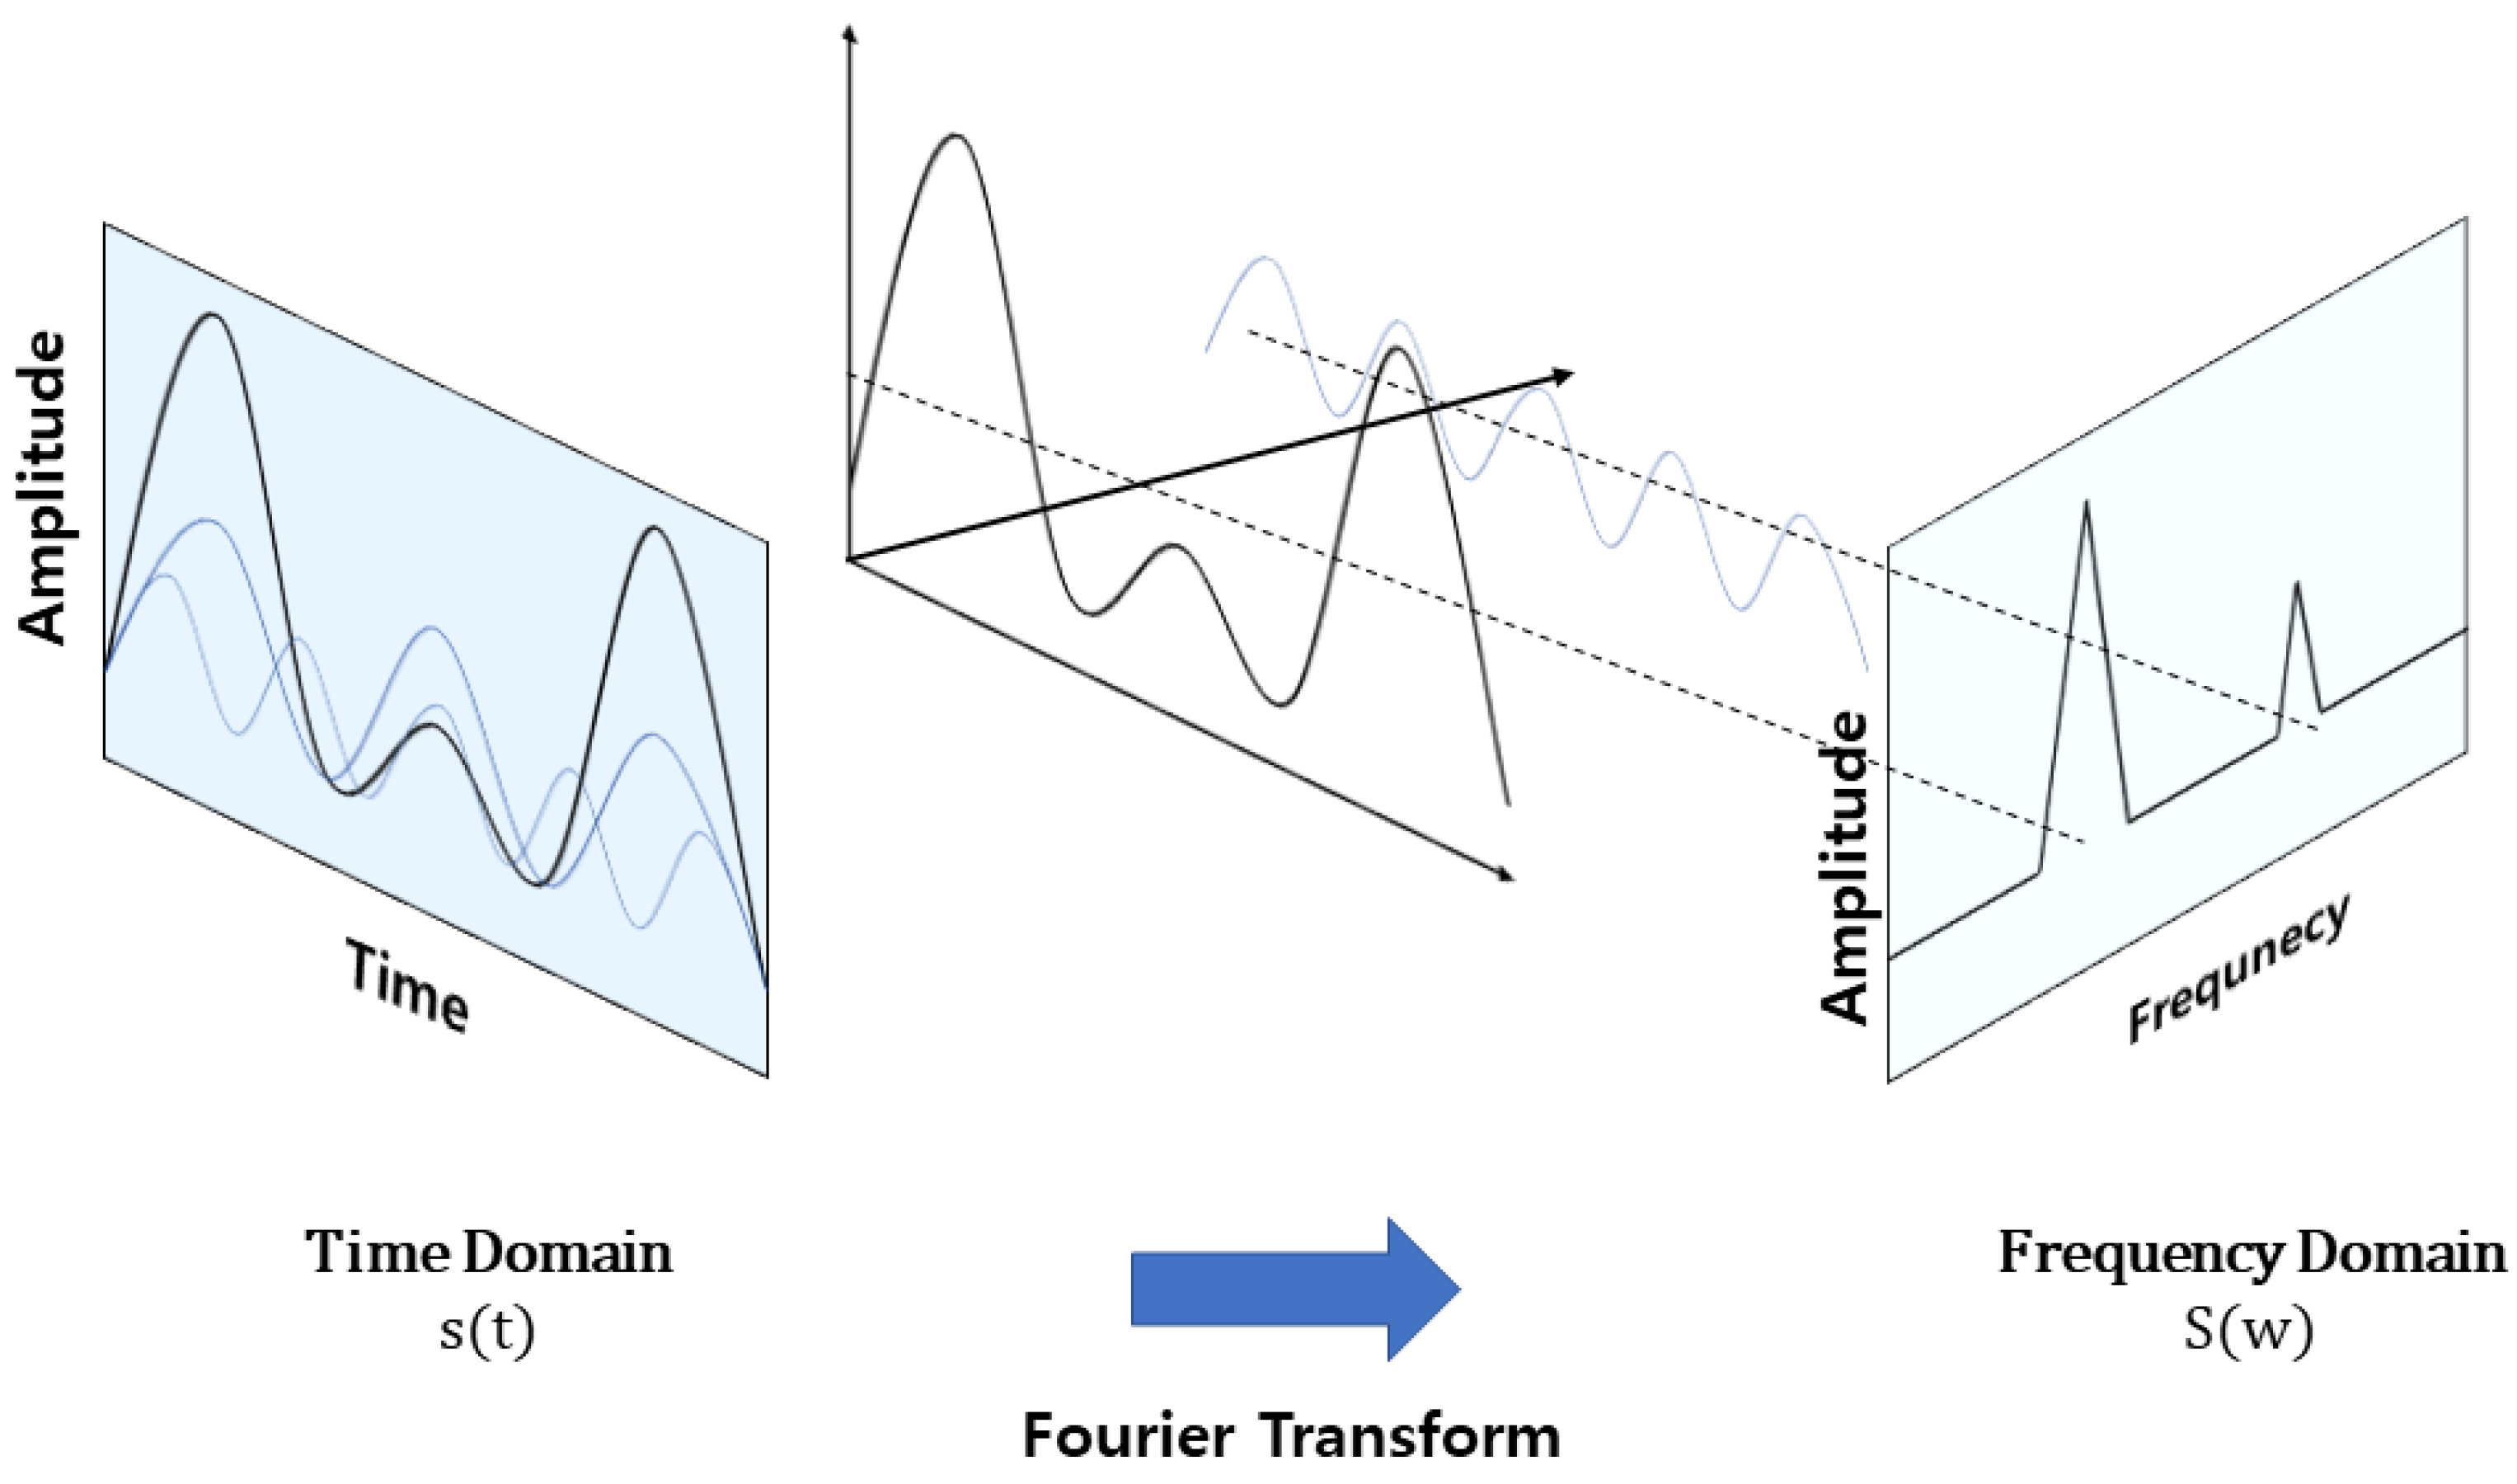
Voice data are a sound form quantized through Analog–Digital Conversion (ADC) but since the dimensions are too large and multiple frequencies are combined, rather than using the data as is, it is used by extracting features that will reflect the signal’s properties. Since voice data are sequential and time-dependent, a window is applied that splits the signal into very short sections. However, there is a problem that it differs from the actual signal as both end values of the section boundary become discontinuous and cut off. To solve this problem, each frame is multiplied by a window function that converges both boundary values to 0 to minimize the influence of the window on the signal characteristics. Since the voice data to which the window function is applied has a large dimension and combines multiple frequencies, Equation (1) (Fourier Transform (FT)) is applied to separate it.
However, as shown in
Figure 4, the Fourier transform has a limitation in that the temporal characteristics required to analyze speech data disappear because the time domain disappears.
Therefore, the short-time Fourier transform is applied to each cut section, and the time domain is maintained by stacking each side-by-side in chronological order.
The data derived through STFT is a spectrum and becomes a power spectrum when the magnitude is squared. Each spectrum and power spectrum is transformed into a spectrum by shifting the axes and stacking them in chronological order for time-domain reconstruction.
Human sound recognition is more sensitive than a high-frequency band of a low-frequency region of 1000 Hz or less. Therefore, the mel filter bank in
Figure 5 is applied because it is necessary to check the low-frequency region more precisely than the high-frequency region. The mel filter bank consists of several filter banks close to the human auditory structure. The center frequency arrangement of each filter is uniform below 1000 Hz and a log scale is applied above 1000 Hz based on the mel unit. Finally, the log-mel spectrum is derived by applying a log-scaled mel filter to the spectrum.
This paper uses CNN-BiLSTM—which uses an attention mechanism—as a model for speech analysis. The log-mel spectrogram derived from the previous voice data preprocessing is composed of a two-dimensional array as shown in
Figure 6.
The two-dimensional log-mel spectrogram is used as input data for a 2D CNN (2-Dimension Convolutional Neural Network) to extract features. The feature vectors derived through the 2D CNN model are input to the BiLSTM, which consists of two layers to which the attention mechanism has been applied. The attention mechanism uses Bahdanau attention by connecting the forward and backward hidden states in the bidirectional decoder and the hidden state of the previous time step in the unidirectional decoder with a non-stack structure. Data derived from BiLSTM are converted into a context vector by weighting the attention weights.
4.3. Multimodal Fusion Model
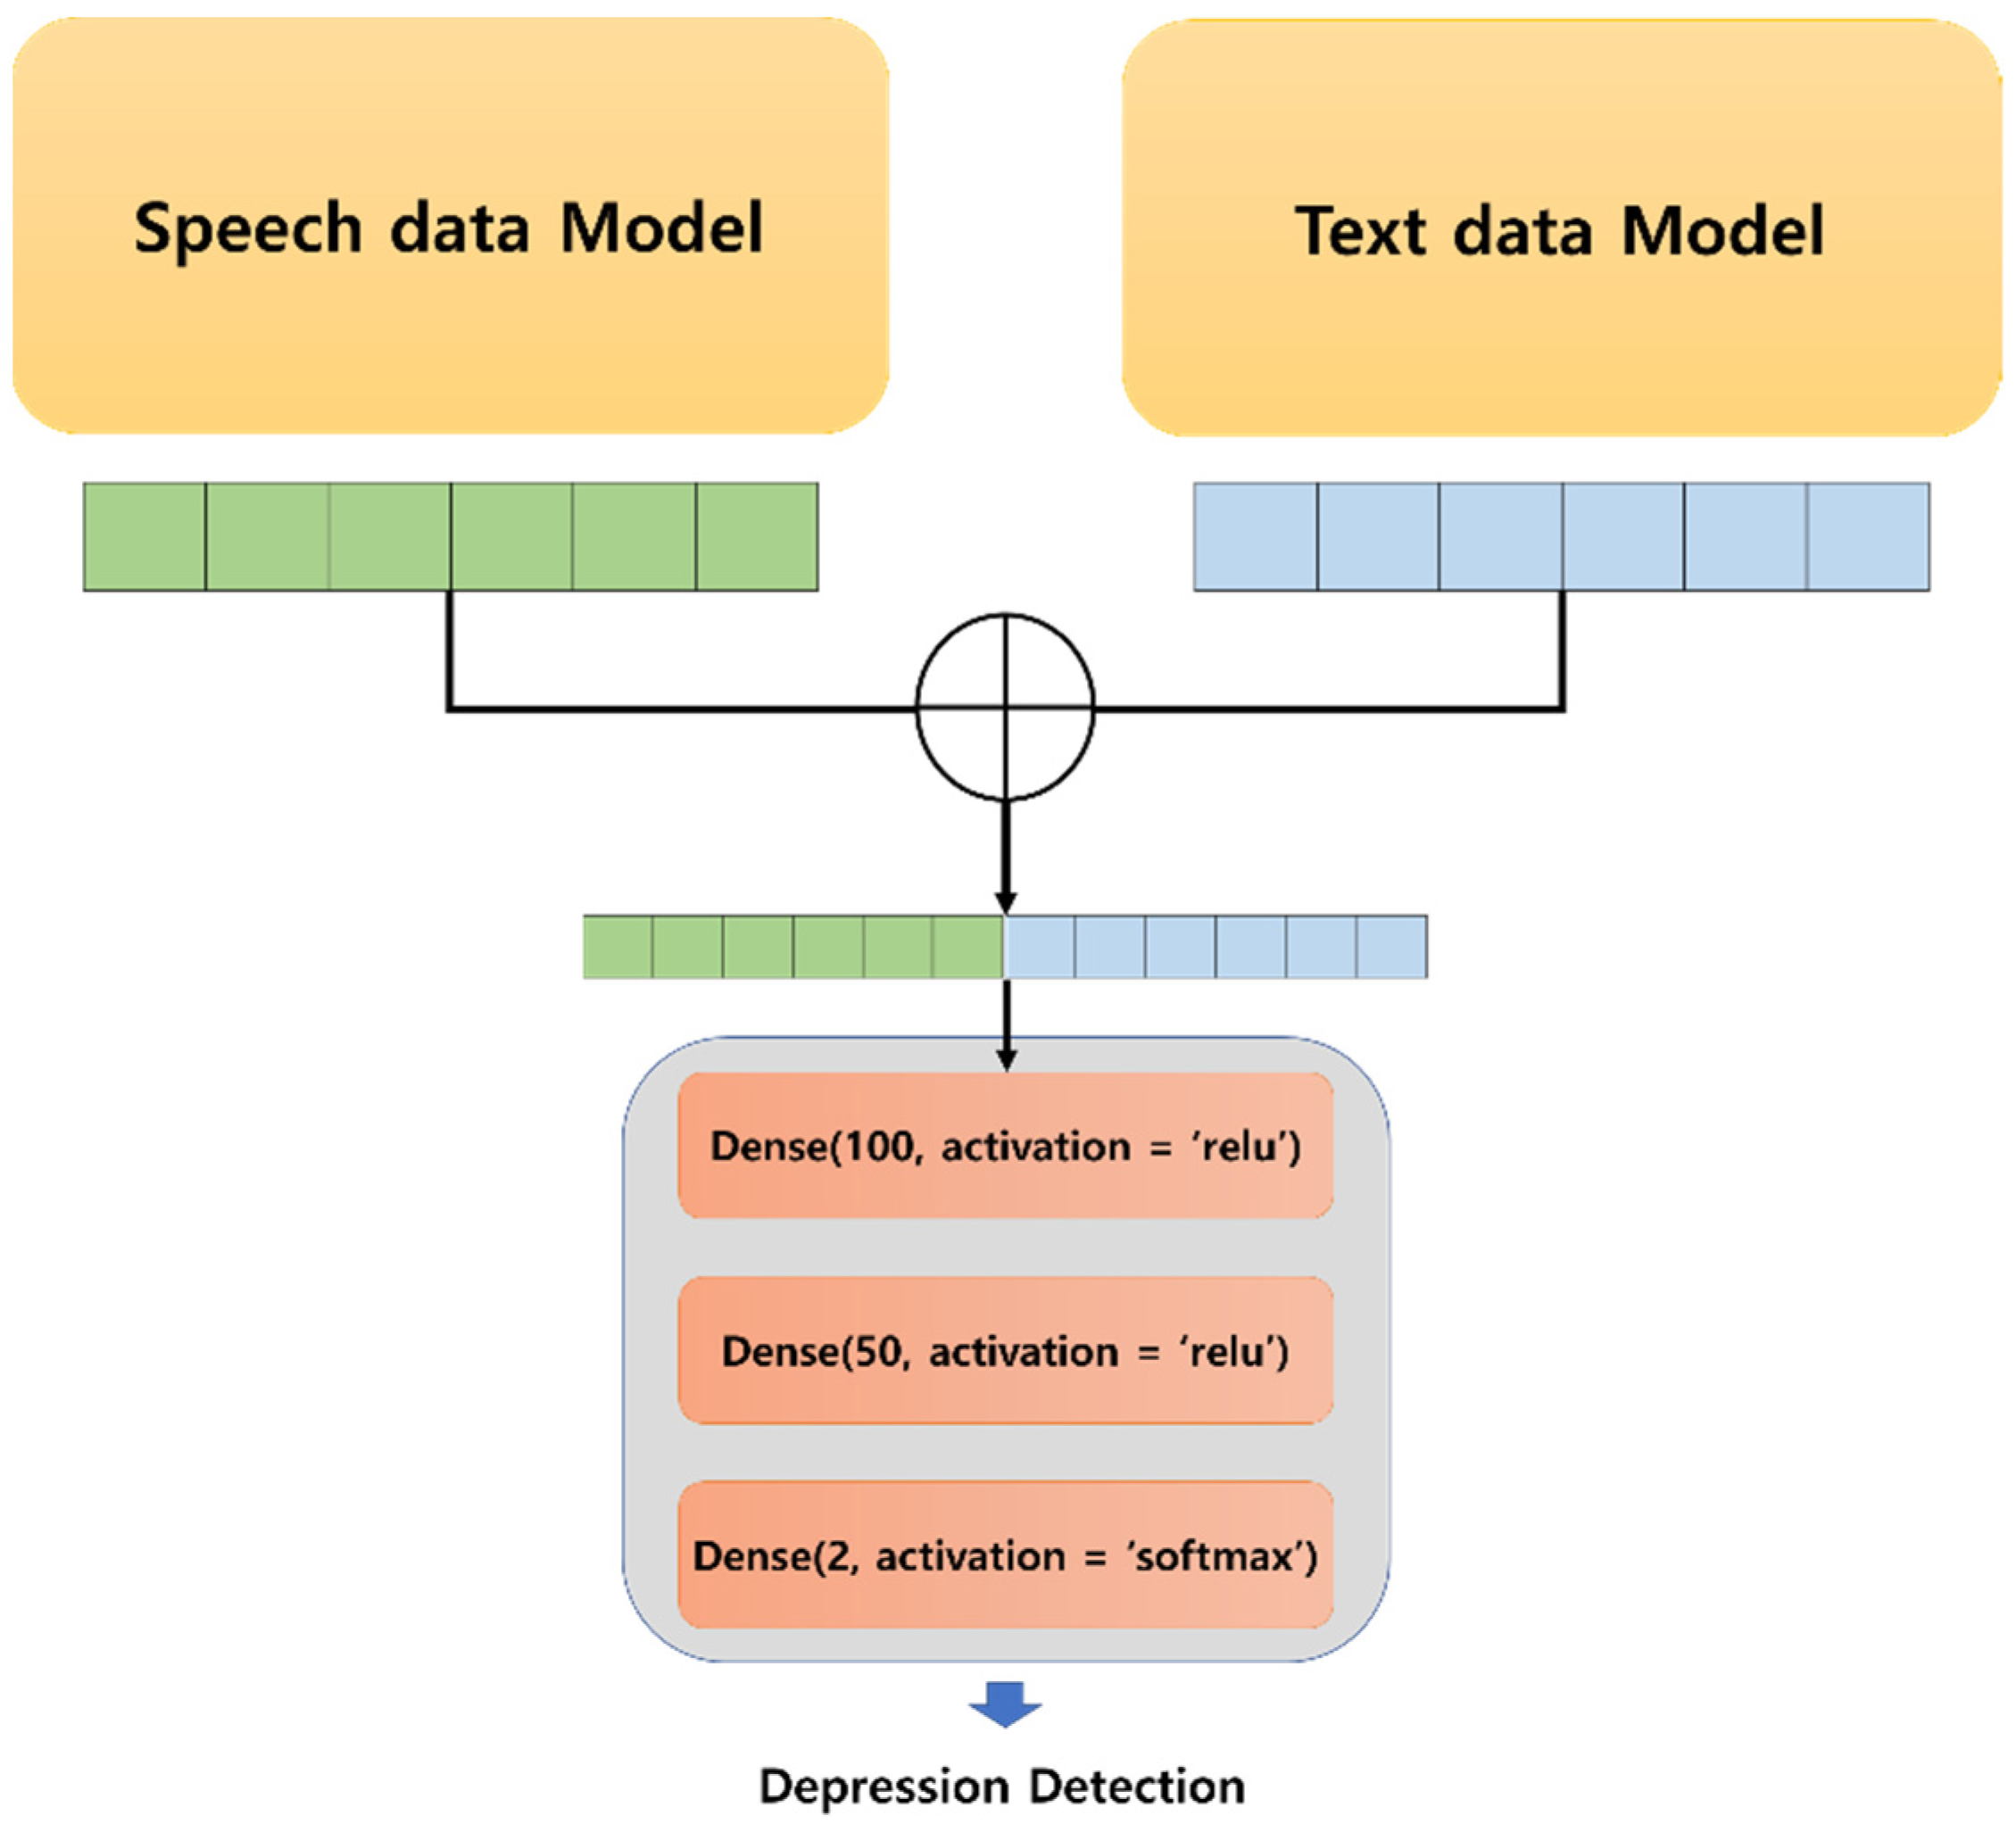
Figure 7 shows the structure of a model for classifying depression by fusing multimodal data. In multimodal analysis, the data have different forms. Therefore, each model is converted into a feature vector of the same form through preprocessing and learning processes. Each vector is passed to the FC layer of one layer and combined into one feature vector. The fused data go through a total of three dense layers to finally classify the presence or absence of depression. The first dense layer uses 100 output neurons and a relu activation function and the second dense layer uses 50 output neurons and a relu activation function. The final dense layer uses two output neurons to detect the presence or absence of depression and a softmax activation function for two-class classification.
5. Experiment
Table 2 lists the detailed experimental environment of the system proposed in this paper. Experiments were conducted using a Tensorflow-gpu in the Jupyter NoteBook environment.
5.1. Dataset
The DAIC-WOZ dataset is part of DAIC, a corpus containing clinical interviews designed to support the diagnosis of psychological distress conditions such as anxiety, depression, and post-traumatic stress [
33]. The dataset consists of an interview with the subject conducted by an animated virtual interviewer named Ellie that is controlled by a hidden person.
In this paper, an experiment is conducted based on the voice and text data of the DAIC-WOZ dataset. The voice data are classified in the form of “Speaker ID_AUDIO” as shown in
Figure 8. One audio file contains conversation information between the interrogator “Ellie” and the experiment participant “Participant.” Text data consist of “start_time”, “stop_time,” “speaker”, and “value”, as shown in
Figure 9. The elements “start_time” and “stop_time” are the time from the start time to the end of the speech in the voice file and are expressed in seconds up to the third decimal place; “speaker” is a column that distinguishes each speaker and consists of “Ellie” and “Participant”; “value” is the dialogue sentence information between “Ellie” and “Participant.”
5.2. Text Analysis Model
The text data in
Figure 10 include two sentences from the virtual announcer and the subject. In this experiment, regardless of the question, we only used the participant’s answers to detect depression in common situations.
The separated text data are preprocessed in token units using BertTonkenizer provided by Python’s Transformer library and the preprocessed data are used to fine-tune the pre-trained BERT model. Then, the fine-tuned BERT model is combined with the CNN model to extract the context vector.
5.3. Speech Analysis Model
As in the text data, voice data are a mixture of the virtual announcer and subject data. Since this system only uses the subject’s voice data provided in the dataset, as shown in
Figure 11, start_time and stop_time for each sentence are used to separate out the subject’s voice data.
The voice data that contain only the subject’s voice are separated and converted into a log-mel spectrogram through the Librosa library and the log-mel spectrogram is cut to voice length using Equation (2).
Figure 12 of the log-mel spectrogram contains the subject’s overall speech information.
The voice data of DAIC-WOZ is at 16 KHz (sampling rate) and the HanningWindow used in the process of deriving the log-mel spectrogram using Librosa is 1024; therefore, the length of the voice for each frame is 32 ms. To extract 8-second voice samples, sampling is performed in units of 250 frames from each subject’s log-mel spectrogram. The number of samples for each subject was based on the maximum number of samples that could be drawn based on the voice data of the subject with the shortest voice length of eight seconds (s).
Through the previous process, the training data required for the learning model was extracted to construct a dataset in the form of
Figure 13. The total number of datasets is 3696 and each data has the same form (128, 250, 1). The ratio of training data to test data is 8:2 and the verification data is separated by 1:9 of training data. The preprocessed dataset was trained using the 2D CNN-BiLSTM based on the attention mechanism.
5.4. Multimodal Fusion Model
The feature vectors derived from the gender and text models are one-dimensional vectors because they have gone through the FC layer. Feature vectors from two different types of data were input by concatenating the two vectors before input to the two dense layers of 250 and 100. Finally, softmax was used to classify depression.
5.5. Experiment Result
The proposed system is a multimodal depression detection model based on the attention mechanism.
Figure 14,
Figure 15 and
Figure 16 are training graphs for a model using text and speech data without an attention mechanism and the model using multimodal data and attention mechanism proposed in this paper.
Figure 14,
Figure 15 and
Figure 16 show the classification results and classification accuracy of the validation data set of each model. As shown in
Figure 14, the accuracy graph is stable when using single voice data but unstable with respect to the degree of loss.
Figure 15 shows that the accuracy and loss were very unstable for the verification data when only using text data.
Figure 15 shows that for verification data using only text data, the accuracy and loss ratio increase proportionally. In particular, it is more stable than the loss graph in
Figure 14.
Finally,
Figure 16 shows the experimental results of the model proposed in this paper. The experimental results of the proposed model show that the accuracy and loss have been improved and the graph has stabilized.
6. Discussion
This paper proposes a multimodal analysis-based attention depression detection model using two different datasets. Unlike the existing depression detection methods that only use single data, it used a fusion of text data and voice data. The BERT-CNN model and multi-mode analysis with the attention mechanism solved the rapid loss increase due to the use of single data and showed improved accuracy. Additionally, we deliberately did not use depression-related questions and extracted information from universal answers. This demonstrates scalability to detect depression by applying the proposed model to situations other than specific interviews such as the DAIC-WoZ dataset.
However, there is a limitation in that it is impossible to classify the detection of depression by subdividing it into mild and severe rather than determining whether it is present. This is a problem because the model was designed with a focus on discriminating information about depression itself. Therefore, if an indicator of depression such as a patient’s mental health questionnaire is added as learning data, it will be possible to detect subdivided depression.
This study can be used to segment emotional classification through an improved model. In addition, since it is easy to collect voice and text data, it will be applicable for IoT devices such as AI speakers.
Author Contributions
Conceptualization, J.P.; methodology, J.P.; software, J.P.; validation, J.P.; formal analysis, J.P.; investigation, J.P.; resources, J.P.; data curation, J.P.; writing—original draft preparation, J.P.; writing—review and editing, J.P. and N.M.; visualization, J.P.; supervision, J.P.; project administration, N.M.; funding acquisition, N.M. All authors have read and agreed to the published version of the manuscript.
Funding
This paper was supported by the National Research Foundation of Korea (NRF) grant funded by the Korean government (MSIT) (No. 2021R1A2C2011966).
Institutional Review Board Statement
Not applicable.
Informed Consent Statement
Not applicable.
Data Availability Statement
Restrictions apply to the availability of these data. Data was obtained from Ref. [
33] and are available (
https://dcapswoz.ict.usc.edu/, accessed on 14 January 2022) with the permission of Ref. [
33].
Conflicts of Interest
The authors declare no conflict of interest.
References
- Saberi, B.; Saad, S. Sentiment analysis or opinion mining: A review. Int. J. Adv. Sci. Eng. Inf. Technol. 2017, 7, 1660–1667. [Google Scholar]
- Liu, B. Sentiment analysis and opinion mining. Synth. Lect. Hum. Lang. Technol. 2017, 7, 1–167. [Google Scholar]
- World Health Organization. Depression and Other Common Mental Disorders: Global Health Estimates; World Health Organization: Geneva, Switzerland, 2017; pp. 1–27. [Google Scholar]
- Guntuku, S.C.; Yaden, D.B.; Kern, M.; Ungar, L.H.; Eichstaedt, J.C. Detecting depression and mental illness on social media: An integrative review. Curr. Opin. Behav. Sci. 2017, 18, 43–49. [Google Scholar] [CrossRef]
- Salekin, A.; Eberle, J.W.; Glenn, J.J.; Teachman, B.A.; Stankovic, J.A. A Weakly Supervised Learning Framework for Detecting Social Anxiety and Depression. Proc. ACM Interact. Mob. Wearable Ubiquitous Technol. 2018, 2, 81. [Google Scholar] [CrossRef] [PubMed]
- Orabi, A.H.; Buddhitha, P.; Orabi, M.H.; Inkpen, D. Deep learning for depression detection of twitter users. In Proceedings of the Fifth Workshop on Computational Linguistics and Clinical Psychology: From Keyboard to Clinic, New Orleans, LA, USA, 5 June 2018; pp. 88–97. [Google Scholar]
- Cummins, N.; Scherer, S.; Krajewski, J.; Schnieder, S.; Epps, J.; Quatieri, T.F. A review of depression and suicide risk assessment using speech analysis. Speech Commun. 2015, 71, 10–49. [Google Scholar] [CrossRef]
- Kiss, G.; Takacs, A.B.; Sztaho, D.; Vicsi, K. Detection Possibilities of Depression and Parkinson’s disease Based on the Ratio of Transient Parts of the Speech. In Proceedings of the 2018 9th IEEE International Conference on Cognitive Infocommunications (CogInfoCom), Budapest, Hungary, 22–24 August 2018; pp. 000165–000168. [Google Scholar] [CrossRef]
- Esposito, A.; Raimo, G.; Maldonato, M.; Vogel, C.; Conson, M.; Cordasco, G. Behavioral sentiment analysis of depressive states. In Proceedings of the 2020 11th IEEE International Conference on Cognitive Infocommunications, Mariehamn, Finland, 23–25 September 2020; pp. 000209–000214. [Google Scholar]
- Ji, S.; Pan, S.; Li, X.; Cambria, E.; Long, G.; Huang, Z. Suicidal Ideation Detection: A Review of Machine Learning Methods and Applications. IEEE Trans. Comput. Soc. Syst. 2020, 8, 214–226. [Google Scholar] [CrossRef]
- Yang, L.; Jiang, D.; Xia, X.; Pei, E.; Oveneke, M.C.; Sahli, H. Multimodal measurement of depression using deep learning models. In Proceedings of the 7th Annual Workshop on Audio/Visual Emotion Challenge, Mountain View, CA, USA, 23 October 2017; pp. 53–59. [Google Scholar]
- Joshi, J.; Goecke, R.; Alghowinem, S.; Dhall, A.; Wagner, M.; Epps, J.; Parker, G.; Breakspear, M. Multimodal assistive technologies for depression diagnosis and monitoring. J. Multimodal User Interfaces 2013, 7, 217–228. [Google Scholar] [CrossRef]
- Maity, S.; Abdel-Mottaleb, M.; Asfour, S.S. Multimodal biometrics recognition from facial video with missing modalities using deep learning. J. Inf. Process. Syst. 2020, 16, 6–29. [Google Scholar]
- Luong, M.; Pham, H.; Manning, C.D. Effective Approaches to Attention-based Neural Machine Translation. In Proceedings of the 2015 Conference on Empirical Methods in Natural Language Processing (EMNLP), Lisbon, Portugal, 17–21 September 2015; pp. 1412–1421. [Google Scholar]
- Vaswani, A.; Shazeer, N.; Parmar, N.; Uszkoreit, J.; Jones, L.; Gomez, A.N.; Kaiser, L.; Polosukhin, I. Attention is all you need. arXiv 2017, arXiv:1706.03762. [Google Scholar]
- Liu, G.; Guo, J. Bidirectional LSTM with attention mechanism and convolutional layer for text classification. Neurocomputing 2019, 337, 325–338. [Google Scholar] [CrossRef]
- Al Hanai, T.; Ghassemi, M.; Glass, J. Detecting Depression with Audio/Text Sequence Modeling of Interviews. In Proceedings of the Interspeech 2018, Hyderabad, India, 2–6 September 2018. [Google Scholar] [CrossRef] [Green Version]
- Wu, J.-L.; He, Y.; Yu, L.-C.; Lai, K.R. Identifying Emotion Labels From Psychiatric Social Texts Using a Bi-Directional LSTM-CNN Model. IEEE Access 2020, 8, 66638–66646. [Google Scholar] [CrossRef]
- Devlin, J.; Chang, M.W.; Lee, K.; Toutanova, K. Bert: Pre-training of deep bidirectional transformers for language understanding. arXiv 2018, arXiv:1810.04805. [Google Scholar]
- Oh, W. Comparison of environmental sound classification performance of convolutional neural networks according to audio preprocessing methods. J. Acoust. Soc. Korea 2020, 39, 143–149. [Google Scholar]
- Sainath, T.N.; Weiss, R.J.; Senior, A.; Wilson, K.W.; Vinyals, O. Learning the speech front-end with raw waveform CLDNNs. In Proceedings of the Interspeech, Dresden, Germany, 6–10 September 2015; pp. 1–5. [Google Scholar]
- Zhao, J.; Mao, X.; Chen, L. Speech emotion recognition using deep 1D & 2D CNN LSTM networks. Biomed. Signal Process. Control 2019, 47, 312–323. [Google Scholar] [CrossRef]
- Bubashait, M.; Hewahi, N. Urban Sound Classification Using DNN, CNN & LSTM a Comparative Approach. In Proceedings of the 2021 International Conference on Innovation and Intelligence for Informatics, Computing, and Technologies (3ICT), Zallaq, Bahrain, 29–30 September 2021; pp. 46–50. [Google Scholar]
- Cohn, J.F.; Kruez, T.S.; Matthews, I.; Yang, Y.; Nguyen, M.H.; Padilla, M.T.; Zhou, F.; De la Torre, F. Detecting depression from facial actions and vocal prosody. In Proceedings of the 2009 3rd International Conference on Affective Computing and Intelligent Interaction and Workshops, Amsterdam, The Netherlands, 10–12 September 2009; pp. 1–7. [Google Scholar] [CrossRef]
- McIntyre, G.; Göcke, R.; Hyett, M.; Green, M.; Breakspear, M. An approach for automatically measuring facial activity in depressed subjects. In Proceedings of the 2009 3rd International Conference on Affective Computing and Intelligent Interaction and Workshops, Amsterdam, The Netherlands, 10–12 September 2009; pp. 1–8. [Google Scholar] [CrossRef]
- Wang, Q.; Yang, H.; Yu, Y. Facial expression video analysis for depression detection in Chinese patients. J. Vis. Commun. Image Represent. 2018, 57, 228–233. [Google Scholar] [CrossRef]
- Chen, Q.; Chaturvedi, I.; Ji, S.; Cambria, E. Sequential fusion of facial appearance and dynamics for depression recognition. Pattern Recognit. Lett. 2021, 150, 115–121. [Google Scholar] [CrossRef]
- Kim, J.; Park, J.; Shin, M.; Lee, J.; Moon, N. The Method for Generating Recommended Candidates through Prediction of Multi-Criteria Ratings Using CNN-BiLSTM. J. Inf. Process. Syst. 2021, 17, 707–720. [Google Scholar]
- Liu, M.; Tang, J. Audio and Video Bimodal Emotion Recognition in Social Networks Based on Improved AlexNet Network and Attention Mechanism. J. Inf. Process. Syst. 2021, 17, 754–771. [Google Scholar]
- Jung, G.; Kim, I. Multimodal Context Embedding for Scene Graph Generation. J. Inf. Process. Syst. 2020, 16, 1250–1260. [Google Scholar]
- Zhang, K.; Li, Y.; Wang, J.; Cambria, E.; Li, X. Real-Time Video Emotion Recognition Based on Reinforcement Learning and Domain Knowledge. IEEE Trans. Circuits Syst. Video Technol. 2021, 32, 1034–1047. [Google Scholar] [CrossRef]
- Ji, S.; Li, X.; Huang, Z.; Cambria, E. Suicidal ideation and mental disorder detection with attentive relation networks. Neural Comput. Appl. 2021, 1–11. [Google Scholar] [CrossRef]
- Gratch, J.; Artstein, R.; Lucas, G.; Stratou, G.; Scherer, S.; Nazarian, A.; Wood, R.; Boberg, J.; DeVault, D.; Marsella, S.; et al. The distress analysis interview corpus of human and computer interviews. In Proceedings of the Ninth International Conference on Language Resources and Evaluation, LREC’14, Reykjavik, Iceland, 26–31 May 2014; pp. 3123–3128. [Google Scholar]
| Publisher’s Note: MDPI stays neutral with regard to jurisdictional claims in published maps and institutional affiliations. |
© 2022 by the authors. Licensee MDPI, Basel, Switzerland. This article is an open access article distributed under the terms and conditions of the Creative Commons Attribution (CC BY) license (https://creativecommons.org/licenses/by/4.0/).


