Article

Consequences of Sustainable Agricultural Productivity, Renewable Energy, and Environmental Decay: Recent Evidence from ASEAN Countries

by
Jianwen Zhang
1,*,
Jacob Cherian
2,
Ashak Mahmud Parvez
3,4,
Sarminah Samad
5,
Muhammad Safdar Sial
6,
Mohammad Athar Ali
7 and
Mohammed Arshad Khan
8
1
Department of Marketing, School of Economics and Management, Wuhan University, Wuhan 430072, China
2
College of Business, Abu Dhabi University, Abu Dhabi P.O. Box 59911, United Arab Emirates
3
LRGP, ENSIC, French National Center for Scientific Research (CNRS), 1 rue Grandville, F-54001 Nancy, France
4
Helmholtz-Institut Freiberg für Ressourcentechnologie (HIF), Helmholtz-Zentrum Dresden-Rossendorf e.V. (HZDR), Chemnitzer Str. 40, 09599 Freiberg, Germany
5
Department of Business Administration, College of Business and Administration, Princess Nourah Bint Abdulrahman University, Riyadh 11671, Saudi Arabia
6
Department of Management Sciences, COMSATS University Islamabad (CUI), Islamabad 44000, Pakistan
7
Department of Finance, College of Administrative and Financial Sciences, Saudi Electronic University, Riyadh 11673, Saudi Arabia
8
Department of Accountancy, College of Administrative and Financial Sciences, Saudi Electronic University, Riyadh 11673, Saudi Arabia
*
Author to whom correspondence should be addressed.
Sustainability 2022, 14(6), 3556; https://doi.org/10.3390/su14063556
Submission received: 20 February 2022 / Revised: 7 March 2022 / Accepted: 15 March 2022 / Published: 17 March 2022
(This article belongs to the Special Issue Sustainable and CO2 Low-Carbon Waste Treatment)

Abstract

:
Agriculture is critical for meeting the needs of the world’s population, in terms of food production. As a result, it has become a significant contributor to economic growth. According to various studies, agricultural production is one of the most widely recognized sources of greenhouse gas (GHG) emissions globally. This study explores the causal link between aggregate energy consumption resources, trade liberalization, CO2 emissions, and modern agriculture in selected ASEAN nations from 2000 to 2020, through the use of panel FMOLS data from the United Nations Development Program (fully modified ordinary least square). According to scientific research, the value addition of agricultural commodities helps to reduce CO2 emissions in polluted countries such as the United States. In addition, it was revealed that the quantity of CO2 released per unit of energy spent was positively associated with the amount of energy consumed. The reduction of CO2 emissions is possible in nations where environmental pollution is reducing due to trade liberalization. Although fossil fuels have increased CO2 emissions, research has shown that adopting renewable energy can help mitigate environmental damage. Revenues and productivity in agriculture are increased due to climate-smart agricultural-favored institutions, while greenhouse gas emissions are reduced. As an example of renewable energy, new energy resources may contribute to the preservation of a clean and healthy environment. The use of renewable energy in agriculture reduces the dependency on fossil fuels, which is beneficial for farmers. Trade policy, on the other hand, may stimulate the movement of money and technology, in order to specialize in economies of scale and manufacturing. It is imperative that ASEAN countries examine policies that will improve living standards, while also protecting the environment. This includes measures that will stimulate agricultural sector production and create active marketplaces for international trade

1. Introduction

1.1. Brief History of ASEAN

The Association of Southeast Asian Nations (ASEAN) was founded by Indonesia, Malaysia, Singapore, and Thailand on 1 July 1967, to promote economic progress, social betterment, and cultural development. Brunei was the first country to join in 1984, followed by Vietnam in 1995, then Laos and Myanmar in 1997. The ASEAN region covers an area of 1.7 million square miles and has a population of more than 600 million people (4.5 million km2). The Association of Southeast Asia (ASA), which was subsequently supplanted by the Association of Southeast Asian Nations (ASEAN), was established in 1961 by the Philippines, Thailand, and the Federation of Malaya (now a part of Malaysia). Among ASEAN’s most important initiatives are programs for collaborative research and technological collaboration among member governments, all of which fall under the banner of cooperative peace and shared prosperity. ASEAN’s most important initiatives are focused on economic cooperation, the development of commerce between ASEAN nations and the rest of the world, and programs for collaborative research and technological collaboration among member governments. Some have criticized the increased regional integration, raising concerns that it could eventually supplant international institutions and isolate governments outside the region. As a result of the Asian financial crisis of 1997–1998, it is recommended that liquidity be sourced from sources elsewhere than the region itself. Despite this, the Chiang Mai Agreement has inspired interest in increasing future collaboration, such as through the establishment of a genuinely multilateral organization for bilateral swap agreements and the introduction of an Asian currency.

1.2. Adverse Impact of Modernizing Agriculture, Trade, and Energy Consumption on the Environment

According to various studies, an over-reliance on fossil fuels has been demonstrated to have severe consequences for both the environment and agriculture. Agriculture has benefited from a range of renewable energy technologies, including wind and geothermal. Hydroelectricity, solar, and biomass have also been demonstrated to be beneficial [1]. Social, economic, environmental, and agricultural issues have had a significant impact on how we utilize energy. Ensuring zero-emission guarantees makes it feasible to safeguard vulnerable and weak communities from the possibility of crop failure, water shortages, and food insecurity (Bühler, Schuetze [2]), as well as from the threat of disease and famine. As a result, the influence of CO2 (carbon dioxide) emissions on trade, aggregate and disaggregated energy consumption, and agriculture was investigated in this investigation.
Energy availability is the most critical driver of agricultural productivity in any given year. Nonetheless, inadequate soil conservation and productivity beset ASEAN countries, which are also confronted with a scarcity of readily available energy [3]. Apart from population increase and growing food consumption, there is another significant issue to contend with. Energy scarcity is a major impediment to the achievement of food security and the development of sustainable agriculture [4]; as well as a sustainable agricultural system that does not harm the health and well-being of future generations [5]. Indonesian farmers are increasingly reliant on fossil fuels to power their operations, due to a lack of available electricity. It is proposed, therefore, that energy sources that are clean, renewable, and sustainable may be utilized to counteract climate change and environmental damage, and ease energy scarcity [6].
Agro-processing and agricultural production are significantly influenced by high-value-added commodities, such as energy. Animal, human, and mechanical energy are all used in agriculture to create crops, a renewable resource. Indirect and direct agricultural energy can be distinguished from one another [7,8]. Irrigation, land preparation, harvesting, transporting, and harvesting are tasks used for farm goods and agricultural inputs, to aid crop production. Energy generated from direct sources, on the other hand, includes the energy necessary to transport fertilizer, packaging, pesticides, agricultural machinery, seeds, and other production materials [9].
Agriculture residues such as grain dust, hazelnut shells, wheat straw, biogas and bioethanol, and modern biofuels, such as bioethanol are all sources of renewable energy in the agriculture sector; a second group defines solar energy use for greenhouse cooling, heating, and drying, product drying, farm field irrigation, and lighting; a third group defines geothermal energy use in barns, aquaculture, greenhouses, and empty fields in cold frames, as sources of renewable energy in the agriculture sector; while, a fourth group defines biomass energy use.
However, in agricultural economics, the role of trade, modernized agriculture, consumption of fossil fuel, and renewable energy has not been widely investigated [10]; other indicators are explained in Table 1.
The statistics in Table 1 make for interesting reading, as Singapore has the highest trade to GDP ratio, followed by Malaysia; while Indonesia has the highest CO2 footprint followed by Thailand and Malaysia, and Cambodia has the smallest carbon footprint, as far as ASEAN countries are concerned. At the same time, Cambodia has the highest value addition for agriculture amongst the ASEAN countries. A graphical presentation of the above table is provided in Figure 1, below:
Given that the present research focuses on the adverse impact of agricultural production on the environment, Figure 2 represents this trend in terms of CO2 emissions and agricultural value addition. The CO2 emission trend of ASEAN countries is provided on the primary axis, while the value addition, in terms of percentage of national GDP, is provided on the secondary axis.
Agricultural modernization, carbon dioxide emissions, total and disaggregated energy consumption, and trade openness are all evaluated in the current study; based on the environmental Kuznets curve and the comprehensive literature on energy growth [11,12]. This research utilizes some macroeconomic dynamics. Moreover, energy consumption has a practical impact on CO2 (carbon dioxide) emissions. Following current research, this study utilizes trade liberalization, which has a significant impact on the environment’s sustainability.
According to research, trade openness effects the environment in three distinct ways. These effects are termed scale effect, composition effect, and technique influence [13]. Prior research indicated that, with passage of time, technology tends to improve, thus, improving the efficiency of industrial processes, resulting in the lowering of overall carbon emissions. At the same time, rises in overall trade tends to increase economic and social activities such as transportation, industrial production, and agricultural activities and production, resulting in adverse impacts on the environment. In the same context, the composition effect relates the relaxation of environmental policies by the governments of developing countries, regarding emissions and general pollution. These governments relax the potential taxes on polluting industrial units, in the form of relaxing environmental regulations, to attract foreign investment in their countries. This tends to have a devastating impact on the environment [14].
The present study contributes to the existing studies by covering the causal and long-term relationship between commerce, agriculture, carbon emissions, and energy consumption on a panel of ASEAN nations. The present study is not identical to the earlier studies of Fontini and Pavan [14], as, when looking for long-term connections within the model, we applied the unit root test first, followed by the FMOLS cointegration approach, to locate the ones that were present. These econometric methodologies for unbiased statistical implications are important for policy design and implications.

2. Literature Review

Climate change has a significant influence on the weather on the planet. As carbon dioxide and other radioactive greenhouse gases in the atmosphere continue to grow, they may greatly influence the global climate, with potentially disastrous repercussions for the world’s ecosystems [15]. The amount of carbon dioxide emitted in Latin America has increased. It has been estimated that Argentina, Brazil, Mexico, and Venezuela account for around 90 percent of global carbon dioxide emissions, according to the Carbon Dioxide Information Analysis Center (CDIAC). Greenhouse gas emissions impact agricultural production cycles, which in turn have an impact on the climate in both direct and indirect ways, according to the United Nations. According to newly released IPCC research, climate change poses various dangers to the global agricultural output on numerous fronts (Intergovernmental Panel on Climate Change 2019). It is undeniable that climate change and global warming are influencing agricultural productivity. Increasing levels of atmospheric carbon dioxide, climate change, and precipitation have a detrimental influence on agricultural production and growth. It is not possible to account for the influence of a single factor on overall production, by trying to predict the environmental consequences of the interactions between carbon dioxide enrichment, temperature rise, precipitation, and soil nutrients. Climate change and agricultural yields are affected by atmospheric carbon dioxide (CO2) concentrations, which can have immediate and long-term consequences. Crops cultivated in the United States are critical for producing and distributing food in the United States and throughout the world. The United States is the world’s biggest supplier of grains, including rice, wheat, and corn, among other products. Rising CO2 levels and shifting weather patterns may influence agricultural production. The influence of a higher temperature on a crop is determined by that particular crop’s ideal growth and reproduction temperature. Some farmers may move to crops that do better in warmer climates, or crops that are more suited to certain regions may do well in those places. If the temperature becomes too high, the crop’s yield will reduce.
Growing numbers of emerging economies are adopting a green economy to solve the CO2 emissions challenge [16]. Numerous studies have demonstrated that renewable energy sources can help minimize carbon emissions (Sarkodie et al., 2020; Sharif et al., 2019). Some scientists have even claimed that green energy is the sole source of CO2 emissions (Nathaniel and Khan) [17]; however, others have said that this is not the case [18]. As a result of industrial expansion and technological improvement, urbanization is on the increase, leading to migration and globalization [19]. The demand for coal, steel, cement, timber, and iron has grown due to modernization and industrialization, increasing the amount of energy consumed. Many positive consequences of commercialization may be observed. For example, supporting financial growth, increasing demand for raw resources, speeding up labor movements from rural to urban regions, and fostering economic success are all beneficial [20].
Over the last few years, panel quantile, causality, and cointegration regressions on macroeconomic variables and carbon emissions have been increasingly prominent in academic research studies [21]. On the other hand, this type of investigation is uncommon and infrequent. This research makes a significant contribution to the current body of knowledge. On the other hand, ASEAN studies are severely underrepresented in the literature. Several studies have been conducted in the ASEAN region, notably in the nations of Southeast Asia [22]. Due to differences in sample data, estimation techniques, and model construction, different results might be drawn from this research, notwithstanding the lack of consent in these experiments. Currently, most investigations are centered on the EKC (environmental Kuznets curve) theory, while other studies are concerned with measuring environmental contamination. These studies used exogenous indicators such as income and energy consumption, but they did not consider bias. According to a literature review, the impact of CO2 emissions on agriculture is a hot-button subject that should be investigated more extensively by new lawmakers and specialists [23]. These studies are intended to guide the relationship between carbon emissions, trade, agriculture, and energy use.

Interdependent Relationships amongst Agricultural Value Addition, Energy Usage, Carbon Emissions, and Trade Development

It appears that various findings have been obtained in other research works based on the relationship between agriculture’s carbon dioxide emissions and these investigations. The relationship between carbon emissions and agriculture is being called into doubt in this research [24]. Agriculture and the services it offer, according to the research, have a direct influence on CO2 emissions through their production and distribution. Agricultural operations such as pre-harvest, harvest, and post-harvest activities and waste management influence greenhouse gas emissions. The economies of OECD member nations, including agriculture and CO2 emissions, have established a two-way causal link between the two variables [25]. A study conducted in Turkey (Dogan and Turkekul) [26] and an investigation into the link between CO2 production and agriculture in eastern Canada were the only two studies examining the relationship between CO2 production and agriculture [27]. In neither research work, was it established that agriculture and CO2 emissions were associated? Meanwhile [28] attest to the presence of this relationship in the case of the USA.
Farhani and Shahbaz [29] conducted a study to better understand Tunisia’s trade liberalization and emissions. According to the findings of this study, there is a relationship between carbon emissions and trade liberalization. According to certain studies (Michieka, Fletcher) [30,31], there is a causal relationship between CO2 emissions and the openness of international commerce. These investigations used a variety of geographic locations and points of view. The conclusions demonstrated that active trade policies can contribute to economic growth, as evidenced by the findings that the level of emissions and the openness of trade are directly related to one another [32]. In addition, some additional research revealed a two-way relationship between the associated factors in Vietnam, the BRICS nations, and emerging markets [33]. In addition to Aziz [33] and Aziz et al. (2013) and Fudholi, Zohri [34] have published research on this topic. These research studies, on the other hand, discovered no relationship between CO2 emissions and trade openness [35].
The relationship between carbon dioxide emissions and energy consumption has been extensively researched. The Granger causality hypothesis [29] and other studies indicated that CO2 emissions and energy consumption are linked in a unidirectional manner (see Figure 1) [36]. As a result, carbon dioxide (CO2) release affects the activities that involve energy consumption [37]. A further investigation was conducted by Sarkodie and Adom [38] on the causal relationship between energy use and pollutant discharges. The study’s findings revealed that efficient energy has no negative impact on CO2 emissions, but that economic growth is reduced due to efficient energy use. Al-Mulali and Sab [39] investigated the same factors and discovered that they had a one-way causal relationship with energy and CO2 emissions. It has been demonstrated that increasing renewable energy production can help to reduce carbon emissions [40]. However, an investigation into the United Arab Emirates used the bound testing technique of the ARDL (autoregressive distributed lag) regression model to examine the relationship between CO2 generation and energy consumption and discovered that the two variables are not related [41].
The main hypothesis for the present research is as follows:
Hypothesis 1 (H1).
Is there any underlying causal relationships between the trade openness, value agricultural value addition, energy consumption, and CO2 emissions in the case of ASEAN countries in the long term?

3. Research Methodology

3.1. Data and Sample

A description of variables is given in Table 2; this study used a time series of data for nine ASEAN nations, from 2000 to 2020. The emerging nations in the region are developing through industrialization, and a rapid growth and modernization of agriculture, economic development, efficient trade, and residential energy use moving to renewable electricity are some actions. All of the data were extracted from the world development indicators.

3.2. Econometric Model

As per prior research, energy usage, trade openness, agricultural value added, and carbon emissions all have positive relationships amongst them. This has been proven by prior research, based on several dynamics in data, such as kurtosis and normal distribution, cross-sectional dependency, and form of cointegration. Based upon this notion, the following equation can be derived:
CO 2 = f   ( ValAGR ,   UseEne ,   Trade )
Equation (1) basically represents the carbon dioxide emissions as a function of value addition in agricultural production, usage of energy, and openness of trade. At the same time the consumption of renewable energy, trade openness, agriculture value-added, and emissions of CO2 of the suggested model can be stated as:
CO 2 = f   ( ValAGR ,   RenEne ,   FFC ,   Trade )
The functional relationship amongst the abovementioned variables is based on the practicality of these variables as an increase in trade openness and agricultural value increases the use of transportation and production, leading to an increase in usage of fossil fuels, leading to an increase in CO2 emissions, which, in turn, results in raising environmental concerns and results in the adoption of renewable energy sources as held by Westerlund (2008). Westerlund (2008) initially established this relationship by formulation of cointegration panel models between the affiliations between the conditional distribution, the PARDL (panel auto-regressive distribution lag), and the FMOLS (fully modified ordinary least squares technique). Based upon Equation (2), short-term investigations may be stated as:
CO 2 it = δ o + δ 1 ValAGR it + δ 2 RenEne it + δ 3 FFC it + δ 4 UseEne it + δ 5 Trade it + ϵ it
In this equation, the value-addition of the agricultural production, energy consumption, usage of fossil fuel-based energy, consumption of renewable energy, and trade liberalization are all exogenous variables. Coefficients, δ 1   to   δ 5 , illustrate how the independent variables in ASEAN nations affect the dependent variable, and ϵ i t , the error term. The equation’s error component demonstrates how this white noise affects the equation. The time trend is represented by ‘t’ of data in the I cross-section. The model is estimated using FMOLS (full modified ordinary least square) for both short- and long-term estimations, and the panel FMOLS model looks like this, following an examination of the panel’s unit root and cointegration.
CO 2 i t = ϑ o + ϑ 1 CO 2 i , t 1 + ϑ 3 V a l A G R i , t 1 + ϑ 4 Δ R e n E n e i t + ϑ 5 F F C i , t 1 + ϑ 6 U s e E n e i , t 1 + ϑ 7 T r a d e i , t 1 + ϵ i t

4. Results and Discussion

4.1. Descriptive Statistics

The unit of measurement for carbon dioxide is Kilotons of CO2 emissions (Kt), which has a mean value of 5.732. An uncertainty range of between 25.760 kt and 0.183 kt may be expected; the standard deviation is 5 kt. The mean figures for agriculture value-added, renewable energy consumption, and fossil fuel consumption are 16.871, 70.345, 33.088, and 133.600, respectively, according to the World Bank. Trade is defined as the sum of imports and exports as a percentage of GDP. The standard deviations of these four groups are 12.118, 23.331, 28.450, and 98.550, respectively. Please refer Table 3 for descriptive statistics.

4.2. Unit Root Test

Table 4 illustrates the results of a set of unit root tests that we performed initially, which are shown in the following paragraphs. In order to do this, we took advantage of economic aspects that have the potential for a random trend, and, therefore, instability. The first-generation unit root test was used to determine whether or not the variables were stationary in nature. The application of the four tests determines the unit root of the data (PP Fisher, ADF Fisher, and PP Fisher) [42,43].
As a result of several unit root tests, it was discovered that numerous indicators were stationary at the level of certain tests, which is an encouraging development. Chu proved that CO2, FFc, and Trade are stationary at this level, and he added that they are stationary at the first difference. Consequently, it was concluded that their integration had been unevenly dispersed throughout the countries. We employed FMOLS and panel-ARDL models to estimate the model as a result of these findings.

4.3. Panel Cointegration and FMOL Results

Using FMOLS in Pedroni [44], we may further estimate the model using the alternative hypothesis and reject the null hypothesis, as shown in Table 5. This proves that cointegration exists in the model, which is confirmed by [44]. Farming’s coefficient of value-added is statistically significant at 5 percent, and it is positively associated in the FMOLS model that was computed. Agriculture with a high level of added value increases carbon dioxide emissions by 0.18 percent for every one percentage point rise in its share of the total. When the energy used increases by one percent, carbon dioxide emissions rise by 7.303 percent kilotons, resulting in a total increase of 8.033 percent kilotons. This is true for every one percent increase in the amount of fossil fuel energy consumed; a 0.480 percent increase in the volume of fossil fuel energy consumed, and a 0.480 percent increase in the volume of renewable energy consumed.
According to the International Energy Agency, in a study that compares the outcomes of FMOLS methods with those of earlier research, carbon emissions per capita increased by 0.188 percent for every one percent growth in value-added agriculture. The results indicate that every one percent increase in nonrenewable energy consumption per capita in the ASEAN countries results in an increase in CO2 (carbon dioxide) emissions of 0.480 percent. For every one percent increase in the amount of agricultural machinery used, carbon dioxide emissions rise by 0.09 percent [1]. An analysis by Asumadu-Sarkodie and Owusu [1] found that a rise in total energy output would be associated with an increase in CO2 emissions of 307.9 kt over time. According to a study conducted in Nigeria [1], carbon emissions rise by 3 percent for every 1 percent increase in the usage of nonrenewable energy.

4.4. Discussion of Results

Energy consumption is responsible for the rise in carbon dioxide emissions, but the overall level of emissions can be lowered by using energy obtained from renewable sources. The reduction in CO2 emissions has been ascribed to an increase in the utilization of renewable energy sources. As a result, renewable energy has a particularly favorable influence on CO2 emissions. These findings are related to previous studies [45,46]; a relationship between CO2 emissions and renewable energy consumption was identified [35,47].
Regarding CO2 emissions from ASEAN countries, non-renewable and renewable energy has a good outlook; renewable energy’s function in helping to enhance the environment is also stated in this way. Using more renewable energy decreases carbon dioxide emissions, since existing technologies mean that renewable energy reduces carbon production. The results from this study are consistent with those of Al-Mulali [46] and López-Menéndez [48].
When it comes to nonrenewable energy consumption, NREC is a large polluter. NREC is connected with CO2 emissions, implying that a 1 percent increase in NREC lowers CO2 emissions by 0.470 percent. An examination of energy consumption in ASEAN nations demonstrates that renewable resources lower carbon dioxide emissions, whereas the use of non-renewable resources increases pollution.
The so-called lobbying effect was crucial in ASEAN’s reluctance to adopt renewable power technology for overall energy usage. Sovacool [49] also observed that the lobbying power of old-style energy sources restricted renewable energy components, which validates the findings of [49,50]. Furthermore, according to Pfeiffer and Mulder [50], the growing output of fossil fuels may interfere with the expansion of renewable energy sources. According to these research findings, the fossil fuel business has a strong motive to postpone the implementation of renewable energy alternatives. This is understandable, given that the country is one of the world’s greatest producers of fossil fuels and this a key source of government revenue. Efforts to promote renewable energy technology are being met with resistance by individuals in the fossil fuel industry, who are attempting to undermine them.
According to the available literature, this study discovered that ASEAN’s carbon emissions have reduced as a result of greater trade liberalization and liberalization of commerce. As a result, a rise in trade openness has the potential to reduce long-term CO2 emissions by 0.01 percentage point on average. Initially, it is said that trade impacts the environment in three ways: Due to technological developments and changes in the composition of the population, it has been demonstrated that trade openings have a net beneficial influence on the environment. This is due to outweighing the negative impact of stairwells. There are a variety of reasons why this makes sense, particularly in light of recent technical developments by developed nations and the benefits of technology exchange that the ASEAN group intends to reap as a result of their cooperation. If we place a greater focus on the impacts of synthesis, we can learn a great deal about them.
For example, ASEAN-based companies that consume a great deal of energy and emit a great deal of pollution are more prone than other companies to migrate to countries with less stringent environmental regulations. In this particular instance, the premise that, in general, pollution is beneficial holds true. Owing to this situation, it appears that developed economies are aware that environmental pollution may result in the movement of businesses with high emissions, to relocate their production units to countries where the environmental regulations are not that stringent, such as ASEAN countries as stated by Cole [51].

5. Conclusions and Policy Recommendations

From 2000 to 2020, researchers studied the link between ASEAN states’ energy usage (fossil fuel and renewable), openness to trade, agriculture, and environmental deterioration. The impact of agricultural value addition on CO2 emissions is being studied using the FMOLS econometrics approach, whereas trade liberalization and rising energy use are the result of increasing environmental harm. An empirical study found that agricultural added value reduces carbon dioxide emissions by a higher margin in ASEAN economies. As a result of this, carbon dioxide emissions are on the rise throughout the ASEAN region. Conversely, the ease of doing business minimizes the amount of carbon dioxide emitted into the atmosphere and the amount of environmental harm caused. Renewable energy use in ASEAN countries has been found to lower air pollution, whilst fossil fuel consumption has increased. However, non-renewable energy is the dominant energy source in ASEAN nations, which helps to keep emissions low, despite the region’s rapid economic expansion, and contributes to the overall energy output in ASEAN. Additionally, it incorporates the most recent energy-saving technology, to help keep emissions of carbon dioxide and other pollutants low and the environment pristine. The ASEAN nations’ agricultural sector must focus on sustainable agriculture production and sensible climate improvement, rather than concerning policy advice. If implemented, this technique can assist in increasing revenue and output, adapt to climate change compassionately, and reduce greenhouse gas emissions. Agricultural stakeholders may benefit from this method, by reducing emissions and increasing production. Economic growth is subsidized significantly by trade openness; well-organized provincial trade policies may reduce carbon emissions in countries, by lowering environmental degradation via better planning. Considering this knowledge, assisting the ASEAN countries in establishing policies that can increase agricultural output and build a well-organized marketplace for global trade is recommended. Technology-driven specialization movements and investment opportunities for economies of scale and manufacturing are possible outcomes of these strategies.
On the other hand, ASEAN countries have a lower impact on the environment than more developed countries. Climate change necessitates an increase in the financial help available to those in need. Improvements in disaster management organizations and infrastructure will benefit the ASEAN nation’s agriculture sectors, and special consideration must be given to implementing advanced energy technologies, such as renewable energy, the reduction in agricultural dependency on fossil fuel, and agricultural decisions that contribute to the increasing levels of atmospheric carbon emissions.
In the future, researchers can adopt other methodologies to explore the above-mentioned relationships amongst the stated variables. At the same time, the sample size can be expanded with the addition of other countries, such as Laos, subject to the availability of data. Another future direction could be that researchers might want to explore the different dynamics leading to the existence or absence of causal relationships in many ASEAN countries, as, with the passage of time, the social, economic, and cultural dynamics tend to change, such as incorporation of stringent environmental regulations by governments, the awareness amongst the public of these countries, and the increase in use of renewable energy, due to the ever increasing cost of fossil fuels.

Author Contributions

J.Z., J.C., A.M.P., S.S., M.S.S., M.A.A. and M.A.K. contributed to conceptualization, formal analysis, investigation, methodology, and writing and editing of the original draft. All authors have read and agreed to the published version of the manuscript.

Funding

There was no external funding.

Institutional Review Board Statement

Not applicable.

Informed Consent Statement

Not applicable.

Data Availability Statement

The data will be made available on request.

Conflicts of Interest

The authors declare no conflict of interest.

References

  1. Asumadu-Sarkodie, S.; Owusu, P.A. Forecasting Nigeria’s energy use by 2030, an econometric approach. Energy Sources Part B Econ. Plan. Policy 2016, 11, 990–997. [Google Scholar] [CrossRef]
  2. Bühler, D.; Schuetze, T.; Junge, R. Towards development of a label for zero emission buildings: A tool to evaluate potential zero emission buildings. Sustainability 2015, 7, 5071–5093. [Google Scholar] [CrossRef] [Green Version]
  3. Ortas, I.; Lal, R. Food security and climate change in West Asia. In Climate Change and Food Security in West Asia and North Africa; Springer: Berlin/Heidelberg, Germany, 2013; pp. 207–236. [Google Scholar]
  4. FAO. The Water-Energy-Food Nexus: A New Approach in Support of Food Security and Sustainable Agriculture; Food and Agriculture Organization (FAO) of the United Nation: Rome, Italy, 2014. [Google Scholar]
  5. Farooq, M.; Wahid, A.; Kobayashi, N.; Fujita, D.; Basra, S. Plant drought stress: Effects, mechanisms and management. In Sustainable Agriculture; Springer: Berlin/Heidelberg, Germany, 2009; pp. 153–188. [Google Scholar]
  6. Khan, I.; Han, L.; Khan, H.; Kim Oanh, L.T. Analyzing renewable and nonrenewable energy sources for environmental quality: Dynamic investigation in developing countries. Math. Probl. Eng. 2021, 2021, 3399049. [Google Scholar] [CrossRef]
  7. Parvez, A.M.; Lewis, J.D.; Afzal, M.T. Potential of industrial hemp (Cannabis sativa L.) for bioenergy production in Canada: Status, challenges and outlook. Renew. Sustain. Energy Rev. 2021, 141, 110784. [Google Scholar] [CrossRef]
  8. Parvez, A.M.; Hafner, S.; Hornberger, M.; Schmid, M.; Scheffknecht, G. Sorption enhanced gasification (SEG) of biomass for tailored syngas production with in-situ CO2 capture: Current status, process scale-up experiences and outlook. Renew. Sustain. Energy Rev. 2021, 141, 110756. [Google Scholar] [CrossRef]
  9. Yu, Y.; Zhu, W.; Tian, Y. Green supply chain management, environmental degradation, and energy: Evidence from Asian countries. Discret. Dyn. Nat. Soc. 2021, 2021, 5179964. [Google Scholar] [CrossRef]
  10. Bayrakcı, A.G.; Koçar, G. Utilization of renewable energies in Turkey’s agriculture. Renew. Sustain. Energy Rev. 2012, 16, 618–633. [Google Scholar] [CrossRef]
  11. Esty, D.C.; Winston, A. Green to Gold: How Smart Companies Use Environmental Strategy to Innovate, Create Value, and Build Competitive Advantage; John Wiley & Sons: Hoboken, NJ, USA, 2009. [Google Scholar]
  12. Bakhtyar, B.; Kacemi, T.; Nawaz, M.A. A review on carbon emissions in Malaysian cement industry. Int. J. Energy Econ. Policy 2017, 7, 282–286. [Google Scholar]
  13. Ling, C.H.; Ahmed, K.; Binti Muhamad, R.; Shahbaz, M. Decomposing the trade-environment nexus for Malaysia: What do the technique, scale, composition, and comparative advantage effect indicate? Environ. Sci. Pollut. Res. 2015, 22, 20131–20142. [Google Scholar] [CrossRef] [Green Version]
  14. Fontini, F.; Pavan, G. The European Union Emission Trading System and technological change: The case of the Italian pulp and paper industry. Energy Policy 2014, 68, 603–607. [Google Scholar] [CrossRef]
  15. Solomon, N.; Ozoemena, N.; Sharma, G.; Shah, M. Renewable energy, urbanization, and ecological footprint linkage in CIVETS. Environ. Sci. Pollut. Res. Int. 2020, 27, 19616–19629. [Google Scholar]
  16. Amri, F.; Arouri, M.; Bélaïd, F. Economic Growth and Environmental Degradation. J. Energy Dev. 2019, 45, 159–174. [Google Scholar]
  17. Nathaniel, S.; Khan, S.A.R. The nexus between urbanization, renewable energy, trade, and ecological footprint in ASEAN countries. J. Clean. Prod. 2020, 272, 122709. [Google Scholar] [CrossRef]
  18. Strubell, E.; Ganesh, A.; McCallum, A. Energy and policy considerations for deep learning in NLP. arXiv 2019, arXiv:1906.02243. [Google Scholar]
  19. Ahmadian, M.; Suh, J.M.; Hah, N.; Liddle, C.; Atkins, A.R.; Downes, M.; Evans, R.M. PPARγ signaling and metabolism: The good, the bad and the future. Nat. Med. 2013, 19, 557–566. [Google Scholar] [CrossRef] [PubMed] [Green Version]
  20. Anwar, A.; Sinha, A.; Sharif, A.; Siddique, M.; Irshad, S.; Anwar, W.; Malik, S. The nexus between urbanization, renewable energy consumption, financial development, and CO2 emissions: Evidence from selected Asian countries. Environ. Dev. Sustain. 2021, 10, 1–21. [Google Scholar] [CrossRef]
  21. Zhang, S.; Andrews-Speed, P.; Zhao, X.; He, Y. Interactions between renewable energy policy and renewable energy industrial policy: A critical analysis of China’s policy approach to renewable energies. Energy Policy 2013, 62, 342–353. [Google Scholar] [CrossRef]
  22. Charfeddine, L.; Kahia, M. Impact of renewable energy consumption and financial development on CO2 emissions and economic growth in the MENA region: A panel vector autoregressive (PVAR) analysis. Renew. Energy 2019, 139, 198–213. [Google Scholar] [CrossRef]
  23. Tubiello, F.N.; Salvatore, M.; Ferrara, A.F.; House, J.; Federici, S.; Rossi, S.; Biancalani, R.; Condor Golec, R.D.; Jacobs, H.; Flammini, A. The contribution of agriculture, forestry and other land use activities to global warming, 1990–2012. Glob. Chang. Biol. 2015, 21, 2655–2660. [Google Scholar] [CrossRef] [Green Version]
  24. Santiago-De La Rosa, N.; González-Cardoso, G.; Figueroa-Lara, J.d.J.; Gutiérrez-Arzaluz, M.; Octaviano-Villasana, C.; Ramírez-Hernández, I.F.; Mugica-Álvarez, V. Emission factors of atmospheric and climatic pollutants from crop residues burning. J. Air Waste Manag. Assoc. 2018, 68, 849–865. [Google Scholar] [CrossRef] [Green Version]
  25. Najafi Alamdarlo, H. Water consumption, agriculture value added and carbon dioxide emission in Iran, environmental Kuznets curve hypothesis. Int. J. Environ. Sci. Technol. 2016, 13, 2079–2090. [Google Scholar] [CrossRef]
  26. Dogan, E.; Turkekul, B. CO2 emissions, real output, energy consumption, trade, urbanization and financial development: Testing the EKC hypothesis for the USA. Environ. Sci. Pollut. Res. 2016, 23, 1203–1213. [Google Scholar] [CrossRef] [PubMed]
  27. Schelly, C.; Bessette, D.; Brosemer, K.; Gagnon, V.; Arola, K.L.; Fiss, A.; Pearce, J.M.; Halvorsen, K.E. Energy policy for energy sovereignty: Can policy tools enhance energy sovereignty? Sol. Energy 2020, 205, 109–112. [Google Scholar] [CrossRef]
  28. Soytas, U.; Sari, R.; Ewing, B.T. Energy consumption, income, and carbon emissions in the United States. Ecol. Econ. 2007, 62, 482–489. [Google Scholar] [CrossRef]
  29. Farhani, S.; Shahbaz, M. What role of renewable and non-renewable electricity consumption and output is needed to initially mitigate CO2 emissions in MENA region? Renew. Sustain. Energy Rev. 2014, 40, 80–90. [Google Scholar] [CrossRef] [Green Version]
  30. Michieka, N.M.; Fletcher, J.; Burnett, W. An empirical analysis of the role of China’s exports on CO2 emissions. Appl. Energy 2013, 104, 258–267. [Google Scholar] [CrossRef] [Green Version]
  31. Zhao, M.; Li, J.; Yang, Y. A framework of joint mobile energy replenishment and data gathering in wireless rechargeable sensor networks. IEEE Trans. Mob. Comput. 2014, 13, 2689–2705. [Google Scholar] [CrossRef]
  32. Shahbaz, M.; Mahalik, M.K.; Shahzad, S.J.H.; Hammoudeh, S. Does the environmental K uznets curve exist between globalization and energy consumption? G lobal evidence from the cross-correlation method. Int. J. Financ. Econ. 2019, 24, 540–557. [Google Scholar] [CrossRef] [Green Version]
  33. Aziz, A.A.; Mustapha, N.H.N.; Ismail, R. Factors affecting energy demand in developing countries: A dynamic panel analysis. Int. J. Energy Econ. Policy 2013, 3, 1–6. [Google Scholar]
  34. Fudholi, A.; Zohri, M.; Rukman, N.S.B.; Nazri, N.S.; Mustapha, M.; Yen, C.H.; Mohammad, M.; Sopian, K. Exergy and sustainability index of photovoltaic thermal (PVT) air collector: A theoretical and experimental study. Renew. Sustain. Energy Rev. 2019, 100, 44–51. [Google Scholar] [CrossRef]
  35. Farhani, S.; Shahbaz, M.; Sbia, R.; Chaibi, A. What does MENA region initially need: Grow output or mitigate CO2 emissions? Econ. Model. 2014, 38, 270–281. [Google Scholar] [CrossRef]
  36. Shahbaz, M.; Van Hoang, T.H.; Mahalik, M.K.; Roubaud, D. Energy consumption, financial development and economic growth in India: New evidence from a nonlinear and asymmetric analysis. Energy Econ. 2017, 63, 199–212. [Google Scholar] [CrossRef] [Green Version]
  37. Pao, H.-T.; Yu, H.-C.; Yang, Y.-H. Modeling the CO2 emissions, energy use, and economic growth in Russia. Energy 2011, 36, 5094–5100. [Google Scholar] [CrossRef]
  38. Sarkodie, S.A.; Adom, P.K. Determinants of energy consumption in Kenya: A NIPALS approach. Energy 2018, 159, 696–705. [Google Scholar] [CrossRef]
  39. Al-Mulali, U.; Sab, C.N.B.C. The impact of energy consumption and CO2 emission on the economic growth and financial development in the Sub Saharan African countries. Energy 2012, 39, 180–186. [Google Scholar] [CrossRef]
  40. Lean, H.H.; Smyth, R. CO2 emissions, electricity consumption and output in ASEAN. Appl. Energy 2010, 87, 1858–1864. [Google Scholar] [CrossRef]
  41. Sbia, R.; Shahbaz, M.; Hamdi, H. A contribution of foreign direct investment, clean energy, trade openness, carbon emissions and economic growth to energy demand in UAE. Econ. Model. 2014, 36, 191–197. [Google Scholar] [CrossRef] [Green Version]
  42. Im, K.S.; Lee, J.; Tieslau, M. Panel LM unit-root tests with level shifts. Oxf. Bull. Econ. Stat. 2005, 67, 393–419. [Google Scholar] [CrossRef]
  43. Levin, A.; Lin, C.-F.; Chu, C.-S.J. Unit root tests in panel data: Asymptotic and finite-sample properties. J. Econom. 2002, 108, 1–24. [Google Scholar] [CrossRef]
  44. Pedroni, P. Critical values for cointegration tests in heterogeneous panels with multiple regressors. Oxf. Bull. Econ. Stat. 1999, 61, 653–670. [Google Scholar] [CrossRef]
  45. Jebli, M.B.; Youssef, S.B.; Ozturk, I. Testing environmental Kuznets curve hypothesis: The role of renewable and non-renewable energy consumption and trade in OECD countries. Ecol. Indic. 2016, 60, 824–831. [Google Scholar] [CrossRef]
  46. Al-Mulali, U.; Saboori, B.; Ozturk, I. Investigating the environmental Kuznets curve hypothesis in Vietnam. Energy Policy 2015, 76, 123–131. [Google Scholar] [CrossRef]
  47. Nawaz, M.A.; Azam, A.; Bhatti, M.A. Natural Resources Depletion and Economic Growth: Evidence from ASEAN Countries. Pak. J. Econ. Stud. 2019, 2, 155–172. [Google Scholar]
  48. López-Menéndez, A.J.; Pérez, R.; Moreno, B. Environmental costs and renewable energy: Re-visiting the Environmental Kuznets Curve. J. Environ. Manag. 2014, 145, 368–373. [Google Scholar] [CrossRef] [PubMed]
  49. Sovacool, B.K. Contextualizing avian mortality: A preliminary appraisal of bird and bat fatalities from wind, fossil-fuel, and nuclear electricity. Energy Policy 2009, 37, 2241–2248. [Google Scholar] [CrossRef]
  50. Pfeiffer, B.; Mulder, P. Explaining the diffusion of renewable energy technology in developing countries. Energy Econ. 2013, 40, 285–296. [Google Scholar] [CrossRef] [Green Version]
  51. Cole, M.A. Trade, the pollution haven hypothesis and the environmental Kuznets curve: Examining the linkages. Ecol. Econ. 2004, 48, 71–81. [Google Scholar] [CrossRef]
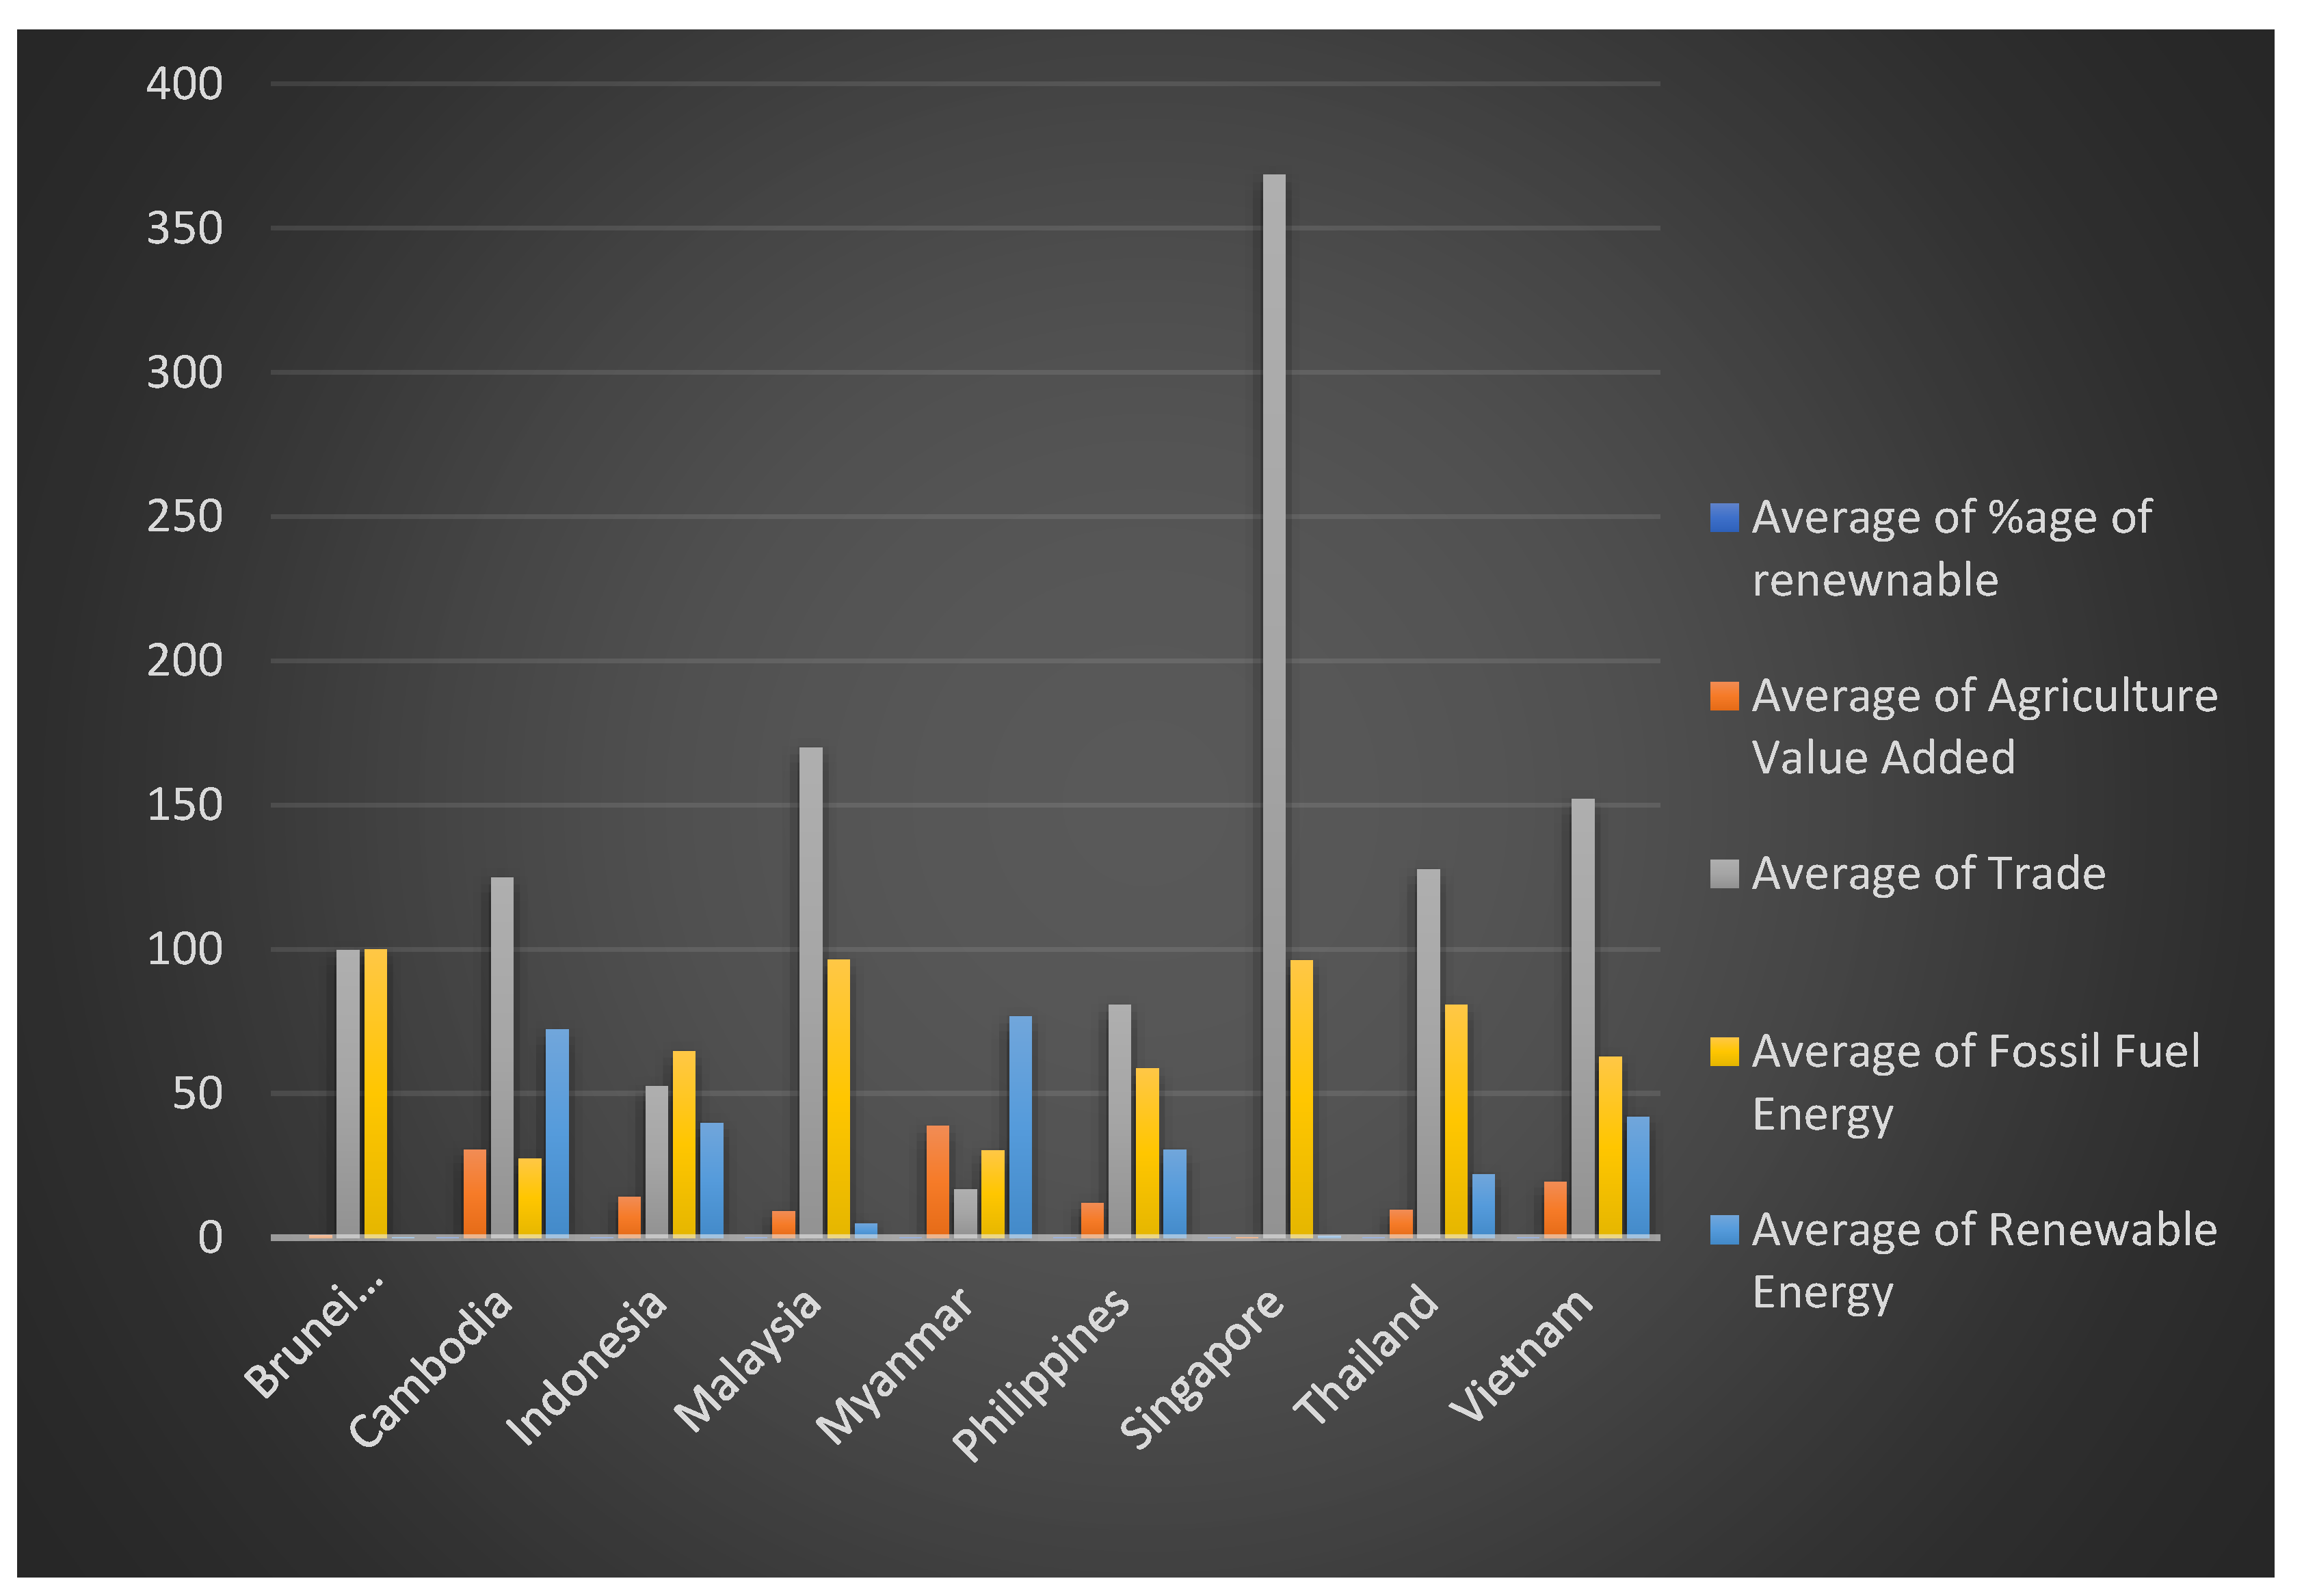
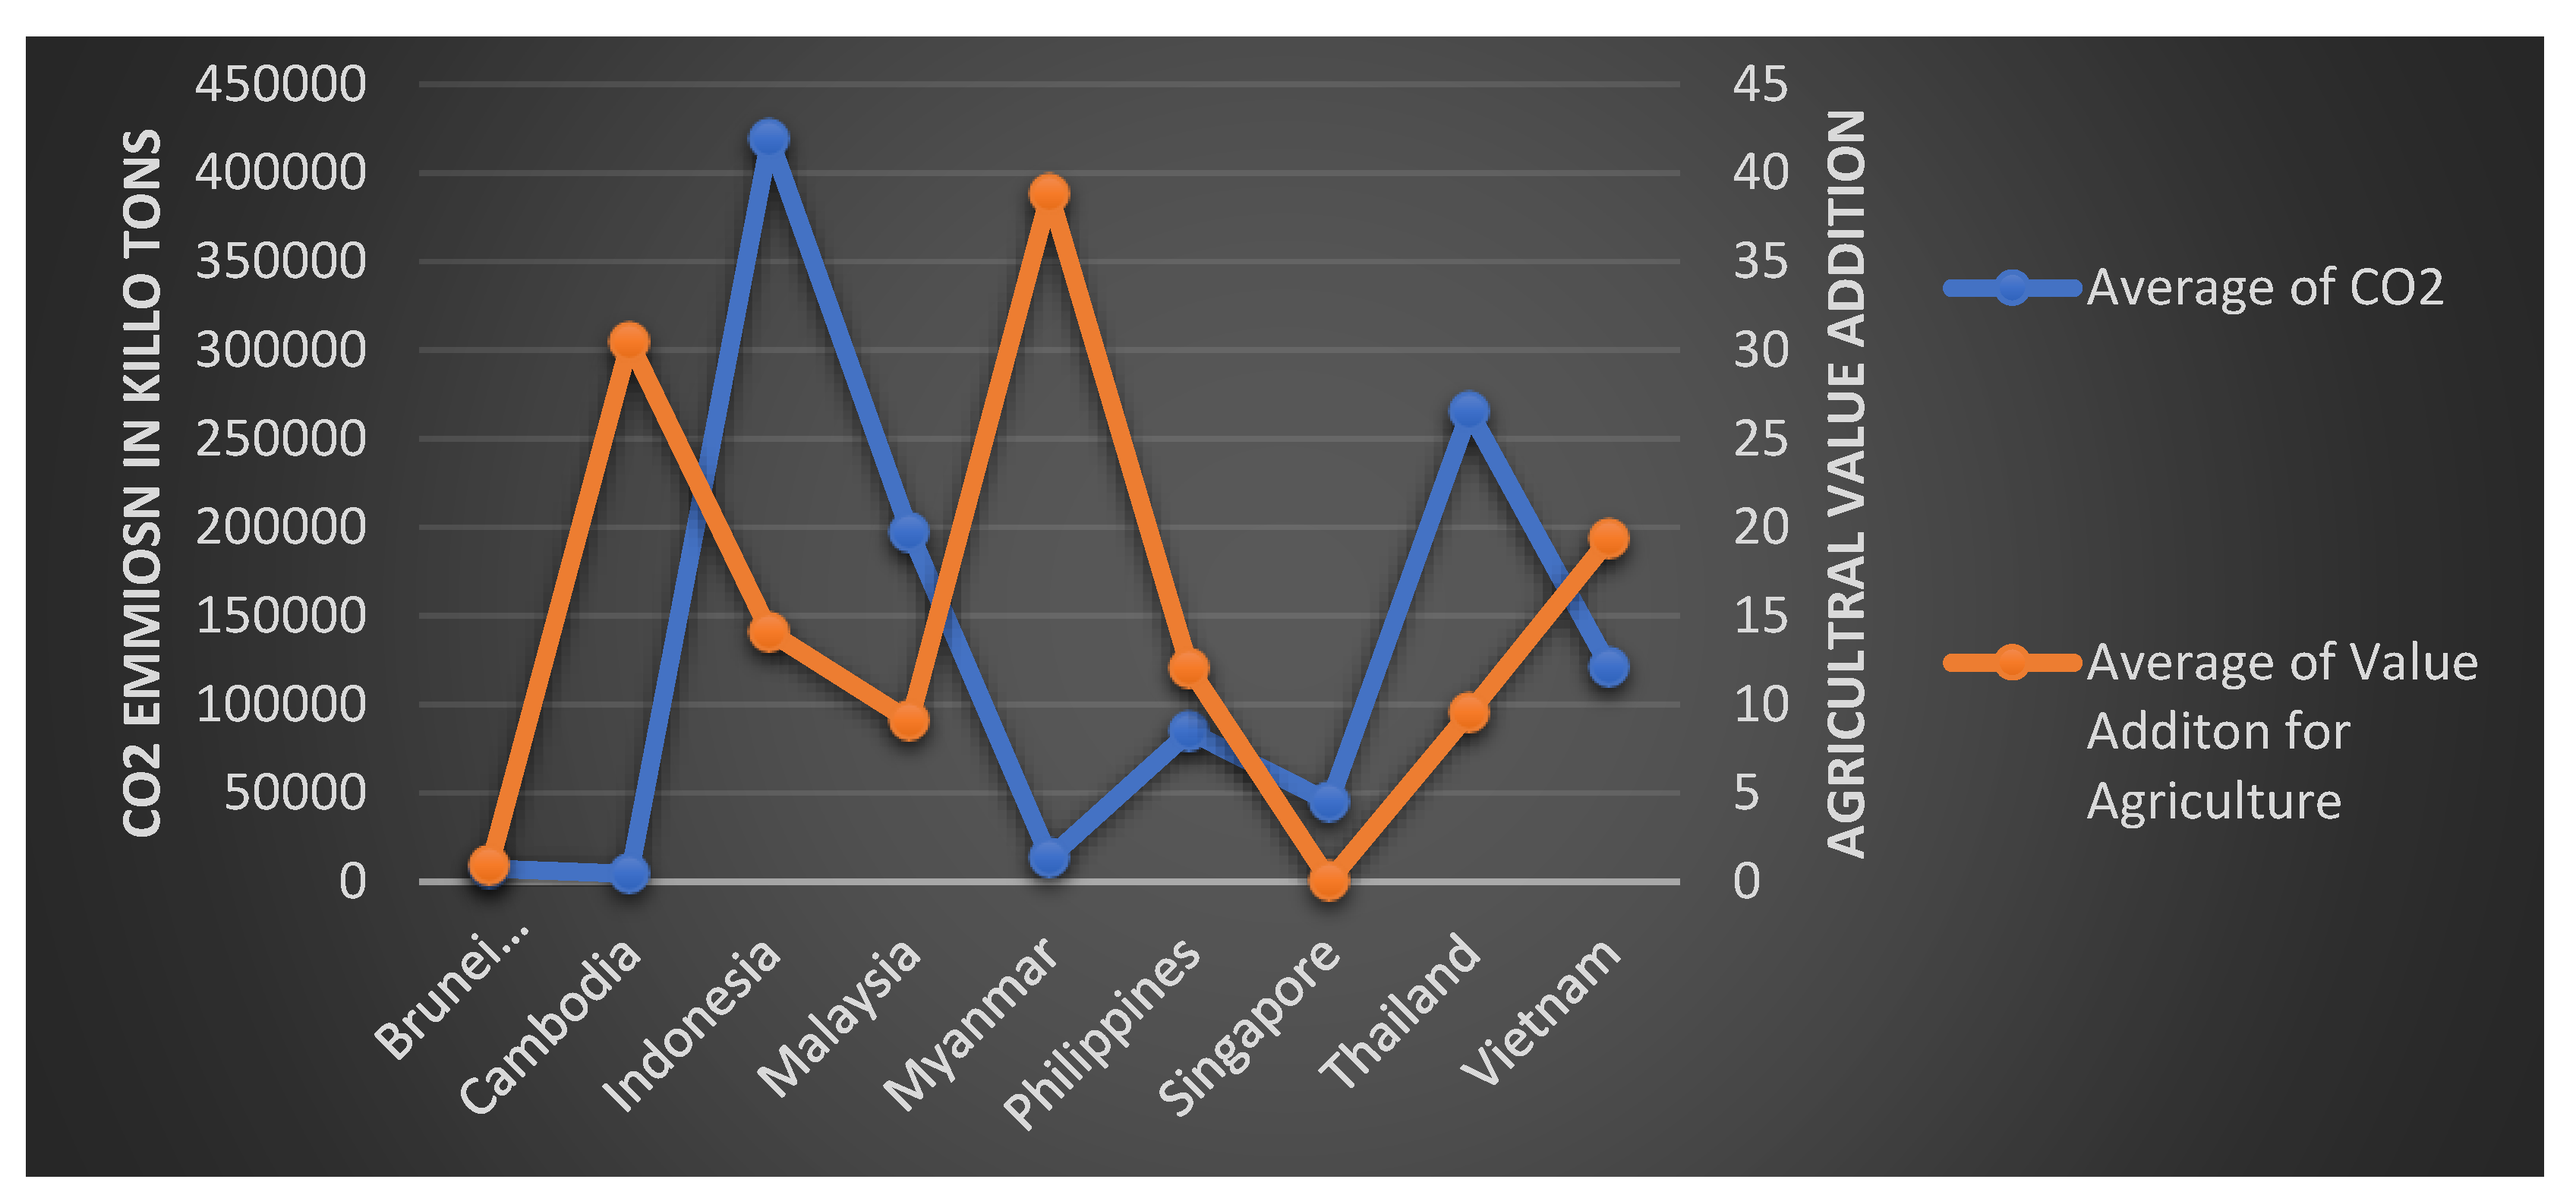
Figure 1. Average data from 2000 to 2020 of CO2 with trade, renewable energy, and fossil fuel consumption.
Sustainability 14 03556 g001
Figure 2. Value addition for agriculture w.r.t. the CO2 emission in ASEAN countries.
Sustainability 14 03556 g002
Table 1. Average data from 2000 to 2020 of CO2 with other indicators.
CountriesTradeCO2Energy ConsumptionRenewable EnergyPercentage of Renewnable EnergyFossil Fuel EnergyValue Additon for Agriculture
Brunei Darussalam100.64547146.28137.611.0148721.0%98.67811.916362
Cambodia126.8444462.47340.25573.118324.3%28.463132.4379
Indonesia54.53484191.15825.34541.86036.8%65.691215.0814
Malaysia170.9772070.702743.326.992121.2%97.441910.07581
Myanmar17.695613,467.7310.67678.609425.7%31.346240.8088
Philippines81.724285,807.5459.14932.53447.7%59.610514.0261
Singapore369.48643,765.65154.632.553671.0%98.14142.046258
Thailand129.71327,645.91678.2824.03882.3%82.662511.53438
Vietnam154.02812,034.3567.02143.97088.4%63.802920.3467
Table 2. Variable description.
VariableDefinitionUnit
TradeTradeexpressed in terms of percentage of total national GDP
CO2Emissions of CO2expressed in terms of Kiloton per capita for country
UseEneEnergy Usagekg of oil equivalent per capita for country
FFCFossil fuel energy consumptionexpressed in terms of percentage of the net energy consumption by nation
RenEneRenewable energy consumptionexpressed in terms of percentage of net energy consumption
ValAGRValue-added forestry fishing, and agricultureexpressed in terms of percentage of total national GDP
Table 3. Summary of Statistics.
VariablesCO2ValAGRUseEneFFCRenEneTrade
Mean5.73216.8712308.25570.34533.088133.600
Median1.81912.497833.56266.97831.203116.697
Maximum25.76056.2399987.447103.00087.630439.327
Minimum0.1830.025254.27520.6410.0130.171
Std. Dev.5.00111.1182634.28023.33128.45098.550
Skewness1.6961.1101.456−0.2540.5671.523
Kurtosis5.2424.0433.8331.8882.0144.737
Observations200.000200.000200.000200.000200.000200.000
Table 4. Unit root test.
TestLevin, Lin, and ChuI’m Pesaran and ShinADF—Fisher Chi-SquareP.P.—Fisher Chi-Square
VariablesStatisticProb.StatisticProb.StatisticProb.StatisticProb.
CO2−2.810.0190.7730.80711.170.85417.2530.570
∆(CO2) −5.203 ***060.308 ***0137.028 ***0
UseEne0.1180.5580.7850.8011.9100.80816.0440.59
∆(UseEne)−3.266 ***0−2.710 ***0.00531.111 ***0.009109.805 ***0
FFC− 1.388 *0.0790.2600.59014.0080.7222.9890.190
∆ (FFC) −3.313 ***0.00141.600 ***0.001114.813 ***0
RenEne−0.8230.2030.6010.70115.3510.65025.3260.201
∆(RenEne)−3.627 ***0−4.237 ***053.785 ***0129.557 ***0
Trade−1.942 **0.027−1.10.14027.509 *0.0925.992 *0.091
∆(Trade) −4.310 ***0
Note: *, **, *** represent 1 percent, 5 percent and 10 percent level of significance.
Table 5. Panel Cointegration and FMOL Results.
VariableCoefficientStd. Errort-StatisticProb.
Pedroni PP −8.535220.000
Pedroni ADF −2.780720.004
ValAGR0.188 **0.0712.32300.015
UseEne8.003 ***0.62210.0230.000
FFC0.480 ***0.0537.5840.000
RenEne−0.348 ***0.042−10.0270.000
Trade−0.025 ***0.003−6.0880.000
Model Diagnostics
R-square0.812161
Adj. R-square0.797885
S.E. of regression2.310778
Note: **, *** represent 5 percent and 10 percent level of significance.
Publisher’s Note: MDPI stays neutral with regard to jurisdictional claims in published maps and institutional affiliations.

