Article

Analysis of the Radiological, Mineralogical and Long-Term Sustainability of Several Commercial Aswan Granites Used as Building Materials

1
Institute of Physics and Technology, Ural Federal University, 620002 Yekaterinburg, Russia
2
Physics Department, Faculty of Science, Al-Azhar University, Assiut 71524, Egypt
3
Geology Department, Faculty of Science, Al-Azhar University, Assiut Branch, Assiut 71524, Egypt
4
Nuclear Materials Authority, P.O. Box 530, Maadi, Cairo 11381, Egypt
5
Medical Diagnostic Imaging Department, College of Health Sciences, University of Sharjah, Sharjah 27272, United Arab Emirates
6
Computer Engineering Department, Faculty of Engineering and Natural Sciences, Istinye University, Istanbul 34396, Turkey
7
Mathematics Department, Faculty of Science, Al-Azhar University, Assuit 71524, Egypt
8
Department of Chemistry, Physics and Environment, Faculty of Sciences and Environment, INPOLDE Research Center, Dunarea de Jos University of Galati, 47 Domneasca Street, 800008 Galati, Romania
9
Department of Physics, Faculty of Science, University of Tabuk, Tabuk 47512, Saudi Arabia
*
Authors to whom correspondence should be addressed.
Sustainability 2022, 14(6), 3553; https://doi.org/10.3390/su14063553
Submission received: 24 February 2022 / Accepted: 14 March 2022 / Published: 17 March 2022

Abstract

:
The widespread usage of granite in the building sector motivated us to conduct this research and examine the material’s sustainability in terms of the investigated characteristics. The purpose of this paper is to discuss the statistical analysis results for the mineralogical impact on radiological hazards indices, such as the equivalent of radium, absorbed gamma dose rate, annual effective dose, internal and external hazard indices, as well as the gamma-ray index, that were calculated to estimate the environmental risks associated with these granites used as building materials, to protect the public from excessive radioactivity exposure. We focused primarily on statistical significance at a 95% confidence level. We employed a non-parametric test (Kruskal–Wallis Test) rather than a one-way ANOVA, to determine the statistical significance of the samples due to the lack of homogeneity or normality among them. To assess the difference between the samples, we used the Mann–Whitney Test on each pair of samples. Additionally, Pearson correlation coefficients for all the mineralogical results are computed. The presence of K-rich minerals (Kefeldspars, biotite) and accessories such as uranophane, uranothorite, allanite, xenotime, fergusonite, aeschynite, zircon, cassiterite, apatite, and sphene, which are mostly found in granitic rocks, determines the level of natural radioactivity of the investigated granites. Most of the rock samples analyzed have indicators of radioactive dangers that are within the acceptable level range, indicating that they are suitable for use as building materials. On the other hand, some samples have environmental criteria that are higher than international standards, indicating that they are unsuitable for use as construction materials.

1. Introduction

Statistical analysis is a critical phase in the scientific research process because it allows the researcher to acquire a collection of data that is directly relevant to the scientific study under process. Generally, the researcher gathers evidence from various sources and then collects and analyzes these data to extract significant information, using logical-mathematical styles in which relationships are related to the content, thereby forming a new meaning from otherwise meaningless relationships [1,2]. On the other hand, statistical analysis is one of the types of analysis that is performed when planning a specific project or conducting scientific research, and conducting a successful statistical analysis is regarded as one of the most important reasons for the success of a researcher’s work or research, given the significant role that statistical analysis plays in providing important and valuable information that greatly aids the success of the project or research [3].
Analysis is utilized in various industries, including research, finance, marketing, medicine, and mineralogy. For instance, statistical analysis can be used to detect the effect of radiation dangers in samples of granitic rocks. Occasionally, the experimenter must make a decision about the data, and in these instances, the researcher performs statistical analysis. Additionally, statistical analysis is required to investigate correlation, the regression between data, and visual representation. It is important to conduct tests on all sorts of construction materials, in addition to granite rocks, in order to determine their radioactive content [4]. Some samples of the granitic rocks in the investigated area are likely to have a high concentration of radionuclides, e.g., ZrSiO4, monazite, Ca5(PO4)3(F,Cl,OH), CaTiSiO5, xenotime [5,6]. Thus, understanding the radioactivity of granite rocks is critical for environmental radioprotection [7] since it allows for the estimation of any related health concerns. People will be exposed to a greater amount of radiation when they employ radionuclide-containing construction materials because they are the actual users of these materials [8,9,10,11,12,13,14]. Natural radionuclide activity concentrations were determined to be normal in the granite samples examined at Um Taghir [15,16]. The granites in the Um Taghir area have almost the same radiological properties and can be used as building materials, such as the granite rocks in the Aswan region. The widespread usage of granite in the building sector motivated us to conduct this research and to examine the material’s sustainability in terms of the investigated characteristics. Granitic rock is an essential resource for decorative stones because it has excellent physical and mechanical qualities in addition to a low radioactive content [17].
The aim of this paper is to explain the statistical results obtained for the mineralogical impact on radiological hazards indices, such as the equivalent of radium, absorbed gamma dose rate, annual effective dose, internal and external hazard indices, and gamma-ray index, that were calculated to estimate the environmental risks associated with these granites used as building materials, to protect the public from excessive radioactivity exposure.

2. Materials and Methods

Twenty-nine samples representing the eleven most widely used commercial varieties of Aswan granite, used as construction and decorative materials, were gathered and analyzed for radioactivity [17]. Overall, commercial ornamental granite samples intruded on older country rocks (metasediments, metavolcanics, and older granites). The contacts are frequently piercing and obtrusive. In several places, the Nubian Sandstones are uniformly overlain by these granites. A wide range of grey medium-grained granites, red coarse-grained granites, and fine-grained granites make up the chosen samples [18]. After that, the granites underwent comminution operations such as crushing and grinding. To begin, a crusher was used to create a feed of around −3 mm for the grinding operation. Then, using the Denver grindery, the size was reduced to 99%, passing 0.5 mm. Due to moisture, the comminuted samples were submitted to radiometric analysis after drying at 80 °C for two hours to minimize radioactive absorption, via the radioassay. Around 300 g of dried powdered samples were packaged in cylindrical plastic containers with a diameter of 9.5 cm and a height of 3 cm. The plastic containers were firmly sealed, secured, and left for thirty days before counting to achieve secular equilibrium between Uranium-238 and Radium-226 [18]. The equipment used to detect the four radionuclides is a 76 × 76 mm Bicron NaI (Tl) scintillation detector, sealed in an Al enclosure with a photomultiplier tube. The tube is shielded against induced X-rays with a 6 mm thick Cu-cylinder and against ambient radiation with a Pb-brick shield. Four energies are used to determine the radionuclides (U, Th, Ra, and K). Thorium-232, lead-212, lead-214, and potassium-40 emit at 93, 239, 352, and 1460 kV for U, Th, Ra and K respectively. The observed values of U, Th, and Ra in parts per million (ppm), as well as K-40 in percent (%), were converted to activity concentrations in Becquerel per kilogram (Bq/kg) [19,20]. Mineralogical analysis was performed on the majority of the radiological samples in order to assess their qualitative radioactive mineral composition such as uranophane, uranothorite, allanite, and xenotime. To begin, a heavy liquid separation procedure was carried out using bromoform with a specific gravity of 2.89, and the resulting heavy fractions were examined under a binocular microscope. Then, using a Scan Electron Microscope (SEM) equipped with a Dispersive Microanalyzer, pure monomineral grains were chosen and identified (EDX). The studies were conducted at the Egyptian Nuclear Materials Authority’s (NMA) facilities.

3. Statistical Study of Measured Results of 232Th/238U, K-40, Ra-226, Th-232, and U-238

We give some statistical criteria for determining the significance of the discrepancies between the sample values for Thorium-234, lead-212, lead-214, and potassium-40 at 93, 239, 352, and 1460 kV for U, Th, Ra, and K, respectively. After determining that there is no homogeneity or normality among the sample results, we will utilize the Kruskal–Wallis Test to determine the difference between the samples. The following are the test results:
From Table 1, we note that the p-value < 5%, hence there is a significant difference between 232Th/238U, K-40, Ra-226, Th-232, and U-238. To check the difference, we shall carry out the Mann–Whitney Test between every two samples together. The results are presented below:
From Table 2, one can state that there is no significant difference between Th-232/U-238 and this is clear by looking at the mean rank (31.93, 27.07) of Th-232 and U-238, respectively. Moreover, this decision can be taken by comparing the p-value with a significance level of 5%, where (p-value = 0.272 > 0.05). Although, by comparing the p-value and the mean rank of the remaining samples, we can state that there are significant differences between each pair of samples: (Ra-226–U238), (K-40–U-238), (232Th/238U–U-238), (Ra-226–Th-232), (K-40–Th-232), (232Th/238U–Th-232), (K-40–Ra-226), (232Th/238U–Ra-226) and (232Th/238U–K-40). Table 3 presents the Pearson correlation among the samples, U-238, Th-232, Ra-226, K-40, and 232Th/238U. We can see that there is a strong direct relationship between U-238–Ra-226, with a Pearson correlation coefficient (PCC) of 0.724 **, considerable at 0.01, and a strong direct relationship between Th-232–K-40 (0.686 **); the PCC significant at 0.01. Moreover, one can see that there is a strong inverse relationship between 232Th/238U–U-238 (−0.635 **); the PCC significant at 0.01. Furthermore, there are moderate direct relationships between 232Th/238U–Th-232 with a PCC of 0.421 *, significant at 0.05, and 232Th/238U–K-40, with a PCC of 0.407 *, significant at 0.05. The rest of the relationships are either weak or very weak.

4. Theoretical Calculations of Radiological Hazards Indices

To prevent individuals from excessive radiation exposure, numerous radiological indicators have been proposed to estimate the exposure to naturally occurring radioactivity in building materials. Radium equivalent activity (Raeq), absorbed gamma dose rate (Da), annual effective dose (HE), internal hazard index (Hin), external hazard index (Hex), and gamma-ray index (Iγ) are used as radiological indicators [21,22]. The Raeq activity is the sum of the activities of the 226Ra, 232Th, and 40K radionuclides, based on the assumption that 1, 0.7, and 13 Bqkg1 of Radium-226, Thorium-232, and potassium-40, respectively, produce the same gamma-ray dose rate. The Raeq has been computed by the formula described by [23,24], as indicated by Equation (1).
Ra eq = 0.077 C K + 1.43 C Th + C Ra
where CRa, CTh, and CK are the activity concentrations of 226Ra, 232Th, and 40K, respectively.
Da is an index that calculates the absorbed dose rate in the air for external gamma radiation at about 1.0 m above the ground from the natural radionuclides, Da(nGyhr1) given by UNSCEAR (2000) [25].
D a   nGyhr 1 = 0.0417 C k + 0.604 C Th + 0.462 C R
The Da has been utilized to evaluate the HE of the subjects and to determine the biological impact of the radiation exposure. The effective dose transformation factor is 0.7 SvGyr1 and an external exposure factor of 0.2 with an annual exposure time of about 8760 h per year. Hence, the HE was computed via:
H E   mSvyr 1   =   D a   nGyhr 1   ×   8760   hryr 1   ×   0.2   ×   0.7   SvGy 1   ×   10 6
The Hex is generally utilized to assess the rate of radiation dose due to external exposure to gamma radiation from natural radionuclides in soil samples, as reported by [26], in Equation (3). Mathematically, the arithmetic means Hex must be 1 for the radiation hazard to be nonsignificant.
H ex = C k 4810 + C Th 259 + C Ra 370 1
The main endogenous factor controlling 222Rn and its radioactive daughters is the internal Hin. The Hin is one of the factors for calculating the negative impact of radioactive materials on the lungs and other respiratory organs. The danger of internal exposure due to natural radionuclides can be evaluated from the Hin value using the Equation given by [27]:
H in = C k 4810 + C Th 259 + C Ra 185
The European Commission has assumed a leading indicator of gamma radiation (Iγ), closely related to the HE [28]. The Iγ is evaluated considering the standard room model with dimensions of 4 × 5 × 2.8 m and thickness of 0.2 m. This index factor is accompanied with the external exposure, which is determined by the formula:
I γ = C Ra 300 + C Th 200 + C K 3000
Lifetime cancer risk (ELCR) was assessed based on HE values using:
ELCR   =   H E ×   L E ×   R F
where LE is life expectation of about 70 years and RF is the lethal hazard factor per sievert which is 0.05 [29].

5. Results

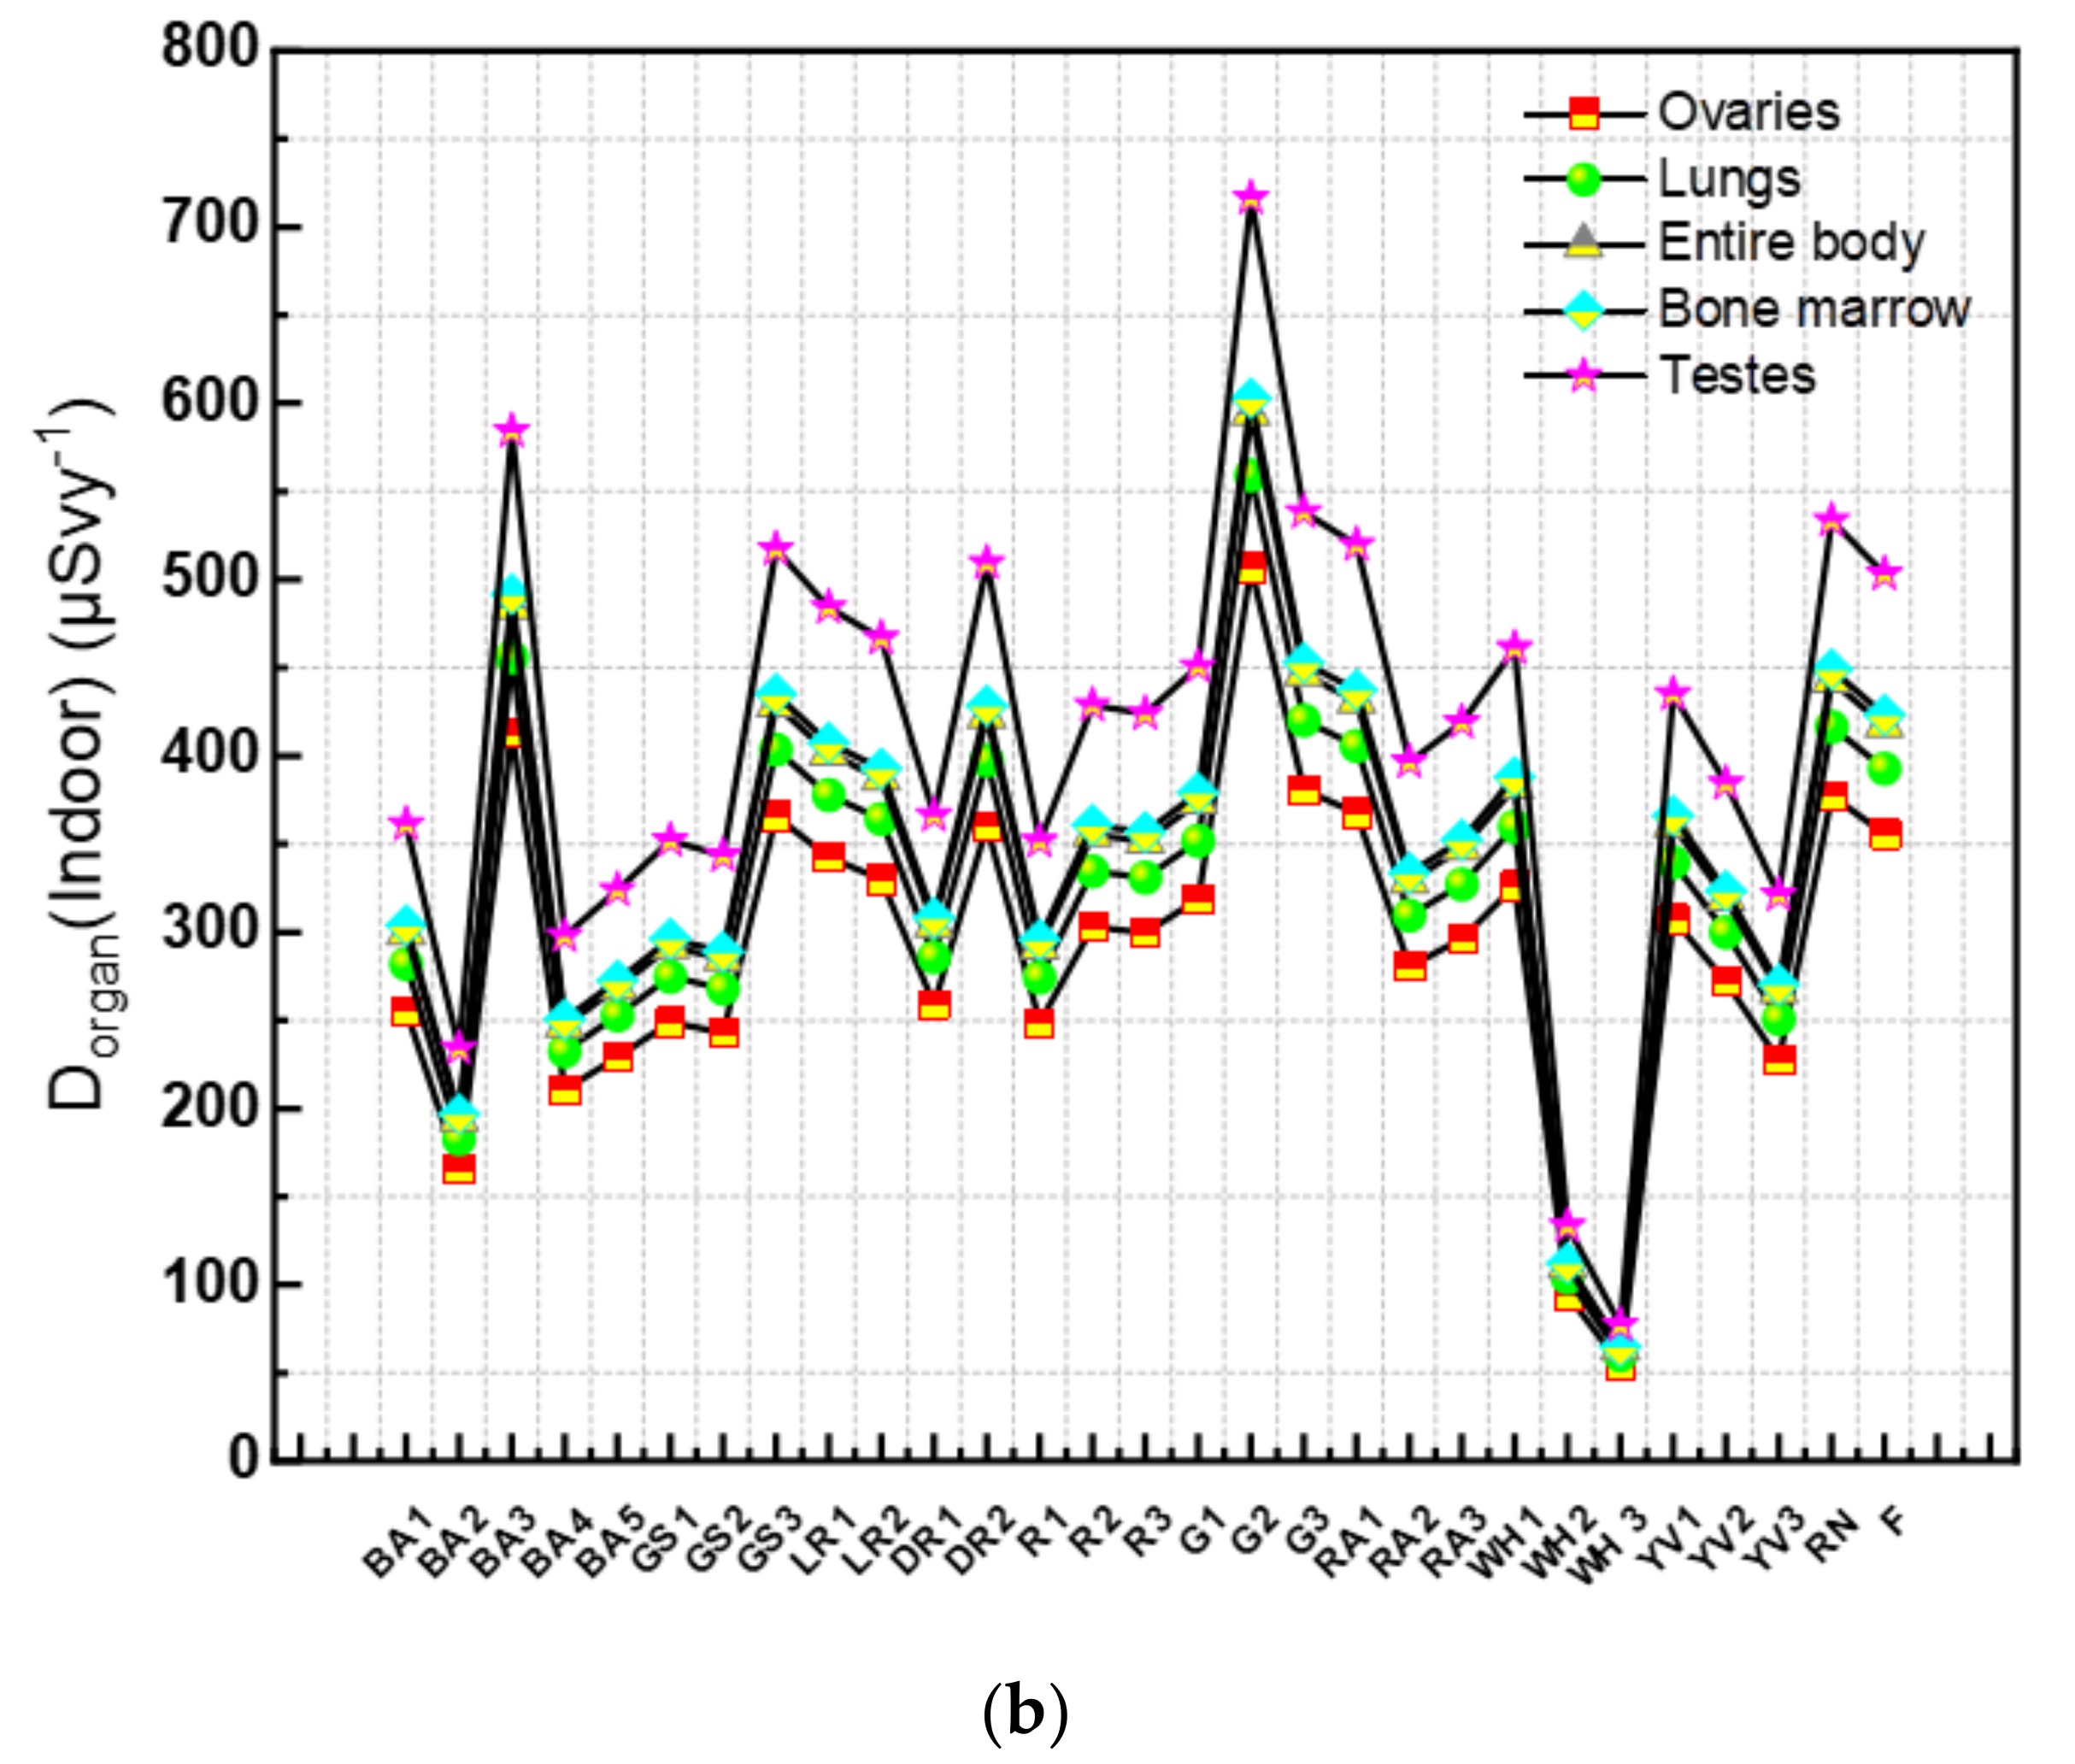
5.1. Radiological Impact

According to ICRP recommendations, to keep the external dose <1 mSvy−1, the highest Raeq values for investigated samples must be ≤370 Bqkg−1 [29]. Table 4 presented that Raeq values are ranged from a minimum of 28 for the white Halayeb 3 sample to a maximum of 322 Bqkg−1 for the Gandola 2 sample. Therefore, all the studied sample values are below the permissible level; thus, all the studied Aswan granite samples are safe as building materials. Concerning the absorbed dose rate as shown in Table 5, the lowest value was about 14 nGyh−1 for the white Halayeb 3 sample, and 153 nGyh−1 was the highest value for the Gandola 2 sample, with an average of 94 nGyh−1. We noted that about nineteen samples (between 24 and 85 nGyh−1) of the twenty-nine studied samples were higher than the international dose rate [30]. The HE ranged from 0.02 to 0.19 mSvyr−1 with an average value of 0.11 mSvyr−1 < 1 mSvyr−1 [31].
The internal hazard index (Hin) for the studied Aswan granites ranged from 0.07 to 0.9. These values are within the safe value limit of 1 recommended by [28], except sample no. 14 for the Gandola 2 sample, which has an Hin of 1.11 that is higher than the safety limit. Furthermore, the Hex must be <1 to be radiation risk negligible [32]. Therefore, the Hex estimated for the studied Aswan granite samples were less than the safety limit as given in Table 5.
The gamma-ray index is associated with the annual dose rate produced by gamma radiation. Substances with Iγ < 2 will increment the HE by 0.3 mSv, while for 2 < Iγ < 6, the Iγ corresponds to a rise in the effective dose by 1 mSv per year. Therefore, building materials that are used superficially and not in large quantities (tiles, slabs, etc.) must be excused from all the related limitations if the resulting excess of gamma radiation increases the HE for a human being by at most 0.3 mSv. On the other hand, HE higher than 1 mSvy1 are only allowed in exceptional cases, where the substances are used locally. Finally, it is not recommended to use samples of Iγ > 6 in buildings [28].
The highest value of the ELCR for the studied samples is 0.7, while the minimum value was 0.06 with an average of 0.4.

5.2. Radionuclide’s Activity Concentrations Contributing to the Absorbed Dose Rate

The contributions of the radionuclide 238U, 232Th, and 40K absorption rate within the investigated rocks are illustrated in Figure 1. The 238U, 232Th, 226Ra, and 40K elements are different for most rock verities. 40K plays the prominent and most important role in dose rate contribution. The main contributors to the absorbed dose in highly radioactive samples are mainly attributed to potassium, followed by uranium and thorium, as indicated in Figure 1.
Regarding the external and internal hazard indices (Hex and Hin), to reduce the annual external gamma radiation dose 1.5 Gy for the examined samples, the external hazard index (Hex) is calculated by the Equation: Hex = AU/370 + ATh/259 + AK/4810. The internal exposure to 222Rn and its radioactive progeny is controlled by the internal hazard index (Hin). Hin = AU/185 + ATh/259 + AK/4810. These indicators should be less than a unit to keep the radiation risk low [33,34].
The rates of the effective dose that can be delivered to specific organs (lungs, ovaries, bone marrow, testes and whole body) from the indoor and outdoor air dose are shown in Figure 2. Moreover, we can deduce that the testes have the highest radiation sensitivity, while ovaries have the lowest radiation sensitivity.

5.3. Mineralogical Investigation Results

The radiological measurements results proved that samples such as Gandola 2, Black Aswan 3, Light Rose 1, Grey Shirka 3, Dark Rose 1, Yellow Verdi 1, and White Halayeb 1 have the highest values. Therefore, these samples were mineralogically investigated via a heavy liquid (Bromoform, sp. gr. 2.89) separation technique for separating the heavy mineral content. From the obtained heavy fractions, pure mineral grains were hand-selected with the aid of a binocular microscope, and then subjected to a scanning electron microscope (SEM) to determine their mineralogical composition. The SEM is provided with an energy-dispersive spectrometer (EDS) unit (Philips XL 30).

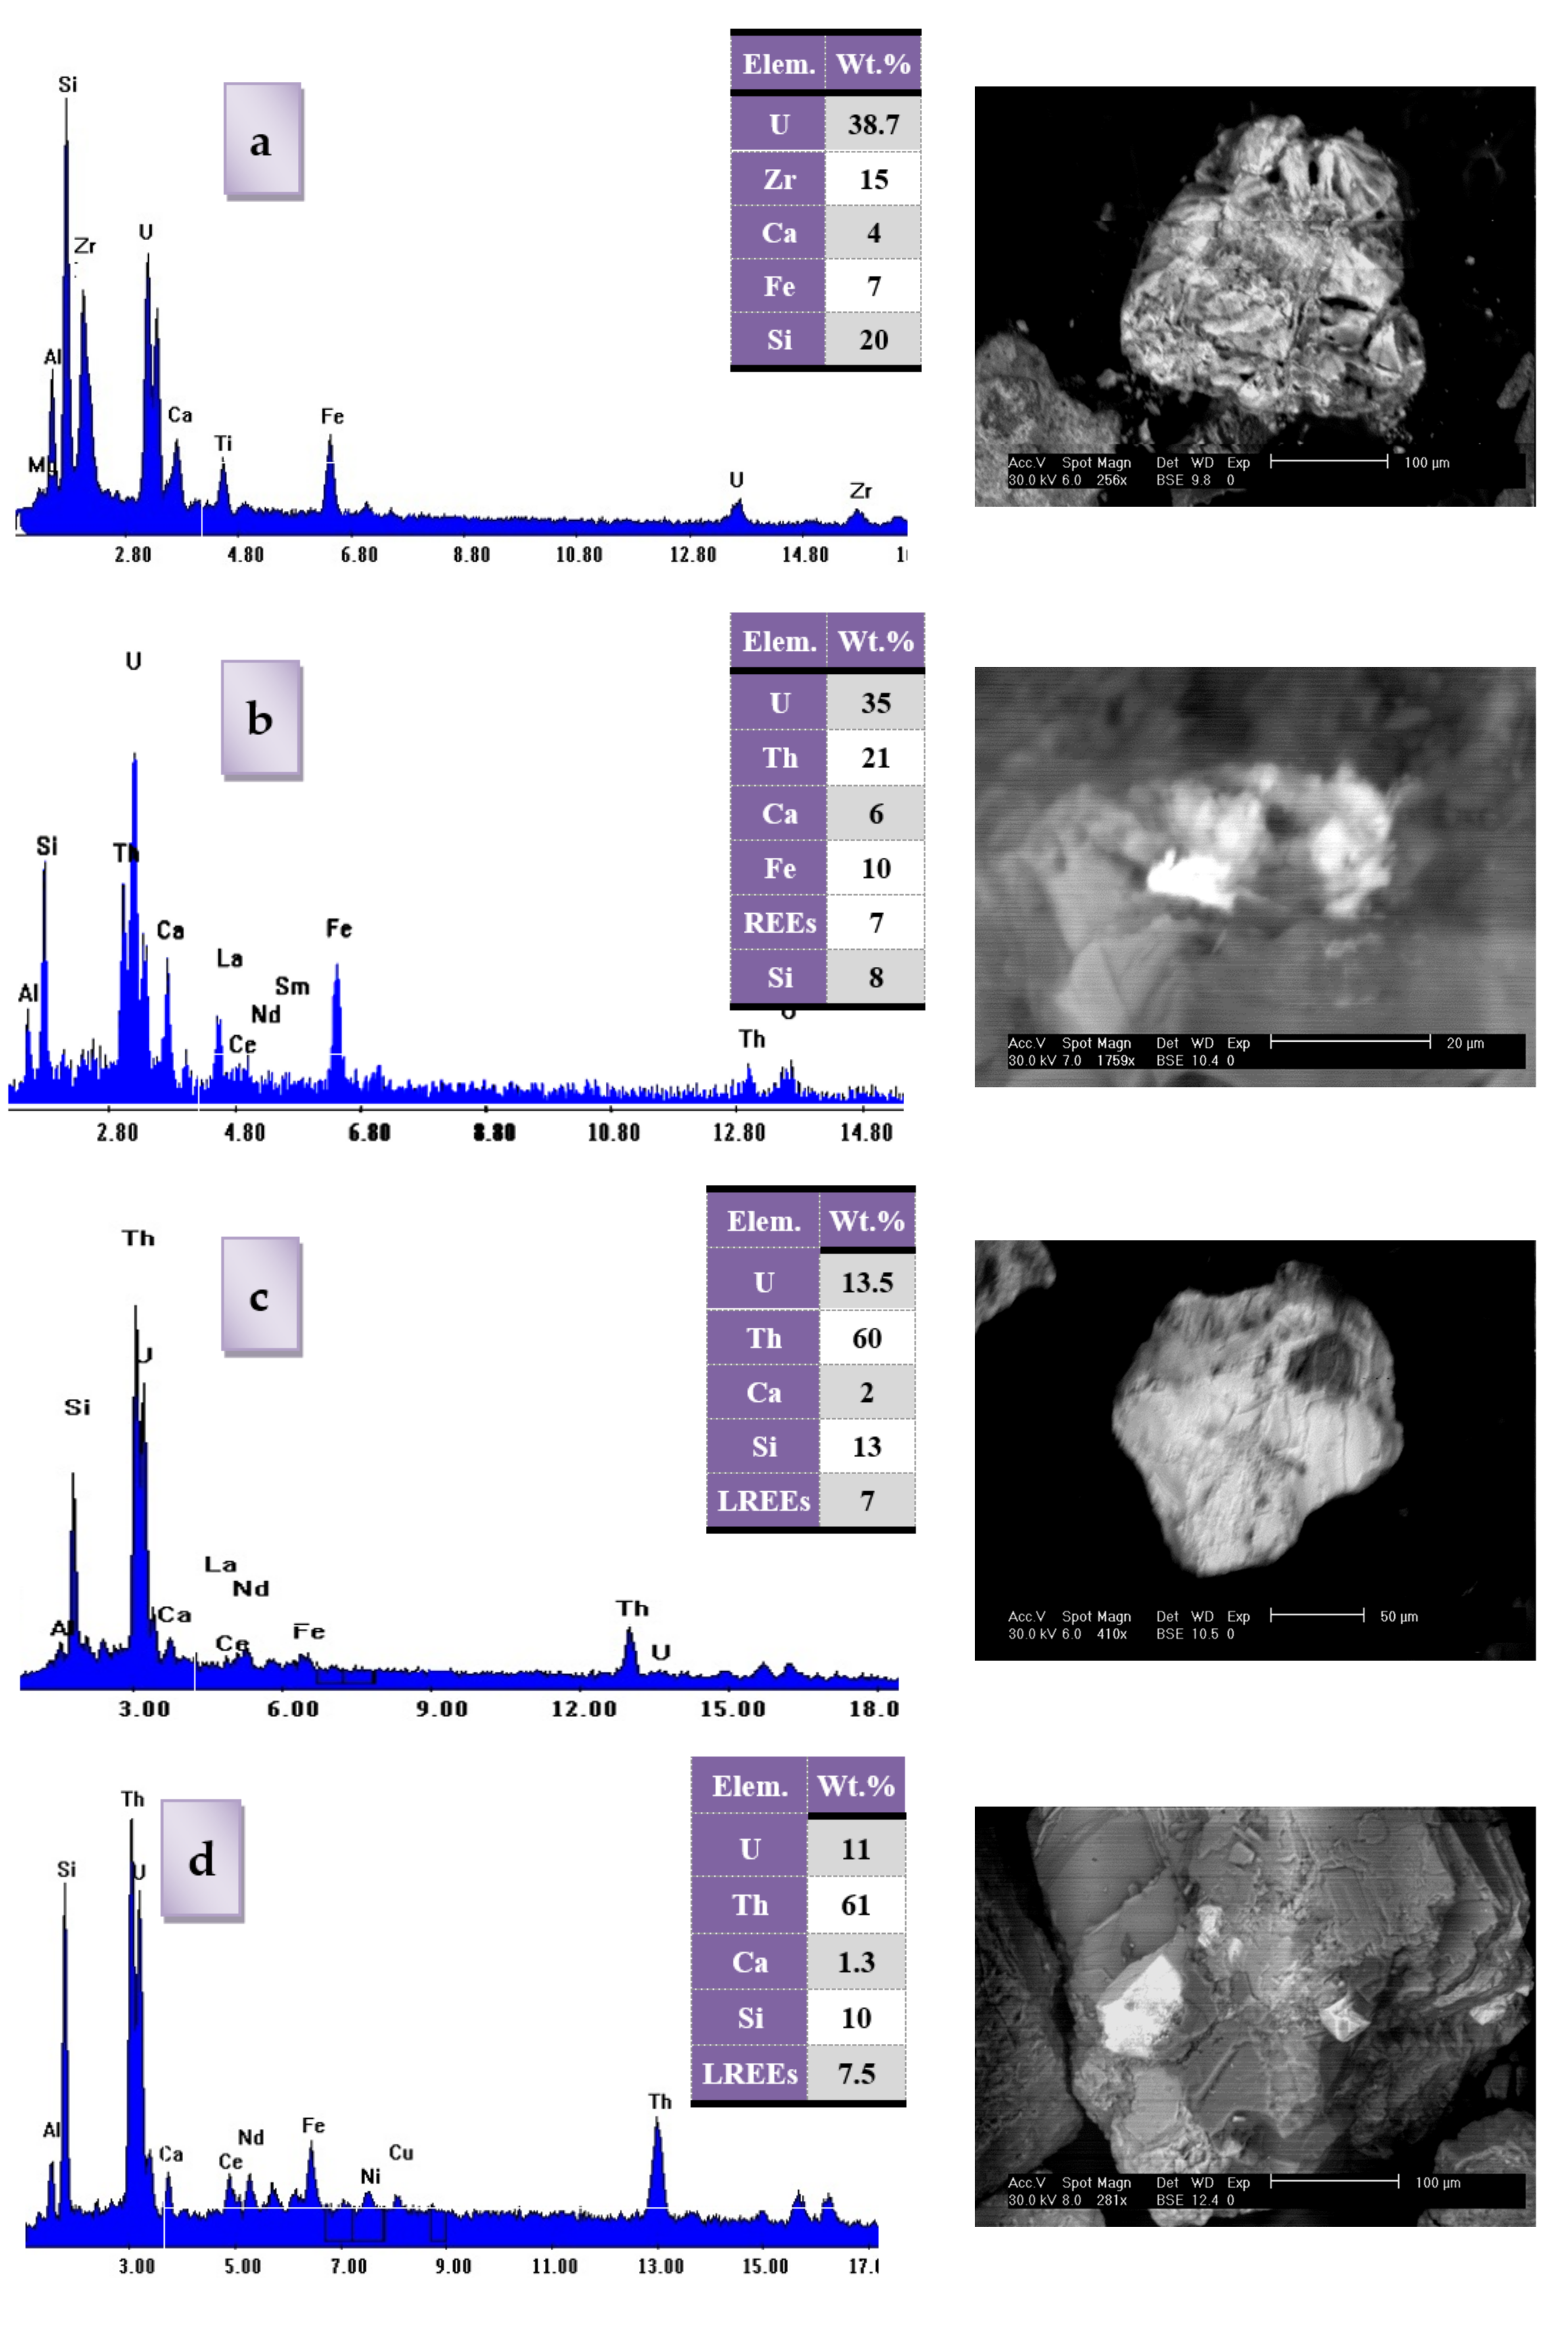
5.3.1. Radioactive Minerals

Uranophane (Ca(UO2)(SiO2)2(OH)2.5H2O) is hydrated calcium uranium silicate containing silica in place of the phosphate of autunite. Uranophane is the alteration product of uraninite and the chief constitute of the outer silica zone of uraninite alteration. Most uranophane appears to be of supergene origin, where it can be noticed in the oxidized parts of deposits. Uranophane is present as small aggregates in zircon surface as confirmed by the ESEM technique and gave U (38.7 Wt.%), Ca (4 Wt.%), and Si (20 Wt.%), with considerable amounts of Fe (Figure 3a); some grains contain considerable amounts of Th and REEs (Figure 3b).
Uranothorite (Th,U)SiO4 is a rare accessory mineral. It occurs as anhedral fine to very fine blackish opaque crystals. According to [35], uranium usually presents in amounts up to about 10% in this mineral. It is confirmed by the scanning electron microscope technique—Th (60–61 Wt.%), U (11–13.5 Wt.%), and REEs (7–7.5 Wt.%), with small amounts of Cu and Ni (Figure 3c,d).

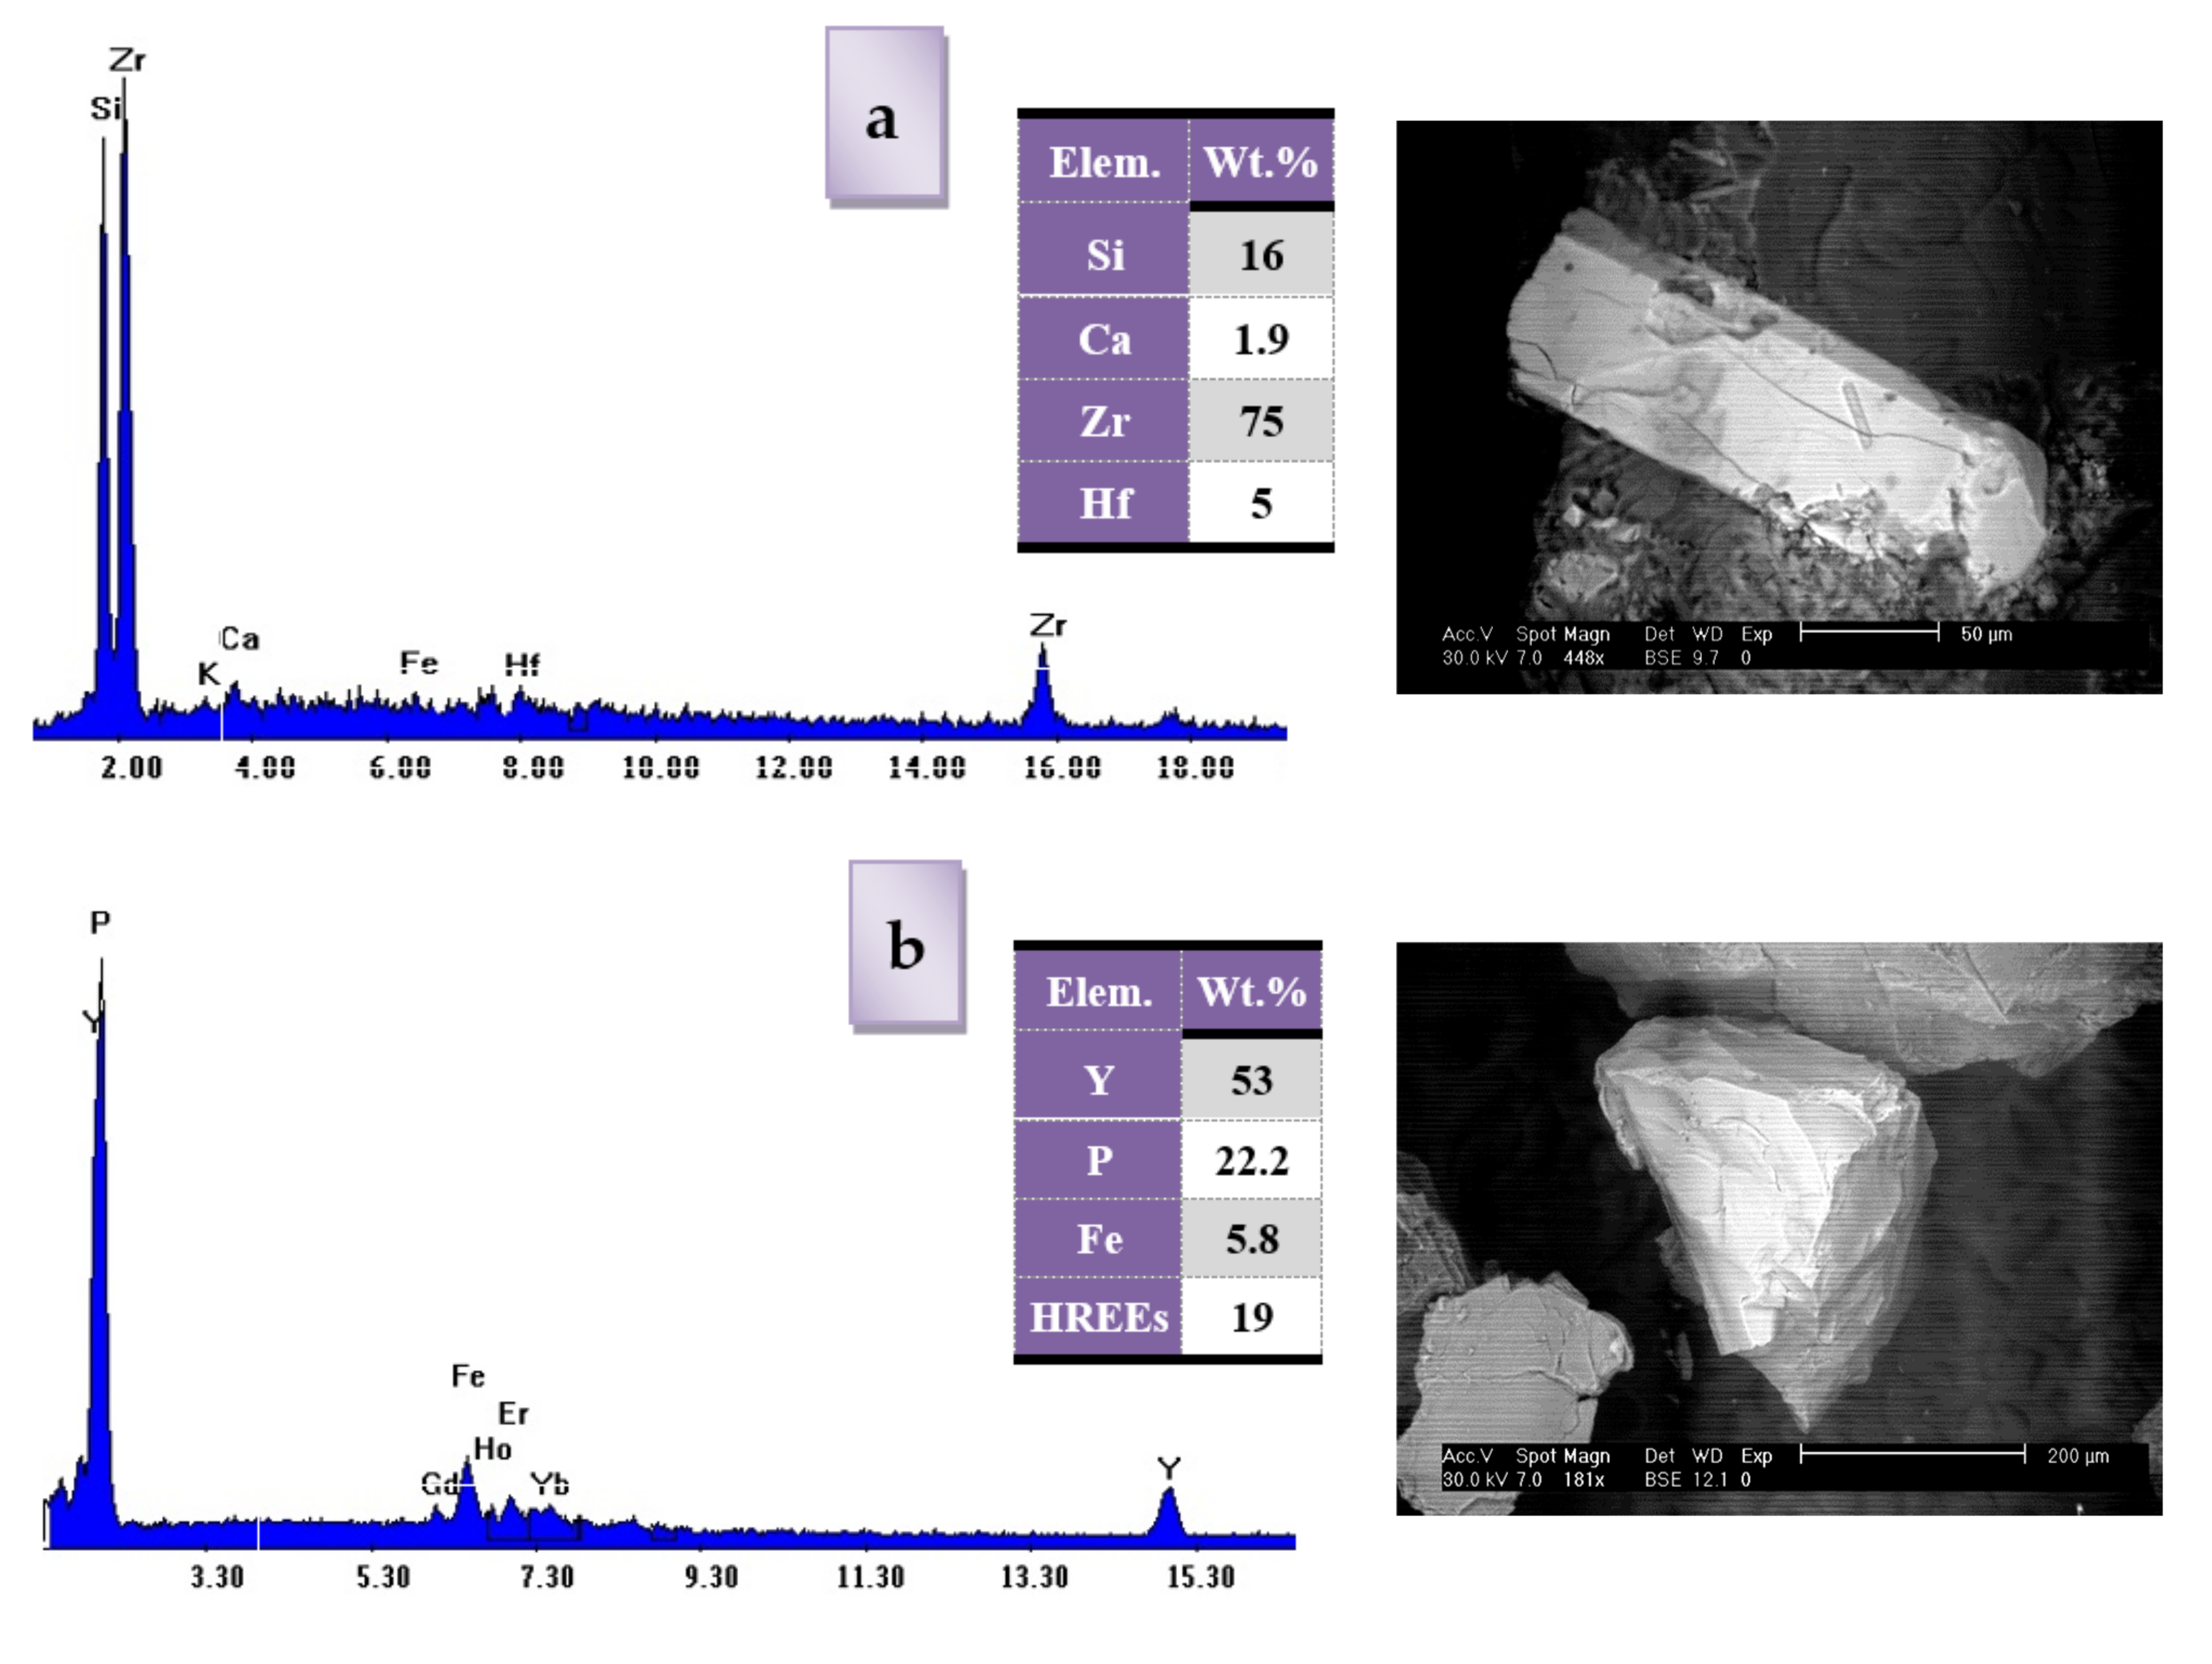
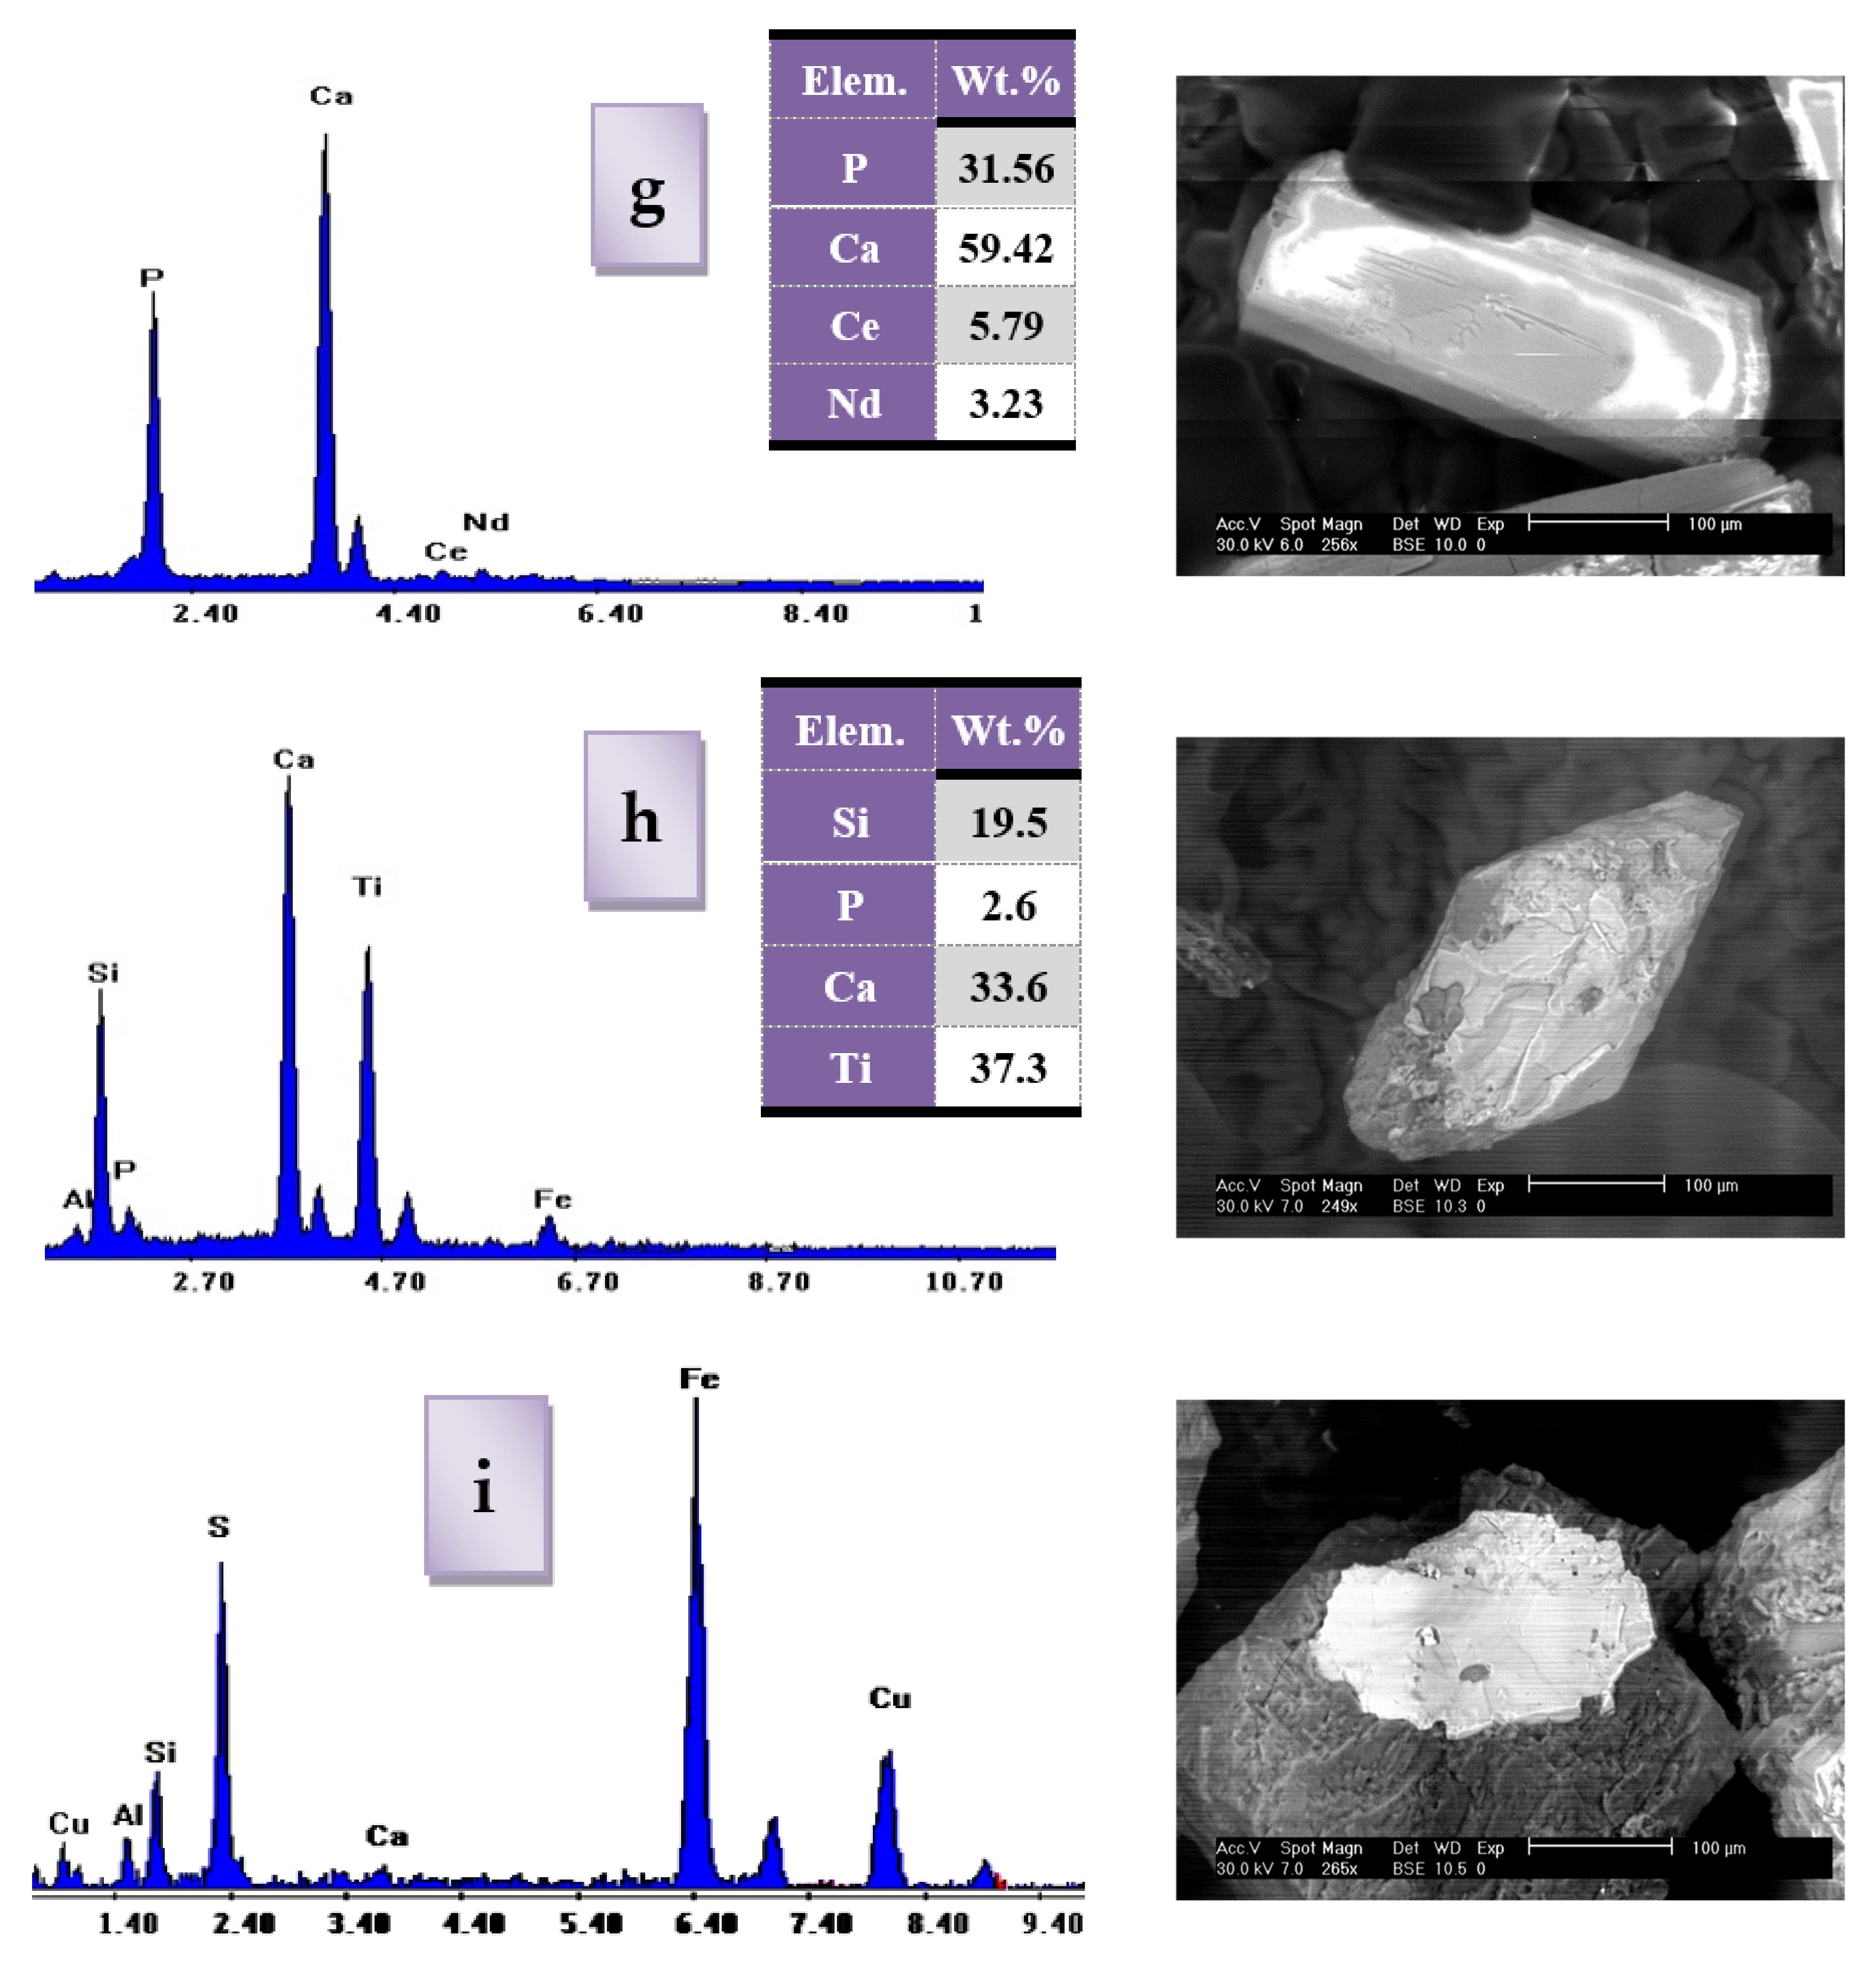
5.3.2. Accessory Minerals

Zircon (ZrSiO4) is a common accessory mineral in nature. Zirconium is used in a number of industrial applications because it is so resistant to corrosion; it is used in pumps, valves and the cores of nuclear reactors. Metamictization of natural zircon results from accumulated radiation damage to the crystal structure, caused by the radioactive decay of trace amounts of U and Th substituting for Zr. The damage is generally considered to be the result of recoiling nuclei produced in the a-emission process [36,37]. Metamictization is characterized by marked changes in physical properties, including significant decreases in density, refractive index, and birefringence [36]. The EDAX analyses of zircon indicate Zr/Hf ratio 15, with traces of Ca and Fe (Figure 4a).
Xenotime (YPO4) crystals are similar to zircon and can easily be confused with the duller luster. Often, uranium or other rare elements such as erbium, thorium, ytterbium, zirconium, and the not so rare calcium, are found as traces in xenotime, replacing the yttrium. The EDX analyses found Y (47–53 Wt.%), P (21–22 Wt.%), and HREEs (16.5–19 Wt.%), with traces of Ca and Fe (Figure 4b,c).
Aeschynite (Ce,Ca,Fe,Th)(Ti,Nb)2(O,OH)6 is a rare earth-bearing titanium niobium oxide hydroxide. Aeschynite is one of several Rare Earth Oxides and has two synonyms; “blomstrandine” and “priorite”. However, Aeschynite’s nomenclature is even more complex than this. There are no less than three mineral names that begin with aeschynite and a few others that use aeschynite in their names. These minerals are all officially distinct minerals, but actually just differ in their respective compositions. The structure of these minerals is more or less unchanged. The prefixes or suffixes indicate which rare earth metal is predominant in the mineral as illustrated below:
  • Aeschynite-(Y) the yttrium rich aeschynite.
  • Aeschynite-(Ce) the cerium rich aeschynite.
  • Aeschynite-(Nd) the neodymium rich aeschynite.
The recorded mineral was confirmed by the ESEM technique and belongs to Aeschynite-(Ce), the cerium rich aeschynite; Ti (28 Wt.%), Nb (12.6 Wt.%), Ce (14 Wt.%), and Fe (11 Wt.%), with traces of Ca (Figure 4d).
Columbite mineral ((Fe,Mn,Mg)(Nb,Ta)2O6) is the most widespread niobium mineral and makes for an important ore of the industrially useful metal. Columbite, also called niobite, is black to dark brown tabular or prismatic crystals, crystallized in an orthorhombic system. Columbite was confirmed by the ESEM technique and contains Nb (30 Wt.%), Ta (5.4 Wt.%), Fe (5.6 Wt.%) and ∑REEs (11 Wt.%). The Nb/Ta ratio equal to 5.5 indicates enrichment in Ta (Figure 4e).
Cassiterite (SnO2) is a tin oxide mineral with a chemical composition of SnO2. It is the most important source of tin, and most of the world’s supply of tin is obtained by mining cassiterite. The latter is more resistant to weathering than many other minerals. This mineral was recorded in granite as broad flakes (~20 µm) and contains Sn (100 Wt.%) (Figure 4f).
Apatite (Ca5(PO4,CO3)3(F,OH,CL)) is a common accessory mineral in almost all igneous rocks. It forms small euhedral prismatic crystals. The color of apatite is extremely variable due to the percent of Mn content, but in this case it is a white color due to the absence of Mn. The EDAX analysis reflects the chemical composition of the apatite grains (Figure 4g).
Sphene (CaTiSiO5) is an accessory mineral in many acidic and intermediate igneous rocks. The color of sphene ranges from yellowish brown to brown colors. It occurs as anhydral crystals. They are translucent mineral grains with a resinous luster. It is confirmed by ESEM as shown in Figure 4h.
Chalcopyrite (CuFeS2) was recorded, having a composition of Cu (25 Wt.%), Fe (41 Wt.%) and S (20 Wt.%) (Figure 4i).

5.4. Statistical Study for Raeq and Absorbed Dose, AEDE_in, AEDE_out, ELCR, and AGDE

Here, we discuss the statistical significance of the proposed samples’ results using statistical analysis methods. The following are the results of the analysis as listed below. From Table 6, we can see that the p-value < 5%, which means there is a significant difference between Raeq and the absorbed dose. To determine this difference, we compare a sample mean of Raeq and the absorbed dose and can note that the mean of Raeq > the mean of the absorbed dose.
From Table 7, we note that the p-value < 5%; hence, there are significant differences between AEDE_in, AEDE_out, ELCR, and AGDE. To investigate the differences, we carried out a Mann–Whitney Test between every two samples together. The results are shown as follows:
From Table 8, we can decide that there is a significant difference between (AEDE_in, AEDE_out), (AGDE, AEDE_in), (ELCR, AEDE_out), and (AGDE, ELCR), while there is no difference between (ELCR, AEDE_in). The difference is evident by comparing the mean rank.
From Table 9, one can note that the p-value < 5%; hence, there are significant differences between Hazard_hin, Hazard_hex, Gamma_index, and Activity_utiliz. We applied the Mann–Whitney Test between every two samples together to check the difference. The results are listed below:
From Table 10, we can say that there is a significant difference between (Hazard_hin, Hazard_hex), (Hazard_hin, Activity_utiliz), (Hazard_hex, Gamma_index), (Hazard_hex, Activity_utiliz) and (Gamma_index, Activity_utiliz), while there is no difference between (Hazard_hin, Gamma_index). The difference among samples is evident by looking at the mean rank as well as comparing the p-value with a significance level of 5%.
Table 11 presents the Pearson correlation coefficient among the radiological measurements results. We can notice from the table that all the relationships are strong direct correlations, and all the correlations are significant at 0.01.

6. Conclusions

  • This study carried out statistical analyses on the radiological measurements results, such as the Pearson correlation, T-Test, Mann–Whitney Test, and Kruskal–Wallis Test. Descriptive statistics and graphic representations are also presented.
  • The level of natural radioactivity of the investigated granites relates to the presence of both the K-rich minerals (Kefeldspars, biotite) and accessories such as uranophane, uranothorite, allanite, xenotime, fergusonite, aeschynite, zircon, cassiterite, apatite, and sphene, which are mainly found in granitic rocks.
  • For most of the rock samples examined, the indicators of radiological hazards are within the permissible level range, which indicates the recommendation for use as a building material. On the other hand, some samples have environmental levels higher than the international levels, which indicates that they are not suitable for use as building materials because of radioactive bearing minerals, such as uranophane and uranothorite.
  • It can be concluded that advanced statistical approaches are remarkable tools in addition to experimental methods, owing to their reliable outcomes.

Author Contributions

Conceptualization, H.A.A. and N.M.M.; methodology, H.M.H.Z.; software, S.A.M.I.; validation, H.O.T., A.R. and A.E.; formal analysis, A.R.; investigation, H.O.T. and S.A.M.I.; resources, N.M.M.; data curation, M.M.F. and A.M.E.-T.; writing—original draft preparation, H.M.H.Z.; H.A.A. and S.A.M.I.; writing—review and editing, N.M.M., A.E. and H.O.T.; visualization, M.M.F. and A.M.E.-T.; supervision, A.E.; project administration, H.M.H.Z. All authors have read and agreed to the published version of the manuscript.

Funding

The work of A.E. and the APC is funded by “Dunarea de Jos” University of Galati, Romania and grant no. RF 3621/2021.

Institutional Review Board Statement

Not applicable.

Informed Consent Statement

Not applicable.

Acknowledgments

The researchers (H.M.H.Z. and H.A.A.) are funded by a scholarship under the Joint Executive Program between Egypt and Russia.

Conflicts of Interest

The authors declare no conflict of interest.

References

  1. Ravisankar, R.; Sivakumar, S.; Chandrasekaran, A.; Prince Prakash Jebakumar, J.; Vijayalakshmi, I.; Vijayagopal, P.; Venkatraman, B. Spatial distribution of gamma radioactivity levels and radiological hazard indices in the East Coastal sediments of Tamilnadu, India with statistical approach. Radiat. Phys. Chem. 2014, 103, 89–98. [Google Scholar] [CrossRef]
  2. Ravisankar, R.; Vanasundari, K.; Suganya, M.; Raghu, Y.; Rajalakshmi, A.; Chandrasekaran, A.; Sivakumar, S.; Chandramohan, J.; Vijayagopal, P.; Venkatraman, B. Multivariate statistical analysis of radiological data of building materials used in tiruvannamalai, tamilnadu, india. Appl. Radiat. Isot. 2014, 85, 114–127. [Google Scholar] [CrossRef] [PubMed]
  3. Ercit, T.S. Identification and alteration trends of granitic-pegmatite-hosted (Y,REE,U,Th)-(Nb,Ta,Ti) oxide minerals: A statistical approach. Can. Mineral. 2005, 43, 1291–1303. [Google Scholar] [CrossRef] [Green Version]
  4. Issa, S.A.M.; Uosif, M.A.M.; Abd El-Salam, L.M. Natural radionuclide concentrations in granite rocks in Aswan and Central-Southern Eastern Desert, Egypt and their radiological implications. Radiat. Prot. Dosimetry 2012, 150, 488–495. [Google Scholar] [CrossRef] [PubMed]
  5. Powell, B.A.; Hughes, L.D.; Soreefan, A.M.; Falta, D.; Wall, M.; DeVol, T.A. Elevated concentrations of primordial radionuclides in sediments from the Reedy River and surrounding creeks in Simpsonville, South Carolina. J. Environ. Radioact. 2007, 94, 121–128. [Google Scholar] [CrossRef] [Green Version]
  6. Rimsaite, J. The leaching of radionuclides and other ions during alteration and replacement of accessory minerals in radioactive rocks. Pap. Geol. Surv. Can. 1982, 82, 253–266. [Google Scholar]
  7. Anjos, R.M.; Veiga, R.; Soares, T.; Santos, A.M.A.; Aguiar, J.G.; Frascá, M.H.B.O.; Brage, J.A.P.; Uzêda, D.; Mangia, L.; Facure, A.; et al. Natural radionuclide distribution in Brazilian commercial granites. Radiat. Meas. 2005, 39, 245–253. [Google Scholar] [CrossRef]
  8. Örgün, Y.; Altinsoy, N.; Gültekin, A.H.; Karahan, G.; Çelebi, N. Natural radioactivity levels in granitic plutons and groundwaters in Southeast part of Eskisehir, Turkey. Appl. Radiat. Isot. 2005, 63, 267–275. [Google Scholar] [CrossRef]
  9. Tzortzis, M.; Tsertos, H.; Christofides, S.; Christodoulides, G. Gamma radiation measurements and dose rates in commercially-used natural tiling rocks (granites). J. Environ. Radioact. 2003, 70, 223–235. [Google Scholar] [CrossRef] [Green Version]
  10. Norvegica, E.S.-P. Undefined Some Aspects on Radioactivity of Building Materials. Phys. Norv. 1976, 8, 163–167. Available online: https://inis.iaea.org/collection/NCLCollectionStore/_Public/11/546/11546783.pdf#page=56 (accessed on 23 February 2022).
  11. Lee, E.M.; Menezes, G.; Finch, E.C. Natural radioactivity in building materials in the Republic of Ireland. Health Phys. 2004, 86, 378–383. [Google Scholar] [CrossRef] [PubMed]
  12. Papadopoulos, A.; Christofides, G.; Koroneos, A.; Stoulos, S.; Papastefanou, C. Natural radioactivity and dose assessment of granitic rocks from the Atticocycladic Zone (Greece). Period. Mineral. 2012, 81, 301–311. [Google Scholar] [CrossRef]
  13. Jaupart, C.; Mareschal, J.C.; Bouquerel, H.; Phaneuf, C. The building and stabilization of an Archean Craton in the Superior Province, Canada, from a heat flow perspective. J. Geophys. Res. Solid Earth 2014, 119, 9130–9155. [Google Scholar] [CrossRef]
  14. da Costa, F.P.; Fernandes, J.V.; de Melo, L.R.L.; Rodrigues, A.M.; Menezes, R.R.; Neves, G.D.A. The Potential for Natural Stones from Northeastern Brazil to Be Used in Civil Construction. Minerals 2021, 11, 440. [Google Scholar] [CrossRef]
  15. Awad, H.A.; Zakaly, H.M.H.; Nastavkin, A.V.; El-Taher, A. Radioactive content in the investigated granites by geochemical analyses and radiophysical methods around Um Taghir, Central Eastern Desert, Egypt. J. Phys. Conf. Ser. 2020, 1582, 12007. [Google Scholar] [CrossRef]
  16. Tene, T.; Vacacela Gomez, C.; Tubon Usca, G.; Suquillo, B.; Bellucci, S. Measurement of radon exhalation rate from building materials: The case of Highland Region of Ecuador. Constr. Build. Mater. 2021, 293, 123282. [Google Scholar] [CrossRef]
  17. Moghazy, N.M.; El-Tohamy, A.M.; Fawzy, M.M.; Awad, H.A.; Zakaly, H.M.H.; Issa, S.A.M.; Ene, A. Natural radioactivity, radiological hazard and petrographical studies on aswan granites used as building materials in Egypt. Appl. Sci. 2021, 11, 6471. [Google Scholar] [CrossRef]
  18. Papadopoulos, A.; Christofides, G.; Koroneos, A.; Papadopoulou, L.; Papastefanou, C.; Stoulos, S. Natural radioactivity and radiation index of the major plutonic bodies in Greece. J. Environ. Radioact. 2013, 124, 227–238. [Google Scholar] [CrossRef]
  19. Malczewski, D.; Teper, L.; Dorda, J. Assessment of natural and anthropogenic radioactivity levels in rocks and soils in the environs of Swieradow Zdroj in Sudetes, Poland, by in situ gamma-ray spectrometry. J. Environ. Radioact. 2004, 73, 233–245. [Google Scholar] [CrossRef]
  20. Said, A.F.; Salam, A.M.; Hassan, S.F.; Mohamed, W.S. EG1100465 Assessment of the Environmental Radioactivity Impacts and Health Hazards Indices at Wadi Sahu Area, Sinai, Egypt. In Proceedings of the Tenth Radiation Physics and Protection Conference, Cairo, Egypt, 27–30 November 2010; pp. 27–30. [Google Scholar]
  21. Zakaly, H.M.H.; Uosif, M.A.M.; Issa, S.A.M.; Tekin, H.O.; Madkour, H.; Tammam, M.; El-Taher, A.; Alharshan, G.A.; Mostafa, M.Y.A. An extended assessment of natural radioactivity in the sediments of the mid-region of the Egyptian Red Sea coast. Mar. Pollut. Bull. 2021, 171, 112658. [Google Scholar] [CrossRef]
  22. Zakaly, H.M.; Uosif, M.A.; Madkour, H.; Tammam, M.; Issa, S.; Elsaman, R.; El-Taher, A. Assessment of natural radionuclides and heavy metal concentrations in marine sediments in view of tourism activities in Hurghada city, northern Red Sea, Egypt. J. Phys. Sci. 2019, 30, 21–47. [Google Scholar] [CrossRef]
  23. Beretka, J.; Mathew, P.J. Natural radioactivity of australian building materials, industrial wastes and by-products. Health Phys. 1985, 48, 87–95. [Google Scholar] [CrossRef] [PubMed]
  24. Yang, J.K.; Kim, W.S.; Park, H.H. Chemical bonding states and energy band gap of SiO2-incorporated La2O3 films on n-GaAs (001). Thin Solid Film. 2006, 494, 311–314. [Google Scholar] [CrossRef]
  25. UNSCEAR. Sources and Effects of Ionizing Radiation, United Nations Scientific Committee on the Effects of Atomic Radiation UNSCEAR 2000 Report to the General Assembly, with Scientific Annexes; UNSCEAR: New York, NY, USA, 2000; ISBN 92-1-142238-8. [Google Scholar]
  26. Hamzah, Z.; Saat, A.; Hayati Mashuri, N.; Datul Redzuan, S. Surface radiation dose and radionuclide measurement in ex-tin mining area, Kg Gajah, Perak. Malays. J. Anal. Sci. 2008, 12, 419–431. [Google Scholar]
  27. Nada, A. Evaluation of Natural Radionuclides at Um-Greifat Area, Eastern Desert of Egypt. Appl. Radiat. Isot. 2003, 58, 275–280. [Google Scholar] [CrossRef]
  28. European Commission (EC). Radiological protection principles concerning the natural radioactivity of building materials—Radiation Protection. Eur. Comm. 1999, 112, 1–16. [Google Scholar]
  29. ICRP Publication 60: 1990 Recommendations of the International Commission on Radiological Protection; ICRP: Stockholm, Sweden, 1991; ISBN 0080411444.
  30. Tawfic, A.F.; Zakaly, H.M.H.; Awad, H.A.; Tantawy, H.R.; Abbasi, A.; Abed, N.S.; Mostafa, M. Natural radioactivity levels and radiological implications in the high natural radiation area of Wadi El Reddah, Egypt. J. Radioanal. Nucl. Chem. 2021, 327, 643–652. [Google Scholar] [CrossRef]
  31. Abed, N.S.; Monsif, M.A.; Zakaly, H.M.H.; Awad, H.A.; Hessien, M.M.; Yap, C.K. Assessing the Radiological Risks Associated with High Natural Radioactivity of Microgranitic Rocks: A Case Study in a Northeastern Desert of Egypt. Int. J. Environ. Res. Public Health 2022, 19, 473. [Google Scholar] [CrossRef]
  32. Xinwei, L. Natural radioactivity in some building materials and by-products of Shaanxi, China. J. Radioanal. Nucl. Chem. 2005, 262, 775–777. [Google Scholar] [CrossRef]
  33. El-Taher, A. Determination of chromium and trace elements in El-Rubshi chromite from Eastern Desert, Egypt by neutron activation analysis. Appl. Radiat. Isot. 2010, 68, 1864–1868. [Google Scholar] [CrossRef]
  34. El-Taher, A.; Zakaly, H.M.H.; Elsaman, R. Environmental implications and spatial distribution of natural radionuclides and heavy metals in sediments from four harbours in the Egyptian Red Sea coast. Appl. Radiat. Isot. 2018, 131, 13–22. [Google Scholar] [CrossRef] [PubMed]
  35. Heinrich, E.W. Mineralogy and Geology of Radioactive Raw Materials; McGraw-Hill Book Company: New York, NY, USA, 1958. [Google Scholar]
  36. Holland, H.D.; Gottfried, D. The effect of nuclear radiation on the structure of zircon. Acta Crystallogr. 1955, 8, 291–300. [Google Scholar] [CrossRef]
  37. Headley, J.V.; Mason, R.S.; Jennings, K.R. Kinetics, equilibria and diffusion of ions produced in N2, CO and CO2, studied as a function of temperature using a high-pressure pulsed mass spectrometer source. J. Chem. Soc. Faraday Trans. 1 Phys. Chem. Condens. Phases 1982, 78, 933–945. [Google Scholar] [CrossRef]
Figure 1. Contribution of 238U, 232Th, and 40K radionuclides for the absorbed dose rate within the studied rock samples.
Sustainability 14 03553 g001aSustainability 14 03553 g001b
Figure 2. Effective dose rate to different body organs and tissues—Dorgan for both (a) outdoors (20% of the time) and (b) indoors (80% of the time).
Sustainability 14 03553 g002aSustainability 14 03553 g002b
Figure 3. EDX and BSE images showing radioactive minerals. (a,b) Uranophane, (c,d) Uranothorite.
Sustainability 14 03553 g003
Figure 4. EDX and BSE images showing accessory minerals. (a) Zircon; (b,c) Xenotime; (d) Aeschynite; (e) Columbite; (f) Cassiterite; (g) Apatite; (h) Sphene; (i) Chalcoyprite.
Sustainability 14 03553 g004aSustainability 14 03553 g004bSustainability 14 03553 g004c
Table 1. Kruskal–Wallis Test for (232Th/238U, K-40, Ra-226, Th-232, U-238).
Sig. (p-Value)Test StatisticsMean Rank
0.00115.598232Th/238UK-40Ra-226Th-232U-238
15.2813158.768475.97
Table 2. Mann–Whitney Test for (232Th/238U, K-40, Ra-226, Th-232, U-238).
Sig. (p-Value)Test Statistics (Z)Mean Rank
0.272−1.098Th-232U-238
31.9327.07
0.015−2.442Ra-226U-238
24.1034.90
0.000−6.547K-40U-238
4415
0.000−6.548232Th/238UU-238
1544
0.000−3.937Ra-226Th-232
20.7938.21
0.000−6.541K-40Th-232
4415
0.000−6.480232Th/238UTh-232
15.1443.86
0.000−6.554K-40Ra-226
4415
0.000−6.493232Th/238URa-226
15.1443.86
0.000−6.541232Th/238UK-40
1544
Table 3. Pearson correlation for U-238, Th-232, Ra-226, K-40 and 232Th/238U.
Sig (2-Tailed)232Th/238UU-238Th-232Ra-226K-40
232Th/238U1−0.635 **0.421 *−0.2300.407 *
U-238−0.635 **10.280.724 **0.050
Th-2320.421 *0.02810.3620.686 **
Ra-226−0.2300.724 **0.36210.268
K-400.407 *0.0500.686 **0.2681
** Correlation is significant at 0.01 and * correlation is significant at 0.05.
Table 4. Mean, Std. Deviation, Variance, Skewness, Kurtosis, Minimum and Maximum for U-238, Th-232, Ra-226, K-40 and 232Th/238U.
U-238Th-232Ra-226K-40232Th/238U
N2929292929
Mean52.1757.8231.171055.671.87
Std. Deviation39.5926.9019.09292.081.64
Variance1567.66723.69364.3985,309.232.68
Skewness1.10−0.0790.93−1.281.38
Kurtosis0.29−0.581.312.061.52
Table 5. Equivalent radium—Raeq, absorbed gamma dose rate—DR, annual effective dose rate—AEDR, internal and external hazard indices—Hin, Hex, external (γ-radioactivity) level index—Iγ, activity utilization index—I, and excess lifetime cancer risk—ELCR for the studied granite samples.
ActivityRadium Equivalent (Raeq)Absorbed Dose Rate (DR)Annual Effective Dose Equivalent (AEDE) (μSvy−1)Hazard Indices (Hex and Hin)Gamma Index (Iγ)Activity Utilization Index (I)Excess Lifetime Cancer Risk (ELCR)Annual Gonadal Equivalent (AGDE)
Sample No:(Bq/kg)(nGy/h)(Outdoor)(Indoor)HexHin(Iγ)(I)(ELCR)(μSvy−1)
BA1186.0189.81110.14440.560.500.640.623.91385.49649.37
BA2120.4958.1871.35285.390.330.360.402.50249.72425.53
BA3310.49145.23178.11712.430.840.971.055.96623.381043.04
BA4155.5674.0690.83363.320.420.490.523.13317.90536.23
BA5171.2980.5298.75395.000.460.530.583.33345.62580.26
GS1184.0387.53107.35429.400.500.530.623.66375.73637.69
GS2180.5485.39104.72418.890.490.650.613.62366.53608.19
GS3277.23128.56157.67630.670.750.920.945.23551.84915.29
LR1259.78120.37147.63590.500.700.800.884.86516.69861.84
LR2246.67116.02142.28569.130.671.030.834.97497.99811.34
DR1192.2891.06111.67446.690.520.590.653.80390.85659.15
DR2272.39126.62155.29621.160.740.900.925.17543.52902.26
R1181.8687.42107.21428.860.490.560.613.74375.25636.74
R2220.22106.57130.70522.800.590.660.744.60457.45779.77
R3218.85105.38129.24516.940.590.720.734.55452.33763.18
G1234.63112.04137.41549.630.630.830.794.82480.93803.14
G2381.75178.13218.45873.821.031.431.297.43764.591256.14
G3285.26133.83164.13656.540.771.070.965.63574.47946.20
RA1277.21129.19158.44633.750.750.920.945.30554.53921.91
RA2204.7698.57120.89483.540.550.590.694.20423.10722.22
RA3218.09104.16127.74510.970.590.660.734.40447.10757.69
WH1244.10114.61140.56562.230.660.710.834.70491.95829.62
WH268.4033.1740.68162.730.180.280.231.49142.39235.63
WH340.1119.2123.5694.230.110.140.130.8382.45137.95
YV1228.73108.14132.62530.470.620.650.774.48464.16786.43
YV2198.9695.55117.19468.740.540.840.664.23410.15674.73
YV3165.7079.8797.95391.800.450.550.553.46342.82578.78
RN277.48132.65162.69650.750.751.080.935.77569.41942.49
F265.11125.07153.39613.560.720.920.895.26536.86893.89
Table 6. Results of T-Test for Raeq and Absorbed Dose.
Test Statistics (t)Degree of FreedomSample MeanSig (p-Value)
RaeqAbsorbed Dose
7.939 56216.137102.3070.000
Table 7. Kruskal–Wallis Test for AEDE_in, AEDE_out, ELCR, AGDE.
Sig. (p-Value)Test StatisticsMean Rank
0.00076.291AEDE_inAEDE_outELCRAGDE
66.4517.5556.4193.59
Table 8. Mann–Whitney Test for AEDE_in, AEDE_out, ELCR, AGDE.
Sig. (p-Value)Test Statistics (Z)Mean Rank
0.000−6.104AEDE_outAEDE_in
15.9743.03
0.065−1.843ELCRAEDE_in
25.4133.59
0.000−4.362AGDEAEDE_in
39.1719.83
0.000−5.995ELCRAEDE_out
42.7916.21
0.000−6.368AGDEAEDE_out
43.6215.38
0.000−5.093AGDEELCR
40.7918.21
Table 9. Kruskal–Wallis Test for Hazard_hin, Hazard_hex, Gamma_index, Activity_utiliz.
Sig. (p-Value)Test StatisticsMean Rank
0.00066.835Hazard_hinHazard_hexGamma_indexActivity_utiliz
48.2732.9850.19100.22
Table 10. Mann–Whitney Test for (Hazard_hin, Hazard_hex, Gamma_index, Activity_utiliz).
Sig. (p-Value)Test Statistics (Z)Mean Rank
0.030−2.172Hazard_hinHazard_hex
33.8624.31
0.836−0.208Hazard_hinGamma_index
28.5429.45
0.000−6.314Hazard_hinActivity_utiliz
14.8842.64
0.008−2.660Hazard_hexGamma_index
23.6035.40
0.000−6.509Hazard_hexActivity_utiliz
15.0743.93
0.000−6.385Gamma_indexActivity_utiliz
15.3443.66
Table 11. Pearson correlation for radiological measurements results.
Sig (2-Tailed)RaeqABD_DoseAEDE_InAEDE_OutHazard_HinHazard_HexGamma_IndexActivity_Utiliz.ELCRAGDE
Raeq10.999 **0.999 **0.999 **0.948 **1.000 **1.000 **0.994 **0.999 **0.998 **
Abd_dose0.999 **11.000 **1.000 **0.948 **0.999 **0.999 **0.997 **1.000 **0.999 **
AEDE_in0.999 **1.000 **11.000 **0.948 **0.999 **0.999 **0.997 **1.000 **0.999 **
AEDE_out0.999 **1.000 **1.000 **10.948 **0.999 **0.999 **0.997 **1.000 **0.999 **
Hazard_hin0.948 **0.948 **0.948 **0.948 **10.948 **0.946 **0.957 **0.948 **0.999 **
Hazard_hex1.000 **0.999 **0.999 **0.999 **0.948 **11.000 **0.993 **0.999 **0.936 **
Gamma_index1.000 **0.999 **0.999 **0.999 **0.946 **1.000 **10.992 **0.999 **0.997 **
Activity_utiliz.0.994 **0.997 **0.997 **0.997 **0.957 **0.993 **0.992 **10.997 **0.996 **
ELCR0.999 **1.000 **1.000 **1.000 **0.948 **0.999 **0.999 **0.997 **10.999 **
AGDE0.998 **0.999 **0.999 **0.999 **0.936 **0.998 **0.997 **0.996 **0.999 **1
** Correlation is significant at 0.01.
Publisher’s Note: MDPI stays neutral with regard to jurisdictional claims in published maps and institutional affiliations.

