Article

Multi-Criteria Assessment of the Economic and Environmental Sustainability Characteristics of Intermediate Wheatgrass Grown as a Dual-Purpose Grain and Forage Crop

1
School of Integrative Plant Science, Cornell University, Ithaca, NY 14850, USA
2
School of Environment and Natural Resources, The Ohio State University, Wooster, OH 44691, USA
3
Charles H. Dyson School of Applied Economics and Management, Cornell University, Ithaca, NY 14850, USA
*
Author to whom correspondence should be addressed.
Sustainability 2022, 14(6), 3548; https://doi.org/10.3390/su14063548
Submission received: 11 January 2022 / Revised: 28 February 2022 / Accepted: 1 March 2022 / Published: 17 March 2022
(This article belongs to the Section Sustainable Agriculture)

Abstract

:
Kernza® intermediate wheatgrass [IWG; Thinopyrum intermedium (Host) Barkworth & Dewey] is a novel perennial cool-season grass that is being bred for use as a dual-purpose grain and forage crop. The environmental benefits of perennial agriculture have motivated the development of IWG cropping systems and markets for perennial grain food products made with Kernza, but the economic viability and environmental impact of IWG remain uncertain. In this study, we compared three-year cycles of five organic grain production systems: an IWG monoculture, IWG intercropped with medium red clover, a continuous winter wheat monoculture, a wheat–red clover intercrop, and a corn–soybean–spelt rotation. Economic and environmental impacts of each cropping system were assessed using enterprise budgets, energy use, greenhouse gas (GHG) emissions, and emergy indices as indicators. Grain and biomass yields and values for production inputs used in these analyses were obtained from experimental data and management records from two separate field experiments conducted in New York State, USA. Grain yield of IWG averaged 478 kg ha−1 yr−1 over three years, equaling approximately 17% of winter wheat grain yield (2807 kg ha−1 yr−1) over the same period. In contrast, total forage harvested averaged 6438 kg ha−1 yr−1 from the IWG systems, approximately 160% that of the wheat systems (4024 kg ha−1 yr−1). Low grain yield of IWG greatly impacted economic indicators, with break-even farm gate prices for Kernza grain calculated to be 23% greater than the current price of organic winter wheat in New York. Energy use and GHG emissions from the IWG systems were similar to the annual systems when allocated per hectare of production area but were much greater when allocated per kg of grain produced and much lower when allocated per kg of biomass harvested inclusive of hay and straw. Emergy sustainability indices were favorable for the IWG systems due to lower estimated soil erosion and fewer external inputs over the three-year crop cycle. The results show that the sustainability of IWG production is highly dependent on how the hay or straw co-product is used and the extent to which external inputs can be substituted with locally available renewable resources. Integrated crop–livestock systems appear to be a viable scenario for the adoption of IWG as a dual-use perennial grain and forage crop.

1. Introduction

Ecological intensification of agriculture through the redesign of agroecosystems to replace external inputs (e.g., fertilizers and pesticides) with supporting and regulating ecosystem services has been proposed as a solution to the entwined challenges of providing food security for the growing human population while simultaneously protecting natural capital and adapting to climate change [1,2]. Increasing the amount of perennial crops in agroecosystems can enhance many ecosystem services, including diversification of crop products and associated revenue streams, improved soil, air, and water quality, enhanced wildlife habitat, and increased resilience to climate change and extreme weather events [3]. Perennial grains have especially been touted as environmentally sustainable alternatives to annual grain crops such as wheat, barley, rye, and rice that represent greater than 70% of global food production [4,5]. Research on perennial grains has emphasized breeding and agronomic management, however, and many perceived or potential environmental and economic benefits of perennial grain cropping systems have yet to be rigorously documented. Tradeoffs have been documented between perennial crop productivity, longevity, and water-use efficiency [6,7] and it is possible that other substantial tradeoffs exist between different components of economic and environmental sustainability for perennial grains.
Intermediate wheatgrass [Thinopyrum intermedium (Host) Barkworth & Dewey; hereafter IWG] is a rhizomatous, cool-season perennial grass introduced to North America for use in pastures and forage production [8]. Varieties of IWG selected for grain yield are being developed using traditional and genomic breeding techniques, with rapid advancement in many agronomic traits [9,10]. Concurrently, field trials are providing information on IWG physiology and grain yield potential, crop and cropping systems management, and ecosystem services provided by IWG grown as a perennial grain [11,12,13,14,15,16,17]. As of 2019, the commercial production of IWG grain, sold under the trademarked brand ‘Kernza’, has begun in Midwestern states and broader efforts to build market infrastructure are underway [18]. Throughout this paper IWG is used to refer to the crop plant, while Kernza refers to grain from specific IWG cultivars derived from The Land Institute’s breeding program and sold under the Kernza trademark.
The perennial nature of IWG increases both the number of functions that the crop can provide in an agroecosystem and the management complexity of the system [19]. Much of the demand for Kernza grain has focused on organic production [20], partly because of the organic certification’s alignment with the other environmental sustainability attributes of the crop but also because there are currently no pesticides registered for use in Kernza production [21]. Managing IWG crops for dual-purpose production of both grain and forage has been identified as a way to reduce the economic disadvantage of low IWG grain yields relative to annual small grain crops [22]. Management strategies can also prioritize the enhancement of other agroecosystem functions, such as soil health regeneration, nitrogen fixation, or pest suppression, by rotating IWG with annual crops, strategically locating IWG stands in areas prone to soil erosion and runoff, or growing IWG in polyculture with forage legumes [23,24]. Red clover (Trifolium pratense L.) is frequently interseeded with annual small grains in organic cropping rotations in the Northeastern United States to provide nitrogen fixation, microclimate regulation, and weed suppression [25,26], and IWG–red clover intercrops have been found to produce more and higher quality forage than IWG monocultures [27].
Multi-criteria assessment is a useful tool for developing management strategies and tactics in agricultural systems where maximizing crop yield or profitability is not the sole management objective [28,29,30]. Trends in cereal grain production, including the adoption of alternative crops and diversified cropping systems, are driven by economic, social, and policy factors that influence risk management and perceived benefits to farmers [31]. Farmers’ reported motivations for growing perennial grain crops such as IWG include profitability, improved soil health and water quality, reduced reliance on purchased inputs, improved weed management, and the ability to graze livestock or produce forages [20,32]. Demand for Kernza grain for both small-scale artisan products (e.g., craft brewing, artisanal bakeries, and local restaurants) and large-scale consumer packaged goods (e.g., Cascadian Farms’ toasted Kernza flakes breakfast cereal) has been driven by the crop’s perceived environmental benefits [18]. Providing farmers with information on crop productivity benchmarks, possible market prices for Kernza grain, and the magnitude of environmental impacts of IWG cropping systems will allow them to make more informed decisions about the risks and benefits of adopting IWG as a grain crop. This information will also be useful for developing policy and financial incentives for perennial crop production that account for environmental impacts. In the context of these competing motivations for IWG production, multi-criteria assessment of the agronomic, economic, and environmental characteristics of the crop will facilitate the development of management recommendations, supply chains, and markets.
While assessing the effects of management decisions on agronomic productivity, that is, grain and forage yields, is a critical step in the development and adoption of IWG cropping systems, it is also important to consider the impact on other indicators of sustainability, such as profitability, energy use, and greenhouse gas (GHG) emissions. Enterprise budgets and sensitivity analysis are commonly used tools for assessing the impact of farm management alternatives on profitability, allowing for the efficient allocation of resources to achieve economic objectives [33]. Energy analysis evaluates a production system’s energy efficiency by accounting for the direct (e.g., fuels and electricity used on-farm) and indirect (e.g., energy used in the production and transportation of crop seed, fertilizers, and other inputs) sources of energy used to generate crop products [34]. The quantification of GHG emissions is often included in energy analyses due to the impact of fossil fuel consumption on global climate change [35]. Emergy evaluation is an environmental accounting system that compares the sustainability of production systems based on the embodied energy contained in inputs and thus contributed to the production of goods and services by the system [36]. The emergy method goes even further than energy analysis in accounting for indirect sources of energy by quantifying both the economic and environmental inputs to a production system, thereby emphasizing environmental impacts and the externalities that arise from overreliance on economic indicators [37]. By assessing IWG relative to other annual cropping systems using the various indicators that are generated by these multiple analyses, a more holistic view of the potential benefits and drawbacks of IWG production can be developed.
The objective of this study was to perform a multi-criteria assessment of the agronomic productivity, economic profitability, and environmental sustainability of IWG grown for dual-use grain and forage production under organic management. The effects of intercropping medium red clover with IWG and annual winter wheat on crop productivity were measured in a field experiment conducted in the Finger Lakes region of New York State, USA. Empirical data from this experiment comparing IWG and wheat production systems and a separate field experiment on organic grain crop rotations conducted in the same region were also used to compare IWG to continuous winter wheat and corn–soybean–spelt cropping systems, using several indicators of economic and environmental sustainability. Enterprise budgets were created to estimate production costs and revenues based on management records from the two field experiments and aggregate data on crop and input prices from the US Department of Agriculture and other sources. Due to a lack of reliable prices for IWG grain (i.e., Kernza) as market infrastructure develops, the economic indicators assessed were break-even prices for IWG grain, after accounting for all production costs and revenue from hay or straw sales, and grain prices that would allow the net present value (NPV) of the IWG cropping system to match that of the annual grain cropping systems. Environmental impact was assessed using the Farm Energy Analysis Tool to estimate farm energy use and greenhouse gas emissions from each cropping system and using the emergy method to calculate indicators of whole-system sustainability. This work represents the first time that these methods have been used to integrate multiple indicators of the economic and environmental sustainability of IWG production.

2. Materials and Methods

The agronomic, economic, and environmental indicators reported in this study were all calculated from empirical data from two separate field experiments. Break-even prices for Kernza grain, energy use, GHG emissions, and whole-system sustainability indicators were calculated in Microsoft Excel (Microsoft Corporation, Redmond, WA, USA) using enterprise budgets, the Farm Energy Analysis Tool, and the emergy methods as described in detail below. This approach has both advantages and disadvantages. All the indicators reported represent static values that allow for robust, but relative, comparisons between the cropping systems that were evaluated in the context of the economic and agronomic conditions when and where the field experiments were conducted. This may limit the comparability of the results reported in this paper with indicators of sustainability calculated for different cropping systems, under different conditions, or using different methods. This approach has the advantage, however, of providing multiple metrics that highlight the relative strengths and weaknesses of IWG production systems relative to the annual grain cropping systems grown in the region.
Both field experiments were conducted at the Cornell Musgrave Research Farm, Aurora, New York, USA (42.7222 N, 76.6636 W). The soil types at the site are Honeoye and Lima series silt loams with average pH of 7.5 and 3.2% organic matter. Mean annual temperature was 9.1 °C and mean annual precipitation was 918 mm based on the 1981–2010 NOAA 30-year climate averages for this site [38].

2.1. IWG and Wheat Systems

The main experiment informing the analyses in this paper was conducted between 2016 and 2019 to compare perennial and annual small grain cropping systems. Annual temperature was higher than the 30-year average, and precipitation varied during the experiment, with substantial droughts occurring in 2016 and 2018 (Figure 1). The experiment was a split-plot randomized complete block design with four blocks. Main plot treatments were Kernza IWG and hard red winter wheat (cv ‘Warthog’). IWG seed was obtained from a breeding population after the third cycle of selection for increased seed size and yield per plant [10]. Split-plot treatments were interseeded medium red clover and a no-clover control.
Field operations included primary and secondary tillage, fertilizer application, planting, harvesting, and post-harvest straw management for all plots (Table 1). Seedbed preparation for the experiment included moldboard plowing followed by disking and cultipacking. A false seedbed was used to manage weeds prior to crop seeding by allowing two weeks for weeds to germinate between primary tillage on August 16 and secondary tillage, fertilization, and seeding operations on 30 and 31 August. Both grain crops were planted on 31 August 2016 using a John Deere 1590 grain drill (John Deere US, Moline, IL, USA) with 19 cm row spacing. The seeding rate for IWG was 16.8 kg ha−1, and seeding depth was 1.25 cm, whereas the seeding rate for wheat was 107.6 kg ha−1, and seeding depth was 2.5 cm. Red clover seed was frost-seeded in March of 2017 by broadcasting into subplots of both the IWG and wheat treatments at a seeding rate of 22.4 kg ha−1.
Soil and crops were managed organically according to the USDA National Organic Program regulations; however, the field was not certified organic. All purchased seed was certified organic, approved fertilizers were utilized, and no prohibited inputs were applied. Composted chicken manure (5-4-3, Kreher Family Farms, Clarence, NY, USA) was broadcast at a rate of 900 kg ha−1 in both autumn and spring of each year, with the goal of applying 90 kg N ha−1 annually to approximate agronomically optimum N rates for IWG [14]. Grain was harvested immediately after quadrat sampling each year (details below), and crop residues above 10 cm in height were flail chopped and removed one to two weeks after grain harvest of each crop. In 2017 and 2018, wheat was re-planted in the same plots in mid-September. Continuous winter wheat crops are not typically grown commercially in New York, but this simplified annual small grain cropping system was selected to evaluate the effects of continuous cropping and to standardize the comparison with the perennial IWG system. Seedbed preparation for replanting was the same as in 2016. Red clover was reseeded in both the IWG and wheat plots in March 2018 but was only reseeded in wheat plots in March 2019 due to vigorous clover growth in IWG plots in 2018.
Agronomic data were collected from the IWG and wheat experiment in 2017, 2018, and 2019. Two 0.5 m2 quadrats were sampled in each subplot at crop maturity, which varied by grain crop. Plot edges were avoided. Within each quadrat all crop plants were clipped at the soil surface and separated into seedheads and stems. All clover plants larger than 2.5 cm in diameter or height were also harvested at the same time as the crop harvest. Biomass from the two quadrats per subplot was then combined into a single sample representing 1 m2 of area. Biomass samples were dried for at least five days at 65 °C before weighing. Seedheads were weighed intact, threshed, and dehulled using a hand deawner/debearder (Hoffman Manufacturing Inc., Corvallis, OR, USA) and reweighed as naked seed. All IWG and wheat yield estimates were normalized to a 13.5% moisture content. For more detail on the management and agronomic data collection for the experiment comparing IWG and wheat, see Law et al. [15].

2.2. Corn–Soybean–Wheat Cropping System

Data from a separate, earlier field experiment described by Caldwell et al. [39] were used to create enterprise budgets and perform sustainability analyses for a corn–soybean–spelt cropping system that is representative of systems commonly used by organic cash grain farmers in upstate New York. This experiment was initiated in 2005; however, the crop management and productivity data used in this study were collected between 2008 and 2010, representing the first full corn–soybean–spelt rotations after the three-year organic transition period. Field operations included annual primary and secondary tillage for seedbed preparation, planting, one to three tine weedings and one to four cultivations per year, fertilizer applications in the corn and spelt years, harvesting, and mowing of crop residues. Crops were harvested with a combine (Case IH 1644, Grand Island, NE, USA) that recorded weight and percent moisture of the grain for each plot. Grain yields were standardized to 15% moisture for corn and 13% moisture for soybean and spelt. The data reported here are from the ‘High Fertility’ treatment that applied 2 Mg ha−1 poultry manure in addition to incorporation of a red clover green manure before a corn and variable application of compost and commercial organic fertilizers to meet recommended rates for soybean and spelt based on measured soil nutrient availability. This system represented the typical organic fertility management practices for corn used by local farmers at the time these data were collected. For more detailed information on management practices and data collected in this experiment, see Caldwell et al. [39].

2.3. System Boundaries, Assumptions, and Input Definitions

All five cropping systems (IWG monoculture, IWG–red clover intercrop, winter wheat monoculture, wheat–red clover intercrop, and corn–soybean–spelt rotation) were evaluated using a cradle-to-farm gate boundary. The analyses assume that on-farm processing was limited to grain drying and hay baling, and all crops were sold as commodities and transported by the buyer. Inputs to cropping systems included grain crop and clover seed, poultry litter, diesel fuel, machinery, labor used for field operations, energy used for grain drying, land, and natural resources (soil, sun, wind, and rain) necessary for crop production. Values for these inputs were calculated using management logs from each of the two experiments, except for frost-seeding of red clover and spring fertilizer applications, which were carried out by hand for individual plots in the experiment but were calculated as if they had been performed with a drop or spinner spreader across a full field. Fuel consumption and labor hours used in enterprise budgets and emergy calculations are based directly on values recorded during field operations by the researchers, while values for these inputs used in the energy and GHG analyses were calculated using the Farm Energy Analysis Tool (FEAT) model [35]. Soil erosion was estimated to average 2.8 Mg ha−1 yr−1 for IWG and 6.7 Mg ha−1 yr−1 for the wheat and corn–soybean–spelt systems, based on values from Nearing et al. [40]. In all years for the annual systems and in the establishment year of IWG, erosion was estimated using 2012 values for cultivated cropland in the USA, while erosion for IWG in the years after establishment was estimated using values for Conservation Reserve Program land planted with perennial vegetation. Values for other farm infrastructure, management, and overhead were not included in the analyses. While the corn–soybean–spelt data were collected between 2008 and 2010, prices for inputs and crop sales for all systems were based on conditions between 2016 and 2019 when the IWG and wheat experiment was conducted to allow for equal comparisons between all systems.

2.4. Enterprise Budgets

Enterprise budgets were developed for all five cropping systems based on measured grain and straw yields and purchased inputs. All returns were calculated on an NPV basis with a 5% annual discount rate starting in 2017. An opportunity cost equal to 5% of the annual production costs was included to account for alternative uses of capital. Organic grain and hay prices were calculated using aggregate farm sales data from USDA National Agricultural Statistics Service reports [41]. Intermediate wheatgrass biomass at harvest was considered to be a fair quality hay based on typical forage quality of IWG from The Land Institute’s breeding program [27] and USDA Hay Quality Designation Guidelines. Wheat straw prices were obtained from weekly Pennsylvania hay auction reports [42]. Field operation costs were based on 2018 Ohio farm custom rates, which account for machinery, labor, and fuel costs [43]. Costs for wheat, corn, soybean, clover seed, and organic fertilizers represent typical prices paid by researchers and so may be conservative estimates relative to the costs to farmers who may receive discounts for bulk purchases. The price of registered Kernza IWG seed was obtained from colleagues at The Land Institute and is representative of cost to farmers. Land rental costs for New York were obtained from USDA survey data [44].
Several Kernza grain price estimates were calculated based on comparisons to the annual cropping systems and scenarios that varied IWG grain and forage yields or wheat grain and straw prices. Break-even Kernza grain prices were calculated by equating total revenues for grain and hay to total production costs. Comparisons were made to the wheat–clover and corn–soybean–spelt systems by varying the Kernza grain price to match the NPV of the IWG system to those systems. Sensitivity analysis of the effect of variation in IWG grain and forage yields on Kernza grain price was conducted using a range of crop production values from on-farm trials in New York and published agronomic research on IWG. This analysis used the NPV of the corn–soybean–spelt system, representing a likely alternative agricultural land use, as the benchmark for calculating Kernza grain price. Sensitivity analysis was also conducted on the influence of wheat grain and straw prices on the Kernza grain price required to match the NPV of the wheat–clover system. In this analysis, the IWG hay price was matched to hypothetical wheat straw prices to simulate high- and low-value markets for animal feeds.

2.5. Energy Use and Greenhouse Gas Emissions

Energy use and greenhouse gas emissions were estimated for each cropping system using the Farm Energy Analysis Tool, a database model implemented in MS Excel (FEAT; model available to download at https://www.ecologicalmodels.psu.edu/agroecology/feat/, accessed on 27 January 2022) [35]. The FEAT model has previously been used to evaluate the impacts of management decisions on organic grain and dairy production systems in the northeastern United States [34,45]. This analysis was conducted with a version that was parameterized to account for the recycling of animal wastes as fertilizers in organic cropping systems [34]. Production inputs and crop yields from the two field experiments were used to define the five cropping systems in the model. Direct energy use and GHG emissions were calculated for fuel and labor used in field operations, transportation of inputs to the farm, grain drying, and emissions from fertilizer applications and crop residue decomposition. Intergovernmental Panel on Climate Change Tier 1 methods were used to estimate N2O emissions [46]. Indirect sources of energy use and GHG emissions were calculated for the production of all material inputs, including seed, poultry litter, fuel, and farm machinery. In most cases, inputs were converted to energy and GHG emission values using default conversion factors included in the FEAT model that represent averages of values reported in the literature. Intermediate wheatgrass seed energy was based on measured values for forage grass seed [47]. Machinery weights, fuel use, and labor requirements for granular fertilizer application, broadcast seeding of red clover, and complete forage harvest were parameterized using information from extension publications cited in the original model [47,48,49]. Energy use and emissions were allocated to production using three methods: per hectare of cropland, per kg of harvested crop biomass, and per kg of grain yield. Different allocations allow the comparison of the different cropping systems while accounting for differences in crop yields and the impact of dual-use systems that produce both grain and hay or straw as co-products.

2.6. Emergy Evaluation

The whole-system sustainability of the five organic cropping systems was assessed using emergy evaluation, a method of accounting for the embodied energy utilized within a production system [36]. All inputs necessary for production were estimated based on management records for the two field experiments that included seeding and fertilizer rates, labor, machinery, and fuel required for field operations, estimated annual soil erosion rates, and values for solar radiation, precipitation, and wind observed at the research farm’s weather station (Figure 2). Inputs were converted from their observed unit values to solar emjoules (seJ), a standard unit of embodied energy, using unit emergy values reported in the emergy literature (see Supplemental Tables S11–S15 for calculations and sources of conversion factors). These emergy flows were each categorized as renewable local resources, non-renewable local resources, or non-renewable imported inputs. In the context of emergy evaluation, local indicates that a resource is obtained within the boundaries of the system being evaluated, in this case the research farm where the field experiments were conducted, while imported resources originate outside of the system. Renewable resources are freely available from the environment and are self-regenerating within the time scale of the evaluation. In this study, these included solar radiation, the chemical energy of rain, and the kinetic energy of wind. Non-renewable local resources are available from the local environment but do not regenerate within the time scale of the evaluation. In this study, soil erosion was the sole emergy flow within this category. Non-renewable imported resources, such as energy, goods, and services that are utilized in production, are obtained outside of the system. Imported resources are typically considered non-renewable because they represent feedbacks from the economy that are inherently limited [50].
Several emergy-based sustainability indicators were calculated based on these emergy flows (Table 2). Specific Emergy is a relative indicator of a system’s production efficiency as it represents the emergy expended to produce one unit of product, in this case grain and hay or straw. Lower specific emergy indicates a more efficient use of inputs and is useful in comparing systems that generate similar outputs, but it does not account for differences in the sustainability of inputs. Thus, systems that substitute purchased and non-renewable inputs for locally available renewable resources may have lower Specific Emergies for products but have a larger environmental impact. The Emergy Yield Ratio (EYR) is also a relative indicator of production efficiency that is comparable to the concept of energy return on investment, representing how efficiently a system is able to harvest local sources of emergy per unit of imported emergy [51]. The Environmental Loading Ratio (ELR) is the ratio of emergy flows from non-renewable and imported sources to the emergy flows from renewable resources. The ELR indicates the relative level of environmental stress that is created by a production system, accounting for the diffuse environmental impacts of the processes needed to supply inputs that may occur at a variety of spatiotemporal scales relative to the system [50]. An ELR greater than ten indicates a system that is highly dependent on flows of non-renewable emergy, while an ELR less than one indicates a system that is driven by locally available resources [52]. The Emergy Sustainability Index (ESI) is the ratio of EYR to ELR, indicating the economic contribution of a product per unit of environmental loading [50]. An ESI less than one indicates that a production system is a net-consumption process that is driven by non-renewable, typically imported, inputs, while an ESI greater than one indicates that a system contributes more emergy to the economy than it consumes [52].

2.7. Statistical Analysis

Statistical analysis of crop productivity indicators (i.e., yields) was conducted using linear mixed effects models in R statistical software version 4.1.0 [53]. Models were created for grain yield, vegetative crop biomass, and red clover biomass using the ‘lme4′ package [54], with crop species, intercrop, and year treated as fixed effects and block and main-plot treated as random effects to account for plot and split-plot randomization. Assumptions of normally distributed errors and homogeneity of variance were checked with Shapiro–Wilk and Levene’s tests, respectively. Grain yields, crop biomass, and clover biomass were log transformed to satisfy assumptions of normality. Treatment means reported for these variables represent back-transformed estimated marginal means, calculated with the ‘emmeans’ package [55]. Post-hoc comparisons of means were conducted using Tukey’s HSD as implemented in the ‘emmeans’ package. All statistical tests used α = 0.05 as the threshold for significant effects.

3. Results and Discussion

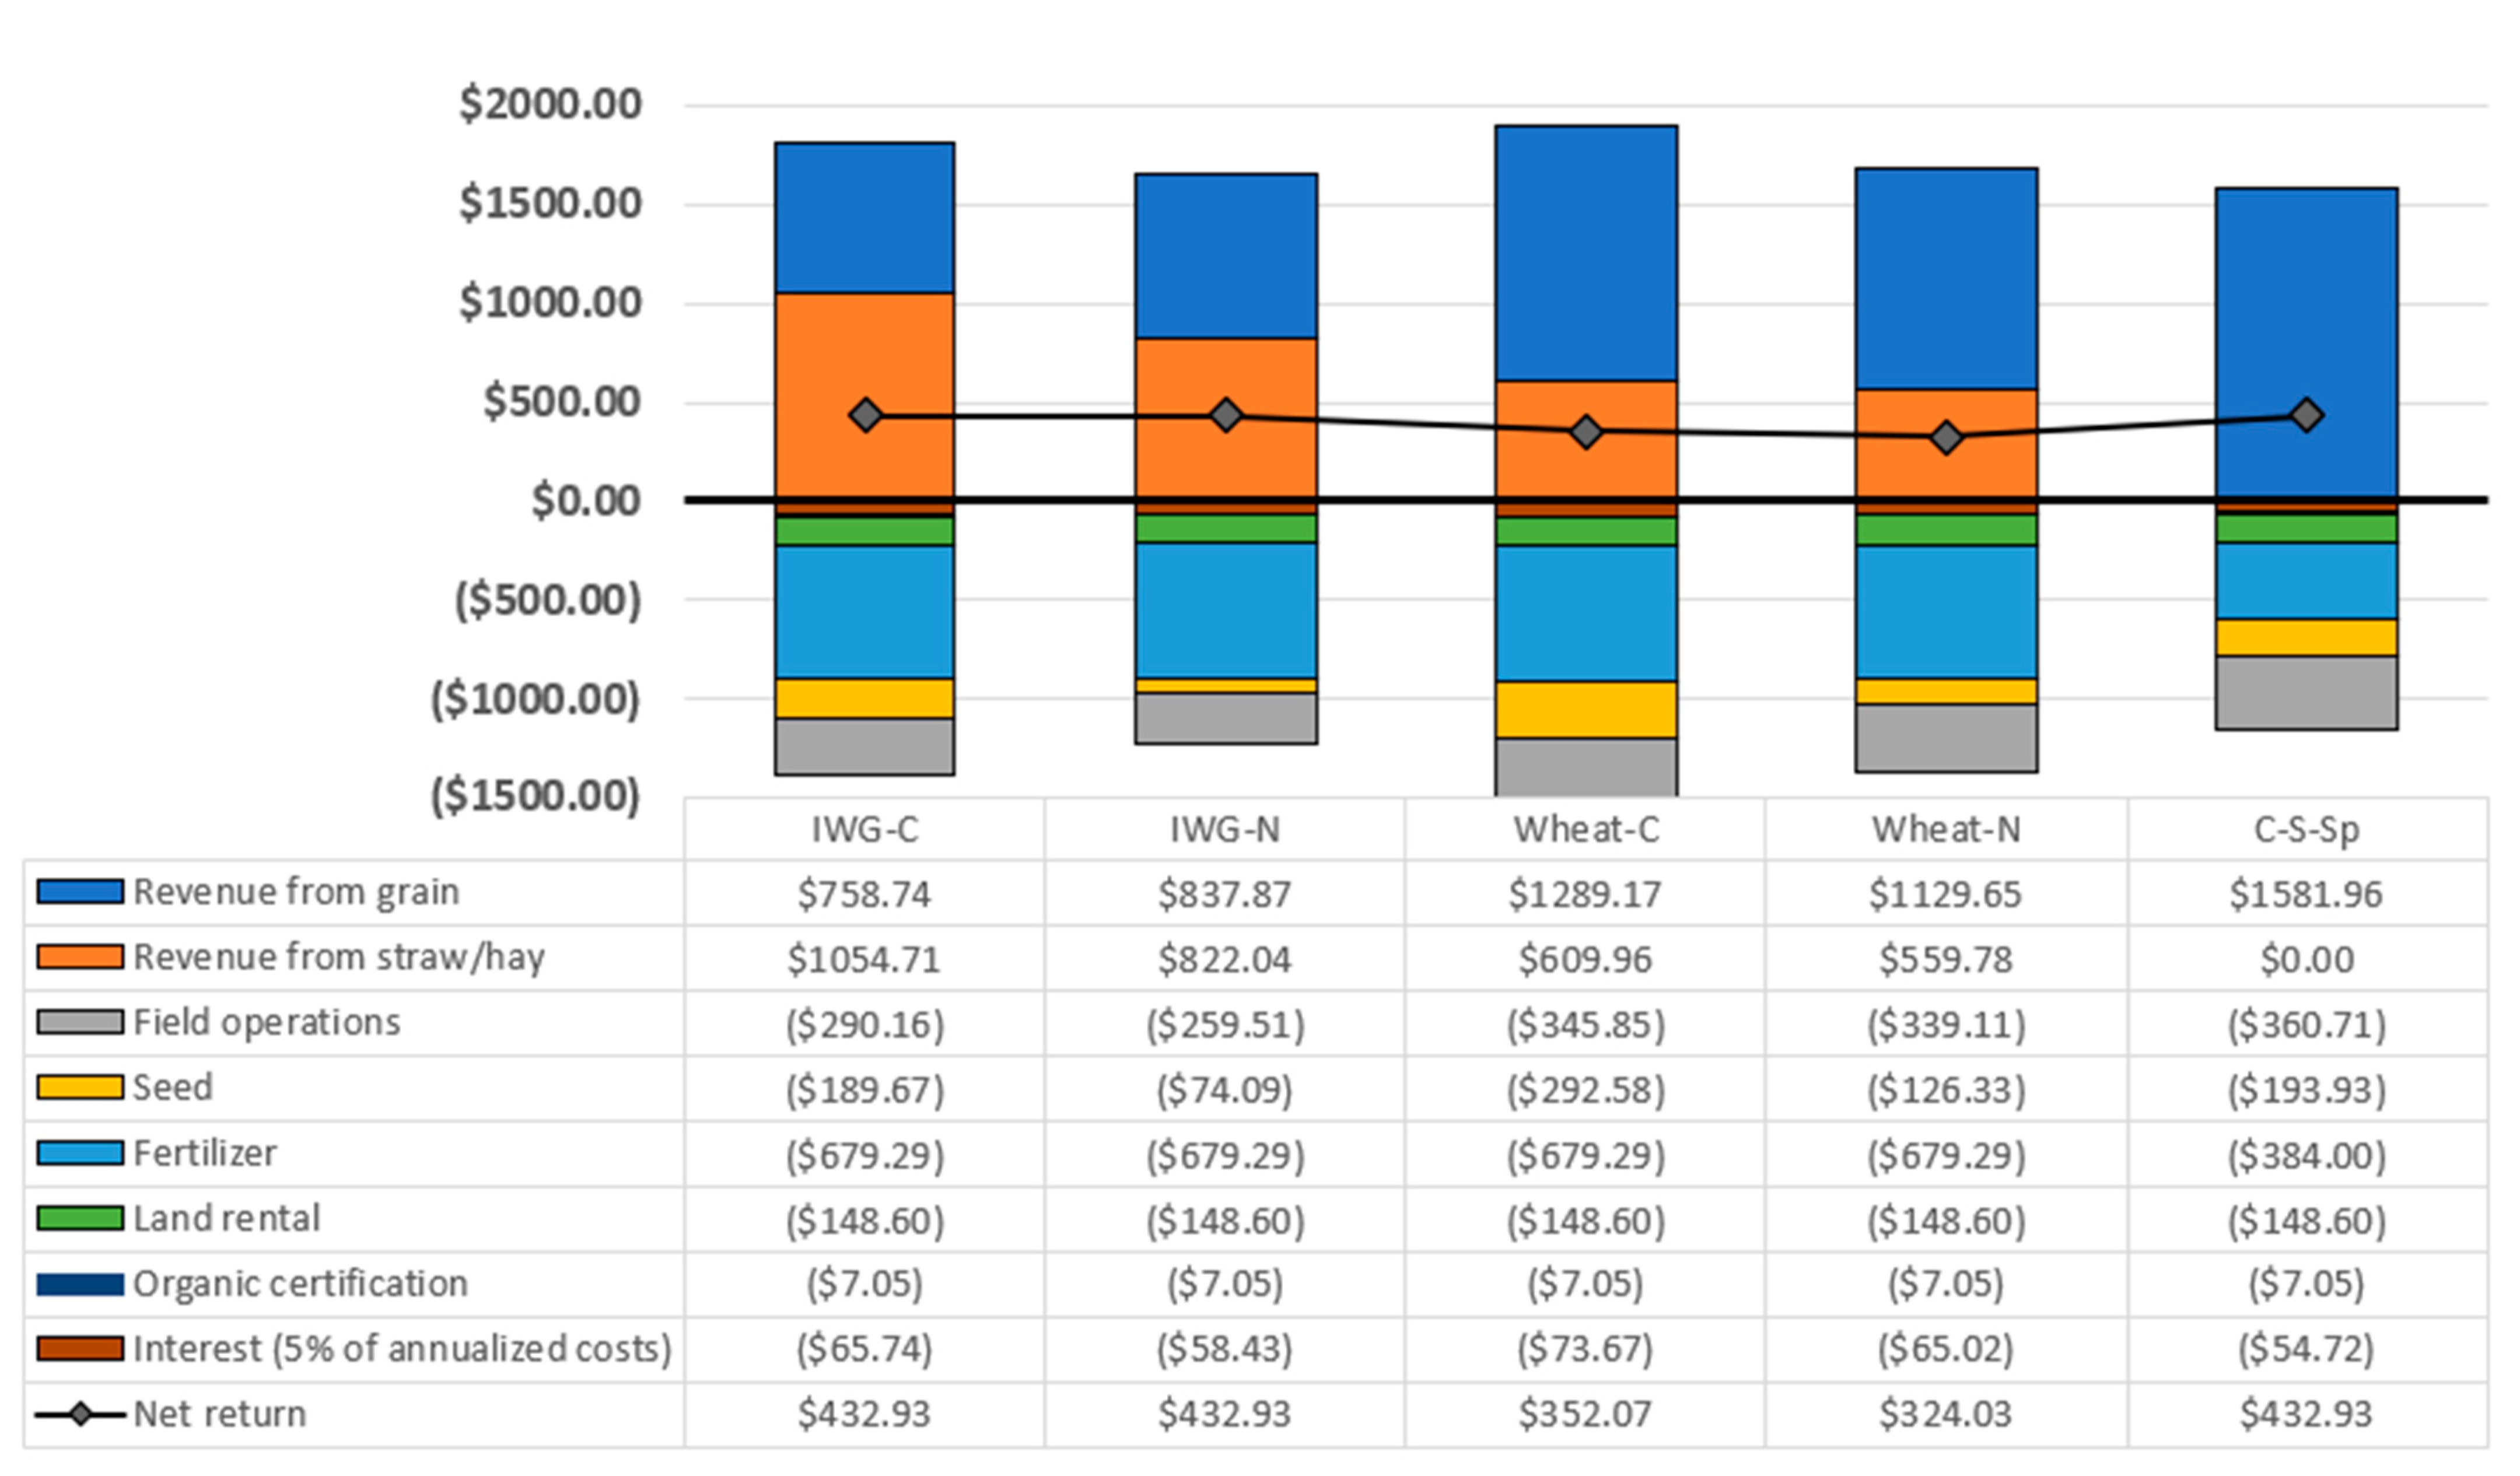
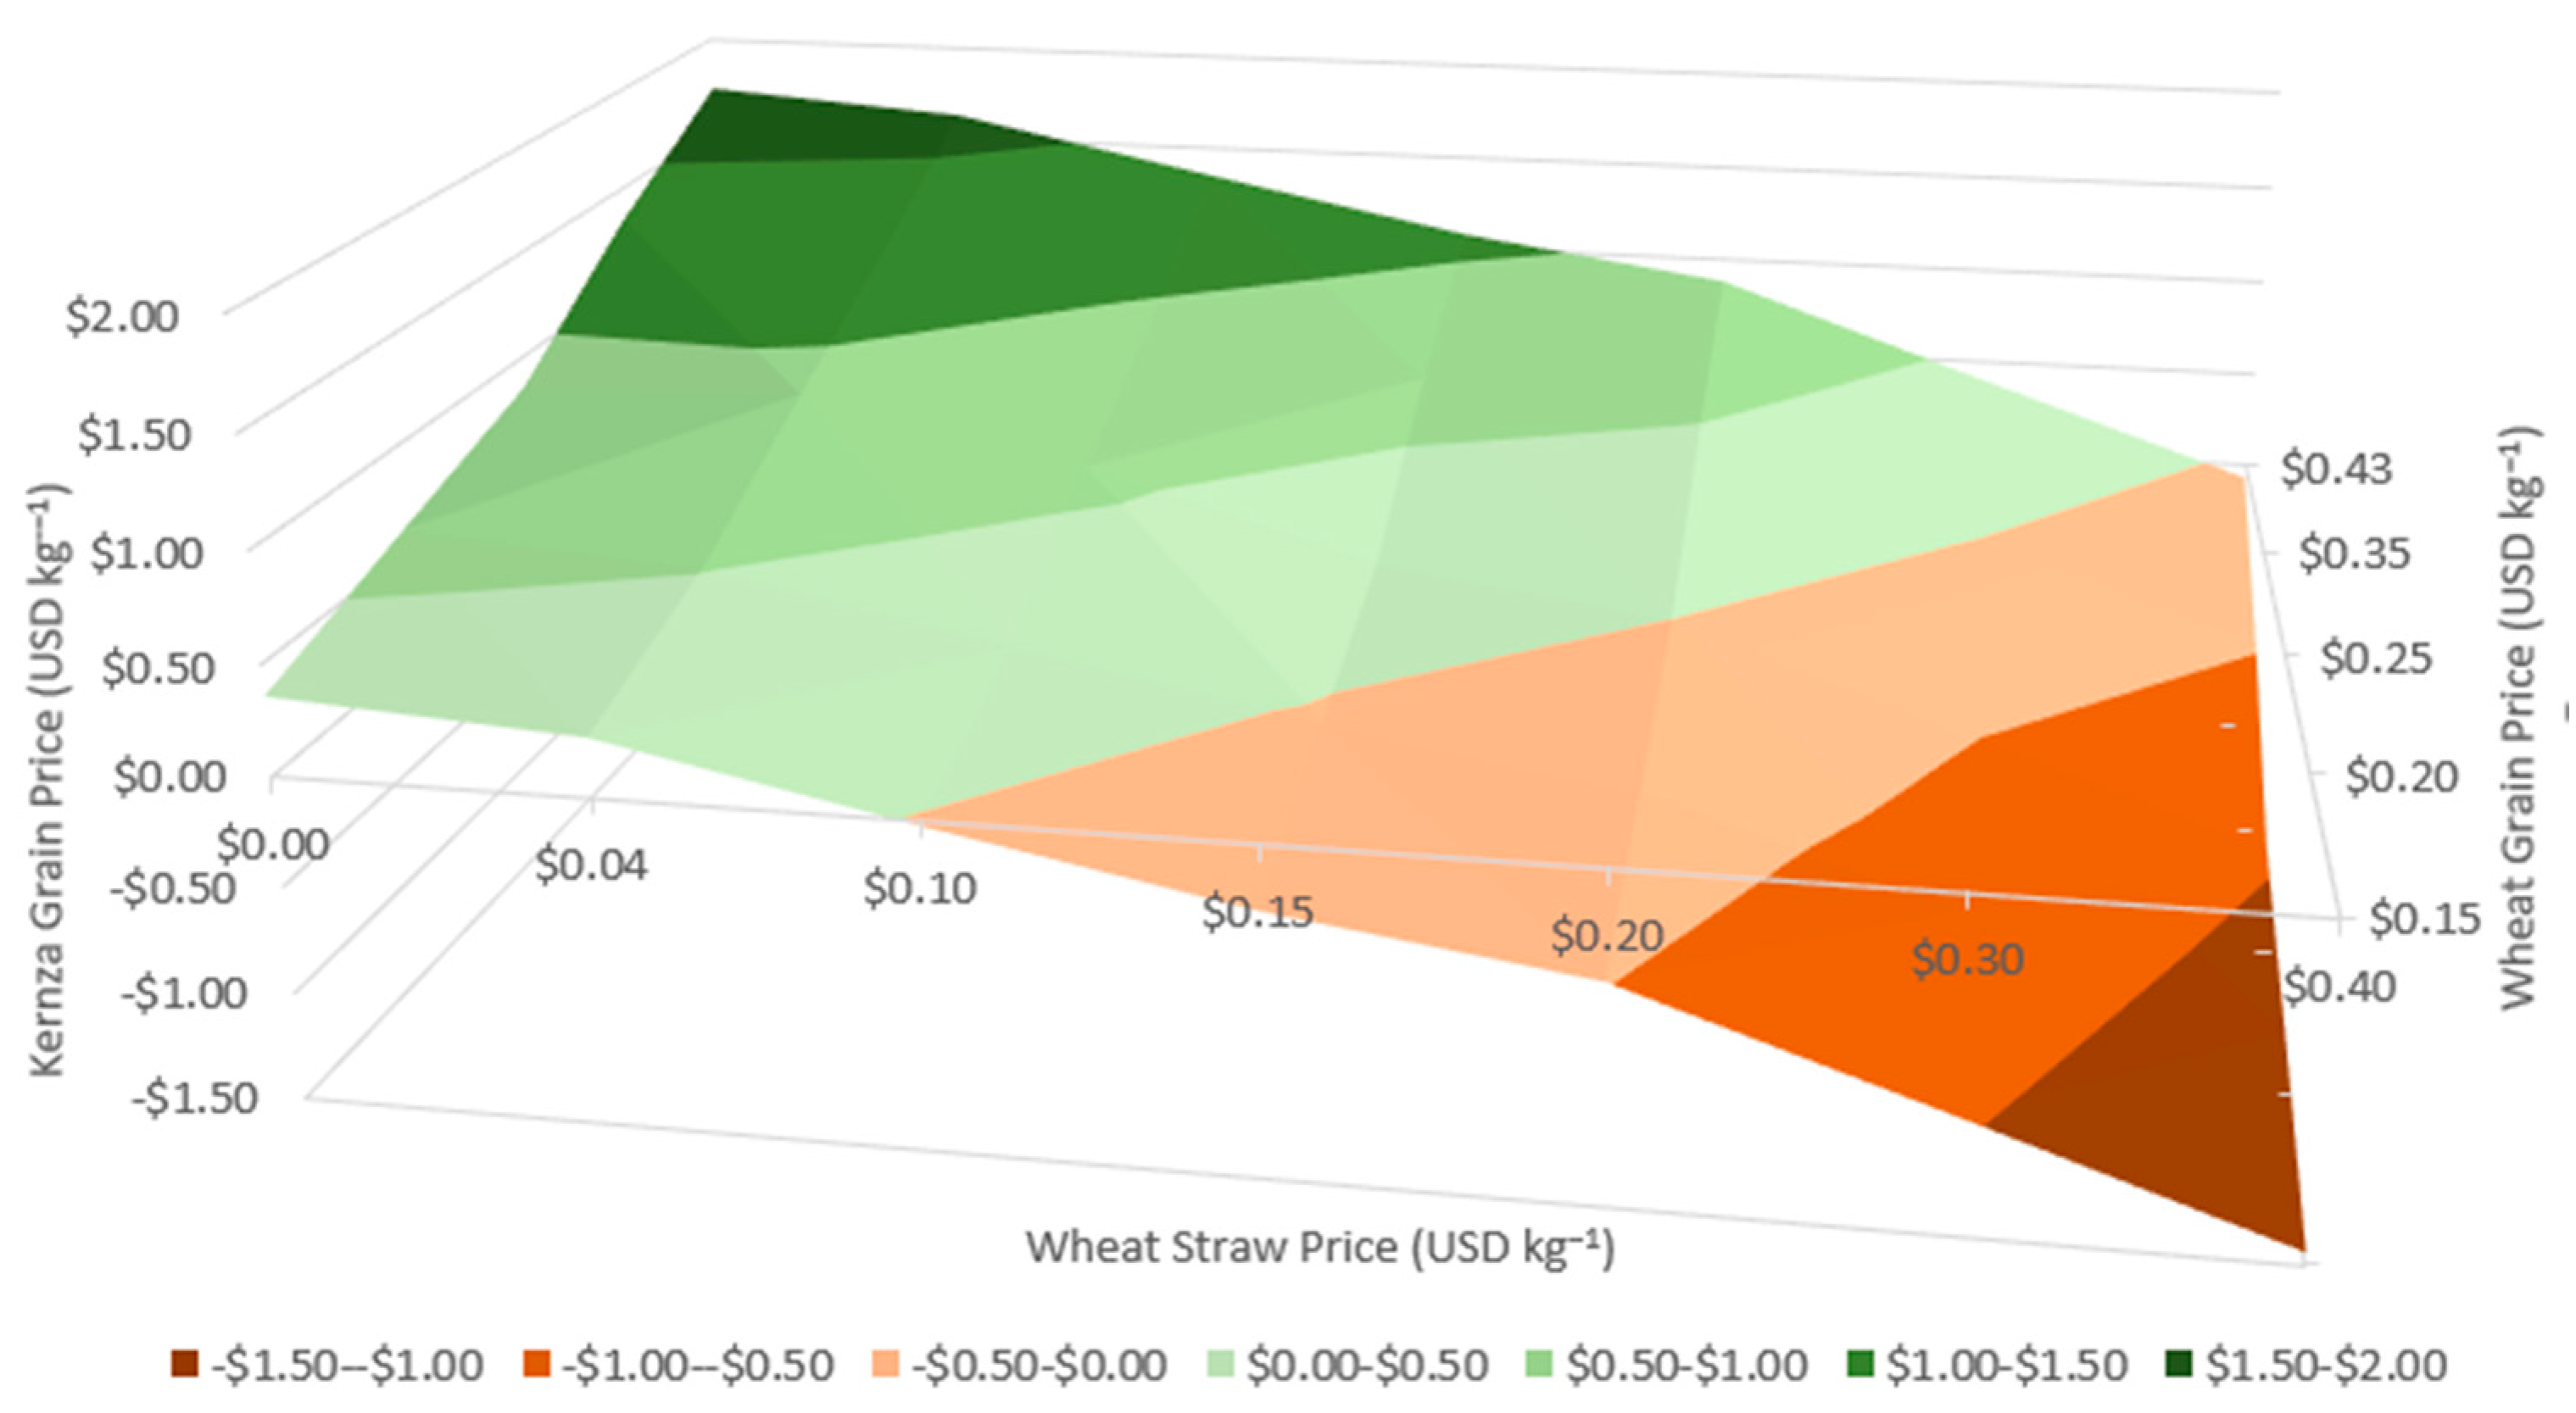
3.1. Crop Yields and Economics

Large differences were observed between IWG and wheat crop productivity, with wheat producing five times more grain than IWG over three years, while IWG produced 48% more total forage (the sum of IWG and clover biomass) on average during the same period (Table 3). IWG grain yield declined six-fold between the first and second harvests, then rebounded slightly at the third harvest, while IWG crop biomass increased 40% from the first to third harvests. Wheat crop biomass decreased 31% from the first to the third harvests. Wheat grain yield trended lower from year to year, but the differences were not statistically significant (Table 3).
Total grain yield averaged 478 kg ha−1 yr−1 for the IWG systems and 2807 kg ha−1 yr−1 for the wheat systems (Table 3). Grain yields for organic winter wheat were comparable to the New York state average of 2684 kg ha−1 in 2019 [41]. First-year grain yields of IWG of 1200 kg ha−1 in our experiment were at the higher end of the yields reported in the literature, which range between 108 kg ha−1 [56] and ~1300 kg ha−1 [57]. In contrast, IWG vegetative biomass production was relatively low compared with other published research, with our highest value of 8412 kg ha−1 from a third harvest when intercropped with red clover appearing similar to the lowest first harvest values reported in a recent forage production study [22]. For a more thorough evaluation and discussion of crop yields from the IWG and annual wheat systems, see Law et al. [15].
Grain yields for the corn–soybean–spelt rotation used in the economic and environmental sustainability analyses averaged 10,755 kg corn ha−1, 2625 kg soybean ha−1, and 2535 kg spelt ha−1 across two full three-year rotations [39]. This corn yield is much higher than the New York State average yield of 6923 kg ha−1 for organic corn in 2019 [41]. These soybean and spelt yields are closer to the New York State averages of 2177 kg ha−1 for organic soybean, and 2793 kg ha−1 for organic spelt in 2019 [41].
The break-even price for Kernza grain was USD 0.53 kg−1 when grown with interseeded red clover and USD 0.64 kg−1 when grown in monoculture (Tables S1 and S2), assuming straw could be sold at the statewide average for organic straw in New York [41]. Organic Kernza grain sold at USD 0.53 kg−1 would represent a price premium 23% higher than the current price of USD 0.43 kg−1 for organic winter wheat in New York. IWG interseeded with red clover had a lower break-even grain price due to greater hay production than IWG in monoculture, despite higher costs incurred for additional field operations and clover seed (Figure 3). Kernza grain prices required for net returns of IWG production to match the organic corn–soybean–spelt rotation were USD 1.23 kg−1 with red clover and USD 1.32 kg−1 in monoculture.
All values are in USD and represent net present value of annual revenues, production costs, and income averaged over the three-year period and discounted 5% annually. Kernza grain prices were calculated to match net income of the IWG systems to the corn–soybean–spelt system, resulting in net returns of these three systems being equal. Tables S1–S5 represent full enterprise budgets for each system.
Sensitivity analysis was conducted to assess Kernza grain prices necessary to match net returns from the corn–soybean–spelt and wheat systems. Varying scenarios for IWG grain and forage yields were developed based on a range of published values [11,14,22,58,59] then used to calculate grain prices if all costs and straw/hay prices were held constant (Figure 4). Kernza grain prices ranged from USD 9.56 kg−1 for the lowest yields observed during the first on-farm IWG grain production trials in New York [60] to USD 0.10 kg−1 if both grain and forage yields were consistently at the highest values reported in the current literature [11]. Kernza grain prices ranged between USD −1.44 kg−1 and USD 1.73 kg−1 under varying scenarios for wheat grain and straw prices (Figure 5). Negative Kernza grain prices represented scenarios where the value of IWG forage was higher than the NPV of the dual-purpose organic winter wheat system, which occurred when wheat grain price was low, and straw/hay prices were high. These estimates are based on relatively high market prices for organic grain, straw, and hay in the Northeastern United States.
At the fair-quality organic hay price of USD 135 ton−1 (USD 122.50 Mg−1) used as the current market benchmark in this study, approximately half of IWG cropping system revenue is derived from grain sales and half from hay sales (Figure 3). Organic grains often receive price premiums of 100% or more over conventional grains, while organic forages may only receive a 30–50% premium [61]. This discrepancy will make it more difficult for IWG to compete economically with organic grain crops as IWG’s lower grain yields are further penalized while its high forage production is not rewarded. On the other hand, New York was the state with the highest tonnage and value of farm sales of organic grass (non-alfalfa) hays during the most recent national survey in 2019 [41]. Over 60,000 tons of grass hays were sold by New York farmers in 2019 for a total of USD 8M, representing 21.5% of organic grass hay sales in the US. This high-value market for forages, the relatively low cost of land, and the potential for integrated crop–livestock systems in dairy-producing Northeastern states creates an ideal situation for introducing a dual-purpose grain and forage crop such as IWG. In comparison to an economic analysis of IWG forage production in Minnesota, where the NPV of IWG straw alone was frequently higher than production costs for both grain and forage [22], hay prices were higher and land costs lower in our study. The economic prospects of dual-purpose IWG production could be further improved by harvesting higher quality hay in the spring or fall. This strategy has been found to increase total crop biomass and not affect grain yield potential the following growing season relative to a control where the IWG forage was not harvested [59].
Changes in the yield or price of either co-product could also alter economic outcomes considerably. For example, if an IWG stand consistently produced 1000 kg grain ha−1 yr−1 and 10,000 kg hay ha−1 yr−1 for three years, the grain price required to match the NPV of the most profitable corn–soybean–spelt system would be USD 0.48 kg−1 (Figure 4). This would represent a more modest price premium of 12% compared with organic winter wheat.
It is also noteworthy that the spelt year of the corn–soybean–spelt system had a net negative cash flow (Supplementary Table S5), a loss that is justified by organic farmers in light of the other services provided by the spelt. Specifically, at the field level added crop diversity disrupts pest and pathogen populations and allows for an interseeded clover crop to increase soil nitrogen availability for the following, higher value corn crop [39]. At the whole-farm level, crop diversification is known to increase resilience to variable weather patterns [62] and provides additional flexibility in farm management by distributing field operations such as planting and harvesting across a longer period of the growing season [63]. IWG may provide similar benefits in rotation with other crops, and thus, there is the possibility that farmers would be willing to grow IWG for lower grain and forage prices than what is calculated here. This is supported by early adopters of IWG for grain production, who acknowledge that IWG may be at a disadvantage compared to other crops if the farm’s only goal is short-term profit but that they are also motivated by assuring a “balance” of economic, management, and environmental goals across their farm in the longer term [20].
In our study, poultry litter represented about half of all production costs in the IWG systems at USD 679 ha−1 yr−1 (Figure 3). In New York State poultry litter costs approximately 13 times more per kg N than synthetic fertilizers, which can inflate the production costs of organic crops [64]. Use of less-processed and locally available animal manures, especially those produced on-farm in integrated crop-livestock systems, could drastically decrease this cost but may result in less precise levels of N application and possible overapplication of P. In a study evaluating a conventional South Carolina corn–soybean–wheat rotation, using solely poultry litter for crop fertilization, resulted in a higher NPV than synthetic fertilizers when litter was freely available on-farm, and the only associated cost was handling and spreading, but this advantage disappeared when poultry litter needed to be purchased for ~USD 150 ha−1 [65]. Nitrogen fixation by intercropped legumes can also potentially reduce fertilizer costs in IWG production systems [66,67], but managing IWG–legume mixtures requires further research for various desired outcomes (e.g., maximizing grain or forage production, minimizing energy use or GHG emissions, or improving soil health) to be optimized.

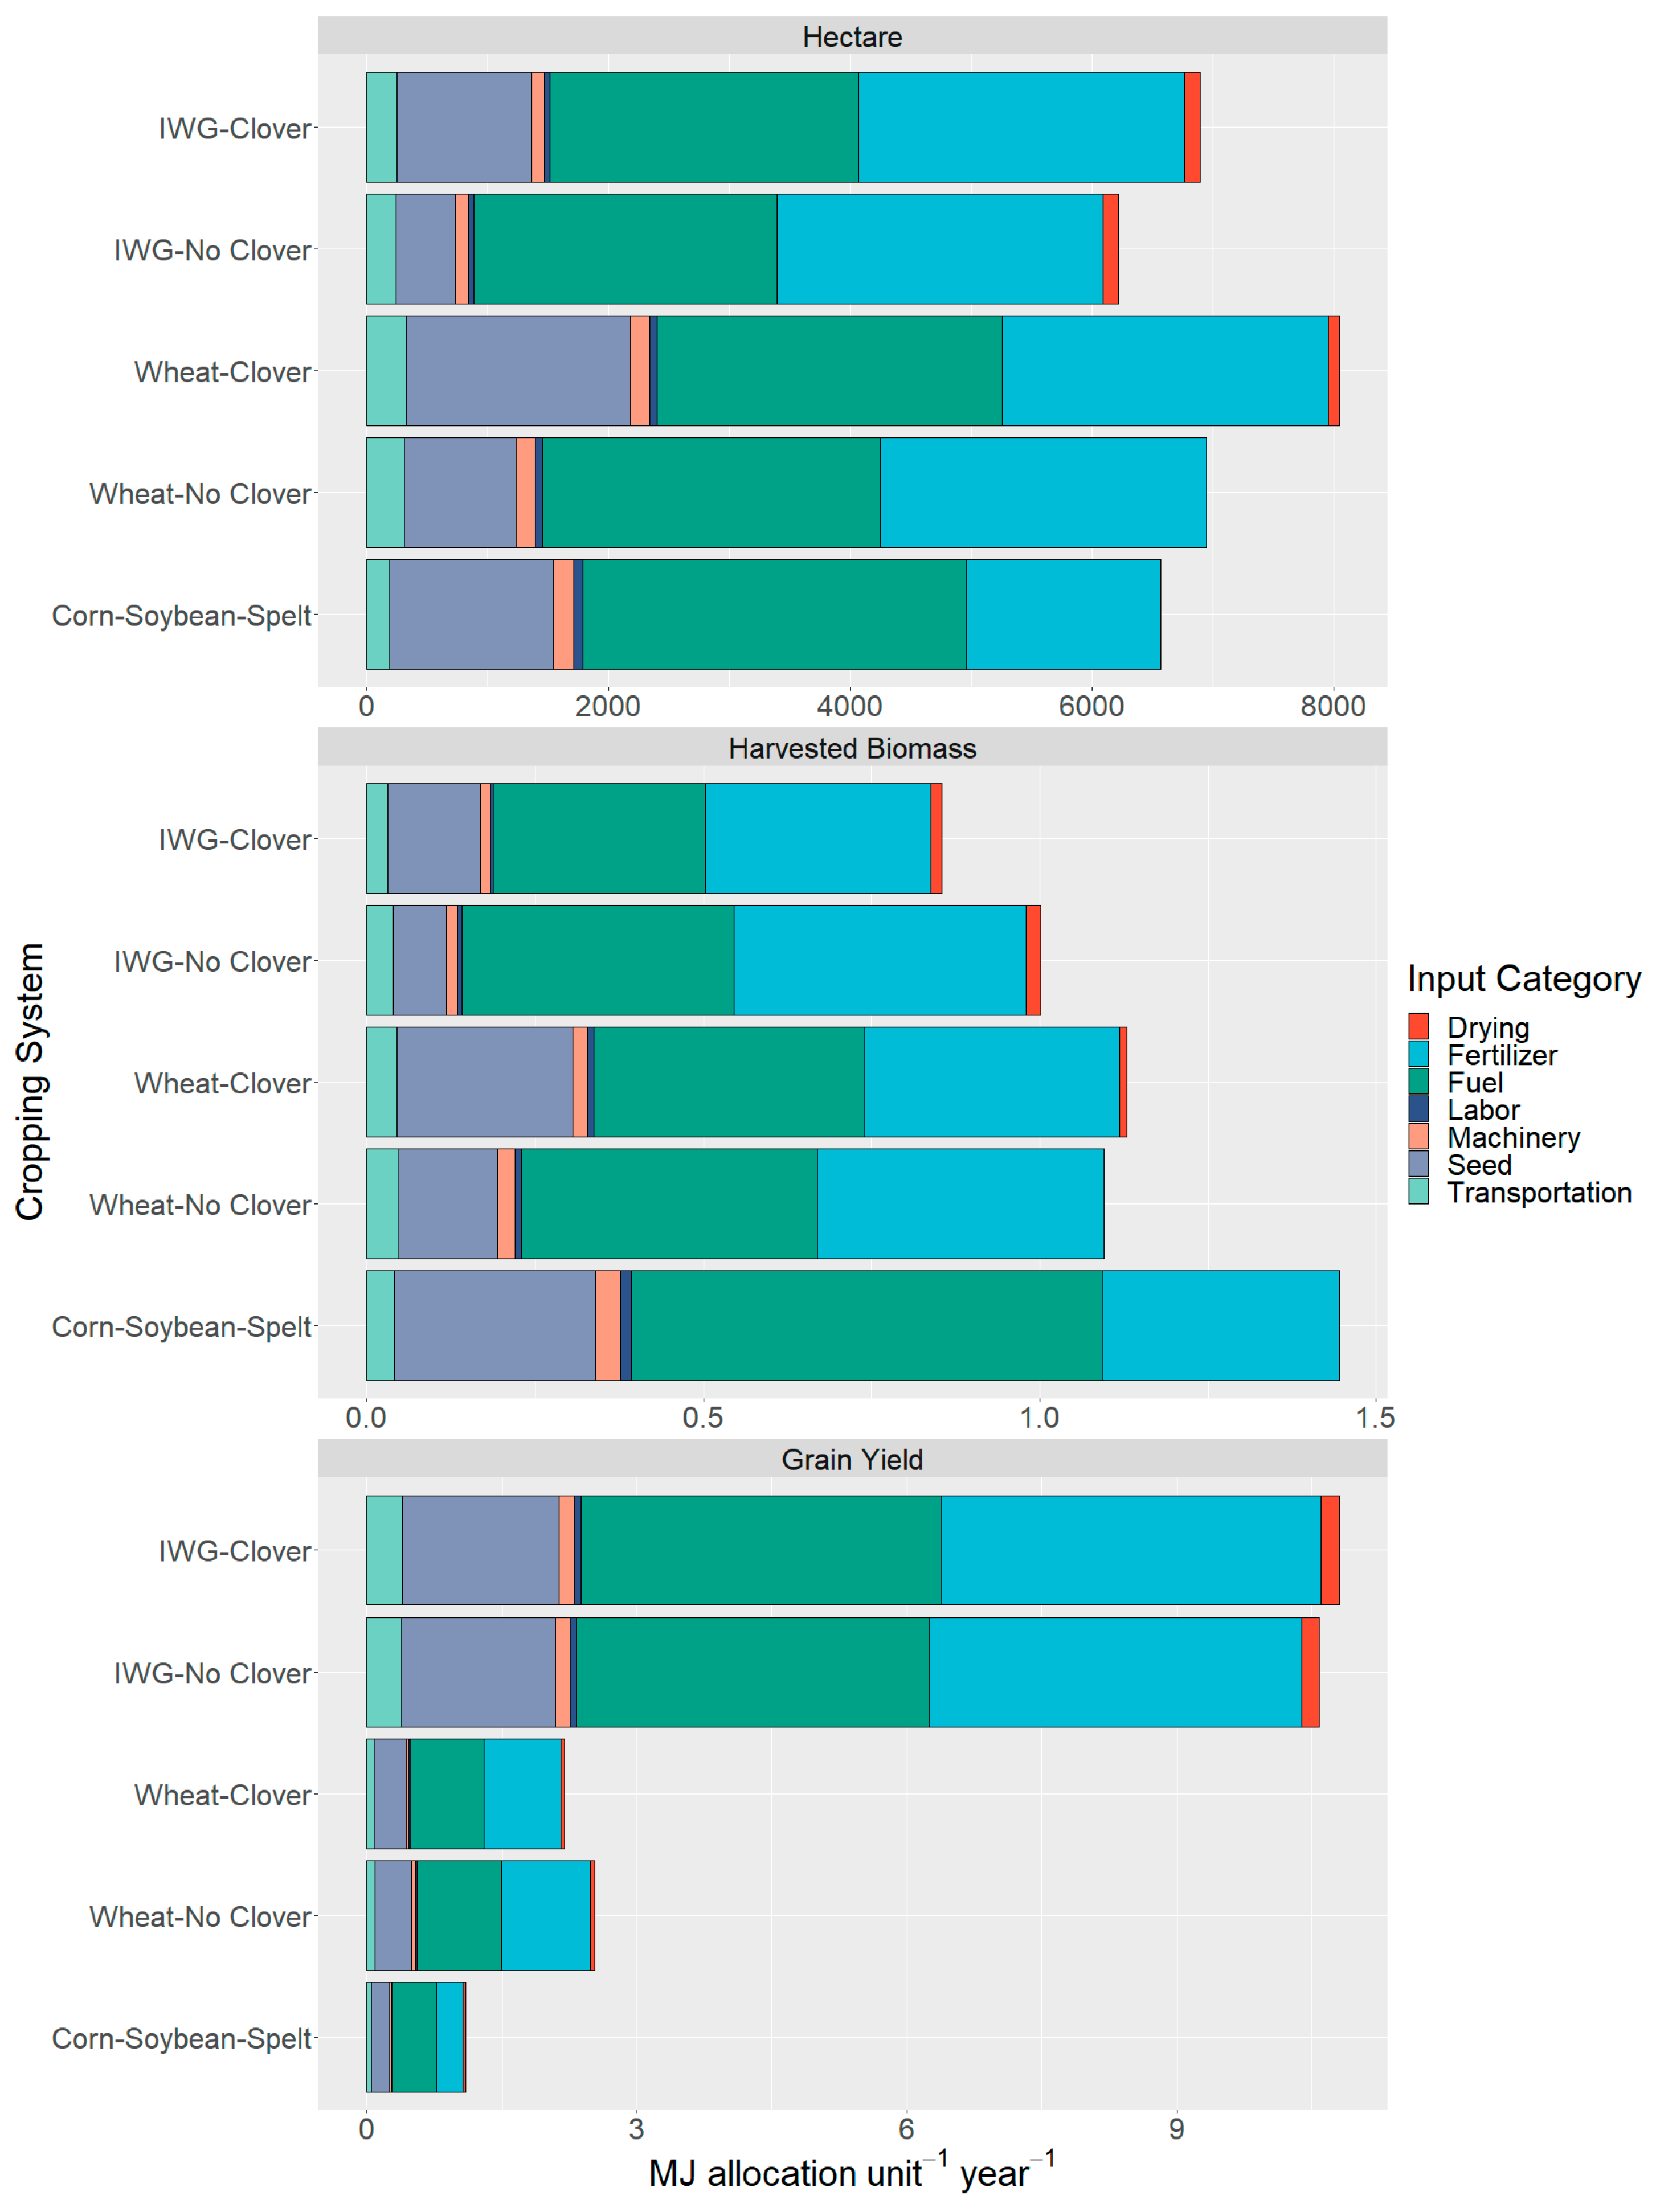
3.2. Energy Analysis

Total energy use ranged between 6220 MJ ha−1 yr−1 for the IWG monoculture to 8050 MJ ha−1 yr−1 for the winter wheat intercropped with red clover (Figure 6). Diesel fuel and poultry litter were the highest energy inputs for all systems, but the relative importance of these two inputs differed between the corn–soybean–spelt system and the four systems from the perennial/annual comparison experiment (Figure 6). The corn–soybean–spelt system, despite being considered a ‘High Fertility’ system, used 44% less poultry litter as fertilizer than the other systems, due to nitrogen credits from the soybean and clover. On the other hand, the corn–soybean–spelt system used 27% more diesel than the IWG monoculture system that had the lowest fuel use, due to additional cultivation operations to manage weeds during the corn and soybean years of the rotation. Only minor differences were observed in energy used for the fewer field operations in the perennial IWG systems compared with the annual wheat systems, but differences in crop and clover seed energy were substantial.
The highest energy use value estimated was 8050 MJ ha−1 yr−1 for the wheat–clover intercrop, which is considerably less than the lowest energy use of 9217 MJ ha−1 yr−1 for a six-year organic crop rotation calculated using the same FEAT model [34]. The main difference between the organic cropping systems reported in Hoffman et al. [34] and our study was the number of field operations for seedbed preparation and weed management. For example, Hoffman et al. [34] included a total of seven additional disking and cultivation operations across their three-year corn–soybean–wheat rotation, representing a difference of 1907 MJ ha−1 yr−1 compared with the corn–soybean–spelt system analyzed in this study. These energy-use values are also lower than the United States national average of 8725 MJ ha−1 yr−1 for conventional wheat production [68].
The method of allocation had a large impact on the relative energy use of the five cropping systems, with IWG having the largest differences between allocation methods (Figure 6). When IWG was intercropped with red clover, it had the lowest energy use per kg of harvested biomass, inclusive of grain and forages, the third highest energy use per hectare, and by far the highest energy use per kg grain. Allocated per kg dry biomass harvested, IWG intercropped with red clover required only 0.85 MJ kg−1 yr−1, while the corn–soybean–spelt system required 1.45 MJ kg−1 yr−1 as crop residues were not harvested in that system. In contrast, when allocated per kg of grain yield corrected to market moisture levels, the corn–soybean–spelt system required 1.09 MJ kg−1 yr−1, and the IWG–red clover system required 10.80 MJ kg−1 yr−1, a striking ten-fold difference in energy use if grain is the sole output of the production system. These differences are clearly driven by the low grain yields and high forage production of IWG, again highlighting the importance of the dual-purpose use of the IWG crop.

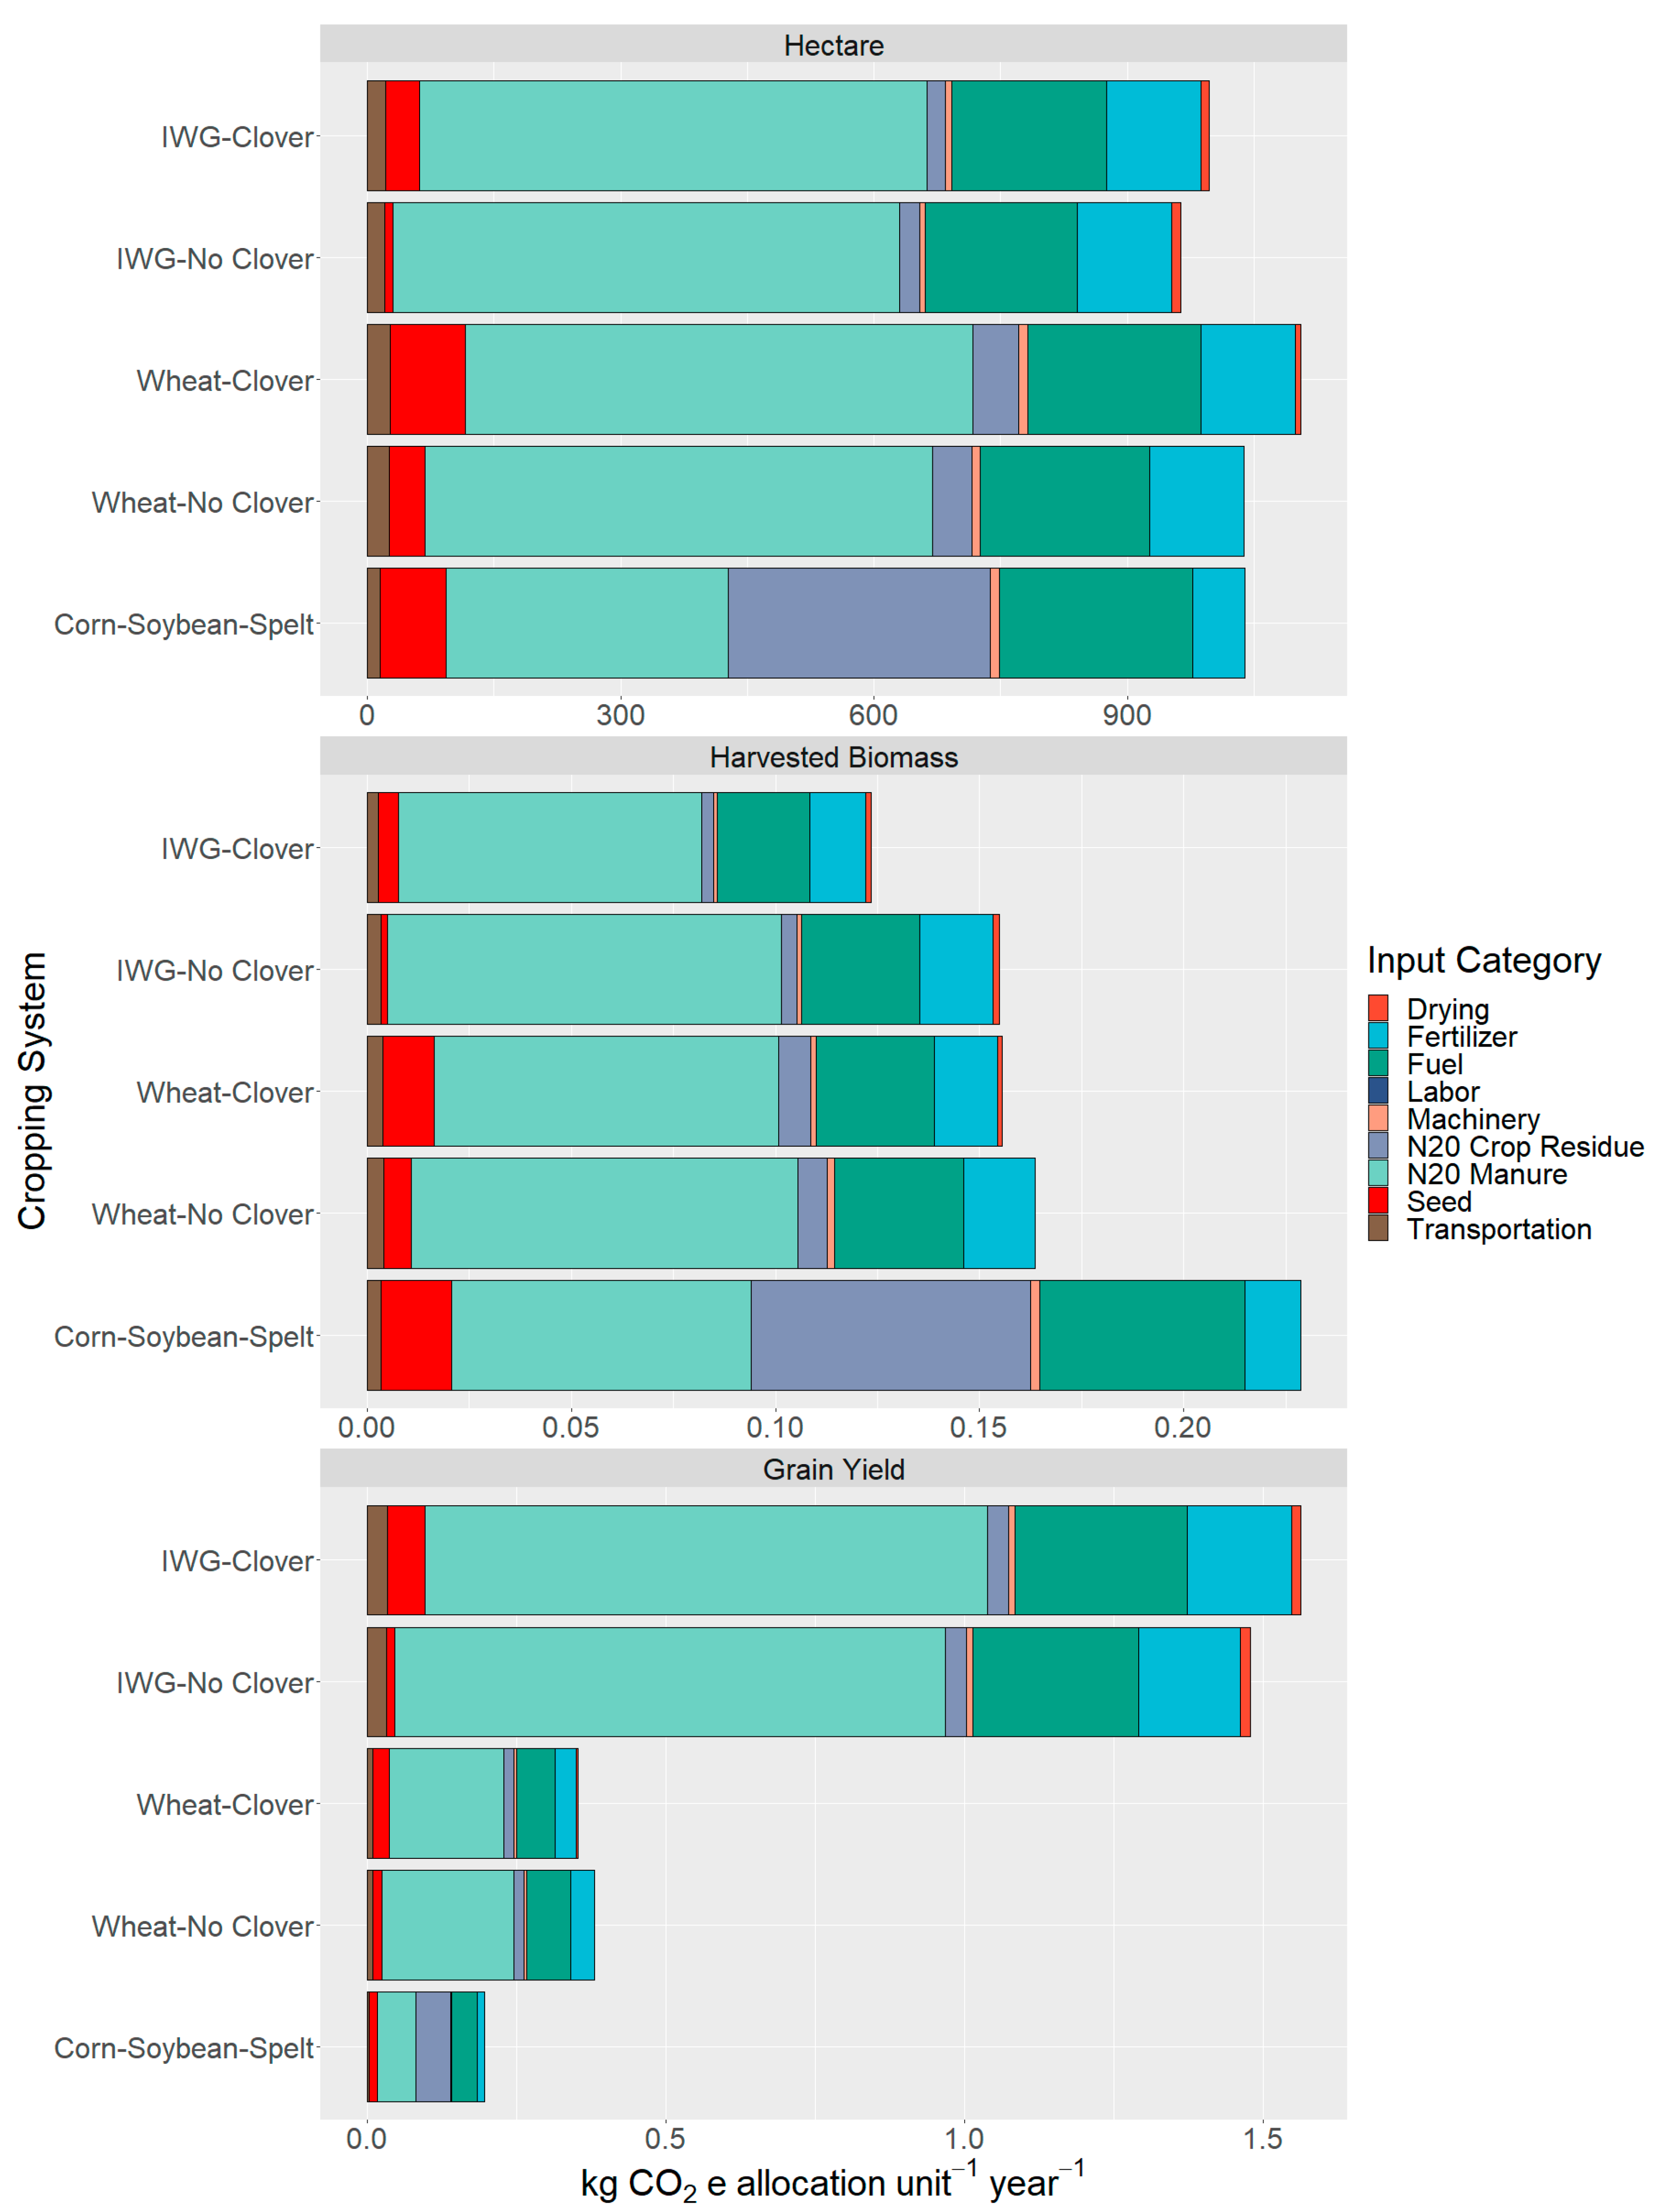
3.3. Greenhouse Gas Emissions

Total greenhouse gas emissions followed the same pattern as energy use, ranging from 963 kg CO2e ha−1 yr−1 for IWG monoculture to 1106 kg CO2e ha−1 yr−1 for wheat intercropped with red clover (Figure 7). Emissions were dominated by direct emissions of N2O from fertilizer applications, followed by direct emissions from fossil fuel combustion. Indirect emissions from poultry litter and seed production also contributed considerably to the totals for all systems. Crop residue decomposition was an important source of N2O emissions in the corn–soybean–wheat system, but not for the dual-purpose IWG and wheat systems where it was estimated that 90% of aboveground crop residues were harvested for hay or straw. This difference is due to the choice of system boundaries as the N contained within crop residues does not disappear after they are harvested; so, emissions related to those products are externalized from the systems. IWG intercropped with red clover has the lowest emissions per kg crop biomass harvested (0.12 kg CO2e kg−1 yr−1) and the highest emissions per kg grain yield (1.56 kg CO2e kg−1 yr−1), while the corn–soybean–spelt system again exhibited the opposite trend (0.23 kg CO2e kg−1 yr−1 with crop biomass allocation; 0.20 kg CO2e kg−1 yr−1 with grain yield allocation). Full tables of inputs and calculated energy use and greenhouse gas emissions are included in the supplementary materials (Tables S6–S10).
The greenhouse gas emission estimates reported from this study are less than half the emissions estimated by Hoffman et al. [34] for organic cropping systems in the northeastern United States, partly due to fewer field operations but also because of differences in emissions from crop residues. It appears that GHG estimates calculated using the FEAT model are sensitive to how crop residue management is parameterized, a factor that should be considered by others using the model to evaluate the sustainability of cropping systems. Emissions from the wheat systems (0.353–0.381 kg CO2e kg grain−1 yr−1) were similar to emissions of 0.4 kg CO2e kg grain−1 for wheat production in the Netherlands [69] and Australia [70], suggesting that the values calculated in this study are reasonable estimates.

3.4. Emergy Evaluation

Emergy-based sustainability indicators for grain and forage production show that all five systems have relatively low environmental impact due to their high reliance on renewable resources and low amounts of external inputs. The chemical energy of rain was the dominant emergy flow in all systems, followed by the emergy of organic fertilizers and in the annual systems and soil erosion (Figure 8). Specific emergies for grain were highest in the IWG systems and lowest in the corn–soybean–spelt system due to differences in grain yields (Table 4). An opposite trend was observed in specific emergies of straw or hay, with the IWG systems having lower values than the wheat systems (Table 5). Crop residues were not harvested in the corn–soybean–spelt system. The perennial IWG systems had higher EYR than the wheat systems and lower ELR than all three annual systems, however, due to fewer field operations and lower estimated soil erosion (Table 4 and Table 5). The ESI of the two IWG systems was approximately two-to-three times higher than any of the annual systems due to the higher relative contribution of renewable inputs to IWG production (Table 4 and Table 5). Full emergy tables for each cropping system and example calculations are included in the supplementary materials (Tables S11–S15).
Emergy is particularly appropriate for evaluating agricultural systems because they are at their core systems that utilize higher quality, more concentrated forms of energy obtained from the economy to harvest lower quality, but renewable, energy from the sun, wind, and rain in the form of crop products [71]. The perennial IWG systems utilized a higher proportion of renewable resources relative to non-renewable resources of soil erosion and purchased inputs than annual grain cropping systems, resulting in ESI values that were three times higher for IWG (ESI = 8.33–10.39) than annual wheat (ESI = 3.16–3.31). The high emergy value of rainwater relative to other inputs had a strong impact on the sustainability of all five systems evaluated in this study (Figure 8). Agricultural systems that depend on groundwater extraction for crop irrigation can be much less sustainable from an emergy perspective. For example, an evaluation of wheat production in an arid region of China found an ELR of 10.59 and ESI of 0.11, indicating much higher environmental stress and lower overall sustainability than the systems in our study, due to use of groundwater at rates higher than natural recharge and the high emergy cost of electricity required for pump operation [72].
Emergy evaluation also values the embodied energy of some inputs, such as machinery and labor, higher than simple energy analysis because emergy conversions account for not only the energy of producing a machine or performing a task, but also the energy embodied in the raw materials, information, and environmental processes necessary to create a machine, raise and educate a laborer, or generate a centimeter of topsoil [73]. This also contributed to better sustainability indicators for the IWG system, which greatly reduces soil erosion and utilizes less labor and machinery for field operations after the first growing season because there is no need to till the soil and replant the crop.
The five organic grain cropping systems evaluated in this study also performed well relative to other agricultural systems evaluated using emergy indicators. The emergy yields of the IWG (7.11E+15 seJ ha−1 yr−1), wheat (1.03E+16 seJ ha−1 yr−1), and corn–soybean–spelt (9.30E+15 seJ ha−1 yr−1) systems were higher than a conventional silage corn production system in the Netherlands (1.91E+15 seJ ha−1 yr−1) [74], but lower than a conventional grain corn production system in Kansas, USA (1.30E+16 seJ ha−1 yr−1) [71] and the aforementioned wheat production system in China (2.00E+16 seJ ha−1 yr−1) [72]. The ESIs of IWG grain (8.90–10.34) and forage (8.33–10.39) production were much higher than any of these conventional grain production systems. Comparisons of ELRs between conventional and organic wheat production have revealed that organic systems create two-to-three times less environmental stress [75,76], and based on our analysis, perennial systems could further reduce the impact of organic grain and forage production.

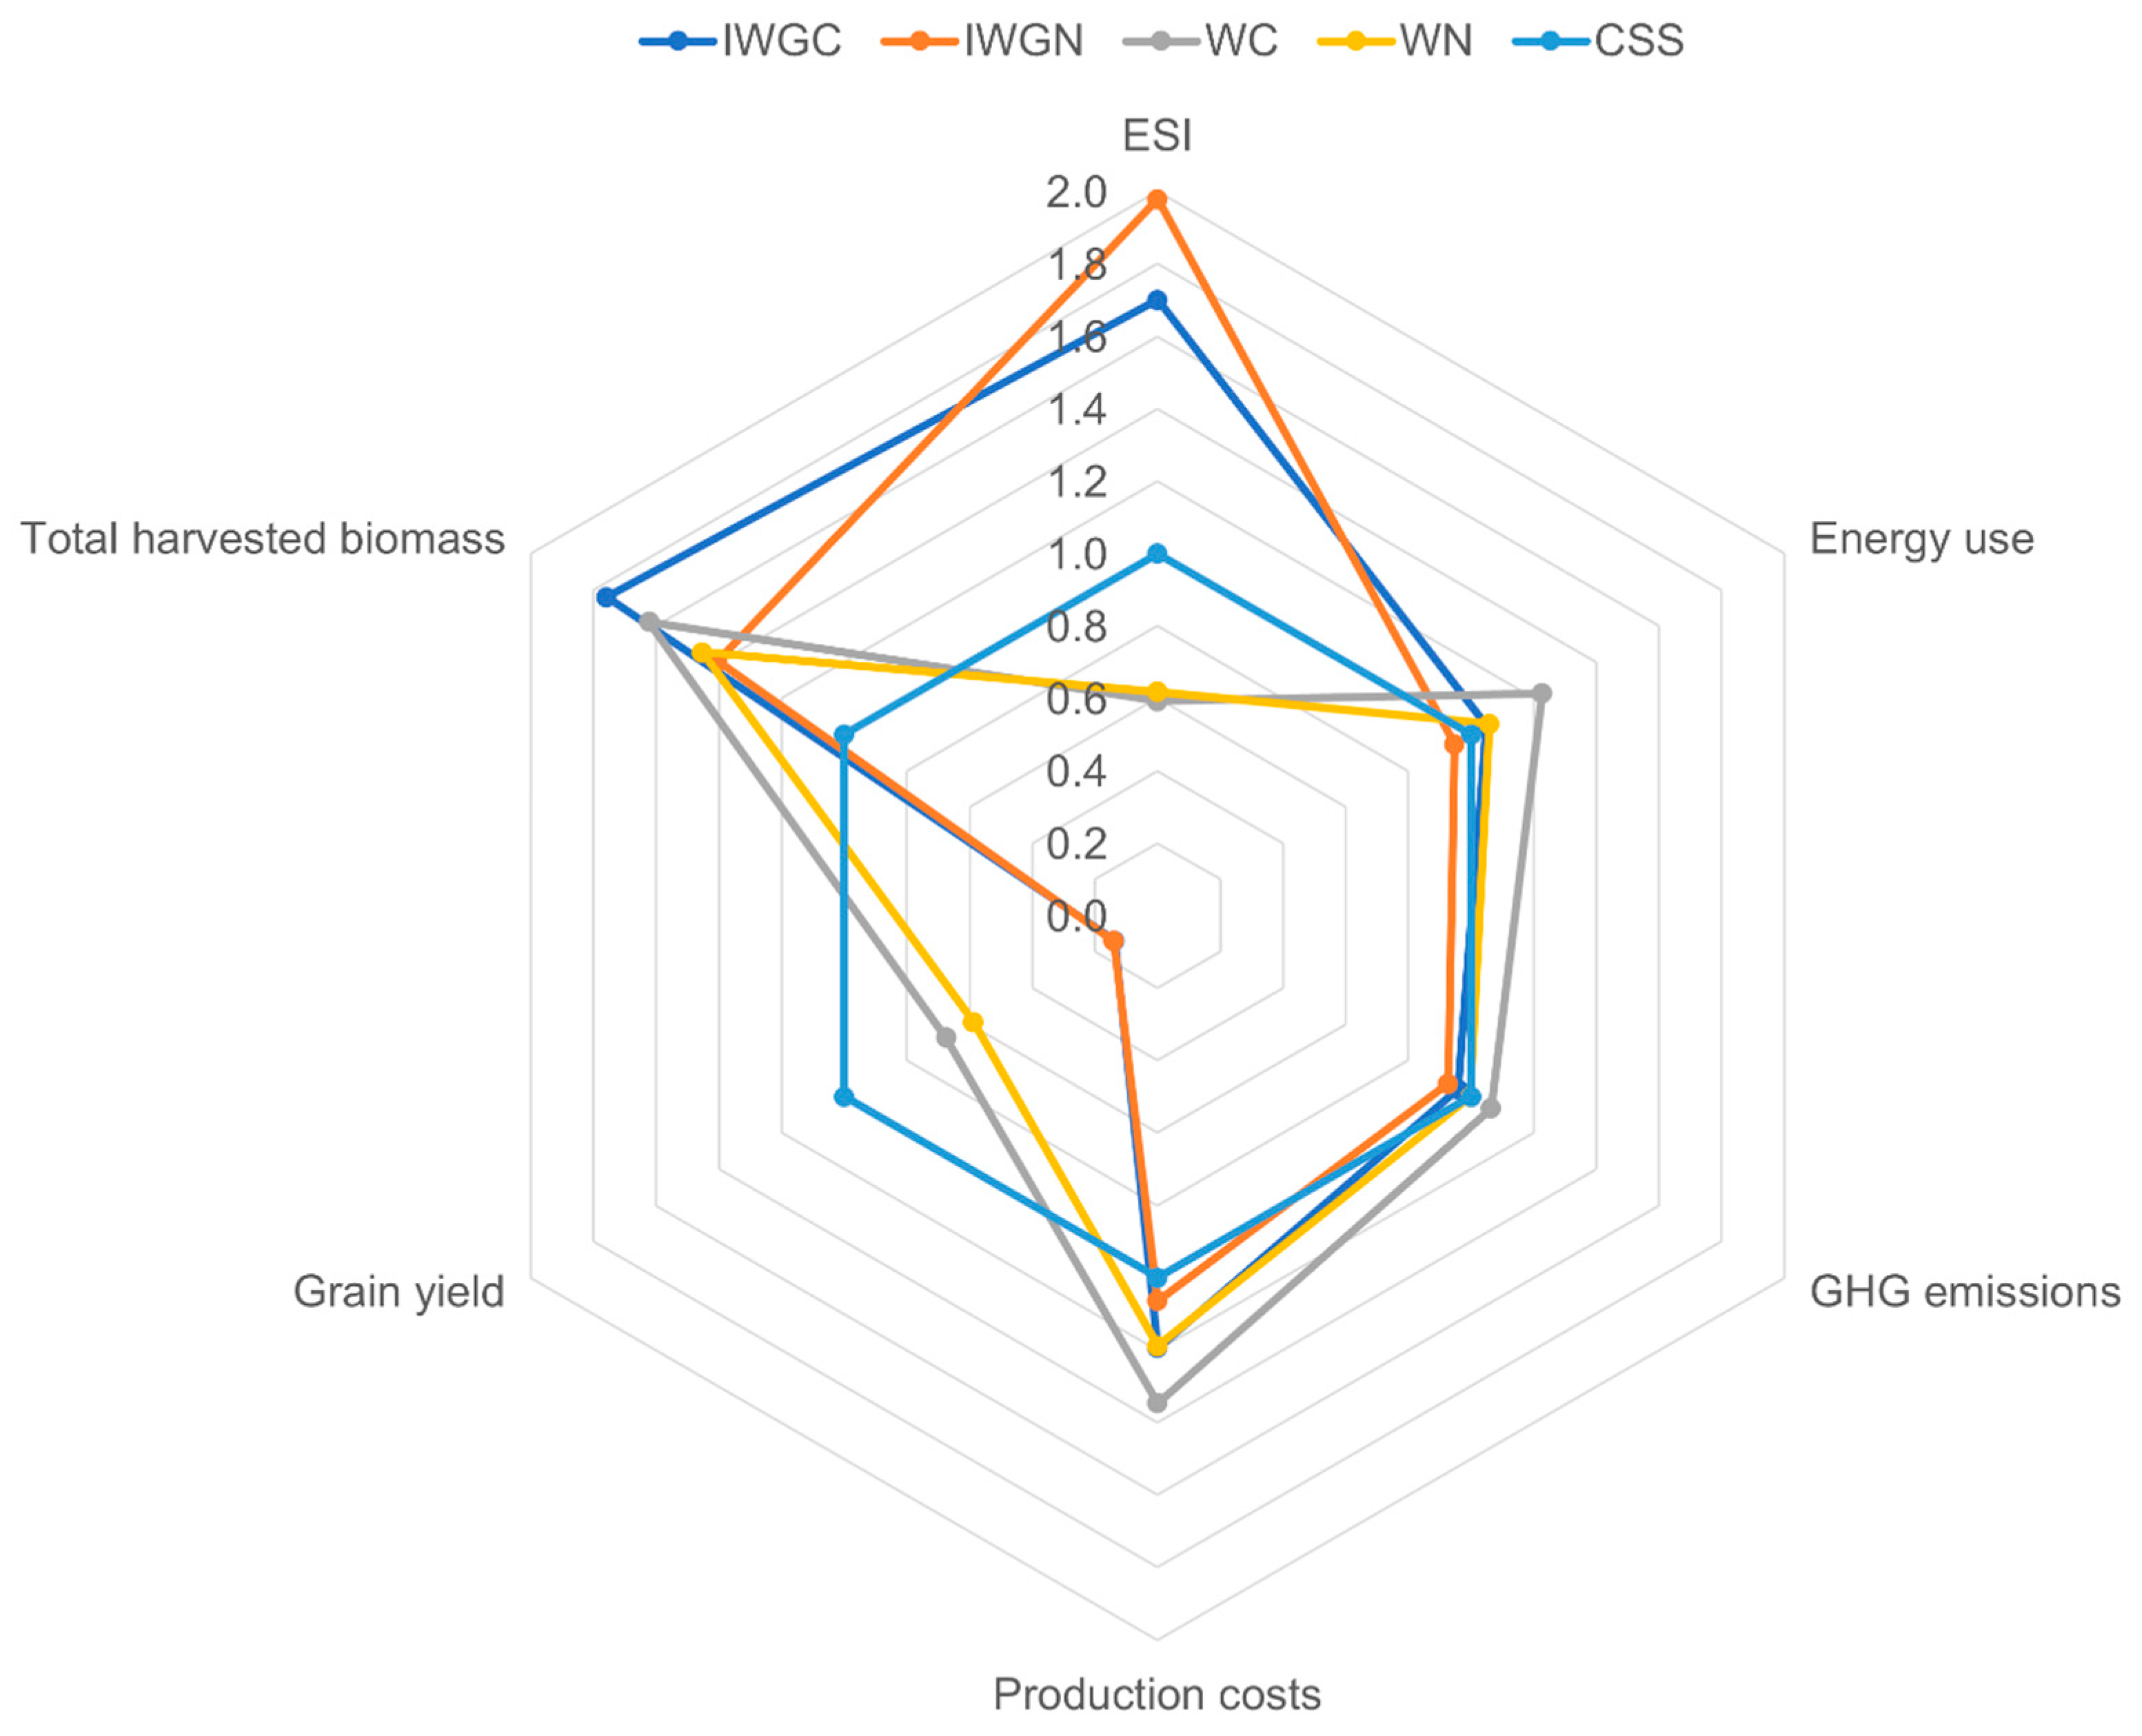
3.5. Comparison of Sustainability Indicators between Systems

Normalizing all sustainability indicators to the corn–soybean–spelt system that is typical of organic grain production in New York State provides a relative comparison of all five systems (Figure 9). The corn–soybean–spelt system produced the most grain by far due to the high yield of corn, but less total biomass was harvested from that system than was harvested from the dual-purpose IWG and wheat systems. These differences in co-products can have a large effect on the interpretation of sustainability indicators depending on the allocation method, as is seen in the comparisons of energy use and GHG emissions above. On a per hectare basis, the IWG–red clover and both wheat systems used slightly more energy than the corn–soybean–spelt system, but the IWG monoculture used slightly less. Greenhouse gas emissions from both IWG systems and the wheat monoculture were lower than the corn–soybean–spelt system, while emissions from the wheat–red clover system were slightly higher. Both perennial IWG systems performed better than all of the annual systems for the Emergy Sustainability Index due to a higher relative reliance on renewable natural resources. Production costs were higher for IWG and wheat systems than the corn–soybean–spelt system due to higher inputs of poultry manure. Kernza grain yields would need to increase substantially or command a price premium approximately three times that of organic winter wheat to have similar net returns to the corn–soybean–spelt system over a three-year rotation.

3.6. Implications for Incorporating Intermediate Wheatgrass into Sustainable Cropping Systems

The results of this study are highly dependent on the economic value of harvesting IWG biomass for use as a fair-quality hay after grain harvest. Crop residue removal has mixed impacts on crop productivity and indicators of annual cropping system sustainability, with high levels of residue removal leading to higher rates of soil erosion and nutrient leaching but lower GHG emissions [77]. IWG systems may be able to realize many of the benefits of residue removal without the drawbacks. Removal of IWG straw after harvest has neutral or positive impacts on grain yield in subsequent years [58,59], and soil erosion and nutrient leaching are both much lower in IWG production systems than in comparable annual grains even when crop residues are harvested [11,13]. As the economic value of IWG hay and straw is a critical component of the economic viability of the crop, as shown in this study and another recent evaluation of IWG profitability [22], using IWG as a dual-purpose crop for grain and forage production appears to be a win-win-win proposition.
The boundaries and assumptions that were made when defining the limits of the systems being analyzed have significant impacts on the assessment. The decisions to treat grain and forages as commodities and to apply fertilizers at the same rate regardless of the intercropping treatment reduced some possible advantages of the IWG–red clover cropping system from an economic utility standpoint. The benefits of growing IWG as a dual-purpose crop could be further enhanced on farms where mixed IWG–clover forages could be used for animal feed. Integrating crop and livestock production is an important principle of sustainable agriculture because it minimizes externalities at the farm scale [28]. The use of IWG as a dual-purpose crop producing both grain and animal feed and the incorporation of forage legumes into field crop production would both help to close material and energy loops. In such a system, the recycling of nutrients by using animal manures as fertilizer would also reduce the need for external inputs, thereby further reducing environmental impact and increasing profitability. This type of farm-agroecosystem circularity can also increase stability and resilience at the whole-farm scale [37].
Incorporating a perennial grain crop such as IWG into organic crop rotations in the Northeastern United States could also provide indirect benefits to farm management that are not quantified in this study. Analysis of perennial wheat cropping systems in Australia revealed direct and indirect benefits to farmers [63]. The direct benefits of perennial small grains include reduced external inputs and opportunities for grazing livestock in dual-use systems, while the indirect benefits to whole-farm management include more flexibility in equipment usage and labor throughout the year and in decision making about crop management based on environmental and economic factors, such as prioritizing forage production when low water availability reduces grain yield or when animal feed prices are high.

3.7. Limitations and Areas for Future Study

Our evaluation of the sustainability of IWG cropping systems is limited by a lack of indicators of social sustainability. While the scale of commercial production of IWG for Kernza grain was only approximately 1600 ha in 2021, and thus its impact on the social aspects of the overall food system is therefore relatively small, this impact will increase proportionally with adoption of the crop. As a niche, high-value crop, IWG might currently benefit smaller farms with greater connectivity to local food value chains. In contrast, if increasing production area requires specialized equipment for planting, harvesting, or processing IWG grain and forage, the capital investment might not be feasible for smaller farms. Aspects of social sustainability, including, but not limited to, farmer and farm worker wellbeing and livelihoods, must be considered as IWG and other perennial grain cropping systems continue to develop and market themselves as sustainable alternatives.
Without reliable price estimates for Kernza grain, our economic analysis was limited to calculating prices and relative price premiums that would allow IWG production to match the NPV of other organic grain cropping systems. As markets develop and price points are established for Kernza grain, analysis of scenarios where IWG cropping systems can be economically competitive with annual grain crops should be conducted. Incorporating valuation of the additional ecosystem services (e.g., soil health improvement and water quality protection) that IWG can provide relative to annual grain crops would also help clarify potential synergies between the environmental and economic sustainability of IWG cropping systems. Providing information about the relative environmental, economic, and social benefits (and potential drawbacks) of incorporating IWG into cropping systems to farmers, policymakers, and other stakeholders should be prioritized to facilitate adoption of the crop.

4. Conclusions

Organic perennial IWG cropping systems perform as well or better than annual cropping systems for several measures of environmental sustainability, especially when forage is valued as a co-product of the system. The energy use and GHG emissions for IWG production were relatively low when calculated per hectare or per kg of harvested biomass, due to lower inputs of seed, fuel, and machinery and high forage biomass production, but performed poorly for these indicators when only grain was considered as a product of the system. Sustainability indicators based on emergy, which accounts for the energy harvested from renewable natural resources, show that the IWG systems create less environmental stress and generate more emergy per unit of external input than annual grain production systems. These environmental benefits do have tradeoffs with economic performance of the IWG systems, however, as low grain yields from IWG would require substantial price premiums to produce net returns equivalent to comparable organic grain rotations. Several factors could improve the economic sustainability of IWG production in New York State and other Northeastern US states, including improving grain and forage yields through breeding programs and agronomic best management practices, incorporating livestock grazing or additional forage harvests, or compensating farmers for the ecosystem services provided by perennial cropping systems.

Supplementary Materials

The following supporting information can be downloaded at https://www.mdpi.com/article/10.3390/su14063548/s1, Tables S1–S5: Enterprise budgets for each of the five organic grain cropping systems, Tables S6–S10: Estimates of energy consumption and greenhouse gas emissions calculated using the Farm Energy Analysis Tool (Camargo et al. 2013) for each of the five organic grain cropping systems, and Tables S11–S15: Emergy tables for each of the five organic grain cropping systems.

Author Contributions

Conceptualization, E.P.L., A.D. and M.R.R.; methodology, E.P.L., S.W.C., M.I.G., A.D. and M.R.R.; formal analysis, E.P.L.; investigation, E.P.L., S.W. and C.J.P.; resources, S.W.C, A.D. and M.R.R.; data curation, E.P.L.; writing—original draft preparation, E.P.L. and M.R.R.; writing—review and editing, S.W., C.J.P., S.W.C., M.I.G. and A.D.; supervision, A.D. and M.R.R.; project administration, E.P.L. and S.W.; funding acquisition, E.P.L., S.W., S.W.C. and M.R.R. All authors have read and agreed to the published version of the manuscript.

Funding

This research was funded by United States Department of Agriculture NESARE Research and Education Grant number LNE16-351 and Graduate Student Grant number GNE17-156, the United States Department of Agriculture National Institute of Food and Agriculture Organic Agriculture Research & Extension Initiative Project 2019-51300-30255, and the New York State Environmental Protection Fund for the New York Soil Health Initiative, administered through the New York State Department of Agriculture and Markets Contract No. C00178GS-30000000.

Institutional Review Board Statement

Not applicable.

Informed Consent Statement

Not applicable.

Data Availability Statement

Datasets are available upon request to the corresponding author.

Acknowledgments

The authors would like to acknowledge that this research was conducted on the traditional homelands of the Gayogoho:no’ (the Cayuga Nation) and that we are grateful for the opportunity to work on these lands and for the continued stewardship of the Gayogoho:no’ people. We thank Lee DeHaan of The Land Institute for providing IWG seed and advice throughout the experiment. We would also like to thank Cynthia Bartel, Scott Morris, Matthew Spoth, James Cagle, Cynthia Sias, Roxana Padilla, Nina Sannes, Kelsey Mackenzie, Danilo Pivaral, Rob Galbraith, Pauline Mouillon, and Nathalie Griffiths for their help with data collection.

Conflicts of Interest

The authors declare no conflict of interest.

References

  1. Bommarco, R.; Kleijn, D.; Potts, S.G. Ecological Intensification: Harnessing Ecosystem Services for Food Security. Trends Ecol. Evol. 2013, 28, 230–238. [Google Scholar] [CrossRef] [PubMed]
  2. Foley, J.A.; Ramankutty, N.; Brauman, K.A.; Cassidy, E.S.; Gerber, J.S.; Johnston, M.; Mueller, N.D.; O’Connell, C.; Ray, D.K.; West, P.C.; et al. Solutions for a Cultivated Planet. Nature 2011, 478, 337–342. [Google Scholar] [CrossRef] [Green Version]
  3. Asbjornsen, H.; Hernandez-Santana, V.; Liebman, M.; Bayala, J.; Chen, J.; Helmers, M.; Ong, C.K.; Schulte, L.A. Targeting Perennial Vegetation in Agricultural Landscapes for Enhancing Ecosystem Services. Renew. Agric. Food Syst. 2014, 29, 101–125. [Google Scholar] [CrossRef] [Green Version]
  4. Crews, T.E.; Carton, W.; Olsson, L. Is the Future of Agriculture Perennial? Imperatives and Opportunities to Reinvent Agriculture by Shifting from Annual Monocultures to Perennial Polycultures. Glob. Sustain. 2018, 1, e11. [Google Scholar] [CrossRef] [Green Version]
  5. Pimentel, D.; Cerasale, D.; Stanley, R.C.; Perlman, R.; Newman, E.M.; Brent, L.C.; Mullan, A.; Chang, D.T.-I. Annual vs. Perennial Grain Production. Agric. Ecosyst. Environ. 2012, 161, 1–9. [Google Scholar] [CrossRef]
  6. González-Paleo, L.; Vilela, A.E.; Ravetta, D.A. Back to Perennials: Does Selection Enhance Tradeoffs between Yield and Longevity? Ind. Crops Prod. 2016, 91, 272–278. [Google Scholar] [CrossRef]
  7. Vico, G.; Brunsell, N.A. Tradeoffs between Water Requirements and Yield Stability in Annual vs. Perennial Crops. Adv. Water Resour. 2018, 112, 189–202. [Google Scholar] [CrossRef]
  8. Hendrickson, J.R.; Berdahl, J.D.; Liebig, M.A.; Karn, J.F. Tiller Persistence of Eight Intermediate Wheatgrass Entries Grazed at Three Morphological Stages. Agron. J. 2005, 97, 1390–1395. [Google Scholar] [CrossRef] [Green Version]
  9. Crain, J.; DeHaan, L.; Poland, J. Genomic Prediction Enables Rapid Selection of High-Performing Genets in an Intermediate Wheatgrass Breeding Program. Plant Genome 2021, 14, e20080. [Google Scholar] [CrossRef]
  10. DeHaan, L.; Christians, M.; Crain, J.; Poland, J. Development and Evolution of an Intermediate Wheatgrass Domestication Program. Sustainability 2018, 10, 1499. [Google Scholar] [CrossRef] [Green Version]
  11. Culman, S.W.; Snapp, S.S.; Ollenburger, M.; Basso, B.; DeHaan, L.R. Soil and Water Quality Rapidly Responds to the Perennial Grain Kernza Wheatgrass. Agron. J. 2013, 105, 735–744. [Google Scholar] [CrossRef] [Green Version]
  12. Duchene, O.; Dumont, B.; Cattani, D.J.; Fagnant, L.; Schlautman, B.; DeHaan, L.R.; Barriball, S.; Jungers, J.M.; Picasso, V.D.; David, C.; et al. Process-Based Analysis of Thinopyrum intermedium Phenological Development Highlights the Importance of Dual Induction for Reproductive Growth and Agronomic Performance. Agric. Forest Meteorol. 2021, 301–302, 108341. [Google Scholar] [CrossRef]
  13. Jungers, J.M.; DeHaan, L.H.; Mulla, D.J.; Sheaffer, C.C.; Wyse, D.L. Reduced Nitrate Leaching in a Perennial Grain Crop Compared to Maize in the Upper Midwest, USA. Agric. Ecosyst. Environ. 2019, 272, 63–73. [Google Scholar] [CrossRef]
  14. Jungers, J.M.; DeHaan, L.R.; Betts, K.J.; Sheaffer, C.C.; Wyse, D.L. Intermediate Wheatgrass Grain and Forage Yield Responses to Nitrogen Fertilization. Agron. J. 2017, 109, 462–472. [Google Scholar] [CrossRef] [Green Version]
  15. Law, E.P.; Wayman, S.; Pelzer, C.J.; DiTommaso, A.; Ryan, M.R. Intercropping Red Clover with Intermediate Wheatgrass Suppresses Weeds without Reducing Grain Yield. Agron. J. 2022, 114, 700–716. [Google Scholar] [CrossRef]
  16. Law, E.P.; Pelzer, C.J.; Wayman, S.; DiTommaso, A.; Ryan, M.R. Strip-Tillage Renovation of Intermediate Wheatgrass (Thinopyrum intermedium) for Maintaining Grain Yield in Mature Stands. Renew. Agric. Food Syst. 2021, 36, 321–327. [Google Scholar] [CrossRef]
  17. Pinto, P.; De Haan, L.; Picasso, V. Post-Harvest Management Practices Impact on Light Penetration and Kernza Intermediate Wheatgrass Yield Components. Agronomy 2021, 11, 442. [Google Scholar] [CrossRef]
  18. Muckey, E. Kernza® in Southern Minnesota: Assessing Local Viability of Intermediate Wheatgrass; University of Minnesota Extension: St. Paul, MN, USA, 2019; p. 33. Available online: https://conservancy.umn.edu/bitstream/handle/11299/202253/Kernza_Final_01272019.pdf?sequence=1 (accessed on 27 January 2022).
  19. Glover, J.D.; Reganold, J.P.; Bell, L.W.; Borevitz, J.; Brummer, E.C.; Buckler, E.S.; Cox, C.M.; Cox, T.S.; Crews, T.E.; Culman, S.W.; et al. Increased Food and Ecosystem Security via Perennial Grains. Science 2010, 328, 1638–1639. [Google Scholar] [CrossRef] [Green Version]
  20. Lanker, M.; Bell, M.; Picasso, V.D. Farmer Perspectives and Experiences Introducing the Novel Perennial Grain Kernza Intermediate Wheatgrass in the US Midwest. Renew. Agric. Food Syst. 2020, 35, 653–662. [Google Scholar] [CrossRef] [Green Version]
  21. Keene, C.L.; Law, E.P.; Jungers, J.M.; Stoltenberg, D.E. Herbicide Options for Use in Kernza Perennial Grain: IR-4 Update. In Proceedings of the North Central Weed Science Society Proceedings, Online, 30 November–3 December 2020; Virtual Meeting. Volume 75. [Google Scholar]
  22. Hunter, M.C.; Sheaffer, C.C.; Culman, S.W.; Lazarus, W.F.; Jungers, J.M. Effects of Defoliation and Row Spacing on Intermediate Wheatgrass II: Forage Yield and Economics. Agron. J. 2020, 112, 1862–1880. [Google Scholar] [CrossRef]
  23. Duchene, O.; Celette, F.; Ryan, M.R.; DeHaan, L.R.; Crews, T.E.; David, C. Integrating Multipurpose Perennial Grains Crops in Western European Farming Systems. Agric. Ecosyst. Environ. 2019, 284, 106591. [Google Scholar] [CrossRef]
  24. Ryan, M.R.; Crews, T.E.; Culman, S.W.; DeHaan, L.R.; Hayes, R.C.; Jungers, J.M.; Bakker, M.G. Managing for Multifunctionality in Perennial Grain Crops. BioScience 2018, 68, 294–304. [Google Scholar] [CrossRef] [PubMed]
  25. Bybee-Finley, K.A.; Ryan, M.R. Advancing Intercropping Research and Practices in Industrialized Agricultural Landscapes. Agriculture 2018, 8, 80. [Google Scholar] [CrossRef] [Green Version]
  26. Gaudin, A.C.M.; Westra, S.; Loucks, C.E.S.; Janovicek, K.; Martin, R.C.; Deen, W. Improving Resilience of Northern Field Crop Systems Using Inter-Seeded Red Clover: A Review. Agronomy 2013, 3, 148–180. [Google Scholar] [CrossRef] [Green Version]
  27. Favre, J.R.; Castiblanco, T.M.; Combs, D.K.; Wattiaux, M.A.; Picasso, V.D. Forage Nutritive Value and Predicted Fiber Digestibility of Kernza Intermediate Wheatgrass in Monoculture and in Mixture with Red Clover during the First Production Year. Anim. Feed Sci. Technol. 2019, 258, 114298. [Google Scholar] [CrossRef]
  28. Davis, A.S.; Hill, J.D.; Chase, C.A.; Johanns, A.M.; Liebman, M. Increasing Cropping System Diversity Balances Productivity, Profitability and Environmental Health. PLoS ONE 2012, 7, e47149. [Google Scholar] [CrossRef] [Green Version]
  29. Giuliano, S.; Ryan, M.R.; Véricel, G.; Rametti, G.; Perdrieux, F.; Justes, E.; Alletto, L. Low-Input Cropping Systems to Reduce Input Dependency and Environmental Impacts in Maize Production: A Multi-Criteria Assessment. Eur. J. Agron. 2016, 76, 160–175. [Google Scholar] [CrossRef]
  30. Vasileiadis, V.P.; Moonen, A.C.; Sattin, M.; Otto, S.; Pons, X.; Kudsk, P.; Veres, A.; Dorner, Z.; van der Weide, R.; Marraccini, E.; et al. Sustainability of European Maize-Based Cropping Systems: Economic, Environmental and Social Assessment of Current and Proposed Innovative IPM-Based Systems. Eur. J. Agron. 2013, 48, 1–11. [Google Scholar] [CrossRef]
  31. Maaz, T.; Wulfhorst, J.D.; McCracken, V.; Kirkegaard, J.; Huggins, D.R.; Roth, I.; Kaur, H.; Pan, W. Economic, Policy, and Social Trends and Challenges of Introducing Oilseed and Pulse Crops into Dryland Wheat Cropping Systems. Agric. Ecosyst. Environ. 2018, 253, 177–194. [Google Scholar] [CrossRef]
  32. Wayman, S.; Debray, V.; Parry, S.; David, C.; Ryan, M.R. Perspectives on Perennial Grain Crop Production among Organic and Conventional Farmers in France and the United States. Agriculture 2019, 9, 244. [Google Scholar] [CrossRef] [Green Version]
  33. Kletke, D. Enterprise Budgets. In Agricultural Policy Analysis Tools for Economic Development; Routledge: Milton Park, UK, 2019; pp. 189–211. ISBN 978-0-429-69380-9. [Google Scholar]
  34. Hoffman, E.; Cavigelli, M.A.; Camargo, G.; Ryan, M.; Ackroyd, V.J.; Richard, T.L.; Mirsky, S. Energy Use and Greenhouse Gas Emissions in Organic and Conventional Grain Crop Production: Accounting for Nutrient Inflows. Agric. Syst. 2018, 162, 89–96. [Google Scholar] [CrossRef]
  35. Camargo, G.G.T.; Ryan, M.R.; Richard, T.L. Energy Use and Greenhouse Gas Emissions from Crop Production Using the Farm Energy Analysis Tool. BioScience 2013, 63, 263–273. [Google Scholar] [CrossRef] [Green Version]
  36. Odum, H.T. Environmental Accounting: Emergy and Environmental Decision Making; John Wiley & Sons: New York, NY, USA, 1996. [Google Scholar]
  37. Hercher-Pasteur, J.; Loiseau, E.; Sinfort, C.; Hélias, A. Identifying the Resource Use and Circularity in Farm Systems: Focus on the Energy Analysis of Agroecosystems. Resour. Conserv. Recycl. 2021, 169, 105502. [Google Scholar] [CrossRef]
  38. Arguez, A.; Durre, I.; Applequist, S.; Vose, R.S.; Squires, M.F.; Yin, X.; Heim, R.R.; Owen, T.W. NOAA’s 1981–2010 U.S. Climate Normals: An Overview. Bull. Amer. Meteorol. 2012, 93, 1687–1697. [Google Scholar] [CrossRef]
  39. Caldwell, B.; Mohler, C.L.; Ketterings, Q.M.; DiTommaso, A. Yields and Profitability during and after Transition in Organic Grain Cropping Systems. Agron. J. 2014, 106, 871–880. [Google Scholar] [CrossRef] [Green Version]
  40. Nearing, M.A.; Xie, Y.; Liu, B.; Ye, Y. Natural and Anthropogenic Rates of Soil Erosion. Int. Soil Water Conserv. Res. 2017, 5, 77–84. [Google Scholar] [CrossRef]
  41. National Agricultural Statistics Service. Certified Organic Field Crops and Hay Harvested and Value of Sales: 2019; 2017 Census of Agriculture; United States Department of Agriculture: Washington, DC, USA, 2020; p. 125. [Google Scholar]
  42. Agricultural Marketing Service. Wolgemuth Hay Auction—New Holland, PA; USDA AMS Livestock, Poultry & Grain Market News: New Holland, PA, USA, 2021. Available online: https://mymarketnews.ams.usda.gov/viewReport/1716 (accessed on 27 January 2022).
  43. Ward, B.; Barker, F.J. Ohio Farm Custom Rates 2018; Ohio State University Extension: Columbus, OH, USA, 2018; Available online: https://farmoffice.osu.edu/sites/aglaw/files/site-library/farmmgtpdf/enterprisebudgets/Ohio%20Farm%20Custom%20Rates%20Final%202018.pdf (accessed on 27 January 2022).
  44. National Agricultural Statistics Service. Agricultural Land Values and Cash Rents. Final Estimates 2014–2018; United States Department of Agriculture: Washington, DC, USA, 2019; p. 18. [Google Scholar]
  45. Malcolm, G.M.; Camargo, G.G.T.; Ishler, V.A.; Richard, T.L.; Karsten, H.D. Energy and Greenhouse Gas Analysis of Northeast U.S. Dairy Cropping Systems. Agric. Ecosyst. Environ. 2015, 199, 407–417. [Google Scholar] [CrossRef]
  46. Eggleston, H.S.; Buendia, L.; Miwa, K.; Ngara, T.; Tanabe, K. 2006 IPCC Guidelines for National Greenhouse Gas Inventories; Intergovernmental Panel on Climate Change: Geneva, Switzerland, 2006. [Google Scholar]
  47. Ortiz-Cañavate, J.; Hernanz, J.L. Energy for Biological Systems. In CIGR Handbook of Agricultural Engineering; Kitani, O., Jungbluth, T., Peart, R.M., Ramdani, D., Eds.; American Society of Agricultural and Biological Engineers: St. Joseph, MI, USA, 1999; pp. 13–42. [Google Scholar]
  48. Hanna, M. Fuel Required for Field Operations 2001. Available online: http://www.extension.iastate.edu/Publications/PM709.pdf (accessed on 27 January 2022).
  49. Lazarus, W.F. Machinery Cost Estimates 2021. Available online: https://drive.google.com/uc?export=download&id=0B3psjoooP5QxWWd3a2cwblJCTjQ (accessed on 27 January 2022).
  50. Ulgiati, S.; Brown, M.T. Monitoring Patterns of Sustainability in Natural and Man-Made Ecosystems. Ecol. Modell. 1998, 108, 23–36. [Google Scholar] [CrossRef]
  51. Ulgiati, S.; Brown, M.T.; Bastianoni, S.; Marchettini, N. Emergy-Based Indices and Ratios to Evaluate the Sustainable Use of Resources. Ecol. Eng. 1995, 5, 519–531. [Google Scholar] [CrossRef]
  52. Brown, M.T.; Ulgiati, S. Emergy Analysis and Environmental Accounting. In Encyclopedia of Energy; Oxford Academic Press: Oxford, UK, 2004; Volume 2, pp. 329–354. [Google Scholar]
  53. R Core Team. R: A Language and Environment for Statistical Computing; R Foundation for Statistical Computing: Vienna, Austria, 2020. [Google Scholar]
  54. Bates, D.; Mächler, M.; Bolker, B.; Walker, S. Fitting Linear Mixed-Effects Models Using Lme4. J. Stat. Softw. 2015, 67, 1–48. [Google Scholar] [CrossRef]
  55. Lenth, R. Emmeans: Estimated Marginal Means, Aka Least-Squares Means; R Package Version 1.5.1; Github: San Francisco, CA, USA, 2020. [Google Scholar]
  56. Clark, I.; Jones, S.S.; Reganold, J.P.; Sanguinet, K.A.; Murphy, K.M. Agronomic Performance of Perennial Grain Genotypes in the Palouse Region of the Pacific Northwest, USA. Front. Sustain. Food Syst. 2019, 3, 39. [Google Scholar] [CrossRef]
  57. Fernandez, C.W.; Ehlke, N.; Sheaffer, C.C.; Jungers, J.M. Effects of Nitrogen Fertilization and Planting Density on Intermediate Wheatgrass Yield. Agron. J. 2020, 112, 4159–4170. [Google Scholar] [CrossRef]
  58. Hunter, M.C.; Sheaffer, C.C.; Culman, S.W.; Jungers, J.M. Effects of Defoliation and Row Spacing on Intermediate Wheatgrass I: Grain Production. Agron. J. 2020, 112, 1748–1763. [Google Scholar] [CrossRef]
  59. Pugliese, J.Y.; Culman, S.W.; Sprunger, C.D. Harvesting Forage of the Perennial Grain Crop Kernza (Thinopyrum intermedium) Increases Root Biomass and Soil Nitrogen Cycling. Plant Soil 2019, 437, 241–254. [Google Scholar] [CrossRef]
  60. Wayman, S.; Ryan, M.R.; Law, E.P.; DeHaan, L.R.; Culman, S.W. Developing Perennial Grain Cropping Systems and Market Opportunities in the Northeast; NESARE Project Report; Northeast SARE: South Burlington, VT, USA, 2021; Available online: https://projects.sare.org/project-reports/lne16-351/ (accessed on 27 January 2022).
  61. Wieme, R.A.; Carpenter-Boggs, L.A.; Crowder, D.W.; Murphy, K.M.; Reganold, J.P. Agronomic and Economic Performance of Organic Forage, Quinoa, and Grain Crop Rotations in the Palouse Region of the Pacific Northwest, USA. Agric. Syst. 2020, 177, 102709. [Google Scholar] [CrossRef]
  62. Gaudin, A.C.M.; Tolhurst, T.N.; Ker, A.P.; Janovicek, K.; Tortora, C.; Martin, R.C.; Deen, W. Increasing Crop Diversity Mitigates Weather Variations and Improves Yield Stability. PLoS ONE 2015, 10, e0113261. [Google Scholar] [CrossRef] [Green Version]
  63. Bell, L.W.; Byrne (nee Flugge), F.; Ewing, M.A.; Wade, L.J. A Preliminary Whole-Farm Economic Analysis of Perennial Wheat in an Australian Dryland Farming System. Agric. Syst. 2008, 96, 166–174. [Google Scholar] [CrossRef]
  64. Cox, W.; Hanchar, J.J.; Cherney, J.; Sorrells, M. Economic Responses of Maize, Soybean, and Wheat in Three Rotations under Conventional and Organic Systems. Agronomy 2019, 9, 424. [Google Scholar] [CrossRef] [Green Version]
  65. Adigun, O.D. Evaluating the Economic Effects of Using Broiler Litter as an Alternative Fertilizer for a Corn-Wheat-Soybean Cropping Sequence in South Carolina. 2020. Available online: https://tigerprints.clemson.edu/cgi/viewcontent.cgi?article=4267&context=all_theses (accessed on 27 January 2022).
  66. Li, S.; Jensen, E.S.; Liu, N.; Zhang, Y.; Dimitrova Mårtensson, L.-M. Species Interactions and Nitrogen Use during Early Intercropping of Intermediate Wheatgrass with a White Clover Service Crop. Agronomy 2021, 11, 388. [Google Scholar] [CrossRef]
  67. Tautges, N.E.; Jungers, J.M.; DeHaan, L.R.; Wyse, D.L.; Sheaffer, C.C. Maintaining Grain Yields of the Perennial Cereal Intermediate Wheatgrass in Monoculture v. Bi-Culture with Alfalfa in the Upper Midwestern USA. J. Agric. Sci. 2018, 156, 758–773. [Google Scholar] [CrossRef]
  68. Piringer, G.; Steinberg, L.J. Reevaluation of Energy Use in Wheat Production in the United States. J. Ind. Ecol. 2006, 10, 149–167. [Google Scholar] [CrossRef]
  69. Kramer, K.J.; Moll, H.C.; Nonhebel, S. Total Greenhouse Gas Emissions Related to the Dutch Crop Production System. Agric. Ecosyst. Environ. 1999, 72, 9–16. [Google Scholar] [CrossRef]
  70. Biswas, W.K.; Graham, J.; Kelly, K.; John, M.B. Global Warming Contributions from Wheat, Sheep Meat and Wool Production in Victoria, Australia—A Life Cycle Assessment. J. Clean. Prod. 2010, 18, 1386–1392. [Google Scholar] [CrossRef]
  71. Martin, J.F.; Diemont, S.A.W.; Powell, E.; Stanton, M.; Levy-Tacher, S. Emergy Evaluation of the Performance and Sustainability of Three Agricultural Systems with Different Scales and Management. Agric. Ecosyst. Environ. 2006, 115, 128–140. [Google Scholar] [CrossRef]
  72. Wang, X.; Chen, Y.; Sui, P.; Gao, W.; Qin, F.; Zhang, J.; Wu, X. Emergy Analysis of Grain Production Systems on Large-Scale Farms in the North China Plain Based on LCA. Agric. Syst. 2014, 128, 66–78. [Google Scholar] [CrossRef]
  73. Brown, M.T.; Brandt-Williams, S.L.; Tilley, D.; Ulgiati, S. Emergy Synthesis: An Introduction. In Emergy Synthesis: Theory and Applications of the Emergy Methodology; University of Florida: Gainesville, FL, USA, 2000; pp. 1–14. [Google Scholar]
  74. Ghaley, B.B.; Kehli, N.; Mentler, A. Emergy Synthesis of Conventional Fodder Maize (Zea mays L.) Production in Denmark. Ecol. Indic. 2018, 87, 144–151. [Google Scholar] [CrossRef]
  75. Coppola, F.; Haugaard-Nielsen, H.; Bastianoni, S.; Østergård, H. Sustainability Assessment of Wheat Production Using Emergy. In Proceedings of the Cultivating the Future Based on Science. Proceedings of the Second Scientific Research Conference of the International Society of Organic Agriculture Research; International Society of Organic Agriculture Research: Modena, Italy, 2008. [Google Scholar]
  76. Kuczuk, A. Cost-, Cumulative Energy- and Emergy Aspects of Conventional and Organic Winter Wheat (Triticum aestivum L.) Cultivation. JAS 2016, 8, 140. [Google Scholar] [CrossRef]
  77. Battaglia, M.; Thomason, W.; Fike, J.H.; Evanylo, G.K.; von Cossel, M.; Babur, E.; Iqbal, Y.; Diatta, A.A. The Broad Impacts of Corn Stover and Wheat Straw Removal for Biofuel Production on Crop Productivity, Soil Health and Greenhouse Gas Emissions: A Review. GCB Bioenergy 2021, 13, 45–57. [Google Scholar] [CrossRef]
Figure 1. Cumulative precipitation and growing degree days (0 °C base) observed at Aurora, New York, USA between 2016 and 2019.
Sustainability 14 03548 g001
Figure 2. Emergy flow diagram for a typical grain production system.
Sustainability 14 03548 g002
Figure 3. Summary of enterprise budget analysis for three-year rotations for five organic cropping systems: IWG intercropped with red clover (IWG-C), IWG with no clover (IWG-N), annual winter wheat with (Wheat-C) and without red clover (Wheat-N), and a corn–soybean–spelt (C-S-Sp).
Sustainability 14 03548 g003
Figure 4. Sensitivity analysis of the effect of IWG grain and forage yields on Kernza grain price required to match returns from an organic corn–soybean–spelt rotation.
Sustainability 14 03548 g004
Figure 5. Sensitivity analysis of Kernza grain price calculated to match NPV of dual-purpose organic winter wheat under varying wheat grain and straw price scenarios. Calculations assume that IWG hay price is equal to wheat straw price to reflect the strength of the local market for animal feed and bedding. Wheat grain and straw prices represent highs and lows observed in state- and national-level USDA conventional and organic crop production surveys [39,40,59].
Sustainability 14 03548 g005
Figure 6. Crop production energy-use comparison for five organic cropping systems. Scale of x-axis units varies by the three methods of allocating energy to production: unit of area basis (MJ ha−1 yr−1), unit of crop biomass harvested basis (MJ kg crop biomass−1 yr−1), and unit of grain yield basis (MJ kg grain yield−1 yr−1).
Sustainability 14 03548 g006
Figure 7. Greenhouse gas emissions comparison for five organic cropping systems. Scale of x-axis units varies by the three methods of allocating emissions to production: unit of area basis (kg CO2e ha−1 yr−1), unit of crop biomass harvested basis (kg CO2e kg crop biomass−1 ha−1 yr−1), and unit of grain yield basis (kg CO2e kg grain yield−1 ha−1 yr−1).
Sustainability 14 03548 g007
Figure 8. Emergy flows of inputs to five organic cropping systems.
Sustainability 14 03548 g008
Figure 9. Comparison of five organic cropping systems across agronomic, economic, and environmental sustainability indicators: grain yield (kg ha−1 yr−1), total harvested biomass (kg ha−1 yr−1), Emergy Sustainability Index (ESI, unitless), energy use (MJ ha−1 yr−1), greenhouse gas emissions (kg CO2e ha−1 yr−1), and total production costs (USD ha−1 yr−1). Cropping systems evaluated were IWG–red clover intercrop (IWGC), IWG monoculture (IWGN), wheat–red clover intercrop (WC), wheat monoculture (WN), and corn–soybean–spelt rotation (CSS).
Sustainability 14 03548 g009
Table 1. Schedule of field operations for IWG and wheat production systems between 2016 and 2019 in Aurora, New York, NY, USA.
Field OperationEquipment Used2016201720182019
Primary tillageMoldboard plowAug 16---
Fall fertilizer applicationDrop spreaderAug 30Sep 13Sep 13-
Secondary tillage and plantingDisk harrow, cultipacker, grain drillAug 31Sep 14Sep 14-
Frost seeding red cloverNone (broadcast by hand)-Mar 29Mar 22Mar 19 1
Spring fertilizer applicationNone (broadcast by hand)-Apr 19Apr 20Apr 25
Wheat grain and straw harvestPlot combine, flail chopper-Jul 19Jul 11Jul 15
IWG grain and forage harvestPlot combine, flail chopper-Aug 9Aug 15Aug 23
1 Red clover was frost-seeded in 2019 into wheat plots only.
Table 2. Description of emergy-based sustainability indicators.
Emergy IndicatorAbbreviationEquation 1
Specific Emergy-(R + N + F)/mass of product
Emergy Yield RatioEYR(R + N + F)/F
Environmental Loading RatioELR(F + N)/R
Emergy Sustainability IndexESIEYR/ELR
1 R = subtotal of renewable emergy flows; N = subtotal of non-renewable local emergy flows; F = subtotal of purchased or imported emergy flows (feedback from the economy).
Table 3. Results of ANOVA for crop productivity indicators. Hypothesis testing was performed on log-transformed data, but back-transformed treatment means are presented.
FactorLevelGrain YieldCrop BiomassRed Clover Biomass 1Forage Yield 2
kg ha−1
Grain CropIWG478b 35486a1413a6438a
Wheat2807a3828b411b4024b
IntercropRed clover1224 4675 911 5597a
No clover1097 4537 NA 4675b
Year20172039a5324a632b5653a
2018728c3463b1600a4230b
20191033b5271a502b5541a
Grain Crop x Year
 IWG20171212a5541b809b5943b
2018202c3866b3004a5597b
2019441b7785a425b8022a
 Wheat20173429A5167A456A5378A
20182644A3072B196A3165B
20192416A3533B580A3866B
Effect p-value
Grain Crop <0.001 0.0208 <0.001 0.0051
Intercrop 0.2533 0.6854 NA 0.0017
Year <0.001 <0.001 <0.001 <0.001
Grain Crop x Intercrop 0.7529 0.8853 NA 0.1680
Grain Crop x Year <0.001 <0.001 <0.001 <0.001
Intercrop x Year 0.0965 0.4079 NA 0.0416
Crop x Intercrop x Year 0.8084 0.4954 NA 0.4971
1 Red clover biomass is not reported for plots that were not interseeded. Any red clover collected in those plots was considered a weed.2 Forage yields represent the sum of crop and red clover biomass. 3 Within a factor, treatments sharing the same letter were not significantly different at α = 0.05. Simple effects for grain crop by year interactions are reported, with lower- and upper-case letters indicating differences between years for IWG and wheat, respectively. Bolded p-values are significant at α = 0.05.
Table 4. Summary results of emergy evaluation of three years of organic grain production from five cropping systems: IWG intercropped with red clover (IWG-C), IWG with no clover (IWG-N), annual winter wheat with (Wheat-C) and without red clover (Wheat-N), and a corn–soybean–spelt rotation (C-S-Sp). Emergy-based sustainability indicators include Emergy Yield Ratio (EYR), Environmental Loading Ratio (ELR), and Emergy Sustainability Index (ESI).
Sustainability IndicatorIWG-CIWG-NWheat-CWheat-NC-S-Sp
Specific emergy (seJ g−1)3.67 × 1093.50 × 1091.09 × 1091.24 × 1095.82 × 108
Emergy yield (Y)7.03 × 10156.84 × 10151.03 × 10151.02 × 10169.30 × 1015
Renewable fraction (R) 4.70 × 10154.70 × 10154.70 × 10154.70 × 10154.70 × 1015
Nonrenewable local fraction (N)7.62 × 10147.62 × 10142.82 × 10152.82 × 10152.82 × 1015
Purchased fraction (F)1.56 × 10151.40 × 10152.74 × 10152.64 × 10151.78 × 1015
EYR (Y/F)4.504.883.743.845.23
ELR (N + F/R)0.490.461.181.160.98
ESI (EYR/ELR)9.1110.603.173.315.36
Table 5. Summary results of emergy evaluation of three years of organic straw or hay production from four cropping systems: IWG intercropped with red clover (IWG-C), IWG with no clover (IWG-N), and annual winter wheat with (Wheat-C) and without intercropped red clover (Wheat-N). Emergy-based sustainability indicators include Emergy Yield Ratio (EYR), Environmental Loading Ratio (ELR), and Emergy Sustainability Index (ESI).
Sustainability IndicatorIWG-CIWG-NWheat-CWheat-N
Specific emergy (seJ g−1)3.16 × 1083.90 × 1087.78 × 1088.44 × 108
Emergy yield (Y)7.14 × 10156.87 × 10151.03 × 10161.02 × 1016
Renewable fraction (R) 4.70 × 10154.70 × 10154.70 × 10154.70 × 1015
Nonrenewable local fraction (N)7.62 × 10147.62 × 10142.82 × 10152.82 × 1015
Purchased fraction (F)1.64 × 10151.40 × 10152.75 × 10152.65 × 1015
EYR (Y/F)4.374.903.743.84
ELR (N + F/R)0.510.461.181.16
ESI (EYR/ELR)8.5610.653.163.30
Publisher’s Note: MDPI stays neutral with regard to jurisdictional claims in published maps and institutional affiliations.

