
Effect of Environmental Planning on Elderly Individual Quality of Life in Severe Cold Regions: A Case Study in Northeastern China

Abstract
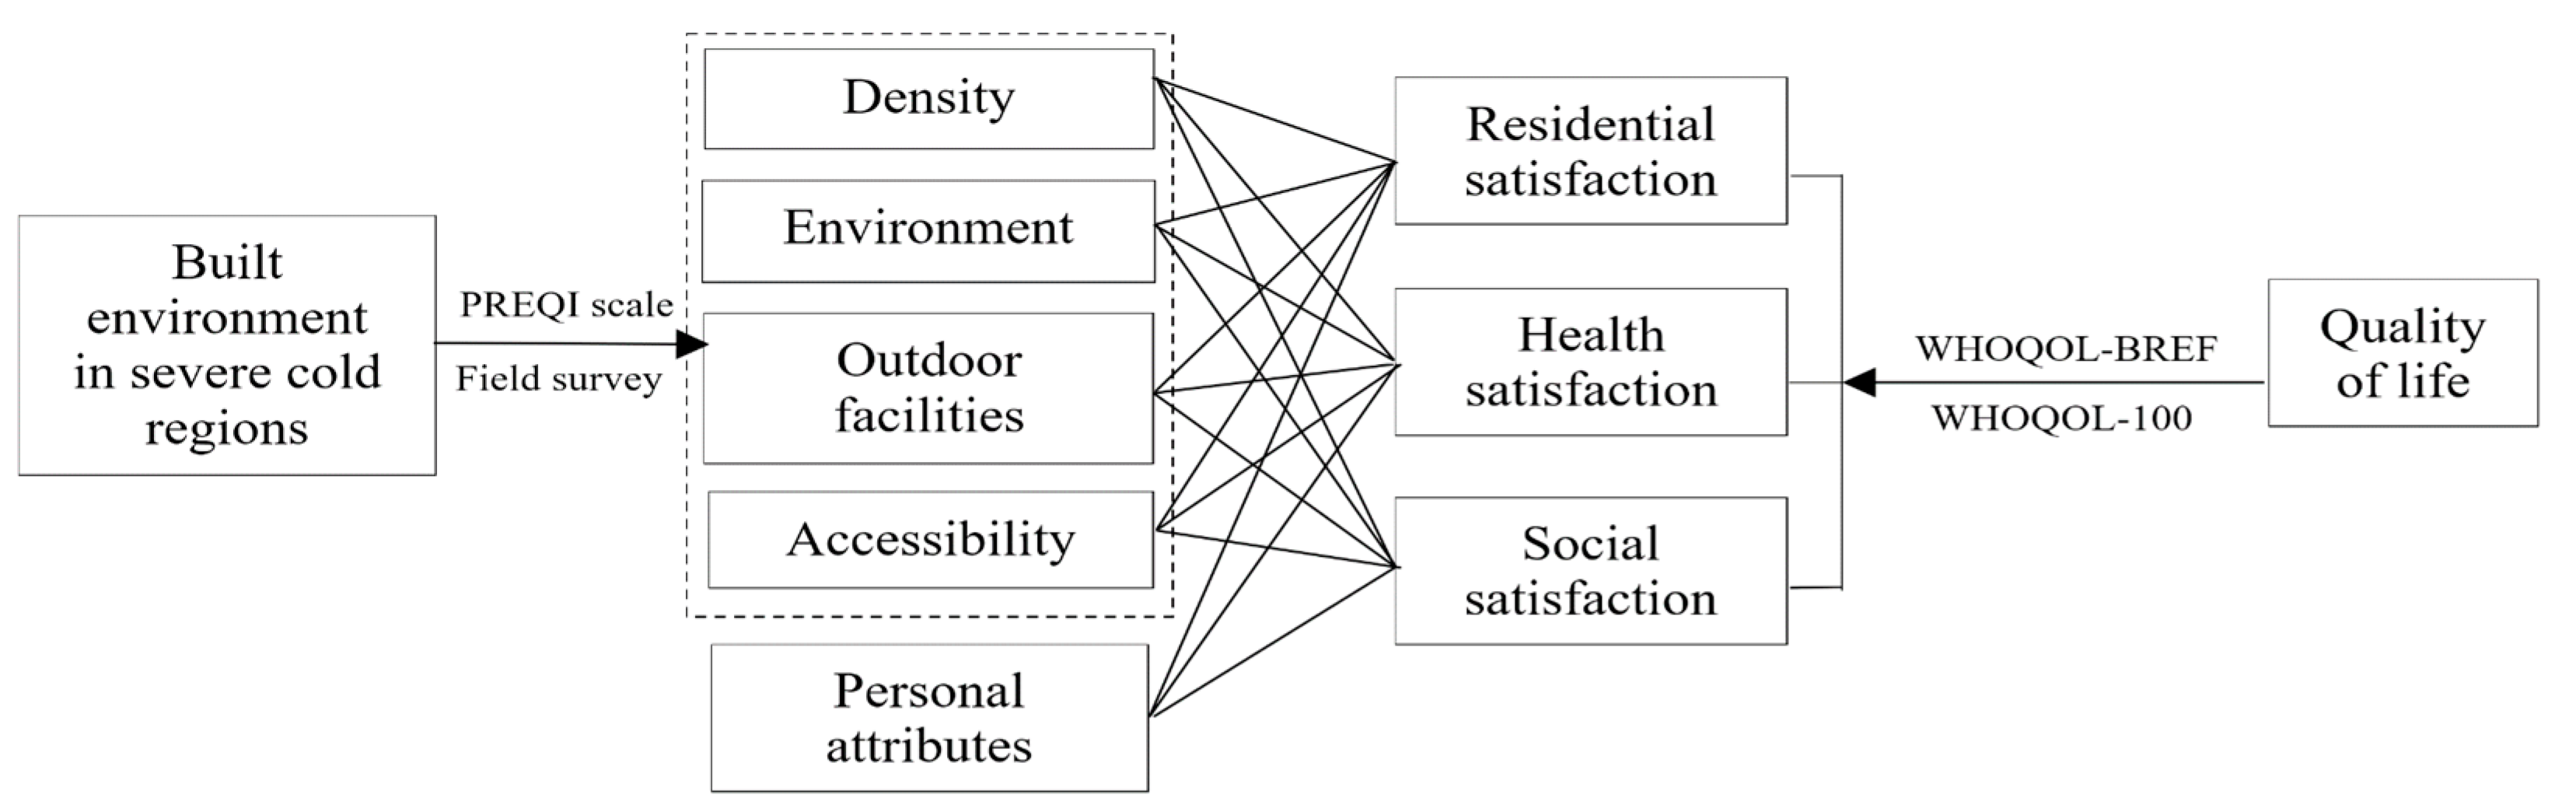
:1. Introduction
2. Materials and Methods
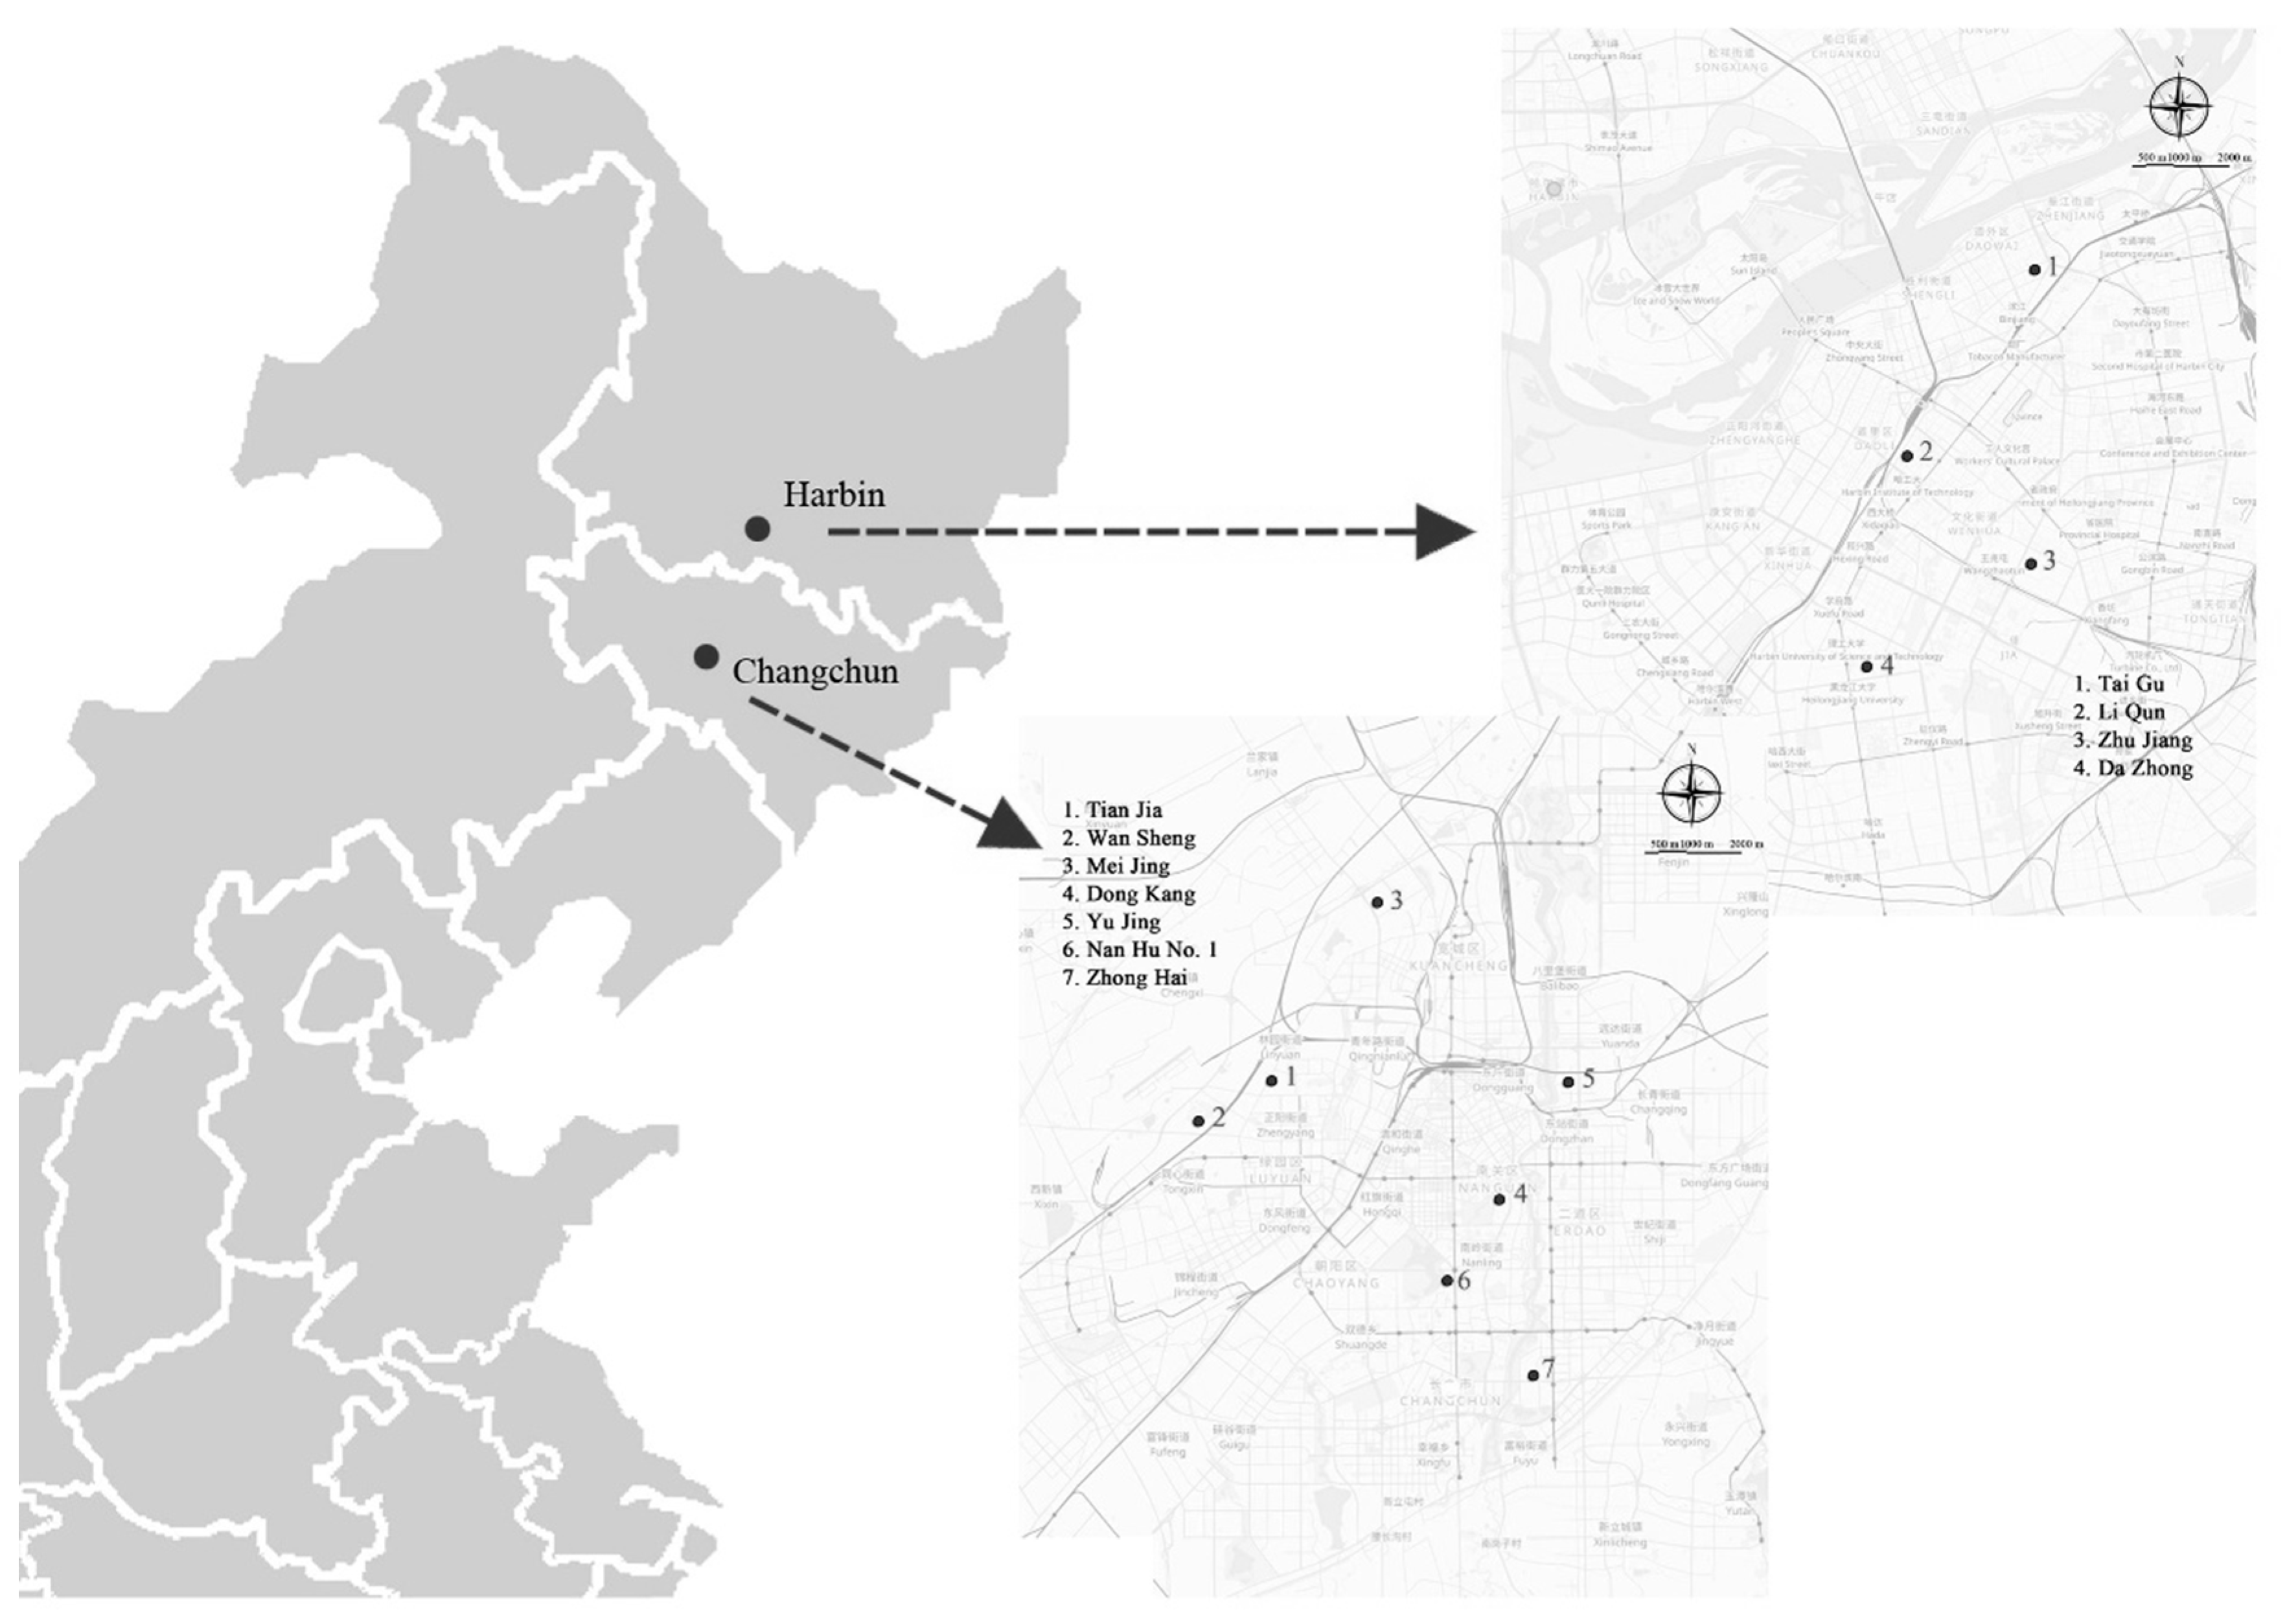
2.1. Site Study
2.2. Measurement
2.3. Data Description
2.4. Research Methods
3. Results and Discussion
3.1. Ordered Logit Model
3.2. Generalized Ordered Logit Model
3.3. Model Validation
3.4. Marginal Effects
4. Conclusions
Limitation
Author Contributions
Funding
Informed Consent Statement
Acknowledgments
Conflicts of Interest
References
- United Nations. World Population Prospects 2019: Highlights. 2019. Available online: https://www.un.org/development/desa/publications/world-population-prospects-2019-highlights.html (accessed on 17 June 2021).
- Zeng, X.; Li, T.; Chen, C.; Si, Z.; Huang, G.; Guo, P.; Zhuang, X. A hybrid land-water-environment model for identification of ecological effect and risk under uncertain meteorological precipitation in an agroforestry ecosystem. Sci. Total Environ. 2018, 633, 1613–1628. [Google Scholar] [CrossRef]
- Zeng, X.; Xiang, H.; Liu, J.; Xue, Y.; Zhu, J.; Xu, Y. Identification of Policies Based on Assessment-Optimization Model to Confront Vulnerable Resources System with Large Population Scale in a Big City. Int. J. Environ. Res. Public Health. 2021, 18, 13097. [Google Scholar] [CrossRef] [PubMed]
- Vindegaard, N.; Benros, M.E. COVID-19 pandemic and mental health consequences: Systematic review of the current evidence. Brain Behav. Immun. 2020, 89, 531–542. [Google Scholar] [CrossRef]
- Pappa, S.; Ntella, V.; Giannakas, T.; Giannakoulis, V.G.; Papoutsi, E.; Katsaounou, P. Prevalence of depression, anxiety, and insomnia among healthcare workers during the COVID-19 pandemic: A systematic review and meta-analysis. Brain Behav. Immun. 2020, 88, 901–907. [Google Scholar] [CrossRef] [PubMed]
- Salingaros, N.A. Rules for Urban Space: Design Patterns Create the Human Scale. J. Urban Res. Dev. 2021, 2, 4–16. Available online: https://ojs.emu.edu.tr/index.php/jurd/article/view/240 (accessed on 25 December 2021).
- Moreno, C.; Allam, Z.; Chabaud, D.; Gall, C.; Pratlong, F. Introducing the 15-Minute City: Sustainability, Resilience and Place Identity in Future Post-Pandemic Cities. Smart Cities 2021, 4, 93–111. [Google Scholar] [CrossRef]
- WHOQOL-SRPB Field-Test Instrument: WHOQOL Spirituality, Religiousness and Personal Beliefs (SRPB) Field-Test Instrument: The WHOQOL-100 Questions Plus 32 SRPB Questions. 2012. Available online: https://www.who.int/publications/i/item/WHO-MSD-MER-Rev-2012-04 (accessed on 18 September 2021).
- Owen, D.; Russell, P.; Scott, M. Positive perceptions of green and open space as predictors of neighbourhood quality of life: Implications for urban planning across the city region. J. Environ. Plan. Manag. 2018, 62, 626–646. [Google Scholar] [CrossRef]
- Puts, M.T.; Shekary, N.; Widdershoven, G.; Heldens, J.; Lips, P.; Deeg, D.J. What does quality of life mean to older frail and non-frail community-dwelling adults in The Netherlands? Qual. Life Res. 2007, 16, 263–277. [Google Scholar] [CrossRef] [PubMed]
- Bilotta, C.; Bowling, A.; Casè, A.; Nicolini, P.; Mauri, S.; Castelli, M.; Vergani, C. Dimensions and correlates of quality of life according to frailty status: A cross-sectional study on community-dwelling older adults referred to an outpatient geriatric service in Italy. Health Qual. Life Outcomes 2010, 8, 56. [Google Scholar] [CrossRef] [Green Version]
- Bowling, A.; Gabriel, Z.; Dykes, J.; Dowding, L.M.; Evans, O.; Fleissig, A.; Banister, D.; Sutton, S. Let′s ask them: A national survey of definitions of quality of life and its enhancement among people aged 65 and over. Int. J. Aging Hum. Dev. 2003, 56, 269–306. [Google Scholar] [CrossRef] [PubMed]
- Gabriel, Z.; Bowling, A. Quality of life from the perspectives of older people. Ageing Soc. 2004, 24, 675–691. [Google Scholar] [CrossRef] [Green Version]
- Borglin, G.; Edberg, A.K.; Hallberg, I.R. The experience of quality of life among older people. J. Aging Stud. 2005, 19, 201–220. [Google Scholar] [CrossRef]
- Campbell, A.; Converse, P.E.; Rodgers, W.L. The Quality of American Life. Acad. Manag. Rev. 1977, 2, 694–696. [Google Scholar] [CrossRef]
- Cervero, R.; Kockelman, K. Travel demand and the 3Ds: Density, diversity, and design. Transp. Res. Part D Transp. Environ. 1997, 2, 199–219. [Google Scholar] [CrossRef]
- Ewing, R.; Robert, C. Travel and the Built Environment: A Synthesis. Transp. Res. Rec. J. Transp. Res. Board 2001, 1780, 87–114. [Google Scholar] [CrossRef] [Green Version]
- Liu, Y.; Dijst, M.; Faber, J.; Geertman, S.; Cui, C. Healthy urban living: Residential environment and health of older adults in Shanghai. Health Place 2017, 47, 80–89. [Google Scholar] [CrossRef] [PubMed]
- Jia, X.; Yu, Y.; Xia, W.; Masri, S.; Sami, M.; Hu, Z.; Yu, Z.; Wu, J. Cardiovascular diseases in middle aged and older adults in China: The joint effects and mediation of different types of physical exercise and neighborhood greenness and walkability. Environ. Res. 2018, 167, 175–183. [Google Scholar] [CrossRef]
- Rantakokko, M.; Iwarsson, S.; Portegijs, E.; Viljanen, A.; Rantanen, T. Associations Between Environmental Characteristics and Life-Space Mobility in Community-Dwelling Older People. J. Aging Health 2015, 27, 606–621. [Google Scholar] [CrossRef]
- Halaweh, H.; Dahlin-Ivanoff, S.; Svantesson, U.; Willen, C. Perspectives of Older Adults on Aging Well: A Focus Group Study. J. Aging Res. 2018, 2018, 9858252. [Google Scholar] [CrossRef] [PubMed] [Green Version]
- Padeiro, M.; Jose, J.; Amado, C.; Sousa, L.; Oliveira, C.R.; Esteves, A.; McGarrigle, J. Neighborhood Attributes and Well-Being Among Older Adults in Urban Areas: A Mixed-Methods Systematic Review. Res. Aging 2021. [Google Scholar] [CrossRef]
- Tiraphat, S.; Pelltzer, k.; Thamma-Aphiphol, K.; Suthisukon, K. The Role of Age-Friendly Environments on Quality of Life among Thai Older Adults. Int. J. Environ. Res. Public Health 2017, 14, 282. [Google Scholar] [CrossRef] [PubMed]
- Rojo-Pérez, F.; Fernández-Mayoralas, G.; Forjaz, M.J.; Prieto-Flores, M.E.; Martínez-Martí, P. Residential environment and health conditions among older-adults in community-dwelling in Spain: What influences quality of life? Environ. Gerontol. Eur. Lat. Am. 2016, 13, 149–174. [Google Scholar] [CrossRef] [Green Version]
- Zhang, F.; Li, D.; Ahrentzen, S.; Feng, H. Exploring the inner relationship among neighborhood environmental factors affecting quality of life of older adults based on SLR-ISM method. J. Hous. Built Environ. 2020, 35, 215–242. [Google Scholar] [CrossRef]
- Curl, A.; Thompson, C.W.; Aspinall, P. The effectiveness of ‘shared space’ residential street interventions on self-reported activity levels and quality of life for older people. Landsc. Urban Plan. 2015, 139, 117–125. [Google Scholar] [CrossRef] [Green Version]
- Vogt, S.; Mielck, A.; Berger, U.; Grill, E.; Peters, A.; Döring, A.; Holle, R.; Strobl, R.; Zimmermann, A.; Linkohr, B.; et al. Neighborhood and healthy aging in a German city: Distances to green space and senior service centers and their associations with physical constitution, disability, and health-related quality of life. Eur. J. Ageing 2015, 12, 273–283. [Google Scholar] [CrossRef] [PubMed] [Green Version]
- Cristina, F.; David, A.; Ángela, B.P. Dwelling conditions and life satisfaction of older people through residential satisfaction. J. Environ. Psychol. 2017, 49, 1–7. [Google Scholar] [CrossRef]
- Gargiulo, C.; Zucaro, F.; Gaglione, F. A Set of Variables for the Elderly Accessibility in Urban Areas. 2018. Available online: http://www.serena.unina.it/index.php/tema/article/view/5738 (accessed on 5 December 2021).
- Parra, D.C.; Gomez, L.F.; Sarmiento, O.L.; Buchner, D.; Brownson, R.; Schimd, T.; Gomez, V.; Lobelo, F. Perceived and objective neighborhood environment attributes and health related quality of life among the elderly in Bogota, Colombia. Soc. Sci. Med. 2010, 70, 1070–1076. [Google Scholar] [CrossRef] [PubMed]
- Spring, A. Short- and Long-Term Impacts of Neighborhood Built Environment on Self-Rated Health of Older Adults. Gerontologist 2018, 58, 36–46. [Google Scholar] [CrossRef] [PubMed]
- Yu, S.; Liu, Y.; Cui, C.; Xia, B. Influence of Outdoor Living Environment on Elders’ Quality of Life in Old Residential Communities. Sustainability 2019, 23, 6638. [Google Scholar] [CrossRef] [Green Version]
- Gong, Y.; Gallacher, J.; Palmer, S.; Fone, D. Neighbourhood green space, physical function and participation in physical activities among elderly men: The Caerphilly Prospective study. Int. J. Behav. Nutr. Phys. Act. 2014, 11, 40. [Google Scholar] [CrossRef] [Green Version]
- Mouratidis, K. Built environment and leisure satisfaction: The role of commute time, social interaction, and active travel. J. Transp. Geogr. 2019, 80, 102491. [Google Scholar] [CrossRef]
- Boessen, A.; Hipp, J.R.; Butts, C.T.; Nagle, N.N.; Smith, E.J. The built environment, spatial scale, and social networks: Do land uses matter for personal network structure? Environ. Plan. B Urban Anal. City Sci. 2017, 45, 400–416. [Google Scholar] [CrossRef] [Green Version]
- Tao, Y.; Yang, J.; Chai, Y. The Anatomy of Health-Supportive Neighborhoods: A Multilevel Analysis of Built Environment, Perceived Disorder, Social Interaction and Mental Health in Beijing. Int. J. Environ. Res. Public Health 2019, 17, 13. [Google Scholar] [CrossRef] [Green Version]
- Jun, H.; Hur, M. The relationship between walkability and neighborhood social environment: The importance of physical and perceived walkability. Appl. Geogr. 2015, 62, 115–124. [Google Scholar] [CrossRef]
- Orban, E.; Sutcliffe, R.; Dragano, N.; Jockel, K.H.; Moebus, S. Residential Surrounding Greenness, Self-Rated Health and Interrelations with Aspects of Neighborhood Environment and Social Relations. J. Urban Health 2017, 94, 158–169. [Google Scholar] [CrossRef] [Green Version]
- Buys, L.; Evonne, M. Residential satisfaction in inner urban higher-density Brisbane, Australia: Role of dwelling design, neighbourhood and neighbours. J. Environ. Plan. Manag. 2012, 55, 319–338. [Google Scholar] [CrossRef] [Green Version]
- Cao, X. How does neighborhood design affect life satisfaction? Evidence from Twin Cities. Travel Behav. Soc. 2016, 5, 68–576. [Google Scholar] [CrossRef]
- Dang, Y.; Dong, G.; Chen, Y.; Jones, K.; Zhang, W. Residential environment and subjective well-being in Beijing: A fine-grained spatial scale analysis using a bivariate response binomial multilevel model. Environ. Plan. B Urban Anal. City Sci. 2017, 46, 648–667. [Google Scholar] [CrossRef] [Green Version]
- Kyttä, M.; Anna, B.; Mohammed, H.; Kaisa, S. Urban happiness: Context-sensitive study of the social sustainability of urban settings. Environ. Plan. B Plan. Des. 2015, 43, 34–57. [Google Scholar] [CrossRef]
- Sohn, D. Residential crimes and neighbourhood built environment: Assessing the effectiveness of crime prevention through environmental design (CPTED). Cities 2016, 52, 86–93. [Google Scholar] [CrossRef]
- Ban, J.; Lan, L.; Yang, C.; Wang, J.; Chen, C.; Huang, G.; Li, T. Public Perception of Extreme Cold Weather-Related Health Risk in a Cold Area of Northeast China. Disaster Med. Public Health Prep. 2017, 11, 417–421. [Google Scholar] [CrossRef] [PubMed]
- Zeng, Y.; Gu, D.; Purser, J.; Hoenig, H.; Christakis, N. Associations of environmental factors with elderly health and mortality in China. Am. J. Public Health 2010, 100, 298–305. [Google Scholar] [CrossRef]
- Leng, H.; Li, S.; Zhao, H.; Song, Y.; Yuan, Q. Planning for Supportive Green Spaces in the Winter City of China: Linking Exercise of Elderly Residents and Exercise Prescription for Cardiovascular Health. Int. J. Environ. Res. Public Health 2020, 17, 5762. [Google Scholar] [CrossRef] [PubMed]
- Liang, S.; Leng, H.; Yuan, Q.; Wang, B.; Yuan, C. How does weather and climate affect pedestrian walking speed during cool and cold seasons in severely cold areas? Build. Environ. 2020, 175, 106811. [Google Scholar] [CrossRef]
- Jin, H.; Wang, B.; Han, B. Study on Environment Regulation of Residential in Severe Cold Area of China in Winter: Base on Outdoor Thermal Comfort of the Elderly. Sustainability 2019, 11, 6509. [Google Scholar] [CrossRef] [Green Version]
- The Seventh National Population Census of China. 2021. Available online: http://www.stats.gov.cn/tjsj/tjgb/rkpcgb/qgrkpcgb/202106/t20210628_1818824.html (accessed on 11 May 2021).
- Morris, J.N.; Hardman, A.E. Walking to health. Sports Med. 1997, 23, 306–332. [Google Scholar] [CrossRef] [PubMed]
- Nathan, A.; Wood, L.; Giles-Corti, B. Exploring socioecological correlates of active living in retirement village residents. J. Aging Phys. Act. 2014, 22, 1–15. [Google Scholar] [CrossRef] [PubMed] [Green Version]
- Cerin, E.; Zhang, C.J.; Barnett, A.; Sit, C.H.; Cheung, M.M.; Johnston, J.M.; Lai, P.C.; Lee, R.S. Associations of objectively-assessed neighborhood characteristics with older adults′ total physical activity and sedentary time in an ultra-dense urban environment: Findings from the ALECS study. Health Place 2016, 42, 1–10. [Google Scholar] [CrossRef]
- Adams, M.A.; Frank, L.D.; Schipperijn, J.; Smith, G.; Chapman, J.; Christiansen, L.B.; Coffee, N. International variation in neighborhood walkability, transit, and recreation environments using geographic information systems: The IPEN adult study. Int. J. Health Geogr. 2014, 13, 43. [Google Scholar] [CrossRef] [Green Version]
- Zhu, J.; Fan, Y. Daily travel behavior and emotional well-being: Effects of trip mode, duration, purpose, and companionship. Transp. Res. Part A Policy Pract. 2018, 118, 360–373. [Google Scholar] [CrossRef]
- Haqverdi, M.Q.; Seyedabrishami, S.; Groeger, J. Identifying psychological and socio-economic factors affecting motorcycle helmet use. Accid Anal. Prev. 2015, 85, 102–110. [Google Scholar] [CrossRef] [PubMed]
- Stipancic, J.; Zangenehpour, S.; Miranda-Moreno, L.; Saunier, N.; Granie, M. Investigating the gender differences on bicycle-vehicle conflicts at urban intersections using an ordered logit methodology. Accid. Anal. Prev. 2016, 97, 19–27. [Google Scholar] [CrossRef]
- Yoojin, Y.; Kim, E. The Effects of Accessibility to Medical Facilities and Public Transportation on Perceived Health of Urban and Rural Elderly: Using Generalized Ordered Logit Model. J. Korean Reg. Dev. Assoc. 2015, 27, 65–88. [Google Scholar]
- Mack, G.; Andreas, K.; Katja, H.; Nadja, E. Determinants of the perceived administrative transaction costs caused by the uptake of an agri-environmental program. J. Environ. Plan. Manag. 2019, 62, 1802–1819. [Google Scholar] [CrossRef] [Green Version]
- Williams, R. Generalized Ordered Logit/Partial Proportional Odds Models for Ordinal Dependent Variables. Stata J. Promot. Commun. Stat. Stata 2006, 6, 58–82. [Google Scholar] [CrossRef] [Green Version]
- Williams, R. Understanding and interpreting generalized ordered logit models. J. Math. Sociol. 2016, 40, 7–20. [Google Scholar] [CrossRef]
- Lai, D.; Liu, W.; Gan, T.; Liu, K.; Chen, Q. A review of mitigating strategies to improve the thermal environment and thermal comfort in urban outdoor spaces. Sci. Total Environ. 2019, 661, 337–353. [Google Scholar] [CrossRef] [PubMed]
- Lai, D.; Guo, D.; Hou, Y.; Lin, C.; Chen, Q. Studies of outdoor thermal comfort in northern China. Build. Environ. 2014, 77, 110–118. [Google Scholar] [CrossRef]
- Wang, B.; Yi, Y.K. Developing an adapted UTCI (Universal Thermal Climate Index) for the elderly population in China’s severe cold climate region. Sustain. Cities Soc. 2021, 69, 102813. [Google Scholar] [CrossRef]
- Berg, M.; Winsall, M.; Dyer, S.M.; Breen, F.; Gresham, M.; Crotty, M. Understanding the Barriers and Enablers to Using Outdoor Spaces in Nursing Homes: A Systematic Review. Gerontol. 2019, 60, e254–e269. [Google Scholar] [CrossRef] [PubMed] [Green Version]
- Kim, J.; Schmocker, J.; Nakamura, T.; Uno, N.; Iwamoto, T. Integrated impacts of public transport travel and travel satisfaction on quality of life of older people. Transp. Res. Part A Policy Pract. 2020, 138, 15–27. [Google Scholar] [CrossRef]
- Tong, H.; Kang, J. Characteristics of noise complaints and the associations with urban morphology: A comparison across densities. Environ. Res. 2021, 197, 111045. [Google Scholar] [CrossRef]
- Tong, H.; Aletta, F.; Mitchell, A.; Oberman, T.; Kang, J. Increases in noise complaints during the COVID-19 lockdown in Spring 2020: A case study in Greater London, UK. Sci. Total Environ. 2021, 785, 147213. [Google Scholar] [CrossRef]
- Khoddam, H.; Dehghan, M.; Sohrabi, A.; Modanloo, M. The age–friendly cities characteristics from the viewpoint of elderly. J. Fam. Med. Prim. Care 2020, 9, 5745. [Google Scholar] [CrossRef]
- Mohd, S.; Latiff, A.; Senadjki, A. Travel Behavior of Elderly in George Town and Malacca, Malaysia. Sustainability 2019, 11, 5251. [Google Scholar] [CrossRef] [Green Version]
- Sang, A.O.; Knez, I.; Gunnarsson, B.; Hedblom, M. The effects of naturalness, gender, and age on how urban green space is perceived and used. Urban For. Urban Green. 2016, 18, 268–276. [Google Scholar] [CrossRef]
- Cheng, L.; Caset, F.; Vos, J.D.; Derudder, B.; Witlox, F. Investigating walking accessibility to recreational amenities for elderly people in Nanjing, China. Transp. Res. Part D Transp. Environ. 2019, 76, 85–99. [Google Scholar] [CrossRef]
- Shoari, N.; Ezzati, M.; Baumgartner, J.; Malacarne, D. Accessibility and allocation of public parks and gardens in England and Wales: A COVID-19 social distancing perspective. PLoS ONE 2020, 15, e0241102. [Google Scholar] [CrossRef] [PubMed]
- Gross Domestic Product of Provincial Capital Cities and Municipalities in China in 2019. 2020. Available online: https://www.statista.com/statistics/1099570/china-gross-domestic-product-gdp-of-provincial-capital-cities (accessed on 20 November 2021).
- Puchalsky, C.M. Comparison of Emissions from Light Rail Transit and Bus Rapid Transit. Transp. Res. Rec. 2005, 1927, 31–37. [Google Scholar] [CrossRef]
- Zheng, Z.; Chen, H.; Gao, J. Age Differences in the Influence of Residential Environment and Behavior on the Life Quality of Older Adults: The Transfer from Physical-Environment to Social-Behavior. Int. J. Environ. Res. Public Health 2021, 18, 895. [Google Scholar] [CrossRef]

| Inside Residential Area | Scale of 15-Minute Walk | |||||||||||||
|---|---|---|---|---|---|---|---|---|---|---|---|---|---|---|
| Name | Built Year | Site Area (m2) | Building Height | Plot Ratio | Site Coverage (%) | Green Coverage Ratio (%) | Number of Households | Ratio of Elderly (%) | Quantity of Buses Per Station | Green Areas (m2) | Commercial Facilities | Medical Facilities | Distance to Downtown (km) | Region Name |
| Nan Hu No.1 | 2008 | 68,054 | multi-story | 1.50 | 29 | 35 | 291 | 21.50 | 5.5 | 368,028 | 44 | 15 | 3.9 | Chao yang |
| Zhong Hai | 2006 | 123,287 | multi-story | 1.23 | 35 | 35 | 790 | 24.80 | 2.27 | 613,900 | 54 | 31 | 7.7 | Jing ji |
| Wan Sheng | 2010 | 90,000 | multi-story | 1.40 | 35 | 30 | 1481 | 19.90 | 2.875 | 393,738 | 58 | 31 | 7.0 | Lv yuan |
| Mei Jing | 2004 | 150,280 | small high-rise (11 floor) | 1.87 | 30 | 37 | 2074 | 25.90 | 3.4 | 136,565 | 92 | 41 | 5.7 | Kuan cheng |
| Tian Jia | 2011 | 185,500 | small high-rise (11 floor) | 1.73 | 30 | 40 | 2014 | 22.90 | 3.75 | 595,167 | 32 | 42 | 4.5 | Lv yuan |
| Yu Jing | 2010 | 120,000 | high-rise | 3.80 | 25 | 35 | 3155 | 28.40 | 2.78 | 77,259 | 53 | 33 | 4.8 | Er dao |
| Dong Kang | 1992 | 53,280 | multi-story | 2.00 | 35 | 25 | 2250 | 30.00 | 7.5 | 240,142 | 86 | 36 | 1.2 | Nan guan |
| Zhu Jiang | 2001 | 19,000 | high-rise | 4.50 | 27 | 36 | 563 | 24.50 | 4.95 | 93,218 | 96 | 55 | 5.4 | Xiang Fang |
| Tai Gu | 2000 | 98,500 | multi-story | 2.30 | 35 | 30 | 4048 | 26.20 | 5.76 | 34,797 | 71 | 53 | 2.5 | Dao Wai |
| Da Zhong | 2007 | 135,000 | high-rise | 4.00 | 25 | 38 | 3102 | 23.30 | 6.25 | 272,902 | 85 | 32 | 7.3 | Nan Gang |
| Li Qun | 1995 | 21,205 | high-rise | 4.30 | 30 | 25 | 745 | 25.80 | 7.6 | 65,566 | 65 | 46 | 1.1 | Nan Gang |
| Variables | Description | Mean | Std Dev | |
|---|---|---|---|---|
| Independent Variable | ||||
| Density | Square footage (SF) | Dummy variable: 1 if square footage per person <60 m2, 0 if >60 m2 | 0.614 | 0.487 |
| Building typology (BT) | Dummy variable: 1 if other building typology, 0 if linear building | 0.178 | 0.383 | |
| Environment | Safety (SA) | Dummy variable: 1 if guarded community, 0 if community with semi-open space | 0.302 | 0.459 |
| Cleanliness (CL) | Dummy variable: 1 if recycling bin of centralized build, 0 if recycling bin of decentralized build | 0.502 | 0.500 | |
| Outdoor fitness (OF) | Dummy variable: 1 if fitnesssimilar conclusions by outdoor workout | 0.047 | 0.211 | |
| Green space (GS) | Dummy variable: 1 if deciduous tree, 0 if mixture of evergreen plants and deciduous tree | 0.407 | 0.491 | |
| Outdoor facilities | Outdoor benches (OB) | Dummy variable: 1 if outdoor shelters and seating, 0 if normal outdoor bench | 0.117 | 0.322 |
| Path surface (PS) | Dummy variable: 1 if snow removal within 48 h, 0 if snow clearing after 48 h | 0.506 | 0.501 | |
| Sidewalk colour (SC) | Dummy variable: 1 if standard gray, 0 if blue or green concrete | 0.828 | 0.378 | |
| Accessibility | Accessible buses (AB) | Dummy variable: 1 if the number of buses available ≤5, 0 if the number of buses available >5 | 0.057 | 0.231 |
| Community hospital (CH) | Dummy variable: 1 if the distance >1000 m, 0 if not | 0.511 | 0.500 | |
| distance to public parks (PP1-PP3) | ||||
| Public parks 1 | Dummy variable: 1 if the distance from 400 to 1000 m | 0.796 | 0.403 | |
| Public parks 2 | Dummy variable: 1 if the distance >1000 m | 0.174 | 0.379 | |
| Public parks 3 | Dummy variable: 1 if the distance <400 m | 0.029 | 0.168 | |
| Distance to commercial facilities (CF1-CF3) | ||||
| Commercial facilities 1 | Dummy variable: 1 if the distance from 400 to 1000 m | 0.429 | 0.495 | |
| Commercial facilities 2 | Dummy variable: 1 if the distance >1000 m | 0.230 | 0.421 | |
| Commercial facilities 3 | Dummy variable: 1 if the distance <400 m | 0.341 | 0.474 | |
| Personal Attributes | ||||
| Age (AG) | Dummy variable: 1 if age ≤65, 0 if age >65 | 0.594 | 0.491 | |
| Gender (GE) | Dummy variable: 1 if respondent is male | 0.507 | 0.500 | |
| Education level (EL) | Dummy variable: 1 if respondent’s education level >tertiary education | 0.087 | 0.282 | |
| Chronic diseases (CD) | Dummy variable: 1 if health or mild diseases, 0 if respondent suffers from severe chronic diseases | 0.737 | 0.441 | |
| Dependent Variable | ||||
| Residential satisfaction (RS) | Strongly dissatisfied = 1, strongly satisfied = 7 | 4.704 | 1.492 | |
| Health satisfaction (HS) | Strongly dissatisfied = 1, strongly satisfied = 7 | 4.653 | 1.551 | |
| Social satisfaction (SS) | Strongly dissatisfied = 1, strongly satisfied = 7 | 3.872 | 1.874 | |
| RS | |||
| Variable | Coef. | S.E. | P |
| CD | 0.638 | 0.193 | 0.001 |
| OB | 0.629 | 0.159 | 0.000 |
| GS | −0.455 | 0.154 | 0.003 |
| AB | 0.370 | 0.096 | 0.000 |
| AG | 0.425 | 0.146 | 0.004 |
| CH | −0.675 | 0.266 | 0.011 |
| PS | 0.852 | 0.251 | 0.001 |
| PP1 | 1.301 | 0.248 | 0.000 |
| PP2 | 0.569 | 0.259 | 0.028 |
| HS | |||
| Variable | Coef. | S.E. | P |
| CD | 0.598 | 0.193 | 0.002 |
| OB | 0.648 | 0.158 | 0.000 |
| GS | −0.476 | 0.153 | 0.002 |
| AB | 0.337 | 0.096 | 0.000 |
| AG | 0.399 | 0.147 | 0.007 |
| CH | −0.729 | 0.267 | 0.006 |
| PS | 0.941 | 0.256 | 0.000 |
| SC | −0.347 | 0.169 | 0.041 |
| PP1 | 1.202 | 0.248 | 0.000 |
| PP2 | 0.512 | 0.258 | 0.047 |
| SS | |||
| Variable | Coef. | S.E. | P |
| SA | −0.536 | −0.138 | 0.000 |
| CD | 0.852 | 0.199 | 0.000 |
| OB | 0.536 | 0.159 | 0.001 |
| GS | −0.732 | 0.156 | 0.000 |
| AB | 0.290 | 0.097 | 0.003 |
| PS | 0.992 | 0.262 | 0.000 |
| SC | −1.170 | 0.170 | 0.000 |
| PP2 | −0.534 | 0.272 | 0.049 |
| CF1 | −0.417 | 0.123 | 0.001 |
| CF2 | −0.395 | 0.129 | 0.002 |
| RS | |||||||||
| Variable | RS = 1 | RS = 2 | RS = 3 | ||||||
| Coef. | S.E. | P | Coef. | S.E. | P | Coef. | S.E. | P | |
| CD | 0.309 | 0.601 | 0.607 | 0.618 | 0.494 | 0.210 | 0.677 | 0.354 | 0.056 |
| OB | 1.490 | 0.741 | 0.044 | 0.785 | 0.390 | 0.044 | 0.366 | 0.242 | 0.130 |
| GS | −0.464 | 0.249 | 0.063 | −0.595 | 0.184 | 0.001 | −0.745 | 0.134 | 0.000 |
| AB | −0.138 | 0.277 | 0.619 | 0.015 | 0.194 | 0.940 | 0.201 | 0.137 | 0.144 |
| AG | 0.779 | 0.522 | 0.136 | 0.219 | 0.305 | 0.472 | 0.324 | 0.223 | 0.147 |
| CH | −0.541 | 0.638 | 0.396 | −0.929 | 0.463 | 0.045 | −1.069 | 0.329 | 0.001 |
| PS | 0.084 | 0.803 | 0.916 | 1.058 | 0.524 | 0.044 | 0.953 | 0.370 | 0.010 |
| PP1 | 1.057 | 0.459 | 0.021 | 0.702 | 0.393 | 0.074 | 1.220 | 0.294 | 0.000 |
| PP2 | 0.895 | 0.506 | 0.077 | 0.490 | 0.419 | 0.242 | 0.943 | 0.314 | 0.003 |
| RS | |||||||||
| Variable | RS = 4 | RS = 5 | RS = 6 | ||||||
| Coef. | S.E. | P | Coef. | S.E. | P | Coef. | S.E. | P | |
| CD | 0.714 | 0.249 | 0.004 | 0.838 | 0.223 | 0.000 | 0.367 | 0.308 | 0.234 |
| OB | 0.467 | 0.172 | 0.007 | 0.658 | 0.158 | 0.000 | 0.916 | 0.204 | 0.000 |
| GS | −0.691 | 0.106 | 0.000 | −0.314 | 0.115 | 0.006 | −0.536 | 0.194 | 0.006 |
| AB | 0.324 | 0.109 | 0.003 | 0.514 | 0.119 | 0.000 | 0.287 | 0.180 | 0.111 |
| AG | 0.312 | 0.164 | 0.057 | 0.171 | 0.162 | 0.290 | 0.724 | 0.223 | 0.001 |
| CH | −0.974 | 0.253 | 0.000 | −0.881 | 0.251 | 0.000 | −0.923 | 0.351 | 0.009 |
| PS | 0.833 | 0.269 | 0.002 | 0.900 | 0.259 | 0.001 | 0.584 | 0.351 | 0.096 |
| PP1 | 1.542 | 0.312 | 0.000 | 1.103 | 0.367 | 0.003 | 0.158 | 0.452 | 0.726 |
| PP2 | 0.976 | 0.325 | 0.003 | −0.433 | 0.397 | 0.276 | −1.505 | 0.560 | 0.007 |
| HS | |||||||||
| Variable | HS = 1 | HS = 2 | HS = 3 | ||||||
| Coef. | S.E. | P | Coef. | S.E. | P | Coef. | S.E. | P | |
| CD | 0.405 | 0.587 | 0.490 | 0.616 | 0.494 | 0.212 | 0.668 | 0.337 | 0.047 |
| OB | 1.671 | 0.732 | 0.023 | 0.916 | 0.385 | 0.017 | 0.465 | 0.235 | 0.048 |
| GS | −0.458 | 0.228 | 0.044 | −0.696 | 0.174 | 0.000 | −0.643 | 0.131 | 0.000 |
| AB | −0.115 | 0.247 | 0.643 | 0.121 | 0.174 | 0.490 | 0.254 | 0.131 | 0.054 |
| AG | 0.456 | 0.433 | 0.292 | −0.082 | 0.268 | 0.761 | 0.113 | 0.213 | 0.597 |
| CH | −0.865 | 0.682 | 0.204 | −1.034 | 0.462 | 0.025 | −0.995 | 0.365 | 0.006 |
| PS | 0.669 | 0.808 | 0.407 | 1.394 | 0.529 | 0.008 | 1.098 | 0.420 | 0.009 |
| SC | −0.484 | 0.375 | 0.197 | −0.221 | 0.262 | 0.399 | −0.254 | 0.197 | 0.197 |
| PP1 | 0.886 | 0.454 | 0.051 | 0.546 | 0.395 | 0.167 | 1.208 | 0.292 | 0.000 |
| PP2 | 0.845 | 0.502 | 0.092 | 0.424 | 0.420 | 0.312 | 0.964 | 0.312 | 0.002 |
| Variable | HS = 4 | HS = 5 | HS = 6 | ||||||
| Coef. | S.E. | P | Coef. | S.E. | P | Coef. | S.E. | P | |
| CD | 0.580 | 0.242 | 0.016 | 0.851 | 0.222 | 0.000 | 0.309 | 0.303 | 0.308 |
| OB | 0.530 | 0.174 | 0.002 | 0.721 | 0.158 | 0.000 | 0.890 | 0.201 | 0.000 |
| GS | −0.637 | 0.107 | 0.000 | −0.298 | 0.116 | 0.010 | −0.609 | 0.194 | 0.002 |
| AB | 0.315 | 0.109 | 0.004 | 0.524 | 0.119 | 0.000 | 0.214 | 0.175 | 0.221 |
| AG | 0.281 | 0.167 | 0.092 | 0.218 | 0.163 | 0.181 | 0.704 | 0.221 | 0.001 |
| CH | −1.102 | 0.275 | 0.000 | −0.907 | 0.271 | 0.001 | −1.184 | 0.370 | 0.001 |
| PS | 1.026 | 0.298 | 0.001 | 0.825 | 0.270 | 0.002 | 0.988 | 0.340 | 0.004 |
| SC | −0.234 | 0.148 | 0.113 | 0.056 | 0.145 | 0.699 | −0.243 | 0.207 | 0.241 |
| PP1 | 1.491 | 0.311 | 0.000 | 1.053 | 0.368 | 0.004 | 0.250 | 0.443 | 0.573 |
| PP2 | 0.923 | 0.324 | 0.004 | −0.424 | 0.398 | 0.287 | −1.343 | 0.545 | 0.014 |
| SS | |||||||||
| Variable | SS = 1 | SS = 2 | SS = 3 | ||||||
| Coef. | S.E. | P | Coef. | S.E. | P | Coef. | S.E. | P | |
| SA | −0.528 | 0.211 | 0.012 | −0.470 | 0.171 | 0.006 | −0.480 | 0.153 | 0.002 |
| CD | 1.145 | 0.544 | 0.035 | 1.769 | 0.472 | 0.000 | 0.863 | 0.286 | 0.003 |
| OB | 1.812 | 0.476 | 0.000 | 1.528 | 0.322 | 0.000 | 0.933 | 0.221 | 0.000 |
| GS | −0.643 | 0.198 | 0.001 | −0.673 | 0.162 | 0.000 | −0.676 | 0.148 | 0.000 |
| AB | 0.299 | 0.139 | 0.032 | 0.362 | 0.121 | 0.003 | 0.399 | 0.114 | 0.000 |
| PS | 0.466 | 0.152 | 0.000 | 0.294 | 0.135 | 0.030 | 0.308 | 0.127 | 0.015 |
| SC | −0.938 | 0.235 | 0.000 | −0.795 | 0.188 | 0.000 | −0.810 | 0.163 | 0.000 |
| PP2 | −0.290 | 0.156 | 0.063 | −0.674 | 0.133 | 0.000 | −0.895 | 0.130 | 0.000 |
| CF1 | −0.790 | 0.182 | 0.000 | −0.383 | 0.158 | 0.016 | −0.293 | 0.145 | 0.044 |
| CF2 | −0.464 | 0.202 | 0.021 | −0.311 | 0.171 | 0.068 | −0.385 | 0.155 | 0.013 |
| Variable | SS = 4 | SS = 5 | SS = 6 | ||||||
| Coef. | S.E. | P | Coef. | S.E. | P | Coef. | S.E. | P | |
| SA | −0.636 | 0.138 | 0.000 | −0.185 | 0.156 | 0.235 | −0.512 | 0.229 | 0.025 |
| CD | 0.653 | 0.230 | 0.005 | 1.029 | 0.226 | 0.000 | 0.858 | 0.281 | 0.002 |
| OB | 0.478 | 0.171 | 0.005 | 0.491 | 0.176 | 0.005 | 0.668 | 0.222 | 0.003 |
| GS | −0.658 | 0.138 | 0.000 | −0.477 | 0.167 | 0.004 | −1.021 | 0.278 | 0.000 |
| AB | 0.185 | 0.116 | 0.110 | 0.303 | 0.143 | 0.034 | 0.433 | 0.218 | 0.047 |
| PS | 0.402 | 0.126 | 0.001 | 0.453 | 0.153 | 0.003 | 0.579 | 0.222 | 0.009 |
| SC | −0.920 | 0.142 | 0.000 | −0.911 | 0.150 | 0.000 | −1.449 | 0.208 | 0.000 |
| PP2 | −0.942 | 0.143 | 0.000 | −0.746 | 0.181 | 0.000 | −0.684 | 0.260 | 0.008 |
| CF1 | −0.497 | 0.141 | 0.000 | −0.419 | 0.165 | 0.011 | −0.552 | 0.244 | 0.024 |
| CF2 | −0.476 | 0.149 | 0.001 | −0.663 | 0.183 | 0.000 | −0.539 | 0.282 | 0.056 |
| Dependent Variable | Pseudo R² | AIC | ||
|---|---|---|---|---|
| Ordered Logit Model | Generalized Ordered Logit Model | Ordered Logit Model | Generalized Ordered Logit Model | |
| RS | 0.0161 | 0.044 | 6606.88 | 6587.195 |
| HS | 0.0272 | 0.0448 | 6719.526 | 6698.022 |
| SS | 0.0462 | 0.0631 | 6977.892 | 6955 |
| Variable | RS | ||||||
| 1 | 2 | 3 | 4 | 5 | 6 | 7 | |
| CD | −1.34 | −3.37 | −4.94 | −6.25 | −0.78 | 13.56 | 3.14 |
| OB | −6.47 | 0.48 | 0.77 | −5.19 | −2.69 | 5.26 | 7.83 |
| GS | 2.01 | 2.53 | 6.09 | 4.77 | −9.15 | −1.66 | −4.59 |
| AB | 0.60 | −0.71 | −2.75 | −4.35 | −3.02 | 7.78 | 2.45 |
| AG | −3.38 | 1.71 | −2.94 | −2.34 | 3.55 | −2.78 | 6.19 |
| CH | 2.35 | 4.73 | 8.17 | 6.46 | −4.16 | −9.65 | −7.90 |
| PS | −0.37 | −7.70 | −5.53 | −4.99 | 0.65 | 12.93 | 4.99 |
| PP1 | −4.59 | −0.77 | −12.05 | −16.97 | 12.39 | 20.63 | 1.35 |
| PP2 | −3.88 | 0.15 | −9.72 | −8.30 | 30.4 | 4.25 | −12.87 |
| Variable | HS | ||||||
| 1 | 2 | 3 | 4 | 5 | 6 | 7 | |
| CD | −2.11 | −3.39 | −4.79 | −2.69 | −3.82 | 14.10 | 2.30 |
| OB | −8.71 | 0.54 | 1.00 | −4.70 | −2.37 | 6.48 | 7.75 |
| GS | 2.39 | 3.82 | 3.71 | 4.33 | −8.36 | −0.58 | −5.31 |
| AB | 0.60 | −1.67 | −2.84 | −3.14 | −3.30 | 8.49 | 1.86 |
| AG | −2.38 | 3.10 | −2.47 | −4.59 | 1.99 | −1.83 | 6.14 |
| CH | 4.51 | 4.71 | 6.12 | 9.31 | −6.73 | −7.60 | −10.32 |
| PS | −3.49 | −8.95 | −4.49 | −6.03 | 6.67 | 7.68 | 8.61 |
| SC | 2.52 | −0.55 | 1.94 | 1.32 | −6.34 | 3.22 | −2.12 |
| PP1 | −4.62 | −2.45 | −13.75 | −14.73 | 12.56 | 18.61 | 2.18 |
| PP2 | −4.41 | 0.62 | −11.08 | 5.79 | 29.03 | 3.32 | −11.69 |
| Variable | SS | ||||||
| 1 | 2 | 3 | 4 | 5 | 6 | 7 | |
| SA | 7.28 | 1.20 | 1.58 | 3.71 | −11.02 | 0.48 | −3.23 |
| CD | −15.79 | −16.09 | 13.82 | 3.96 | −1.14 | 9.85 | 5.41 |
| OB | −24.99 | −2.56 | 8.01 | 9.20 | 3.04 | 3.08 | 4.21 |
| GS | 8.87 | 3.27 | 2.02 | 0.07 | −7.14 | −0.64 | −6.44 |
| AB | −4.12 | −2.40 | −1.84 | 4.37 | −0.50 | 1.77 | 2.73 |
| PS | −6.43 | 1.14 | −1.16 | −2.24 | 1.97 | 3.07 | 3.65 |
| SC | 12.93 | 1.40 | 2.62 | 2.93 | −6.37 | −4.38 | −9.14 |
| PP2 | 4.00 | 8.15 | 6.59 | 1.62 | −9.31 | -6.74 | −4.32 |
| CF1 | 10.90 | −4.00 | −0.78 | 4.62 | −4.53 | −2.74 | −3.48 |
| CF2 | 6.40 | −0.79 | 2.45 | 2.22 | −0.45 | −6.44 | −3.40 |
Publisher’s Note: MDPI stays neutral with regard to jurisdictional claims in published maps and institutional affiliations. |
© 2022 by the authors. Licensee MDPI, Basel, Switzerland. This article is an open access article distributed under the terms and conditions of the Creative Commons Attribution (CC BY) license (https://creativecommons.org/licenses/by/4.0/).
Share and Cite
Leng, H.; Han, B. Effect of Environmental Planning on Elderly Individual Quality of Life in Severe Cold Regions: A Case Study in Northeastern China. Sustainability 2022, 14, 3522. https://doi.org/10.3390/su14063522
Leng H, Han B. Effect of Environmental Planning on Elderly Individual Quality of Life in Severe Cold Regions: A Case Study in Northeastern China. Sustainability. 2022; 14(6):3522. https://doi.org/10.3390/su14063522
Chicago/Turabian StyleLeng, Hong, and Bingbing Han. 2022. "Effect of Environmental Planning on Elderly Individual Quality of Life in Severe Cold Regions: A Case Study in Northeastern China" Sustainability 14, no. 6: 3522. https://doi.org/10.3390/su14063522
APA StyleLeng, H., & Han, B. (2022). Effect of Environmental Planning on Elderly Individual Quality of Life in Severe Cold Regions: A Case Study in Northeastern China. Sustainability, 14(6), 3522. https://doi.org/10.3390/su14063522