Article

Smart and Sustainable Development from a Spatial Planning Perspective: The Case of Shenzhen and Greater Manchester

1
Department of Geography and Resource Management, Chinese University of Hong Kong, Hong Kong, China
2
Department of Planning and Environmental Management, Manchester Urban Institute, University of Manchester, Manchester M13 9PL, UK
*
Author to whom correspondence should be addressed.
Sustainability 2022, 14(6), 3509; https://doi.org/10.3390/su14063509
Submission received: 15 February 2022 / Revised: 6 March 2022 / Accepted: 14 March 2022 / Published: 16 March 2022

Abstract

:
This paper proposes an integrative analytical framework to critically review the genesis of smart city development and evaluate its sustainability outcomes from a spatial planning perspective. It argues that historical contexts and modes of governance, together with holistic place-based knowledge, provide important clues to understand the ensuing visions, goals, and objectives, as well as processes and contents of smart city initiatives. Shenzhen (SZ), China’s first special economic zone, and Greater Manchester (GM), the birthplace of the industrial revolution in the United Kingdom, are used to illustrate how the conceptual framework helps reveal two very different pathways towards smart sustainability. SZ, as a pioneering testbed of China’s reforms, is closely directed by top-down initiatives in its smart and sustainable development efforts. GM, given its rich history of local collaboration between the public, private and third sectors, adopts a bottom-up approach to achieve smart sustainability. The case studies prove the robustness of the framework in narrating smart sustainable development in a city-region, highlighting different trajectories and necessary areas for improvement.

1. Introduction

This paper develops a novel framework from a spatial planning perspective to evaluate smart city development and its sustainability outcomes. While there are numerous research studies on different aspects of smart city development [1,2,3,4,5,6], not many have examined it from a spatial planning perspective [7,8,9]. Unlike planning blueprints put forward by technology companies [10,11], which too often ignore the complex, political and context- and path-dependent dynamics of cities, we advocate spatial planning for smart sustainability, which is a socio-political process coordinating the long-term spatial logic of land use for sustainable development [12,13,14,15,16]. We use spatial planning to develop an original framework to narrate and evaluate efforts of cities in moving towards smart sustainability. The robustness of the proposed framework is tested with two case study conurbations: SZ, recently dubbed as China’s Silicon Valley, and GM, the pioneer of the industrial revolution and the UK’s leading smart city-region.
This paper contributes to the current knowledge of smart and sustainable cities research in different ways. It first discusses what smart sustainability is and why we need a ‘spatial’ conceptual and epistemological approach to understand it (Section 2). The paper then proposes an integrative analytical framework from a spatial perspective to study smart sustainability (Section 3). The framework is applied in Section 4 in two case study areas to analyse and evaluate smart sustainability. Based on these findings, Section 5 discusses the usefulness of this novel framework in evaluating smart cities and their sustainability outcomes.

2. What Is Smart Sustainability?

According to the United Nations, more than 70% of the world’s population will be living in cities by 2050, placing strains on housing and related needs, energy supply, transportation infrastructure, water resources, and public spaces. The IPCC [17] (pp. 90–98) estimates that urban areas consumed 67–76% of global energy use and about three quarters of global energy-related CO2 emissions and without mitigation, global mean surface temperature will increase from 3.7 °C to 4.8 °C by 2100. The climate crisis has driven many cities to consider the development of renewable energy, alternative means of transportation, water and waste management, as well as urban planning and green construction. Cities have tried to develop smart solutions to reduce and recycle resources, improve efficiency and integrate social aspects [18] (p. 3). The main idea is to deploy new information and communication technologies to improve urban forms, deliver better socio-economic and ecological services and boost people’s quality of life [19,20].
However, smart sustainability cannot be achieved via technology alone. Similar to any spatial planning exercise, it has to start with collective reflections on an existing context, identifying issues that would require technological and other solutions. Otherwise, there would be a danger of allowing players who can master smart technologies to position themselves as “obligatory passage points” in a created socio-technical network to determine the future of a city [21] (p. 308). This approach to smart technologies is strongly predicated on a neoliberal economic growth agenda by which the discourse and deployment of smart technologies are construed in the hegemonic images of digital, entrepreneurial and sustainable cities, in order to support “a nebulous worldview as to how cities should function” [22,23]. Implicit in this approach also was the complacent faith that smart technologies are inherently benign, error-free, politically natural, as opposed to people who err and are chaotic and biased [24,25]. The underpinning flaws and dangers of the techno-determinist/optimist and neoliberal vision of smart urbanism that is the capitalist mode of production under the disguise of digital innovation has been the subject of an extensive academic literature over the years (for an overview [23]). Building on a neo-Marxist/postmodern critique of infrastructure, Viitanen and Kingston [25] argued that smart infrastructures underpinning smart urbanism are often messy, heterogeneous, partial and leaky. The incompleteness, incompetence or ineffectiveness of smart technologies contributes to the convergence between what is promised of being smart and what is the reality on the ground [26], although some authors argue that the “deferred potentiality” of smart technologies, i.e., always being in the future, never in the present, means smart technologies are not meant for the present [22].
The question is to think beyond cyborg urbanism [27] and focus less on the limitations of smart technologies to tackle societal problems than the extent to which progressive and uncritical incorporation of smart technologies into planning theory and practice lead to depoliticisation of planning and the ill-founded assumption that more and democratised data and better technology (advanced machine learning, faster connections (5G)) will lead to better solutions. Perhaps we can return to the basics and ask simple questions, such as: What should be the vision of socio-economic development? Should we aim at sustainable development, rectifying an inequitable society rather than polarizing it, addressing barriers to language, culture, education, disabilities and participation [28] (p. 90)? How can technology contribute to all these?
Rather than branding a city smart and sustainable, it is important for a city to leverage high-tech and creative industries, hard and soft infrastructure and knowledge networks for growth, harvesting the double dividend of a green economy, that is, environmental improvement through profit-making endeavours. It is equally important to use technology to enhance social inclusion in public services, e-governance, open access to administrative data, and delivering services digitally [29,30], as well as enriching the collective learning capacities of different stakeholders [28]. All social classes should benefit from a technological integration of their urban fabric [31], empowering them to learn, adapt and create ways to reshape their cities towards a progressive direction [8].
In other words, technological urbanism has to integrate with local history, geography, culture, socio-economic and political contexts to produce diversified places where housing affordability, employment opportunities and balanced, diverse communities can be found [32] (p. 202). Therefore, smart investment is not just on technological hardware, but should be on both traditional and modern communication infrastructures that aim at boosting people’s quality of life, managing wisely natural resources through participatory governance, educating citizens to live more sustainable and smarter lives [31]. The quest for smart sustainability is a vision of developing a spatially enabled city where spatial data (on people, place and planet) are seen as common goods, available to civil society, the government and the private sectors, to innovate and to invent collaboratively a sustainable future [33]. In a nutshell, smart cities should have citizens practising a kind of read/write urbanism [34], data savvy, and possessing the abilities to face collaboratively grand challenges with local innovative solutions that are environmentally sustainable, economically green and socially just [35].
Yet a whole basket of factors may deter efforts towards smart sustainable development, such as bureaucracy, political conflicts, complex legal framework, differences of opinions or priorities among different stakeholders, weak ICT infrastructure, lack of human resources, worries about privacy, security, etc. [36] (p. 86). Or, when efforts are made, the smart city model may become a disciplinary tool to shape “smart citizens” [37], turning them into “data points”: generators of data and responsive nodes in a system of feedback as docile subjects [38] (p. 32). Or smart cities become just a high-tech variation of the “entrepreneurial city” [4] (p. 303) and worse still, a market creation strategy for technology companies [39]. Good smart interventions to improve quality of life and wellbeing and environmental protection and their political nature should be proactively evaluated, negotiated, and advocated by planners, as Evans et al. [40] (p. 558) contended that “social equity and environmental sustainability are neither a-priori absent nor de-facto present in technological designs of smart city initiatives, but have to be made, nurtured and maintained as they materialise in particular places”.
So how can we ascertain the evolution, negotiation and direction of smart sustainability in a city? This is the research question that this paper is addressing.

3. Integrated Spatial Planning Framework to Evaluate Smart Sustainability

Spatial planning involves a process of understanding a place, identifying its strengths, weaknesses, opportunities and threats so that a planning vision expressed in goals and objectives can be set up to guide the generation of responses and options. These will then be evaluated, with the impacts mapped before decisions are taken to allow implementations and monitoring to unfold, providing feedback to the whole process. Planning in reality maybe messier, circular or interrupted by socio-economic and political events and considerations. Nevertheless, the rational comprehensive planning framework provides a handy structure to examine smart city initiatives and their sustainability outcomes.

3.1. The Importance of History and Context

The nature of urban planning is political because it involves “who gets what where when and how”. Our decisions on the allocation of resources for certain infrastructure and uses for specific stakeholders bear political consequences, very often sustaining or altering power relationships [41]. These decisions are often path-dependent, shaped by socio-economic, cultural and political factors and the competencies of actors and institutions of a place [42,43]. Having a long durée perspective allows us to trace the evolution of historical trajectories, (multi-scalar)-administrative rules or policy frameworks, and modes of public funding in a place, as well as its current contexts and factors (such as demographics, distribution and sharing of wealth and prosperity) that have driven a city towards or away from smart sustainability [28,44].

3.2. Urban Audit Datasets and Mode of Governance

Information becomes the new gold in smart cities. However, information, especially place-based knowledge, has always played a key role in spatial planning. Planning always starts with canvassing a place, organising audit datasets [31] on the various aspects of a territory, its demography, socio-economic, environmental, transportation and cultural aspects [45]. The pursuit of smart sustainability has to be a transdisciplinary endeavour, involving human and social capital, and information and communication technological infrastructure to collaboratively generate green economic growth, enhancing people’s quality of life and well-being [46]. It is therefore extremely important to check if these datasets are in place. Who produces them and who manages and monitors them? Are they collected by top-down efforts or via bottom-up collective initiatives? How do the different forms of data collected, synthesised, and communicated (or not communicated) reflect whether the mode of governance in a place is conservative or transformative [41,47]?

3.3. Vision, Goal and Objectives

In a spatial planning process, visions, goals and objectives are developed after the urban data sets are synthesised, interpreted and analysed. The processes involved in envisioning and the setting up of goals and objectives further reveal the nature of governance in a place and the spatial competency of its people. Are the citizens given opportunities to learn about the multi-dimensional conditions of their living environment? Are they spatially literate? Are they empowered to understand the implications of these conditions on their lives and do they have the competence to envision alternative, more sustainable futures? The complexities of power relationships among different stakeholders in a place would produce different answers to these questions. Yet, without the involvement, trust and reciprocity of citizens as community glue, it would be difficult to develop transformative visions and goals that would require co-learning and experimentalism [8,28]. To echo the definition of smart sustainability above, we need to ask if the set vision and goals aimed at creating data commons that would allow collaborative efforts to promote socio-economic and spatial justice while maintaining the integrity of ecosystem services as expounded in the sustainable development goals [48]. Are there concrete objectives set to achieve these goals?

3.4. Processes and Contents

Fiscal resources are essential to implement the objectives and a dedicated authority may be necessary to bring into fruition the transdisciplinary agenda [49]. In any case, spatial planning, given its mandate to offer a holistic and comprehensive view of the development of a territory, should work closely with this new authority to enhance its own dynamism in meeting evolving challenges of a read/write urbanism. In the process of gathering, collating, managing, governing and sharing data through various hard and soft infrastructure, many issues typical of any spatial planning process would arise.
In a typical smart city architecture, there are four layers of hard and soft infrastructure: data acquisition layer; data vitalisation layer; support, application and service layer; and application layer [50]. The idea is to develop an infrastructure that integrates heterogeneous and geographically disperse sensor networks into a common data platform where services can be launched cost-effectively [49]. Naturally, the following questions can be asked: What data are required, produced and collected? Are these related to environmental quality and sustainability? What kind of infrastructure is in place to produce the various kinds of information systems that contribute to e-services? Can these infrastructures “communicate” with one another and are the information systems compatible? How are these integrated? What is the governance structure, that is, who makes what decisions in processing, sharing and consuming the data? Technology provides some of the answers, such as the importance of developing context-aware middleware for ambient intelligence, appropriate interfaces for users in different situations, data privacy issues, collaborative surfing, internet of things, locally based services with multiple environmentally sensitive exchange configurations and contextual mobile learning, all related to software systems, server and network infrastructure [50] (p. 169). However, just as planning cannot be conducted by technocrats alone, developing a smart city architecture cannot be conducted by the technology experts alone, as many important ethical issues are at stake.
As argued by Gardner and Hespanhol [51], it is important to ensure that the service or programme designed is addressing all citizens equally at a personal level (granularity) and that there is accountability in initiating, planning, implementing and maintaining these services or programmes. More importantly, the processes should be transparent (with accessible information and effective monitoring) [33] and participatory (allowing data gathering and meaningful manipulation by citizens [38]. These are related to questions of ownership, control and access to the smart city infrastructure and a right to spatial autogestion that would allow the emergence of a digital commons, empowering everyone, especially those who have been marginalised in the development process [52]. As data are now the new gold, value capture mechanisms need to be in place to ensure that commercial values derived would result in more equitable sharing in society. Spatial planners have been accused, in some situations, of privileging certain interests over others. Hence, we have to be vigilant in examining partnerships in smart city development to see if these initiatives go beyond business partnerships that aim at nurturing a spatially enabled citizenship [46].

3.5. Monitoring: Sectoral and Spatial Outcomes and Feedback Loop

It is important to audit the results of smart city initiatives in order to check if the city is moving towards sustainability. What kind of growth is promoted? Who has benefited from the initiatives? Who are the “information rich and the information poor” [53]? Once a smart city infrastructure is in place, e-services will be developed in various sectors. It is worth auditing the smartness and sustainability of various sectors, such as examining their contribution to the achievement of the 17 sustainable development goals [48]. For instance, in an intelligent transport system, besides tackling congestion, scheduling, managing parking spaces, etc., can it also help improve accessibility and environmental qualities in marginalised communities? Are the sensors and technical devices deployed to monitor the use of energy, carbon emissions, and help produce an equitable environment for all? Are smart buildings built just for the elites to generate more profits for developers or they are ubiquitous, serving to lower resource consumption and bringing communities together? Are healthcare innovations serving just the rich and powerful or they are making a difference in the lives of the elderly, physically or even mentally challenged? Have educational resources been developed for the digitally rich rather than making these more accessible, affordable and higher quality? Are surveillance systems used to control citizens or they are for public security and risk prevention? Is the whole smart city infrastructure benefiting everyone, encouraging innovation, entrepreneurship, and productivity, or is it monopolised for private gains?
The spatial outcomes of smart city initiatives have to be examined too. Are citizens spatially enabled, that is, digitally literate? Or have some actually been displaced to make way for the technologically smart? Have people changed their life styles? What has happened to the poor and the less advantaged? Who are the “silent, blind and even stupid” [37], or the “spatially disenabled”? What is the extent of “digital inequality”? Have data and information been treated as common goods? Can we see the emergence of testbeds for local start-ups and entrepreneurs to spur smart city initiatives that are related to, say, the 17 sustainable development goals? Or have the initiatives been replacing, rather than generating, new jobs, surveilling rather than making places, furthering rather than overcoming the digital divide [54]? An audit of the spatial coverage of various services and applications and its accompanying policies and administrative measures will allow us to make a verdict on the observed outcomes, assessing if a place had enabled “read/write urbanism” and made transformative changes or not [7,54]. The results will provide important evidence to decide if the original goals, objectives, and initiatives, etc., need to be re-considered.
Table 1 below summarises the questions that can be asked in a typical spatial planning process to evaluate if a territory is moving towards sustainability as it unfolds its smart city initiatives.

4. Case Studies

In the following, we use this integrated framework to audit and assess different pathways towards smart sustainability of two case study conurbations under very different development contexts: SZ, China’s first special economic zone set up in 1979 when the country reopened her door to the global economy, and GM, the world’s first industrial town in the late 18th century. The purpose is to test the robustness of the proposed framework on its ability to highlight the processes and narratives of smart city developments in the two city-regions and evaluate their sustainability impacts. The main reason behind choosing two case study areas that are very different to each other in terms of their history, governance, political economy, and socio-spatial dynamics, is to draw on the existing expertise of the authors who have extensive knowledge of the case study areas, as well as to robustly test the framework in different settings. Besides archival research on related histories, policies and statistics, the authors conducted interviews with relevant stakeholders in both the public and private sectors to keep track of the latest developments of smart sustainable developments in both conurbations.

4.1. Shenzhen: From China’s Instant Special Economic Zone to Its Silicon Valley

One may argue that SZ’s historical mission has been China’s pioneering city as the nation groped its way back to the world stage and treaded a development trajectory with Chinese characteristics through its open door policy back in the late 1970s.
SZ was once a small rural border town north of Hong Kong. In 1979, it was designated by the Chinese central government to become a special economic zone (SEZ) to pioneer nation-wide economic reforms. The experimental and pioneering nature of the city can be witnessed in the evolution of its comprehensive/master plans and development strategies [55,56,57]. In about four decades, SZ has developed from an ‘industrial city’ to “an innovative multi-functional… international city” [57], with a population reaching over 13 million and a total GDP of almost RMB 2.7 trillion (GBP 0.3 trillion) in 2019 [58]. Although it was not until 2011 that an outline plan for Smart Shenzhen was published [59], SZ’s smart city development has a much longer history and can be seen as part of China’s drive towards industrialisation, as a project of exploring an “alternative modernity” to meet people’s basic needs while building a more egalitarian society [60]. Hence, it could be argued that the move of the country and SZ towards smart or high-technology development started even before the open door policy [60].
Technological development has been identified as a strategic aspect to boost socio-economic development and facilitate the country’s reintegration in the world economy through encouraging foreign investment [61,62]. In the country’s seventh Five Year Plan (1986–1990), 12 key information and communication technology (ICT) application projects surrounding national public service spheres, including banking, transportation, public security and military services, were spurred to restructure traditional industries [60] (p. 27). The research and development capacities of these enterprises have been instrumental in realizing SZ’s 1987 policy to encourage private technology enterprises [63]. In fact, Huawei, now a multinational technology company, was founded as a result of this policy in December 1987, with only six employees and RMB 24,000 registered capital [60] (p. 30).
By the late 1990s, SZ’s strategic goal was to build the city as a base of high-tech industries [64,65]. This strategic goal was to realise China’s ambition of becoming an innovative nation. By the turn of the century, the Chinese government realised that without an independent capacity to innovate in science and technology, the country could not go beyond resource-intensive growth, overcoming environmental pollution, transforming the economic structure and boosting high-technological development [66]. In other words, the country has since realised that science and technology are instrumental to its sustainable future.
It is in this macro-context that we examine SZ’s efforts to achieve smart sustainability. As the city aspired to become a high-tech industrial base, the city also recognised its development bottleneck. The 2004 Shenzhen 2030 Urban Development Strategy had a vision of reimaging the city as a pioneering sustainable global city, developing a competitive, influential and less resource intensive economy, as well as enhancing environmental and social sustainability within the broader regional context [67]. SZ’s development since the turn of the millennium has been an exploratory journey towards smart sustainability.

4.1.1. An Experimental City

As with all migrant cities, SZ has been full of energy and cultural diversities. The city has always been at the forefront of the country’s reforms. In 2005, the Ministry of Construction identified SZ as a pilot city for digital urban management [68]. In its Digital City Management Work Plan, SZ aimed to improve its management efficiency and quality of services through an integrated information platform to manage information and exercise real-time management [68]. In its 2008 Master Plan, SZ aspired to become the nation’s first innovative city, creating an innovative environment for socio-economic and cultural innovations, including recycling ecological resources to overcome resource constraints and promoting genuine multi-dimensional development [69]. The Master Plan was updated in 2010 and it was stated in Article 13 that the city will continue to be an innovative international city with Chinese characteristics; that is, with a prosperous economy, a harmonious society, an energy efficient, environmentally friendly, culturally vibrant and ecologically liveable city that is rooted in the Pearl River Delta [57]. In 2011, an Outline Plan for Smart Shenzhen was formulated [59]. Before examining this plan, let us examine a brief overview of the mode of governance in SZ.

4.1.2. Mode of Governance

A hallmark of the power structure in Chinese cities is a top-down mode of governance led by the municipal government with a parallel establishment of the Communist Party that holds the real authority [70]. The penetration of the Communist Party in socioeconomic development and governance can be seen in the party building activities in Tencent, a high-tech giant based in SZ [71]. In the case of SZ, the picture is complicated by at least two aspects of the city’s development. First, there are many early “zone builders” who controlled rights to planning and developing different parcels of land in the city [72]. The Municipal Government does not seem to be always successful in regaining its rights to run the city according to its national policy inspired plans. The second aspect is related to the integration of the rural counties into first two districts of the SEZ in 1993 and then full integration with the SEZ to become the SZ Municipality in 2010 [73]. As the Municipal Government does not have enough resources to buy and turn all collectively owned “farmland” into urban land for the market, the city has many “small property rights housing” especially in villages outside the former SEZ, posing formidable challenges to the city in charting a sustainable future.

4.1.3. Urban Audit Datasets

Baseline studies and reviews are carried out in developing China’s comprehensive urban plans (now called the territorial spatial master plan). Relevant data and information are collected to support plan formulation. For the master plans, the city has a tradition of carrying out detailed studies before plan formulation. For instance, in preparing for the 2010–2020 Master Plan, 20 inter-related research topics, including, among others, sustainable development indicators, mode of governance in a city of transition, housing, transport, urban renewal, heritage, water and energy conservation, etc. [74]. However, these data and information are not in the public domain.

4.1.4. Smart and Sustainable: Vision, Goal and Objectives

In 2011, SZ announced an Outline Plan for Smart Shenzhen [59]. As mentioned, SZ’s smart city turn is rooted in the China’s determination to become an innovation nation. The Outline Plan for Smart Shenzhen was based on the 2006–2020 National Digital Development Strategy, The Pearl River Delta Region Reform and Development Plan Outline (2008–2020), Shenzhen City Master Plan (2007–2020), Shenzhen National Innovative City Master Plan (2008–2015) and Shenzhen’s twelfth Five-Year Plan for National Economic and Social Development, etc. [59] (p. 1). This Outline Plan was followed by implementation measures [75].
The Plan outlines a “government coordinates and market operates” model so that the government can coordinate the engineering aspect of digitalisation and standardise the design before the market and the people can participate and contribute to vibrant development [59] (Section 2). The vision then was to create a fully functional information and communication technology infrastructure to support efficient public management and social services, as well as to master core technologies and operating standards to nurture internationally competitive industrial clusters to boost smart city development. These include internationally leading ICT infrastructure and environment that enhances urban development, people’s quality of life and the economic structure and innovative capacity of the city [59] (Section 2). The Outline Plan clearly states in its main task [59] (Section 3): the development of a sustainable smart city and smart enterprises to realise co-prosperity of a sustainable city and production.
In 2013, the Shenzhen Municipal Government published the Implementation Plan for Smart Shenzhen (2013–2015) [75]. The Implementation Plan has been instrumental in accomplishing the following in SZ [75] (Section 3): internationally leading ICT infrastructure; an efficient public digital information platform; smart and convenient urban operations and services; information security system; improved capabilities to protect information systems; information resources and network security, as well as responding to emergency situation; and smart city supporting the development of industrial clusters.
In 2018, SZ updated its smart city strategy based on the Communist Party’s strategic plan of building a strong networked nation, digital China and smart society [76]. The plan aims at achieving “six ones”: one map that tells all, one number to enjoy all public services in SZ, one click to know everything, one-stop operation, one big data platform to release innovative entrepreneurship, and one service platform to integrate public, private and societal efforts to boost people’s smart living [76] (Section 1).
These goals are to be achieved through a “government-led and pluralistic participation” model when various governmental departments are encouraged to build long-term collaboration with competitive enterprises [76]. For example, through public private partnership or procurement services, the government provides open data and service interfaces, and enterprises can invest in the construction, operation and subsequent services to citizens through mobile internet to improve citizens’ experiences and sustainability of relevant projects [76].
The twin goals of SZ’s smart city initiative to improve public services and foster innovative capacity for the private sector mean that most of United Nation’s 17 sustainable development goals (SDGs) have been covered. For instance, SZ has applied big data to deliver new mode of health services [77]. ICT has been used to fight against COVID-19 and a pandemic prevention and monitoring platform has been launched since 4 February 2020 to integrate medical resources, sharing data with all health service centres, 49 hospitals and 21 nucleic acid detection institutions, promoting mutual recognition and sharing of medical testing results and providing online query services for nucleic acid testing reports to reduce the cost of medical treatment for patients [78].
Figure 1 below outlines the development of a typical smart community in SZ, covering SDG3 (health and well-being), SDG4 (quality education), SDG6 (clean water and sanitation), SDG7 (affordable and clean energy), SDG11 (sustainable cities and communities), SDG16 (strong institutions) and SDG17 (partnership) [79] (p. 8). As the first city fully covered by the 5G independent network in China, SZ has initiated the construction of 5G smart posts [80]. To date, 34 parks and greenways have been installed with 5G application products to better serve citizens and the Shenzhen Park Management Centre will formulate a unified standard for the smart park platform in the city, to facilitate the data transmission and improve the efficiency of equipment [81].
The development of an open data and big data trading platform and efforts to promote innovation have helped the growth of a digital economy (SDG8 on decent work and economic growth) [76,82]. In 2020, SZ proposed to accelerate the construction of new infrastructure, including information infrastructure (communication networks, computing and digital technology infrastructure), integrated infrastructure (smart manufacturing infrastructure, smart transport infrastructure and smart energy infrastructure) and innovation infrastructure (technological infrastructure and industrial infrastructure) [83]. In 2021, the Shenzhen Municipal Government planned to accelerate the overall speed of communication networks, boost the comprehensive intelligence of terminal devices, fast-track the construction of big data centres, integrate and upgrade artificial intelligence infrastructure and speed up the construction of block chain technology infrastructure (SDG9 on industry, innovation and infrastructure, and SDG12 on responsible consumption and production) [83]. The development of all the relevant infrastructure and the construction of an open data platform means that various units in SZ have undergone decades of efforts to collaborate and work in partnership (SDG17).

4.1.5. Building Smart Sustainability: Processes and Contents

Financing and Dedicated Authority for Building the Infrastructure

Since the 1990s, SZ has been allocating financial resources to support the development of high-tech industries and smart city initiatives. In 1999, SZ increased its investment in science and technology to 2% of the municipal budget and it was then planned to increase the amount to 2.5% at the tenth Five Year Plan (2001–2005) [65]. The Municipal Government invested RMB 500 million (GBP 38 million) to establish an innovation and technology investment company and increased the capital injection to the high-tech industry investment service company so that its capital could reach CNY 400 million (GBP 30 million) in 2000 [65]. In 2018, the Shenzhen Municipality planned to enhance the approval of funding for digitalisation projects; purchase services from the market through digital construction; encourage private capital to invest in and operate smart cities, establish financial funds for smart city construction, apply and promote mechanisms to guarantee funding support at different geographical levels and strive to secure national and provincial support for pilot demonstration projects [76].
As early as 2008, a Leading Group on the Construction of a National Innovative City was set up to guide SZ’s development [69]. Besides Municipal leadership, officials from the Development and Reform Commission, Trade and Industry, Technology and Information, Finance, Human Resource, Planning, Land and Real Estate, Education, Environmental Protection, Statistics, Industry and Commerce, Quality Supervision, Intellectual Property and High-tech authorities were group members [69]. In 2020, SZ established a Leading Group on New Infrastructure Construction to join efforts at the municipal and district levels to solve major cross-region, cross-field and cross-departmental problems [83]. In 2021, SZ established a Leading Group on the Construction of Smart City Digital Government. The Group was led by the city mayor and is located in Shenzhen Municipal Bureau of Government Service and Data Administration [82].
The Shenzhen Municipal Bureau of Government Service and Data Administration was established in 2019. The Bureau is in charge of constructing smart city and digital government, managing government data, supervising and guiding the construction and implementation of e-government projects, and supporting information security management [84]. Within the Bureau are two subordinate units, Shenzhen Big Data Resource Management Centre and Shenzhen Information Security Assessment Centre [84]. Currently, Shenzhen Municipal Government Data Open Platform has 2457 catalogues, 25,087 data items and 497,398,826 data; and, there are 14 data fields, including education and technology, transportation, culture and leisure, fiscal and tax finance, agricultural and rural services, ecological civilization, labour and human resources, government institutions, enterprise services, public security, economic construction, social development, credit services and hygiene and health [85].
However, the two Centres to collect big data and to operate and manage smart city initiatives are not run by the Shenzhen Municipal Government [76]. The Shenzhen Smart City Big Data Centre (The Big Data Centre) is run by the Shenzhen Smart City Technology Development Group (henceforth the Group), a Municipal-level state-owned enterprise under the Shenzhen Municipal State-owned Assets Supervision and Administration Commission [86]. The Big Data Centre is responsible for implementing the whole life cycle of data acquisition to data dissemination. In terms of data acquisition and transmission, the Group collaborates with operators to build a multi-generational and resilient urban intelligent network system [86]. The Big Data Centre constructs state-owned assets and enterprises cloud and a green and energy-saving data centre, providing a safe and stable platform for data storage and aggregation [86]. For data analysis and decision-making, the Group constructs a state-owned asset “brain”, which displays basic operation conditions, layout and supervision of municipal state-owned assets [87], and through the construction of smart state-owned assets and smart state-owned enterprises and smart display centre, it strengthens the ability of comprehensive analysis and application of urban data to help build a resilient city [86].
The Shenzhen City Operation and Management Centre is set up and operated by the Smart City Research institute of China Electronics Technology Corporation [88], which is a key state-owned enterprise [89]. The institutional set up of these two key operation Centres reflects the importance of smart city initiatives in the Chinese context. The Centre uses the computing resources of the Shenzhen Supercomputer Centre and its system is fully connected to the data of the e-government resource centre, telecom operators, infrastructure operators and internet enterprises to achieve the collection and analysis of city comprehensive information and visualise data [90]. The system managed by the Shenzhen City Operation and Management Centre is a cross-scale, cross-region, cross-department and cross-business comprehensive collaborative management and service platform that integrates technical and business data to function as the brain and nerve centre of urban operation and management [90]. Since beginning its operation, the Shenzhen City Operation and Management Centre has connected to 60 business systems in 19 governmental departments and covered key aspects of city operation, including public security, traffic, ecology and environment [87].
Unfortunately, both Shenzhen Smart City Technology Development Group and Shenzhen City Operation and Management Centre do not have official websites for us to check their operations further.

Data Users and Value Capture Mechanisms

It seems that users of the big data platform are confined to the government related units and private enterprises, such as: the Smart City Research institute of the China Electronics Technology Corporation; state-owned enterprises, such as Shenzhen Smart City Technology Development Group and Shenzhen City Operation and Management Centre; or home-grown private enterprises, including Tencent and Huawei. While there are “commercial data” owned by state-owned enterprises, such as China Mobile or China Telecom or private sectors, such as Baidu, Tencent, etc., that charge market rates, it is not clear whether value capture mechanisms are in place when economic interests generate smart businesses out of the use of data.

4.1.6. Monitoring and Feedback: Spatial and Sectoral Outcomes

It is not easy to identify all the spatial and sectoral outcomes as SZ’s smart city initiatives are unfolding and hence it is even more difficult to audit if they are moving various economic sectors towards sustainability. Table 2 provides a picture of the socio-economic, demographic and spatial developments in the nine districts (plus one functional district). In general, the four districts within the former special economic zone (Nanshan, Futian, Luohu and Yantian Districts) perform better economically. Their per capita GDP and average selling price of housing in the secondary market are higher than those districts outside the former special economic zone. However, the differences cannot be over-stressed, as per capita investment in fixed assets, commodity housing, office buildings sold, per capital local budgetary revenue, and expenditure vary among the various districts. The Environmental Indices seem to confirm that discrepancies among different districts have been improving over the years, implying perhaps SZ has been doing a good job in bringing about smart sustainable development.
Indeed, since 2018 and 2019, all the districts in SZ have restructured their government units and introduced the Bureau of Government Service and Data Administration. Various districts are also encouraged to partner with private businesses to bring out smart sustainable development. More research, however, is required to identify the socio-ecological and spatial winners and losers of SZ’s quest for smart and sustainable development.

4.2. Greater Manchester City Region: From the World’s First Industrial City to UK’s Leading Digital Region

GM is a city-region in north-west England that constitutes the continuous urban area of Manchester, and includes nine adjacent districts (Bolton, Bury, Oldham, Rochdale, Salford, Stockport, Tameside, Trafford, and Wigan). After Greater London, it is the third most populous urban area in the UK with a population of nearly three million residents [93].
Manchester, the birthplace of both the industrial revolution and the co-operative movement, both of which are very urban initiatives, has long aspired to be a world leader in the area of smart cities and civic innovation. Manchester was dubbed as the original modern city by an international campaign launched by the city to argue that it was not only the physical advantages of cotton-friendly climate and easy access to docks and mines in Manchester that led to the first Industrial Revolution, but also a culture of innovation and enterprise, whereby the atom was first split in 1917, and the first stored programme computer was built in 1948, secured Manchester’s early prosperity [94]. It is through this history and heritage that Manchester claims to be at the forefront of the smart city movement.
Building on this legacy of digital enterprises and cultural capital, GM has sought to integrate its digital strategy and sustainable development goals into its economic growth narrative. As early as 1994, the City Pride Economic Plan, comprising Manchester, Salford, Trafford, and Tameside, identified sustainable development and information technologies as key areas to grow and set out a vision to reorient the economy towards retail and commerce following deindustrialisation in the previous decade. The collaborative approach of the Manchester Investment and Development Agency (MIDAS) in 1997 and the Manchester City Pride Economic Development Strategy in 2000 led to what today known as the Manchester Model, that is, an urban growth coalition comprising key anchor institutions in the area to support GM economic growth [95].

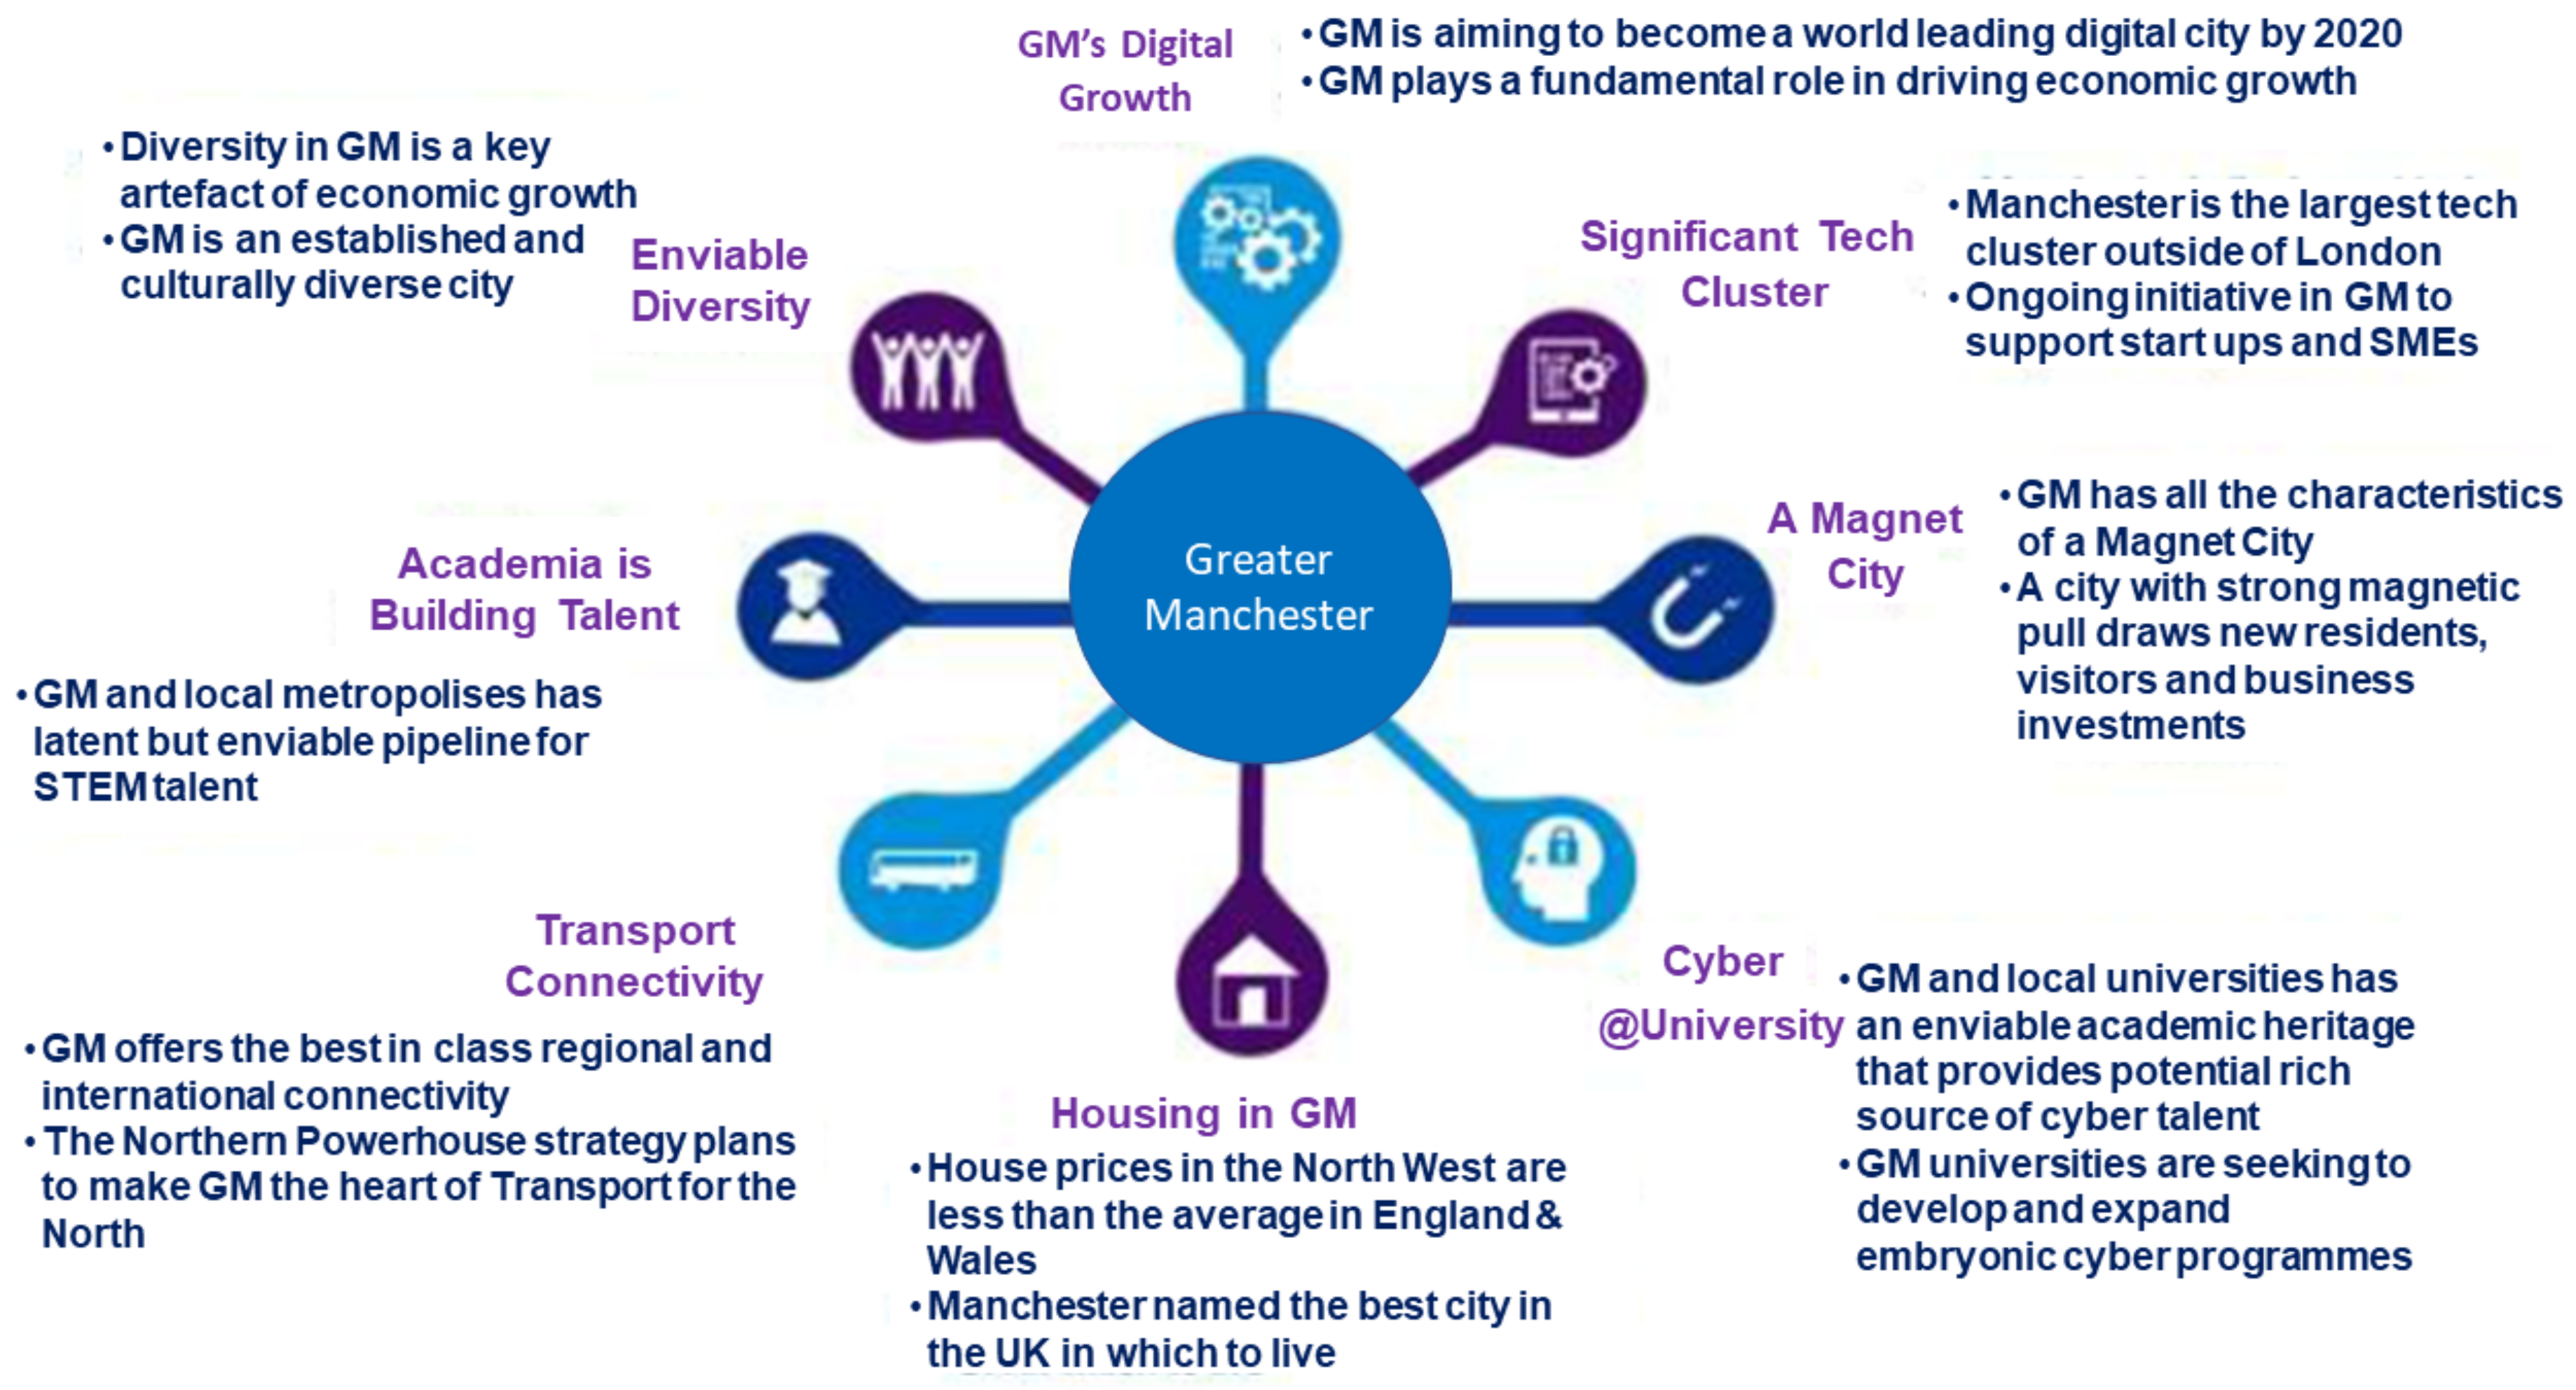
4.2.1. An Entrepreneurial City

The United Kingdom is relatively new to the development of smart cities compared to the early adopters, such as Japan, South Korea, Singapore, China and the US [96]. Government funds have been slow to emerge, and therefore the UK does not have a comprehensive, top-down movement. One of the main reasons behind the UK’s slow adaptation of the smart city agenda has been identified as its ageing infrastructure, namely its outdated broadband services, which have resulted in a typical household or business in the UK having half the download speed compared to Western Europe [97]. In the absence of a national strategy, local authorities have risen to the challenge, with the help from academia and the non-profit sector, as well as the commercial sector, ranging from global corporations to start-up ecosystems. This has created an environment for entrepreneurial approaches to advance smart cities and search for opportunities for funding if productive collaborations can be achieved.
GM has a strong history of enterprise mindset since the industrial revolution. It has, since the turn of the millennium, followed an inward investment growth model aiming to create an environment favourable to commercial enterprises and neoliberal economic growth. The wider city-region centre, comprising the town centres of Manchester, Salford, and Trafford, expects well over GBP 7 bn of investment over the next 10–15 years across a range of varied projects, especially in North Manchester where economic deprivation is more widespread than the rest of the region. Beyond its regulatory role, Manchester has also made investments in or gone into partnerships with businesses in a variety of sectors, including transport, logistics, real estate and digital. Against the backdrop of austerity, policies implemented since 2010 by the then coalition government in the UK, the councils have increasingly adopted entrepreneurial and high-risk revenue generating, pro-development practices.

4.2.2. Mode of Governance

The GM city-region is governed by the Greater Manchester Combined Authority (GMCA), which consists of political leaders from each of the ten districts, plus a directly elected mayor, with responsibility for economic development, housing regeneration and transport. A combined authority is a legal body set up by two or more municipalities to collaborate and take collective decisions across municipality boundaries. It is a very recent phenomenon in England—GM was the first in the country in 2014 and there are currently nine other combined authorities in England representing the biggest city-regions outside London. It is, however, important to note that the ten districts have a long history of partnership working to coordinate their development after the abolition of the former Greater Manchester County Council in 1986. The GMCA is not the only organisation across GM. Others are Transport for Greater Manchester (responsible for transport), Greater Manchester Health & Social Care Partnership (health), and Greater Manchester Local Enterprise Partnership (economic growth). However, GMCA is the key organisation integrating main strategies across different organisations in the GM area for a shared blueprint and programme of action.
In GM and its ten constituent districts, smart city strategies are co-opted into an economic growth strategy over both the short and long-term that is premised on the positive externalities of digital connection. At the city-region scale, of which GMCA is responsible, this is achieved by a place-based leadership drawing its power from a consensus-based partnership between its constituent districts that has formally existed since the creation of the Association of Greater Manchester Authorities in 1986. The GMCA launched a region-wide digital blueprint in 2020, setting out the principles and strategies that the combined authority and its constituent districts will follow to govern GM’s digital economy, which comprised of public sector, private sector, and academia.
At the district level, local authorities in GM have been very proactive in this area over the last twenty years. Activities ranging from involvement in council-led initiatives dating back thirty years, such as the Manchester Community Information Network, to nationally recognised partnerships with international IT companies to roll out internet-connected technologies (e.g., air quality sensing, energy reduction technologies, and wellbeing initiatives). These digital initiatives have stepped up in the last decade, partly due to increased central government financial support. For instance, Manchester is one of the 30 different cities chosen by Innovate UK (with a total fund of £75 m) to support feasibility studies and demonstrator projects of smart city technologies between 2012 and 2020.
In their review of smart city agendas in six cities in the UK, Cowley et al. [12] argued that Manchester has adopted a networked governance approach to smart city, whereby several constellations of organisations and strategies centred around a few key institutions, such the city council, universities, and big businesses, to support GM’s aspirations to become a world leading digital city-region.

4.2.3. Role of Urban Data

The English planning system has a long track record of evidence-informed practice. Although the first New Labour government in 1997 provided strong momentum and justification to evidence-informed policymaking in Britain, Healy [98] argued, for example, that all forms of evidence-informed interventions were particularly popular in pilot initiatives, such as inner-city regeneration programmes in the 1980s. Whilst a traditional rational notion that quantitative evidence should determine the most appropriate policy options can still be observed in practice, planners “more often … rely on experience and more informal investigations of the problem, and rules of thumb or best practices developed and applied by others” [99] (p. 469).
Local development plans, which guide planning and development in a local authority’s area, are created by following the survey–analysis–plan approach, drawing on data sources ranging from traditional statistics, such as demographics produced at small geographical areas, or more specialised data on targeted policy areas, such as digital sector employment. The lack of resources and capacity at the local authority level has been a major millstone in carrying out performance monitoring, and it is thus easier to focus on tangible outputs than the achievement of the quality of outcomes [100,101]. There are also practical problems associated with data availability. Although there have been purposeful attempts to monitor and report on sustainable development or bring different datasets on the planning system together, such as DLUHC Open Data, LG Inform, and the ONS Sustainable Development Goals reporting platform, there is no readily available information on the quality of place or perceptions of environmental quality.
The rapid development of online planning application systems, the use of urban big data and mapping visualisation methods have offered the promise for local authorities as a way forward to fill in the data gaps and develop robust monitoring systems and toolkits. However, the delivery of digital planning is met with major challenges by local authorities, as shown in a report by the UK Digital Planning Task Force [102]. Smart technology cannot be effectively applied without smart management and smart people. The production of new forms of data does involve complex processes of data mining and integration, which in turn requires complex data regulation and management to be in place. This will involve major institutional reform of the planning system and a major re-think of how planning can be conducted in a way that is adaptable to change, as well as the training of a new generation of planners and managers who have a strong grip of policy issues and being technically astute to deploy these technologies [47].

4.2.4. Smart and Sustainable: Vision, Goal and Objectives

Due to the governing arrangements in GM and its ten constituent districts, there are no material differences between sub-regional and district levels in terms of the smart sustainability strategy. In practice, the smart sustainability strategy of GM was the amalgamation of the policies from districts, though it is more strategic by focusing on issues that affect the wider city-region as well as further into the future; whereas the districts focus more on the implementation of this strategy and specific issues in relation to the local area, such as where investment should go. Due to its legacy institutions as well as historical and economic importance within the city-region, Manchester plays a leading role in setting this agenda both at local and sub-regional level.
At the policy level, the adopted strategies that influence the smart sustainability agenda in GM include the Greater Manchester Strategy [103], the Greater Manchester Digital Strategy 2018–2020 [104], the Greater Manchester Digital Blueprint [105], and the Greater Manchester Local Industrial Strategy [106]. GM has the ambition to support growth in the digital sectors with the aim of reducing environmental pollution and helping the region transit towards a low-carbon society, as well as lifting “left behind places” [105]. Even though Manchester City is recognised having a strong and resilient digital sector, almost half of its neighbourhoods are considered in the top 10% deprived communities in England, and other districts in the city-region also suffer from deprivation problems. Considering the disruptive potential of wholesale adoption of digital technologies in manufacturing, the service sector, and supply chains, the Greater Manchester Digital Blueprint argued that becoming a leading digital city-region is imperative to deliver an inclusive and green growth [105].
According to the UK government sponsored Tech Nation Report [107], Manchester is the fastest growing tech city within Europe, with investments in digital sectors having grown by 277% in 2019 from 2009 (GBP 48 m to GBP 181 m). This meant that Manchester has surpassed Cambridge for the first time to become second only to London in terms of venture capital investment in tech companies, and that has established a world-leading tech cluster around e-commerce and digital security and trust [107]. With this growth, the economic benefits to the city-region and the knock-on effect to employees in terms of salary seemed to be reflected in the increase in median salary year-on-year by GBP 2500. In fact, the CompTIA UK Tech Town Index found that Manchester remained a highly sought after by IT professionals, having been the top of the rank in 2019 and number four in 2020 [108]. Underpinning the growth in the digital sector and its key role in achieving Greater Manchester-wide targets in productivity growth and transitioning to low-carbon futures is a seven-point benchmark system to measure the size and health of its digital ecosystem, the diversity of its digital economy, and the impact of digital on the wider sustainability agenda (see Table 3).
These seven indicators are supposed to be reported on a six-monthly basis, in line with the reporting for the Greater Manchester Strategy, but it has been delayed to date due to the COVID-19 pandemic. Amongst the seven indicators, there was a very strong focus on human capital and skills. It was recognised both in the Digital Blueprint [105] and Industrial Strategy [106] that GM needed to support the skills requirements of the digital sector in the wider city-region, in order to fill in the identified gaps in the future jobs, especially in low-carbon energy sectors, but also minimise digital exclusion particularly for those with English as a second language and disabled people, as well as older workers. This was also reflected in the Manchester Digital Strategy [104], which had four interlinked themes:
  • Smart people: everyone able to gain and sustain the skills, aspirations, and confidence to fully participate in the digital world
  • Digital places: providing access, connectivity and support for all residents and businesses and digitally enabling enhanced health and wellbeing
  • Future prosperity: to attract new digital businesses and sectors and support a resilient and inclusive economy
  • Sustainable resilience: meet zero carbon and climate resilience goals and to create open inclusive connectivity with enhanced digital infrastructure as a utility not just a commodity
Therefore, “smart people” was a running theme across both strategies, to ensure that the benefits of the digital sector growth can be shared by all.

4.2.5. Building Smart Sustainability: Processes and Contents

Due to its partnership-led model of planning and investing in digital infrastructure at the local level, most of the funding is raised by the private sector and usually follows the rules of the statutory planning process in England. This is in line with the wider urban development process in England that local councils play a strong role in directing private investment towards the council’s priority areas by creating an attractive regulatory and economic environment for businesses to invest. To this end, GMCA has established a marketing agency [109] to raise Manchester’s profile nationally and internationally as the gateway to the North and improve global perceptions and city ranking. The setup of Manchester’s inward investment promotion agency, MIDAS, is another marketing vehicle. The InvestInManchester.com (accessed on 6 Feb 2022) [110] online platform is another way of marketing itself, which has specific sections for Chinese and Indian audiences, drawing on the UK’s strong social, cultural and economic ties with both regions.
An example of a smart sustainability project led by a public–private partnership is the Manchester Science Park [111]. It is a commercial-led mixed-use development project on a site adjacent to two universities and a large hospital in Manchester, hosting office space, lab space, business support for start-ups, and other bespoke infrastructure and services for life science, medtech, digital tech, advanced materials, and cyber security organisations. The development was funded and delivered by the Manchester Science Partnerships comprising Bruntwood SciTech, Manchester City Council, University of Manchester, Manchester Metropolitan University, Manchester University NHS Foundation Trust, Cheshire East Council, and Salford City Council. A portfolio of urban development investments in the digital sector, aiming to grow Manchester’s knowledge economy for a digital and greener future, are presented in the partnership’s website.
Another example is the Oxford Road Corridor in Manchester. The Corridor is in Manchester’s central business and education district, comprising Manchester’s hospitals, universities and Manchester Science Park. It was described as a living lab [112] due to its explicit emphasis on scientific knowledge production, and its proactive and flexible governance arrangements to address emerging life challenges. As such, the adopted Manchester Local Plan (2012) recognised the added economic value of commercialisation of education and healthcare activities in conjunction with private sector investment in key sectors, such as science and technology, to the wider GM economy. This was again another public–private partnership project, led by Manchester City Council and the University of Manchester.
It is through these partnerships and networks of actors, of which local authorities are a key component, that digital data are produced, collected, managed, and put to use. Unlike more critical and sceptical accounts of smart city initiatives across the world, which depict the role of the public organisations as “powerless” [113] (p. 30), GMCA and its ten constituent districts play a very active role in shaping and managing the wider digital ecosystem in GM. The main mechanism by which this overarching role was achieved was premised on the rich history of local collaboration between the public, private and third sectors. This was summarised in Figure 2.
Digital data in GM are categorised in eight main areas (see Figure 2). There are multiplicities of organisations connected to each other within each of these areas, either in contractual ways or by loose ties, due to funding arrangements, regulatory requirements and commitment levels. The GMCA plays a key role in these constellations of networks, bridging key partners, providing business support to start-ups, offering loans and other financial support to community organisations in this space, and marketing this favourable environment at the national and international channels.
It is not possible to decipher the exact nature of all of these relationships and especially the extent to which the GMCA safeguards the public’s concerns regarding data protection due to the private nature of most of these partnerships, which are privileged and protected in the UK. However, it is worth noting that the GMCA has published strategies and policies to give assurances to the wider public on the use and processing of their data (see [105]).
The Digital Blueprint identified digital infrastructure and productivity as key challenge areas to achieve its targets [105]. Spatial planning is a key enabler for the success of this strategy, as it can unlock land resources needed for future growth in the digital sectors, as well as ensuring strong integration between the requirements of business and households and digital infrastructure capacity. The emerging spatial framework for GM (Except Stockport. The 10 districts and the mayor have the veto power of the Spatial Strategy, and Stockport Borough Council decided to exercise its veto in Dec 2020 and is excluded from the Greater Manchester Spatial Strategy.), Places for Everyone, was meant to deliver this digital and low-carbon growth on the ground [114]. However, its current draft version [114] that went into consultation in 2021 underplayed its role in delivering digitally enabled green growth in the region. For example, it lacked robust policies and action plans to support digital infrastructure and digital-based business opportunities beyond the generic support available to the wider sector. Despite recognising the importance of growth in the digital sector for achieving its sustainability aims (e.g., being carbon-neutral by 2038), it did not offer a detailed delivery plan to secure a long-term, strategic, holistic and integrated approach to smart city. The Spatial Strategy is still in consultation and may undergo further changes until its expected adoption in 2023 [114].
These examples highlight the necessity of partnerships between public and private sectors to support the development of a smart sustainability agenda. In the absence of central government funding and a lack of means to generate income locally, local authorities are forced to enter partnerships with private sector agents to be able to meet the councils’ key priorities for their areas. This is in fact recognised and endorsed by central government in its National Planning Policy Framework [115], which requires local planning authorities to support existing business sectors, by helping to create conditions in which businesses can invest, expand and adapt.

4.2.6. Monitoring and Feedback: Spatial and Sectoral Outcomes

Notwithstanding the long-debated problems of measuring spatial planning outcomes in the UK [101], it is particularly hard to identify monitoring and evaluation datasets and tools to understand the impact of digital technologies and their interaction with spatial planning on sustainable development [47]. Compounding the issues around lack of access to proprietary data from private companies, such as Google, that plays a gatekeeper role to their data generated from their users, it is nearly impossible to identify co-benefits as well as compounding and conflicting consequences on the wider sustainability agenda.
Nonetheless, Table 4 is an attempt to capture the socio-economic, demographic and spatial developments in the ten districts of GM. In general, Manchester as the heartland of the city-region performs much stronger on the indicators about economic development, followed very closely by Trafford and Salford, which are also geographically best placed to enjoy the dividends of recent city-region centre development. This has unfortunately come with a price on social equity, as almost half of neighbourhoods in Manchester are placed in England’s most deprived decile (as measured by the 2019 English Index of Multiple Deprivation), highlighting the well acknowledged problem in Manchester that the city has not been successful in translating economic growth into improved prosperity for many of its residents and communities.
The key question for Manchester and other neighbouring districts is how best to translate and sustain the recent growth and investment in digital sectors and digital economic growth to much wider social and environmental benefits. This is an area that the GMCA and all ten constituent districts pay close attention to, as councils still lag behind the UK average on productivity and there is a strong hope attached to the growth in the digital economy to fill this gap [104].

5. Conclusions

Table 5 shows that the framework is an effective tool for narrating and evaluating the two city-regions’ efforts in moving towards smart sustainability. The exercise reveals possible alternative pathways of developing smart sustainability, rooted in each city’s historical contexts and evolving modes of governance, implying that there is no need for a one-size fit all model [123]. SZ is a rural town turned pioneering metropolis and smart city thanks to a top-down authoritarian regime that orchestrates national reforms and sustainable development. GM was the birthplace of the industrial revolution that has undergone major industrial restructuring but has a strong historical legacy of government, commercial, academic, and non-profit organisation stakeholders working collaboratively at multiple fronts to advance smart and sustainable development in the region. There are pros and cons of these trajectories and both city-regions need to work much harder in terms of leveraging smart technologies to produce place-based knowledge and data sets to develop sustainable strategies and plans.
In SZ, policy measures are cascaded down from above and developed across the board in different districts. Hence, the vision, goal and objectives are more generic, including boosting economic competitiveness and facilitating public administration and social services, and there is strength in developing the platform. In GM, smart initiatives are rolled out to address strategic development issues at the city-region level. Conceptually, there is a smarter integration of smart initiatives and the regional development strategy. Both city-regions attach great importance to sustainability and hence alignment of the SDGs is evident.
“Private” sector resources are important for both city-regions in rolling out smart initiatives, though the pathways are rather different. In GM, while private investments and business partnerships are important vehicles to push through smart city initiatives, the local authorities direct the investment flow following the rules of the statutory planning process, according to their priorities with marketing strategies. SZ seems to rely more on state-owned enterprise and the roles of multi-level states in nurturing the private sector and encouraging its growth. Have all these smart initiatives resulted in greater socio-spatial sustainability in the two city-regions? Unfortunately, socio-spatial disparities can still be found, though it seems to be improving in SZ and GM is working hard to rectify the situation.
The spatial planning inspired framework is robust to audit if a city/city-region is moving towards smart sustainability, as can be seen in the two dramatically different case studies. Indeed, further studies are required to answer all the questions raised with reference to the analytical framework. Nevertheless, the framework serves as a starting point to highlight the importance of not only relating the genesis, processes and contents of smart initiatives in a place to their sustainability outcomes, but also a need to integrate such initiatives with territorial spatial planning and developments.

Author Contributions

Conceptualisation, M.K.N. and C.W.; methodology, M.K.N., C.W., C.K., Y.T.; data collection and investigation, C.K. and Y.T.; formal analysis, M.K.N., C.W., C.K., Y.T.; data curation: Y.T. and C.K.; writing—original draft, M.K.N. and C.K.; writing—review and editing, C.W. and Y.T.; project administration: M.K.N. and C.W.; funding acquisition, M.K.N. and C.W. All authors have read and agreed to the published version of the manuscript.

Funding

This research was funded by the University of Manchester—Chinese University of Hong Kong Strategic Research Fund 2020 and the Research Sustainability of Major RGC Funding Schemes 2018-19 (Project code: 3133239).

Institutional Review Board Statement

This research is approved by the Survey and Behavioural Research Ethics Committee at the Chinese University of Hong Kong (Reference Number SBRE-20-800).

Informed Consent Statement

Informed consent was obtained from all subjects involved in the study.

Acknowledgments

The authors thank the two anonymous referees for useful insights and comments. Usual disclaimers apply.

Conflicts of Interest

The authors declare no conflict of interest.

References

  1. Alkandari, A.; Alnasheet, M.; Alshekhly, I.F.T. Smart Cities: Survey. J. Adv. Comput. Sci. Technol. Res. 2012, 2, 79–90. [Google Scholar]
  2. Cardullo, P.; Di Felicaiantonio, C.; Kitchin, R. The Right to the Smart City, 1st ed.; Emerald Publishing: Bingley, UK, 2019. [Google Scholar]
  3. Glaeser, E.L.; Berry, C.R. Why Are Smart Places Getting Smarter; Taubman Center/Rappaport Institute for Greater Boston: Boston, MA, USA, 2006. [Google Scholar]
  4. Hollands, R.G. Will the Real Smart City Please Stand up? Intelligent, Progressive or Entrepreneurial? City 2008, 12, 303–320. [Google Scholar] [CrossRef]
  5. Kumar, H.; Singh, M.K.; Gupta, M.P.; Madaan, J. Moving towards Smart Cities: Solutions That Lead to the Smart City Transformation Framework. Technol. Forecast. Soc. Change 2020, 153, 119281. [Google Scholar] [CrossRef]
  6. Mora, L.; Deakin, M. Untangling Smart Cities: From Utopian Dreams to Innovation Systems for a Technology-Enabled Urban Sustainability; Smart Cities Series; Elsevier: Amsterdam, The Netherlands, 2019; ISBN 978-0-12-815477-9. [Google Scholar]
  7. Anthopoulos, L.G.; Vakali, A. Urban Planning and Smart Cities: Interrelations and Reciprocities. In The Future Internet: From Promises to Reality; Álvarez, F., Cleary, F., Daras, P., Domingue, J., Galis, A., Garcia, A., Gavras, A., Karnourskos, S., Krco, S., Li, M.-S., et al., Eds.; Lecture Notes in Computer Science; Springer: Berlin/Heidelberg, Germany, 2012; pp. 178–189. ISBN 978-3-642-30240-4. [Google Scholar]
  8. Stratigea, A.; Papadopoulou, C.-A.; Panagiotopoulou, M. Tools and Technologies for Planning the Development of Smart Cities. J. Urban Technol. 2015, 22, 43–62. [Google Scholar] [CrossRef]
  9. Witte, P.; Punt, E.; Geertman, S. Smart Governance in the Making: Integrating ‘Smart’ in Local Spatial Planning. In Handbook of Planning Support Service; Geertman, S., Stillwell, J., Eds.; Edward Elgar Publishing: Cheltenham, UK, 2020; pp. 226–237. [Google Scholar]
  10. Dirks, S.; Keeling, M. A Vision of Smarter Cities: How Cities Can Lead the Way into a Prosperous and Sustainable Future; IBM Corporation: Somers, NY, USA, 2009. [Google Scholar]
  11. Hitachi’s Vision of the Smart City. Hitachi Rev. 2012, 61, 104–171.
  12. Cowley, R.; Joss, S.; Dayot, Y. The Smart City and Its Publics: Insights from across Six UK Cities. Urban Res. Pract. 2018, 11, 53–77. [Google Scholar] [CrossRef] [Green Version]
  13. Fernandez-Anez, V.; Fernández-Güell, J.M.; Giffinger, R. Smart City Implementation and Discourses: An Integrated Conceptual Model. The Case of Vienna. Cities 2018, 78, 4–16. [Google Scholar] [CrossRef]
  14. Kuecker, G.D.; Hartley, K. How Smart Cities Became the Urban Norm: Power and Knowledge in New Songdo City. Ann. Am. Assoc. Geogr. 2020, 110, 516–524. [Google Scholar] [CrossRef]
  15. Mahizhnan, A. Smart Cities. Cities 1999, 16, 13–18. [Google Scholar] [CrossRef]
  16. March, H.; Ribera-Fumaz, R. Smart Contradictions: The Politics of Making Barcelona a Self-Sufficient City. Eur. Urban Reg. Stud. 2016, 23, 816–830. [Google Scholar] [CrossRef] [Green Version]
  17. IPCC. Climate Change 2014: Mitigation of Climate Change: Working Group III Contribution to the Fifth Assessment Report of the Intergovernmental Panel on Climate Change; Cambridge University Press: New York, NY, USA, 2014; ISBN 978-1-107-05821-7. [Google Scholar]
  18. Dembski, F.; Wössner, U.; Letzgus, M.; Ruddat, M.; Yamu, C. Urban Digital Twins for Smart Cities and Citizens: The Case Study of Herrenberg, Germany. Sustainability 2020, 12, 2307. [Google Scholar] [CrossRef] [Green Version]
  19. Bibri, S.E.; Krogstie, J. Generating a Vision for Smart Sustainable Cities of the Future: A Scholarly Backcasting Approach. Eur. J. Futur. Res. 2019, 7, 5. [Google Scholar] [CrossRef]
  20. Toh, C.K.; Sanguesa, J.A.; Cano, J.C.; Martinez, F.J. Advances in Smart Roads for Future Smart Cities. Proc. R. Soc. Math. Phys. Eng. Sci. 2020, 476, 20190439. [Google Scholar] [CrossRef]
  21. Söderström, O.; Paasche, T.; Klauser, F. Smart Cities as Corporate Storytelling. City 2014, 18, 307–320. [Google Scholar] [CrossRef]
  22. Krivý, M. Towards a Critique of Cybernetic Urbanism: The Smart City and the Society of Control. Plan. Theory 2018, 17, 8–30. [Google Scholar] [CrossRef]
  23. Martin, C.J.; Evans, J.; Karvonen, A. Smart and Sustainable? Five Tensions in the Visions and Practices of the Smart-Sustainable City in Europe and North America. Technol. Forecast. Soc. Change 2018, 133, 269–278. [Google Scholar] [CrossRef]
  24. Marvin, S.J. The Environmental Role of Telecommunications in Cities. Green Signals 1994, 11, 7. [Google Scholar]
  25. Viitanen, J.; Kingston, R. Smart Cities and Green Growth: Outsourcing Democratic and Environmental Resilience to the Global Technology Sector. Environ. Plan. Econ. Space 2014, 46, 803–819. [Google Scholar] [CrossRef] [Green Version]
  26. Lovell, H. The Promise of Smart Grids. Local Environ. 2019, 24, 580–594. [Google Scholar] [CrossRef]
  27. Gandy, M. Cyborg Urbanization: Complexity and Monstrosity in the Contemporary City. Int. J. Urban Reg. Res. 2005, 29, 26–49. [Google Scholar] [CrossRef]
  28. Coe, A.; Paquet, G.; Roy, J. E-Governance and Smart Communities: A Social Learning Challenge. Soc. Sci. Comput. Rev. 2001, 19, 80–93. [Google Scholar] [CrossRef]
  29. Baccarne, B.; Mechant, P.; Schuurman, D. Empowered Cities? An Analysis of the Structure and Generated Value of the Smart City Ghent. In Smart City: How to Create Public and Economic Value with High Technology in Urban Space; Dameri, R.P., Rosenthal-Sabroux, C., Eds.; Springer: New York, NY, USA, 2014; pp. 157–182. [Google Scholar]
  30. Batagan, L. Indicators for Economic and Social Development of Future Smart City. J. Appl. Quant. Methods 2011, 6, 27–34. [Google Scholar]
  31. Caragliu, A.; Del Bo, C.; Nijkamp, P. Smart Cities in Europe. J. Urban Technol. 2011, 18, 65–82. [Google Scholar] [CrossRef]
  32. Walters, D. Smart Cities, Smart Places, Smart Democracy: Form-Based Codes, Electronic Governance and the Role of Place in Making Smart Cities. Intell. Build. Int. 2011, 3, 198–218. [Google Scholar] [CrossRef]
  33. Roche, S. Geographic Information Science I: Why Does a Smart City Need to Be Spatially Enabled? Prog. Hum. Geogr. 2014, 38, 703–711. [Google Scholar] [CrossRef]
  34. Greenfield, A.; Shepard, M. Urban Computing and Its Discontents; Situated Technologies Pamphlets; The Architectural League of New York: New York, NY, USA, 2007; ISBN 978-0-9800994-0-9. [Google Scholar]
  35. Breuer, J.; Walravens, N.; Ballon, P. Beyond Defining the Smart City. Meeting Top-Down and Bottom-Up Approaches in the Middle. Tema J. Land Use 2014, 153–164. [Google Scholar] [CrossRef]
  36. Angelidou, M. Shortcomings to Smart City Planning and Development. Exploring Patterns and Relationships. J. Land Use Mobil. Environ. 2017, 10, 77–93. [Google Scholar]
  37. Vanolo, A. Smartmentality: The Smart City as Disciplinary Strategy. Urban Stud. 2014, 51, 883–898. [Google Scholar] [CrossRef]
  38. Gabrys, J. Programming Environments: Environmentality and Citizen Sensing in the Smart City. Environ. Plan. Soc. Space 2014, 32, 30–48. [Google Scholar] [CrossRef] [Green Version]
  39. Townsend, A.M. Smart Cities: Big Data, Civic Hackers, and the Quest for a New Utopia; W.W. Norton & Company: New York, NY, USA, 2014; ISBN 978-0-393-34978-8. [Google Scholar]
  40. Evans, J.; Karvonen, A.; Luque-Ayala, A.; Martin, C.; McCormick, K.; Raven, R.; Palgan, Y.V. Smart and Sustainable Cities? Pipedreams, Practicalities and Possibilities. Local Environ. 2019, 24, 557–564. [Google Scholar] [CrossRef] [Green Version]
  41. Meijer, A.; Bolívar, M.P.R. Governing the Smart City: A Review of the Literature on Smart Urban Governance. Int. Rev. Adm. Sci. 2016, 82, 392–408. [Google Scholar] [CrossRef]
  42. Lambooy, J.G. Knowledge and Urban Economic Development: An Evolutionary Perspective. Urban Stud. 2002, 39, 1019–1035. [Google Scholar] [CrossRef]
  43. Neirotti, P.; De Marco, A.; Cagliano, A.C.; Mangano, G.; Scorrano, F. Current Trends in Smart City Initiatives: Some Stylised Facts. Cities 2014, 38, 25–36. [Google Scholar] [CrossRef] [Green Version]
  44. Komninos, N.; Kakderi, C.; Panori, A.; Tsarchopoulos, P. Smart City Planning from an Evolutionary Perspective. J. Urban Technol. 2019, 26, 3–20. [Google Scholar] [CrossRef]
  45. Harrison, C.; Donnelly, I.A. A Theory of Smart Cities. In Proceedings of the 55th Annual Meeting of the ISSS, Hull, UK, 17–22 July 2011; Volume 55. [Google Scholar]
  46. De Guimarães, J.C.F.; Severo, E.A.; Felix Júnior, L.A.; Da Costa, W.P.L.B.; Salmoria, F.T. Governance and Quality of Life in Smart Cities: Towards Sustainable Development Goals. J. Clean. Prod. 2020, 253, 119926. [Google Scholar] [CrossRef]
  47. Wong, C. Indicators and Urban Planning. In Applied Data Analysis for Urban Planning and Management; Rae, A., Wong, C., Eds.; SAGE Publications: London, UK, 2021; pp. 29–48. [Google Scholar]
  48. United Nations. Transforming Our World: The 2030 Agenda for Sustainable Development; United Nations: New York, NY, USA, 2015. [Google Scholar]
  49. Hernández-Muñoz, J.M.; Vercher, J.B.; Muñoz, L.; Galache, J.A.; Presser, M.; Hernández Gómez, L.A.; Pettersson, J. Smart Cities at the Forefront of the Future Internet. In The Future Internet; Domingue, J., Galis, A., Gavras, A., Zahariadis, T., Lambert, D., Cleary, F., Daras, P., Krco, S., Müller, H., Li, M.-S., et al., Eds.; Springer: Berlin/Heidelberg, Germany, 2011; pp. 447–462. [Google Scholar]
  50. David, B. SMART-CITY: Problematics, techniques and case studies. In Proceedings of the 8th International Conference on Computing Technology and Information Management (NCM and ICNIT), Seoul, Korea, 24 April 2012; pp. 168–174. [Google Scholar]
  51. Gardner, N.; Hespanhol, L. SMLXL: Scaling the Smart City, from Metropolis to Individual. City Cult. Soc. 2018, 12, 54–61. [Google Scholar] [CrossRef]
  52. Heitlinger, S.; Comber, R. Design for the Right to the Smart City in More-than-Human Worlds. arXiv 2018, arXiv:1803.10530. [Google Scholar]
  53. Floridi, L. Information Ethics—An Environmental Approach to the Digital Divide. Philos. Contemp. World 2002, 9, 39–45. [Google Scholar] [CrossRef]
  54. Bartenberger, M.; Grubmuller-Regent, V. The Enabling Effects of Open Government Data on Collaborative Governance in Smart City Contexts. JeDEM 2014, 6, 36–48. [Google Scholar] [CrossRef] [Green Version]
  55. Shenzhen Urban Planning Bureau. Urban Comprehensive Plan of Shenzhen SEZ (1985–2000); Shenzhen Municipal Government: Shenzhen, China, 1986.
  56. Shenzhen Municipal Government. Shenzhen Urban Development Strategy 2030; Shenzhen Municipal Government: Shenzhen, China, 2004.
  57. Shenzhen Municipal Government. Shenzhen Urban Comprehensive Plan (2010–2020); Shenzhen Municipal Government: Shenzhen, China, 2010.
  58. Shenzhen Statistics Bureau. Shenzhen Statistical Yearbook 2020; Shenzhen Statistics Bureau: Shenzhen, China, 2020.
  59. Shenzhen Municipal Government. Outline Plan of Smart Shenzhen (2011–2020); Shenzhen Municipal Government: Shenzhen, China, 2010.
  60. Wen, Y. The Huawei Model: The Rise of China’s Technology Giant; The Geopolitics of Information; University of Illinois Press: Urbana, IL, USA, 2020; ISBN 978-0-252-04343-7. [Google Scholar]
  61. State Council Decision on Encouraging Foreign Investment 1986 No.95. Available online: http://www.gov.cn/zhengce/2020-12/25/content_5574119.htm (accessed on 14 February 2022).
  62. State Council Decisions of the State Council on Several Issues Concerning the Deepening the Reform of the Science and Technology System 1988 No.29. Available online: http://www.gov.cn/zhengce/content/2016-10/19/content_5121808.htm (accessed on 14 February 2022).
  63. Shenzhen Municipal Government. Tentative Provisions on Encouraging Technology and Science Personnel to Establish Non-State-Owned Technological Enterprises No 18; Shenzhen Municipal Government: Shenzhen, China, 1987.
  64. Shenzhen Municipal Government. Shenzhen Special Economic Zone High-Tech Industrial Park Management Regulations No 76; Shenzhen Municipal Government: Shenzhen, China, 1998.
  65. Shenzhen Municipal Government. Revised Regulations on Furthering Support of the Development of High-Tech Industries No 171; Shenzhen Municipal Government: Shenzhen, China, 1999.
  66. State Council. Outline of the National Medium- and Long-Term Science and Technology Development Plan (2006–2020); State Council: Shenzhen, China, 2006.
  67. Shenzhen Urban Planning Bureau. Shenzhen 2030: Toward a Pioneer Metropolis Based on Sustainable Development; Architecture Press: Beijing, China, 2007; ISBN 978-7-112-09323-6.
  68. Shenzhen Municipal Government. Shenzhen Digital City Management Program No 169; Shenzhen Municipal Government: Shenzhen, China, 2005.
  69. Shenzhen Municipal Government. Decision of Shenzhen Municipal Government on Issuing Shenzhen National Innovative City Master Plan (2008–2015); Shenzhen Municipal Government: Shenzhen, China, 2008.
  70. Chinese Community Party Party Leadership in All Work. Available online: http://theory.people.com.cn/n1/2017/1108/c40531-29633369.html (accessed on 14 February 2022).
  71. The Party Building Tencent: When the Penguin Wears the Party Emblem. Available online: http://www.xinhuanet.com/politics/2018-04/02/c_129842262.htm (accessed on 13 February 2022).
  72. Chen, T. A State beyond the State: Shenzhen and the Transformation of Urban China; nai010 Publishers: Rotterdam, The Netherlands, 2017; ISBN 978-94-6208-349-3. [Google Scholar]
  73. State Council. Approval for the Enlargement of Shenzhen Special Economic Zone No. 45; State Council: Shenzhen, China, 2010.
  74. Ng, M.K. Strategic Planning of China’s First Special Economic Zone: Shenzhen City Master Plan (2010–2020). Plan. Theory Pract. 2011, 12, 638–642. [Google Scholar] [CrossRef]
  75. Shenzhen Municipal Government. Implementation Plan for Smart Shenzhen No.20; Shenzhen Municipal Government: Shenzhen, China, 2013.
  76. Shenzhen Municipal Government. Overall Plan for the Construction of a New Smart City in Shenzhen No.47; Shenzhen Municipal Government: Shenzhen, China, 2018.
  77. Shenzhen Municipal Government. Notice of the General Office of Shenzhen Municipal Government on Issuing Shenzhen Informatisation Development 13rd Five-Year Plan No.25; Shenzhen Municipal Government: Shenzhen, China, 2016.
  78. Shenzhen Hygiene and Health Information Academic Conference Opens. Available online: http://www.sz.gov.cn/cn/xxgk/zfxxgj/bmdt/content/post_8340483.html (accessed on 14 February 2022).
  79. Shenzhen Housing and Construction Bureau. Draft Guidelines for Building Smart Communities in Shenzhen; Shenzhen Housing and Construction Bureau: Shenzhen, China, 2013.
  80. Multi-Functional Smart Post Is Coming! It Will Be Right on Your Doorstep. Available online: https://in.sznews.com/content/2020-06/21/content_23273044.htm (accessed on 14 February 2022).
  81. 131 5G Smart Applications and Scenarios Have Been Launched in 34 Parks and Greenways in Shenzhen. Available online: http://sz.people.com.cn/n2/2021/0426/c202846-34695434.html (accessed on 1 February 2022).
  82. Shenzhen Municipal Government. Opinions of Shenzhen Municipal Government on Accelerating the Construction of Smart City and Digital Government No.89; Shenzhen Municipal Government: Shenzhen, China, 2020.
  83. Shenzhen Municipal Government. Implementation Opinions of Shenzhen Municipal Government on Accelerating New Type Infrastructure Construction (2020–2025) No.42; Shenzhen Municipal Government: Shenzhen, China, 2020.
  84. Shenzhen Municipal Bureau of Government Service and Data Administration. In Major Tasks; 2019. Available online: http://www.sz.gov.cn/szzsj/gkmlpt/content/7/7039/post_7039254.html#19227 (accessed on 14 February 2022).
  85. Shenzhen Municipal Government Open Data Platform. Available online: https://opendata.sz.gov.cn/ (accessed on 14 February 2022).
  86. Shenzhen Smart City Technology Development Group Has Made Significant Efforts to Construct State Assets and State-Owned Enterprises Cloud, Kunpeng Ecology and Data Centre and Set-Up a Big Data Company. Available online: http://gzw.sz.gov.cn/zwgk/qt/pcgz/content/post_7272478.html (accessed on 14 February 2022).
  87. Why Do They Say That Shenzhen City Operation and Management Centre Is the City’s Brain. Available online: https://www.sohu.com/a/317523101_100135975 (accessed on 14 February 2022).
  88. City Operation Management Centre: Making City Smarter and More Intelligent. Available online: http://biz.ifeng.com/c/7vdj6X3GvPd (accessed on 14 February 2022).
  89. China Electronics Technology Corporation Introduction. Available online: http://cetccity.cetc.com.cn/cetccity/1565332/1565321/index.html (accessed on 14 February 2022).
  90. Big Data + Visualization: Shenzhen Constructs New Type Smart City Brain, Shares Data and Coordinates Governance. Available online: https://www.sohu.com/a/122787040_115401 (accessed on 14 February 2022).
  91. China Business Intelligence Network GDP Rankings of Districts in Shenzhen. Available online: https://s.askci.com/news/hongguan/20200415/1642191159256.shtml (accessed on 14 February 2022).
  92. Shenzhen Environment and Ecology Bureau. Report on the State of Shenzhen’s Ecological Environment; Shenzhen Environment and Ecology Bureau: Shenzhen, China, 2020.
  93. Office for National Statistics Estimates of the Population for the UK, England and Wales, Scotland and Northern Ireland—Office for National Statistics. Available online: https://www.ons.gov.uk/peoplepopulationandcommunity/populationandmigration/populationestimates/datasets/populationestimatesforukenglandandwalesscotlandandnorthernireland (accessed on 30 January 2022).
  94. Carter, D. Urban Regeneration, Digital Development Strategies and the Knowledge Economy: Manchester Case Study. J. Knowl. Econ. 2013, 4, 169–189. [Google Scholar] [CrossRef]
  95. Peck, J.; Ward, K. City of Revolution: Restructuring Manchester; Manchester University Press: Manchester, UK, 2002; ISBN 978-0-7190-5888-2. [Google Scholar]
  96. International Institute for Management Development Smart City Observatory. Available online: https://www.imd.org/smart-city-observatory/home/ (accessed on 3 February 2022).
  97. The Guardian UK Broadband Speeds among Slowest in Europe, Study Finds. The Guardian. 2020. Available online: https://www.theguardian.com/technology/2020/sep/02/uk-broadband-speeds-among-slowest-in-europe-study-finds (accessed on 6 February 2022).
  98. Healy, A. Commentary: Evidence-Based Policy--The Latest Form of Inertia and Control? Plan. Theory Pract. 2002, 3, 97–98. [Google Scholar] [CrossRef]
  99. Krizek, K.; Forysth, A.; Slotterback, C.S. Is There a Role for Evidence-Based Practice in Urban Planning and Policy? Plan. Theory Pract. 2009, 10, 459–478. [Google Scholar] [CrossRef]
  100. Baker, M.; Wong, C. The Delusion of Strategic Spatial Planning: What’s Left after the Labour Government’s English Regional Experiment? Plan. Pract. Res. 2013, 28, 83–103. [Google Scholar] [CrossRef]
  101. Wong, C.; Watkins, C. Conceptualising Spatial Planning Outcomes: Towards an Integrative Measurement Framework. Town Plan. Rev. 2009, 80, 481–516. [Google Scholar] [CrossRef]
  102. Batty, M.; Yang, W. A Digital Future for Planning: Spatial Planning Reimagined; Digital for Planning Task Force: London, UK, 2022. [Google Scholar]
  103. Greater Manchester Combined Authority. Our People, Our Place: The Greater Manchester Strategy; Greater Manchester Combined Authority: Manchester, UK, 2017.
  104. Greater Manchester Combined Authority. The Greater Manchester Digital Strategy 2018–2020; Greater Manchester Combined Authority: Manchester, UK, 2018.
  105. Greater Manchester Combined Authority. Greater Manchester Digital Blueprint; Greater Manchester Combined Authority: Manchester, UK, 2020.
  106. Greater Manchester Combined Authority. Greater Manchester Local Industrial Strategy; Greater Manchester Combined Authority: Manchester, UK, 2019.
  107. Tech Nation. Tech Nation 2020; Tech Nation: London, UK, 2020. [Google Scholar]
  108. CompTIA The Best UK City for IT Pros to Work and Live. Available online: https://www.comptia.org/blog/best-uk-cities-for-it-jobs (accessed on 6 February 2022).
  109. Marketing Manchester Home Page. Available online: https://marketingmanchester.com/ (accessed on 6 February 2022).
  110. Invest in Manchester Home Page. Available online: https://www.investinmanchester.com/about-us/midas (accessed on 6 February 2022).
  111. Manchester Science Partnerships Home Page. Available online: https://mspl.co.uk/ (accessed on 6 February 2022).
  112. Evans, J.; Karvonen, A. ‘Give Me a Laboratory and I Will Lower Your Carbon Footprint!’—Urban Laboratories and the Governance of Low-Carbon Futures: Governance of Low Carbon Futures in Manchester. Int. J. Urban Reg. Res. 2014, 38, 413–430. [Google Scholar] [CrossRef]
  113. Valverde, M.; Flynn, A. (Eds.) Smart Cities in Canada: Digital Dreams, Corporate Designs: Independent Experts Analyze Often-Controversial Schemes from Nunavut to Montreal to Toronto’s Failed Sidewalk Labs Waterfront Scheme; James Lorimer & Company Ltd.: Toronto, ON, Canada, 2021; ISBN 978-1-4594-1544-7. [Google Scholar]
  114. Greater Manchester Combined Authority. Places for Everyone; Greater Manchester Combined Authority: Manchester, UK, 2021.
  115. Department for Levelling-Up, Housing and Communities. National Planning Policy Framework; Department for Levelling-Up, Housing and Communities: London, UK, 2021.
  116. Greater Manchester Combined Authority. Industry Labour Market and Skills Intelligence Report: Digital and Technology Version 1; Greater Manchester Combined Authority: Manchester, UK, 2020.
  117. Local Government Association. Local Green Jobs—Accelerating a Sustainable Economic Recovery; Local Government Association: London, UK, 2020.
  118. Ofcom. Connected Nations 2021; Ofcom: London, UK, 2021. [Google Scholar]
  119. Climate Emergency UK Council Climate Plan Scorecards. Available online: https://www.climateemergency.uk/council-climate-scorecard (accessed on 5 February 2022).
  120. Office for National Statistics Home Page. Available online: https://www.ons.gov.uk/ (accessed on 13 February 2022).
  121. Department for Levelling Up, Housing and Communities Home Page. Available online: https://www.gov.uk/government/organisations/department-for-levelling-up-housing-and-communities (accessed on 13 February 2022).
  122. Department for Business, Energy & Industrial Strategy Home Page. Available online: https://www.gov.uk/government/organisations/department-for-business-energy-and-industrial-strategy (accessed on 13 February 2022).
  123. Angelidou, M. Smart City Policies: A Spatial Approach. Cities 2014, 41, 3–11. [Google Scholar] [CrossRef]
Figure 1. Framework for developing a smart community. Source: Translated and redrawn from [79] (p. 8).
Sustainability 14 03509 g001
Figure 2. The GM Digital Ecosystem Overview. Source: Modified from [104] (p. 8).
Sustainability 14 03509 g002
Table 1. Integrated spatial planning framework for evaluating smart sustainability.
Spatial Planning ProcessQuestions to Be AskedRationale
History and contexts
  • How strong is path dependency?
  • Is the territory ready to embrace or resist changes?
  • What is the mode of governance and what are the power relationships among different stakeholders at different scales and in different sectors?
Every context is unique and this is also true for smart sustainability pathways
Acquisition of place-based knowledge
  • Are there a comprehensive set of urban audit datasets?
  • Who produces, collects, synthesizes, interprets, manages, monitors and communicates these data?
Answers to these questions reveal the mode of governance in a place
Vision, goal and objectives
  • What processes are involved in developing the vision, goals and objectives of smart cities?
  • What roles have different stakeholders played in the processes?
  • Have the vision, goal and objectives embraced smart sustainability (such as UN’s sustainable development goals), treating data as common
While these may just be rhetorical, the information can reveal the mode of governance and power relationships of a territory
Processes and contents
  • Has there been a dedicated authority for smart city development? How is this related to the planning authority?
  • Have fiscal resources been allocated to the smart city initiatives?
  • What are the infrastructures for data acquisition, vitalization, support, application and services?
  • How integrated are these various layers?
  • Who is involved in acquiring, processing, sharing, and consuming the data generated?
  • Who are the key decision makers?
  • Are these infrastructure layers transparent and participatory in nature?
  • Who is eligible to use the data?
  • Are there mechanisms to realise value capture when data are manipulated for profit?
It is important to ask ethical questions related to the hard and soft infrastructures as these are just tools and the purposes of utilising these tools need to be clarified and examined carefully.
Monitoring: spatial and sectoral outcomes and feedback loop
  • Audit the adoption of smart technologies in different economic sectors and examine if the initiatives have moved the sector towards sustainability.
  • Have there been institutional or legal changes?
  • Have peoples’ lifestyles changed?
  • Who are the spatially enabled and who are the spatially disenabled?
  • Spatial coverage of the e-services to identify if any people, place or ecology is being left alone
  • Is there a need to rethink the goals and objectives of smart sustainable development in the city?
Examining and evaluating outcomes are important steps in a planning process, to provide feedback to future endeavours.
Source: Authors.
Table 2. Socio-economic, spatial and demographic data of the nine districts and one function district in Shenzhen.
IndicatorNanshan DistrictFutian DistrictLuohu DistrictYantian DistrictBao’an DistrictGuangming DistrictLonghua DistrictLonggang DistrictPingshan DistrictDapeng New Functional District
GDP (CNY 100 million)6103.694546.502390.26656.483853.581020.922510.774685.78760.87351.44
Per capita GDP (CNY)394,881273,407226,221269,490115,286155,155147,147186,788164,370222,289
Land area (sq km)187.5378.6678.7574.99396.61155.44175.58388.22166.31295.38
Employment (urban units) (10,000 persons)100.32100.2736.316.3190.8220.4049.2570.0917.404.00
Permanent population (registered) (10,000 persons)98.00107.0861.727.9965.110.0740.983.89.153.96
Permanent population (non-registered) (10,000 persons)56.5759.2143.9416.37269.1655.73129.73167.0637.1411.85
Total permanent population (10,000 persons)154.57166.29105.6624.36334.2665.80170.63250.8646.2915.81
Growth rate of energy consumption per unit of GDP−0.02−0.04−0.05−0.05−0.05−0.03−0.04−0.03−0.06−0.04
Investment in fixed assets (million yuan)159,23953,95834,86717,048130,20362,07087,531132,14939,16610,418
Per capita investment in fixed assets (million yuan)1030324.49330.00699.85389.53943.33512.99526.78846.11659.00
Commodity housing for residential use sold (10,000 sq m)86.0233.6911.6219.78134.9556.1884.03155.8952.613.66
Office buildings sold (10,000 sq m)28.817.5012.200.2815.610.867.5512.474.35n.a.
Commercial buildings sold (10,000 sq m)5.198.900.140.035.921.429.376.841.97n.a.
Vacant buildings (10,000 sq m)55.6215.7227.9638.2374.5612.4351.480.8928.2111.14
Housing market (residential; average selling price in secondary market) (CNY/sq m)95,41397,25669,62547,30054,60546,01459,86244,52735,06330,151
Local budgetary revenue (CNY million)30,874.2019,269.719285.223228.4626,713.865863.5814,215.5424,240.334652.082325.21
Per capita Local budgetary revenue (CNY)19,974.2511,588.018787.8313,253.127991.948911.228331.219662.8910,049.8614,707.21
Local budgetary expenditure (CNY million)35,817.0229,557.5421,969.546806.4046,428.5313,341.0226,078.4735,691.0715,021.396488.97
Per capita local budgetary expenditure (CNY)23,172.0417,774.6920,792.6727,940.8913,889.9420,275.1115,283.6414,227.4932,450.6241,043.45
Number of employees managing water conservancy, environment and public facilities52394358135848067061624821611185412
Environmental Index (EI)64.6
(good)
61.1
(good)
74.4
(excellent)
82.6
(excellent)
60.9
(good)
61.6
(good)
57.1
(good)
61.4
(good)
68.6
(good)
91.4
(excellent)
Notes: Data year is 2019 (except land area is 2018); Total permanent population = Permanent population (registered) + Permanent population (non-registered); Per capita GDP = GDP/Total permanent population; Per capita revenue = Local budgetary revenue/Total permanent population; Per capita expenditure = Local budgetary expenditure/Total permanent population. Source for GDP: [91]. Source for Environmental Index (EI): [92]. Source for other indicators: [58].
Table 3. Seven high-level indicators to monitor the digital sector landscape in GM.
MeasureTarget
Growth and productivity—GVA per jobTo grow GVA per filled job from GBP 41,984 to GBP 44,500 by 2020.
Digital skills—pipelineTo reduce the percentage of GM digital businesses that report turning down work as a result of being unable to find the right talent from 27% (2017) to 5% by 2020.
Digital inclusion—possessing basic digital skillsIncreasing the percentage of GM residents that have all five basic digital skills (communicating, creating, transacting, problem-solving and managing information) from 78% (2016) to 82% by 2020
Digital inclusion—basic digital skills usageIncrease the percentage of adults who have used all five basic digital skills (communicating, creating, transacting, problem-solving and managing information) from 42% in 2017 to 60%, with no borough below 50%, by 2020.
Growth and productivity—gender balance in digital companiesTo change the ratio of men: women among IT and tech workers in technical roles from 79:21 in 2016/17 to 60:40 by 2020, as a milestone to 50:50 by 2025.
Digital infrastructure—average download speedBy 2022/23, the average download speed across fibre, cable, mobile and wireless will exceed 100 Mbps, compared to a Q4 2017 baseline of 32 Mbps
Digital infrastructure—fixed broadband speedIncrease the percentage of premises in GM with fibre to the premises from 2% to 25% by 2020
Source: [104] (p. 4).
Table 4. Socio-economic, spatial and demographic data of the ten districts in Greater Manchester.
IndicatorManchesterSalfordTraffordStockportOldhamRochdaleBuryWiganTamesideBolton
GDP at current market prices (GBP million) (2018)25,059847910,0787778466342893959613141486702
GDP per capita at current market prices (GBP) (2018) 45,75933,32842,63626,65719,79019,49720,82418,80218,42223,486
Total area (sq. km) (2018)1169710612614215899188103140
Population (2020)555,700262,700237,600294,200237,600223,700190,700330,700227,100288,200
Employed population (2021) 274,100122,700114,300136,800104,50089,70090,200159,500107,400123,500
Qualification (high school standard and above) (2020) 249,90098,40096,700106,90073,40068,00070,700103,00068,40092,900
Gross weekly pay (GBP) (2021)529.1555.1683.3632.2544.7529.6609.4583.9527.0528.3
Job density (the ratio of total jobs to population aged 16–64) (2020)1.160.821.130.840.630.620.650.610.560.76
Location quotient for digital and creative industries (Great Britain = 1.0)1.051.40.851.00.450.450.450.350.350.45
Estimated total number of direct jobs in low-carbon and renewable energy sector by 2030 (2020)6175259723493067217318381490256419212465
Total expenditure of the public sector on services (GBP thousand) (2021)983,424415,148325,202439,810397,761407,255290,868505,212353,086438,630
Business start-ups per 10,000 population (2020)104.593.889.161.767.556.068.451.047.575.1
CO2 emissions per capita (tonnes) (2019)3.74.86.24.13.34.34.53.83.64.2
Median house price (GBP) (2021)203,250190,000315,000260,000159,950155,000196,000150,000162,500150,000
Residential properties sold (March 2020–March 2021)4326279130694202219622142188404925273370
Percentage of neighbourhoods in the most deprived decile in England (2019)433059303010172124
Median internet download speed (household, Mb/s) (2021)63.469.670.473.968.158.654.870.257.872.4
Median internet data usage (household, gigabytes) (2021) 396346316296350372310318348322
GVA per hour worked compared to national average (United Kingdom = 100) (2019)959910487807978778482
Climate action plan index (national rank) (2022)150351261181455274N/A89
Notes: Source for location quotient data for digital and creative industries in GM was [116] (p. 13). Source for the estimated total number of direct jobs in low-carbon and renewable energy sector by 2030 was the report “The role of local government as place shapers in delivering Clean Growth”, written by Ecuity consulting on behalf of the Local Government Association [117]. Source for the internet data [118]. Source for the climate action plan index [119]. Sources for other indicators [120,121,122].
Table 5. Smart and sustainable? Comparing Shenzhen with Greater Manchester.
Spatial Planning ProcessShenzhenGreater Manchester
History and contexts
  • Area: 1997 km2; population: 13 million (2019)
  • A rural town turned smart city
  • Strong central government-led smart city development
  • An experimental city: pioneer and testing ground of smart sustainability reforms in China
  • Area: 1276 km2; population: 2.8 million (2019)
  • Birthplace of the industrial revolution and the co-operative movement
  • A long history of local collaboration
  • An entrepreneurial city, local authorities working with academics, commercial sector and NGOs to advance smart sustainability
Acquisition of place-based knowledge
  • Both cities have a tradition of evidence-informed planning, relying on, among others, place-based knowledge
  • In SZ, the data sets are not displayed in the public domain and the smart city data platform provides a potential for these to be better organised. Further research is required
  • In GM, the execution of the policy is limited by local capacity and the technical and regulatory complexities involved in managing data on a digital platform
Vision, goal and objectivesTo develop a mature ICT infrastructure to support administration and social services, as well as to boost global competitiveness, related to most of the 17 SDGs
  • A vision of being a leading digital city-region with inclusive and green growth
  • Four interlinked themes on smart people, smart place, future prosperity and sustainable resilience, that align well with the SDGs
Processes and contents
  • Dedicated authority and resources for smart city development
  • Data collection, operation, and management of smart initiatives by state-owned enterprises, as a cross-scale, cross-region, cross-department and cross business endeavour
  • Value capture mechanisms not clear
  • Multiplicities of actors producing, processing and using data
  • Local government acting as a place-based leader to coordinate private activities to meet the vision and goals
  • Transparency and accountability are key areas of concern due to the private nature of these partnerships
Monitoring: spatial and sectoral outcomes and feedback loop
  • Socio-spatial disparities between the former special economic zone and the former rural districts
  • Yet improving trends
  • More research is in order
  • Manchester, with Trafford and Salford, is leading in the region, where socio-spatial inequities are evident
  • More efforts are required to share prosperity with the deprived areas
Source: Authors.
Publisher’s Note: MDPI stays neutral with regard to jurisdictional claims in published maps and institutional affiliations.

