Article

Measuring the Sustainability of the Orange Economy

by
Francisco J. Ferreiro-Seoane
1,
Alicia Llorca-Ponce
2,* and
Gregorio Rius-Sorolla
2
1
Department of Applied Economics, Faculty of Law and Faculty of Social Sciences, University of Santiago de Compostela, Avenida Dr. Ángel Echeverri, s/n. Campus Vida, 15782 Santiago de Compostela, Spain
2
Departamento de Organización de Empresas, Universitat Politècnica de València, Camino de Vera s/n, 46022 Valencia, Spain
*
Author to whom correspondence should be addressed.
Sustainability 2022, 14(6), 3400; https://doi.org/10.3390/su14063400
Submission received: 20 December 2021 / Revised: 28 February 2022 / Accepted: 5 March 2022 / Published: 14 March 2022
(This article belongs to the Special Issue Orange Economy in the SARS-COV-2 Era)

Abstract

:
1. Background. The Orange economy includes creative and cultural activities; and it has aroused great interest, both for research on growth and for public agencies and institutions, which have highlighted its capacity as an economic engine and a generator of sustainable growth. Despite this widely disseminated argument, empirical evidence is scarce. 2. Methods. This paper aims to resolve that, based on an analysis of Orange economy companies in two Spanish regions—the Valencian and Galician Autonomous Communities—for the period between 2000 and 2019. Based on the SABI® database, which contains data from the annual accounts that companies must submit to Mercantile Registry, company’s data have been grouped into three large subgroups and within activity branches. 3. Results. The Orange economy revenues and earnings have contributed at a higher growth rate than of the economy as a whole. It has achieved higher profitability ratios on a lasting basis over time. Although, there are differences between the various activities included in this sector 4. Conclusions. The Orange economy can be considered as an engine and a generator of sustained growth over time. Furthermore, results obtained show that the Orange economy is a sector that is resilient against crisis.

1. Introduction

Creative and cultural activities, more recently encompassed in the Orange economy, have been the subject of great interest in recent decades. They have been attributed great potential as engines of economic growth and sustainable development, a role that has been encouraged by various international organizations. There has been much commentary on the important capacity of the creative and cultural sector to generate sustainable growth from the triple economic, social, and environmental perspective. Accepting this premise, there is a commitment to the creative and the cultural economy that is manifested in the proposal and the implementation of various economic policy measures. However, despite the wide acceptance of the growth capacity of creative and cultural activities, there is a lack of empirical evidence to support this claim. The objective of this paper is to contribute to alleviating the lack of empirical results/evidence. The widespread acceptance of the capacity of creative and cultural activities to generate growth and employment has driven the design and the implementation of economic policies to stimulate and to support these activities in several economies. This study provides empirical evidence not only for the sector as a whole but also for the different activities that compose it, information that can be very useful for policy design. Thus, the questions we propose to answer are the following: Is the Orange sector capable of generating sustained growth over time at a higher rate than other economic sectors? Furthermore, does it make sense to speak of the Orange economy as a sector or, on the contrary, is it a grouping of activities with little relation?
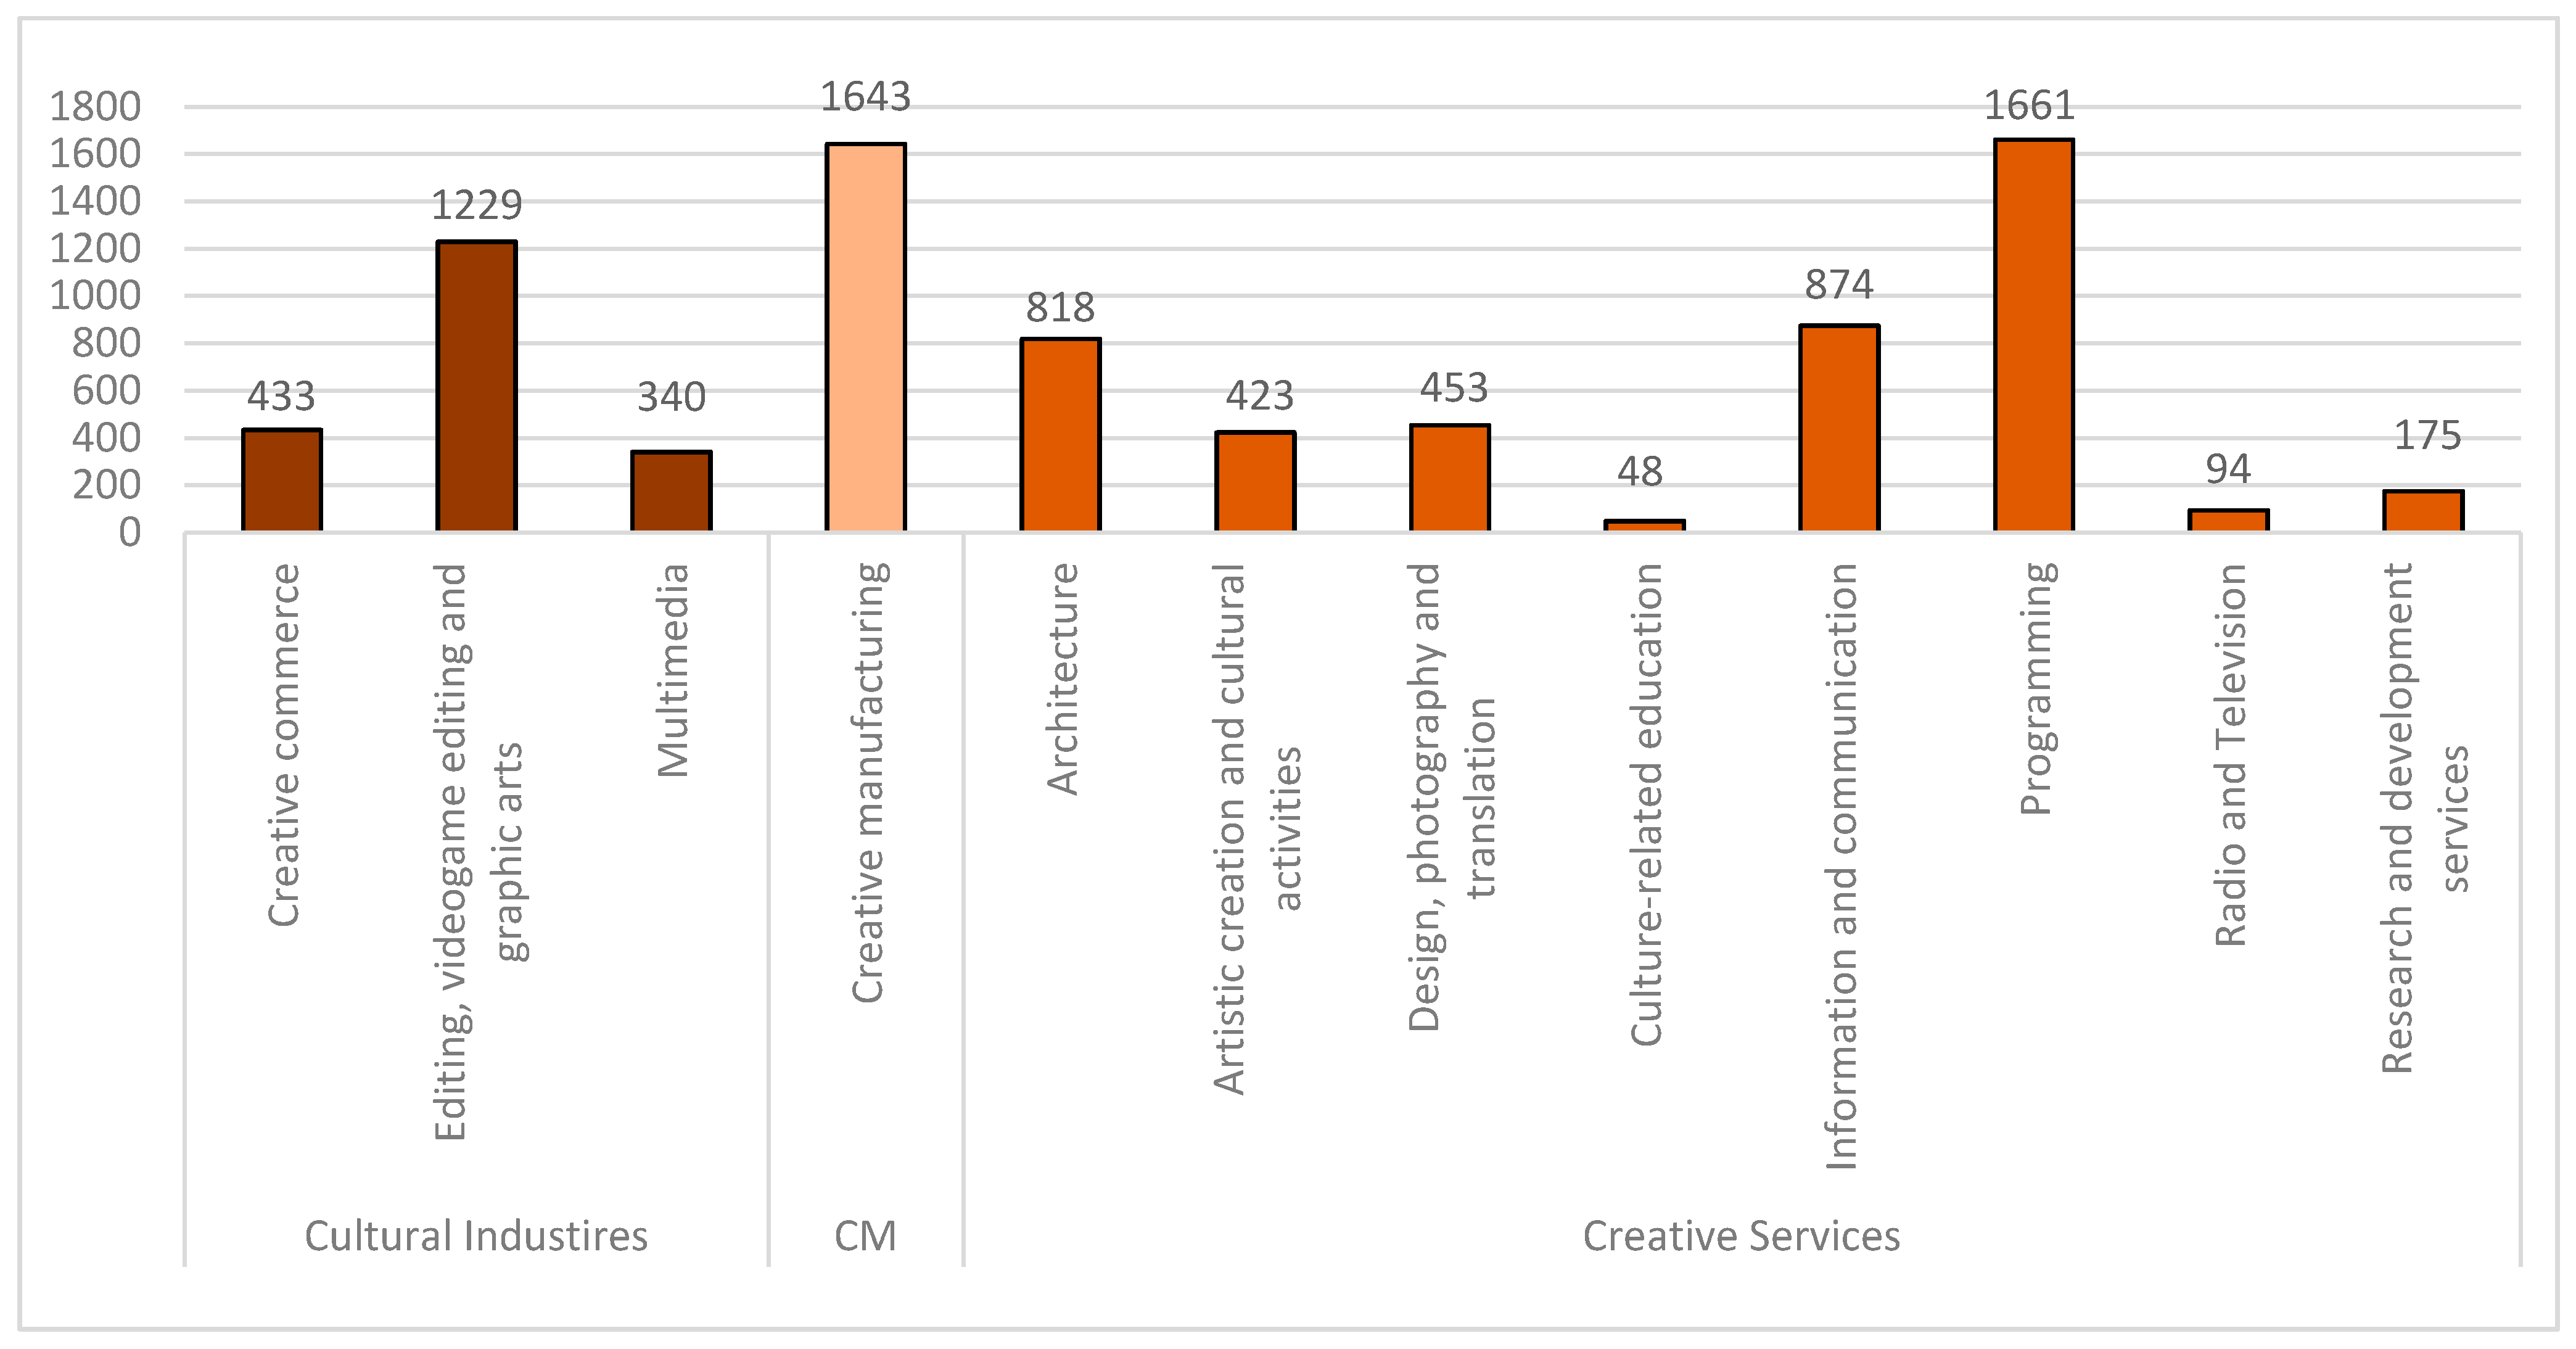
The paper begins with a literature review on sector delimitation and its contribution to growth and to sustainability and then gives way to the empirical study carried out. It considers Orange economy companies in two Spanish regions: the Valencian Community and the Galician Community—both coastal regions, one on the Mediterranean and the other on the Atlantic. For information selection, the SABI® database, “Sistema Anual de Balances Ibéricos” (Annual System of Iberian Balance Sheets) has been used; and, the companies that, according to the National Classification of Economic Activities (CNAE-2009), belong to the sectors included in the creative and cultural sector have been considered. The data collected are part of the information related to the annual accounts that companies must submit to the Mercantile Registry. The sample consists of 8191 companies, for the analytical period from 2000 to 2019. The activities included in the Orange sector are diverse, so it seems appropriate, in addition to the overall sector analysis to delve into the characteristics and companies’ results according to the different types of included activity branches. The study shows a picture of the Orange sector structure based on the classification of activities. The companies are grouped according to their CNAE in three large subgroups: creative manufacturing, cultural industries, and creative sectors. The various subgroups are, in turn, made up of groups of activities called branches, which are grouped according to their affinity.
The analyses carried out show that revenues, the number of companies, and the results of the Orange sector have grown proportionally more than the economy as a whole, so our results support the claim that the Orange economy is the driving force behind growth. Furthermore, if we consider the types of activities that comprise the sector and its dynamism, they have been greater than the economy as a whole, except in some cases. In terms of profitability, the results obtained from the data analysis allow us to affirm that the Orange sector as a whole presents good sustained profitability over time, as well as showing greater resilience than other sectors in the face of the crisis unleashed in 2008. Finally, it is necessary to point out that a complete assessment of the sustainability of the Orange sector requires addressing the social and the environmental pillars.
The remainder of the paper is structured as follows: first, a theoretical framework is presented; second, the employed methods are presented; third, the qualitative study is presented; and finally, some discussions and future works are provided.

2. Theoretical Framework

This section briefly presents the approaches and analyses considered relevant to the work. It begins with a delimitation of the Orange economy term, and it goes on to analyze the relationship between it and sustainable development. Once the study object has been defined, an analysis is made of the information the literature can provide to evaluate the economic and social sustainability of this sector. For this purpose, a systematic review was carried out based on several searches in the Web of Science. The search terms used were: “creative economy” and “cultural economy”; “creative economy” and “sustainability”; and “creative economy” and “growth”. The protocol of a systematic literature review was followed, selecting only those articles that addressed the objectives concerning aspects such as the concept and its delimitation, sustainable development, growth of economic variables, and gender issues [1].

2.1. Orange Economy Delimitation

The term Orange economy was coined by Felipe Buitrago and Iván Duque in the publication “The Orange Economy; an infinite opportunity” published by the Inter-American Development Bank [2]. This includes those activities that are part of what is known as the creative economy and the cultural sectors. The grouping of creative activities together with cultural activities in what is known as the creative sector has a practical origin related to the emergence, in the United Kingdom, of public policies focused on promoting the valorization of cultural activities and the issue of copyright. In the late 1990s, the action plan carried out by the UK Department for Culture, Media and Sport (DCMS) approved a public agenda for the promotion of cultural activities. The plan included diverse and unrelated sectors such as museums, video games, and architecture [3].
The term creative economy was popularized by John Howkins in 2001 [4], encompassing creative activities that can be expressed through art, culture, or innovation. Howkins argues that creative industries that originate from individual creativity, skills, and talent have the potential to create wealth and jobs through the generation and the exploitation of intellectual property. According to the United Nations (2004) [5], the creative economy is characterized by “activities having a strong artistic component to any economic activity producing symbolic products with a heavy reliance on intellectual property and for as wide a market as possible”. Howkings includes within the creative economy activities such as innovation and development, building, software, television and radio, design, music, film, games, advertising, architecture, and the arts.
The creative economy as a whole can be defined as one in which companies promote creativity, knowledge convergence and advanced scientific technology, relying on coordinated learning to create new markets and new jobs [6]. Although there is no single definition of the creative economy, nor is there consensus on what activities should be included in the creative economy, it is widely accepted that the creative industries are at its core and that all definitions adopt the concept of “creativity” as an essential characteristic. The combination of creativity and goods gives rise to emergence of a new product class, “creative goods and services”, including the group of “cultural goods and services” which, in addition to incorporating creativity, have an artistic or cultural content [7]. Nevertheless, aspects related to creativity in a broad sense are not only generated by cultural and creative industries but should also include innovation [8]. Beyond the debates on what and what is not included in creative economy, for the set of activities in that field, a common meeting point or common character is identified based on three aspects; firstly, creativity, arts and culture as raw material; secondly, existence of a relationship with property rights; and thirdly being an activity framed within a creative value chain [2].
UNESCO (2009) [9] points out six pillars that form the cultural domains: cultural and natural heritage, performances and celebrations, visual arts and crafts, books and press, media and design and creative services, deeply connected to local intangible assets, cultural heritage and other economic domains related to tourism and recreation [10].
The Orange economy includes the cultural economy, the creative industries, and the areas that support creativity. Following Rausell Köster et al. [11], the activities of the Orange economy are grouped into three major subgroups: creative manufacturing, cultural industries, and creative services. Although some authors consider that manufacturing by itself should not be included, since it is not a creative activity, its inclusion is considered appropriate. The creative economy is an evolving concept as the phenomenon is very dynamic and the products generated by these industries are not traditional products, therefore they are not easily quantifiable [10]. The study includes those companies registered with a main activity in one of the CNAE-2009, although companies may additionally be registered in other areas.
Although this paper does not analyze the creative sector from a spatial perspective, it is well known that cultural and creative activities are concentrated in cities and in certain areas within them [3,12].
Despite the strong development of the creative economy concept and its wide repercussion in political and academic circles, the literature on the creative economy, creative classes, and creative cities has been criticized for its conceptual vagueness and aseptic nature, for responding only to certain economic groups interests, or for concealing urban segregation phenomena [3,13].

2.2. Creative Economy, an Economic Model towards Sustainability

The creative activities and culture sector have gained importance in recent years, betting on the “Creative Economy” as an alternative to traditional development models [3]. Many countries around the world are seeking to adopt policies to foster cultural and creative industries for economic growth, employment expansion, and nation branding [14].
The growing recognition obtained by the creative and cultural sector is due, in part, to the commitment to creativity and culture on various international institutions. The release in 2004, 2008, and 2010 of the Creative Economy Reports published by the United Nations Conference on Trade and Development [5,7,15] stimulated interest in this subsector as a possible source of economic dynamism in developing countries. These reports advocated the harnessing of creativity and the deployment of cultural resources in developing countries as a means for growth, job creation, and export expansion [16]. The rise of the Orange economy was also due to work by the UN within its sustainable development agenda framework; with the proximity to the expiration of the Millennium Development Goals, progress is being made in the development and the definition of the Sustainable Development Goals (SDGs), introducing the cultural sector as a major player. Thus, cultural industries attain an important relevance in the post-2015 development agenda.
The activities included in the Orange economy are very diverse and the impact of the different types of activities on growth needs to be studied in greater depth. Moreover, there is a lack of empirical evidence and methodologies to measure them [17].
Cultural and creative economy initiatives have gained space in the last two decades. Many voices point to the potential of the cultural and creative sector as a driver of sustainable development [18]. Its powerful role as a resource for the improvement of local cultural, social, environmental, and economic conditions is recognized. It is considered a potential resource for generating economic growth, promoting cultural diversity, human development, and social cohesion [19]. Creativity promotes inclusive social progress and empowers people to take responsibility for their own economic, social, and personal development; and, it fosters innovation, aspects that contribute significantly to sustainable growth [14]. “Creativity, knowledge and access to information are increasingly recognized as powerful drivers of economic growth and the promotion of development in a globalizing world” [7]. In 1987, the United Nations World Commission on Environment and Development, the Brundtland Commission, defined sustainable development as “development that meets the needs of the present without compromising the ability of future generations to meet their own needs” [20]. Years later, the World Commission on Culture and Development held in 1995, in its report Our Creative Diversity [21], highlighted the possibilities of the cultural sector for sustainable development. These possibilities were made explicit at the UNESCO summit held in Stockholm in 1998, elaborating an Action Plan to guide the implementation [22]. They were further developed in the 2005 Convention on the Protection and Promotion of Diversity of Cultural Expressions [23], an activity that continues today; and, follow-up reports on the guidelines and actions set out in the 2005 Convention were published in 2015 and 2018 [24].
In 2012, the United Nations conference was held with the aim of launching a process to develop a set of sustainable development goals [25]. The final agreement of the conference entitled “The Future We Want” points to the role of culture and creativity for sustainable development but falls short of fully understanding its potential [16]. It was in 2015 when culture was introduced into the 17 SDGs with the 2030 Agenda that took over from the Millennium Development Goals (MDGs), the global agenda promoted between 2000 and 2015. Although none of the 17 SDGs focuses exclusively on culture, the 2030 Agenda includes explicit references to cultural aspects. The new global agenda places culture as a relevant sector for development, in which cultural and creative industries not only play an important role in the production of new technologies or creative ideas but also in the generation of non-monetized social benefits [19]. At the 74th United Nations General Assembly, the year 2021 was declared the International Year of Creative Economy for Sustainable Development [26].
Many studies point to the positive effects of creative and cultural industries on sustainability [12,27]. Creative industries and culture have a positive impact on the development of inclusive societies. A shared sense of cultural identity and cultural values help strengthen social cohesion [14,28]. They provide inclusive social development and encourage people to take responsibility for their own progress. They also promote innovations that are crucial for sustainable development [29,30,31,32]. Cultural and creative activities are activities that promote tolerance and social inclusion. Creative industries provide an invaluable social cement, contributing to the feeling of belonging to a society [33].
Contrary to previous visions of creative and cultural economies as generators of sustainable growth, there are voices that are critical in this regard [34,35]. There is debate in the academic literature regarding the absence of links between the creative economy and sustainability. It is far from clear that these sectors contribute to social and environmental sustainability. In relation to the social pillar, critical views point out that precarious labor conditions often present in these sectors do not seem to support the idea of the culture and creative sector as leading to sustainability. For example, the gentrification phenomena, which attracts the creative class, leads to the displacement of underprivileged classes to other areas or neighborhoods of the city [36]. Regarding the environmental pillar, there is a fairly widespread assumption that creative and cultural industries generate less impact on the environment and they are inherently clean. Nevertheless, this consideration does not take into account that many of the industries included in the creative and cultural sector consume a lot of energy and are often extremely polluting.
Although the creative and the cultural industries have positive aspects such as their capacity to generate income, employment, and social inclusion, there are also less positive aspects. The sector faces extreme levels of demand uncertainty, monopolistic tendencies, complex labor markets, plagiarism, and theft of property rights [28].
Beyond the acknowledged benefits of creative economy and culture as an engine or a model of sustainable development or the criticisms of this assumption, there is a lack of empirically proven results [14]. It should be borne in mind that this is a sector that is difficult to measure because it involves numerous self-employed and part-time workers [37]. In addition, the creative and cultural sector, in its own denomination, includes activities with very different characteristics that involve different consumption of environmental resources, different forms of activity organization or human resources, among other aspects [38]. In view of this diversity, an intra-sectoral analysis of the different activities included in the Orange economy denomination seems appropriate.

2.3. Growth of Creative Economy and Cultural Sectors

Much research has focused on the potential of the cultural and creative economy to become the new engine of the economy after the economic slowdown following the 2008 crisis [13]. The creative and cultural economy has attracted great interest from researchers because they are considered drivers of economic growth for their value creation capacity and for their impact on innovation, resulting from the activation of cross-fertilization processes between sectors [17] and generating positive externalities in other sectors [3]. They act as catalysts for innovations taking place in other sectors and they are one of the fastest developing sectors of the world economy, generating income growth, new jobs and export revenues [14,39].
The interest in positioning the creative economy as an engine of growth has even been the subject of attention from supranational organizations, such as the United Nations Educational Scientific and Cultural Organization. They are an important instrument for regional and urban innovation policies, as well as for economic growth [7], and they represent a strategic priority sector on the European Union’s agenda [3]. Studies have suggested a strong relationship between the presence of creative industries and regional development. Creative and cultural industries are important contributors to the richest regions’ economies in Europe [17]. Data derived from several countries indicate that in many cases this sector has been growing faster than traditional sectors such as manufacturing [16]. Statistical figures show that the share of the creative economy in the GDP of the most developed countries is steadily increasing [40].
The creative economy is often presented as an antidote to low growth and crisis. The cultural and creative sectors have shown, in European countries as a whole, more resistance than the rest of the economy to the crisis onslaught [11]. In the UK, following the financial collapse of 2008, the creative and cultural sector has grew in 2015–2016 by 7.6% compared to a growth rate of 3.5% for the overall economy [41]. The creative economic industry has been shown to have a positive effect on GDP in many developing and developed countries [3,6].
Focusing on the cultural sector, the recognition of the potential for the economy opened an avalanche of research seeking to better understand the dynamics of cultural industries and how they produce economic growth. Over the past two decades, cities around the world seeking new sources of economic growth and revitalization have invested significantly in a variety of cultural economic development strategies [42,43]. Looking at the studies conducted, specifically for the United States, the results indicate that, at the national level, the cultural economy did not experience a significant decline during the recession between the years 2006 and 2009 [44]. On a regional scale, however, it can be observed that this variation was not uniform and those in which a cultural economy had grown the most in the boom period were the most affected by recession. In conclusion, there is growing scientific evidence that the impacts of cultural and creative sectors have perceptible effects on aspects related to productivity and the wealth of regions, e.g., in USA, Australia, and Europe [11].
Much work has demonstrated the benefits of the creative economy and culture on growth, employment, and income generation, but voices have also been raised with a more critical view. It should not only seek growth but also think about the kind of growth that is desired. Growth is positive but it should be noted that rising incomes fail to solve a wide range of social and economic problems, even for the wealthy. Growth per se does not lead to the improvements that society demands [45].
The existing levels of creative economic growth may appear to provide overall benefits, and it is quite clear that the opportunities and rewards of such growth are not shared equally. Banks (2018) describes several limitations of growth. First, growth is not shared with society through better wages and more stability, but instead reverberates into higher profits for those already in a dominant position. Secondly, the creative and cultural economy has not addressed environmental issues; it has been taken for granted that they are “intrinsically clean”, which is not at all proven. Third, the creative growth approach tends to reduce culture to an economic resource. Lastly, the approach to creativity and culture is not aimed at the pursuit of cultural democracy but at growth oriented to meet seemingly inexhaustible consumers demands.

3. Hypotheses, Materials, and Methods

3.1. Hypotheses

Based on the article objectives, firstly, to increase knowledge about the characteristics of the different activity blocks that constitute the Orange economy and, secondly, to assess the extent to which the Orange sector has the capacity to generate sustainable growth, we propose the following hypotheses:
Hypothesis 1 (H1).
The growth of Orange activities has been greater than the growth of the economy as a whole. The creative and cultural sector is a growth engine.
Hypothesis 2 (H2).
The Orange economy is a sector with economic sustainability. The group of companies in the Orange sector achieves higher profitability than the average of the economy and this higher profitability is maintained over time.
Hypothesis 3 (H3).
The activity branches included in the Orange sector show different dynamism levels. There are differences in growth rates between the different blocks that make up Orange sector activities.

3.2. Methodology

To analyze the sector structure at its internal level, certain variables (income, earnings, etc.) are examined for their behavior for each block. To reduce data, a factor analysis is performed and correlations between the different variables are studied for each activity block that constitutes the Orange economy. Spearman’s correlation index is used to analyze the relationship between selected variables.
To examine the evolution of the sector, an ANOVA analysis and the comparison of independent samples with unifactorial variances are performed, applying Levene’s test to determine whether equal variances can be assumed or whether the curve distribution does not allow the assumption of equal variances. Subsequently, the t-test is used for the equality of the means to determine the results significance, with a 95% confidence interval of the difference. In turn, statistics are used to measure the variables under study of companies belonging to the Orange economy (in number, percentages, and average values).

3.3. Samples and Tecnhiques

In order to carry out the various analyses, information has been extracted from the annual accounts of the companies included in the Orange economic sector. For the sector delimitation, the classification made by Rausell y Boix (2019) has been followed in which the activity codes included in the Orange economy are determined by their activity code according to National Classification of Economic Activities, CNAE-2009 at 4 digits (the two-digit CNAE codes include all the four-digit activities that fall under this grouping level). These are organized into three levels: CNAE-2009 subgroups, branches, and activities. Three subgroups are considered: creative manufacturing, cultural industries, and creative services. In turn, the last two are divided into several activity branches. The different analyses performed will show information at the subgroup and activity branch levels.
Data about enterprises were obtained from SABI®, a database containing information on the annual accounts of Spanish and Portuguese companies. SABI® collects information from companies that are obliged to file their accounts with the Mercantile Register. These firms are mainly incorporated as Private Limited or Public Limited companies. In the selection of companies, a search was made of all those belonging to the CNAE indicated and that have provided data in 2019 in the two regions considered, Valencia and Galicia. The search yielded a total of 8191 companies.
Of the total number of companies considered, 67.5% correspond to the Autonomous Community of Valencia and 32.5% to the Autonomous Community of Galicia. In terms of weight in the Orange economy, it represents 1.49% of the total number of companies in the Valencian case and 1.34% in the Galician case. Regarding an intra-sectorial analysis, in both territories the subsector with the largest number of companies in the Orange economy is creative services, which represents 64% in Galicia, while in the case of Valencia the percentage is reduced to 51.4%. As for the other two blocks—the creative manufacturing and the cultural industries—the weight by the number of companies is similar in the case of the Valencia region; however, in Galicia the number of creative manufacturing companies barely reached 8.2%. At the branch level, by the number of companies, programming stands out (20.3%), followed by creative manufacturing (20.1%), and publishing, video games and graphic arts (15%). This hierarchy is similar in the territorial areas analyzed, although in Galicia the weight of information and communication activity branch (12.5%) far exceeds that of manufacturing (8.2%) (See Figure 1 and Table A1).
In terms of the legal form of the organizations analyzed, 96.3% are incorporated as limited liability companies. Furthermore, there are no substantial differences by subgroups and branches, except in the case of radio and television, a branch in which public limited companies account for 27.4% of the total number of companies in the branch. This characterization seems to indicate that the Orange economy does not require companies to go to the capital market in search of financial resources, as corporations can do, and that, therefore, companies can cover their financial needs through shareholdings, equity generation, and loans and credit.

4. Results

To answer Hypothesis 1, the variables operating income, total assets, shareholders’ equity, income before taxes, economic profitability, and financial profitability were analyzed for each year (2000–2019). In order to reduce the variables, a factor analysis was performed. The result of the correlation matrix yielded a value of 0.508 for the Kaiser Mayer Olkin test with a significance of (p < 0.001). The variance explained by the three factors is 75.865% (see Table A2).
The first factor of the factorial analysis, which can be identified as company size, includes the variables of shareholders’ equity, assets, and operating income. These three variables explain 39.12% of the variance. The second factor is formed by the result variables, which shows that it has no clear relationship with the previous variables, and it represents 18.975%. The third factor is composed of profitability variables, both economic and financial, which indicates that their behavior is different and they are not related to the same intensity with the other variables (see Table A3).
Once the factors have been identified, the correlations between the most selected variables of each factor are analyzed: for factor 1 (size), the most representative variable is considered to be operating income; for factor 2, earnings, only this variable is included since it is a single variable; and, for factor 3, profitability, specifically financial profitability is considered since it better represents the concept of profitability as it is an indicator of the relationship between the company’s revenues and invested equity.
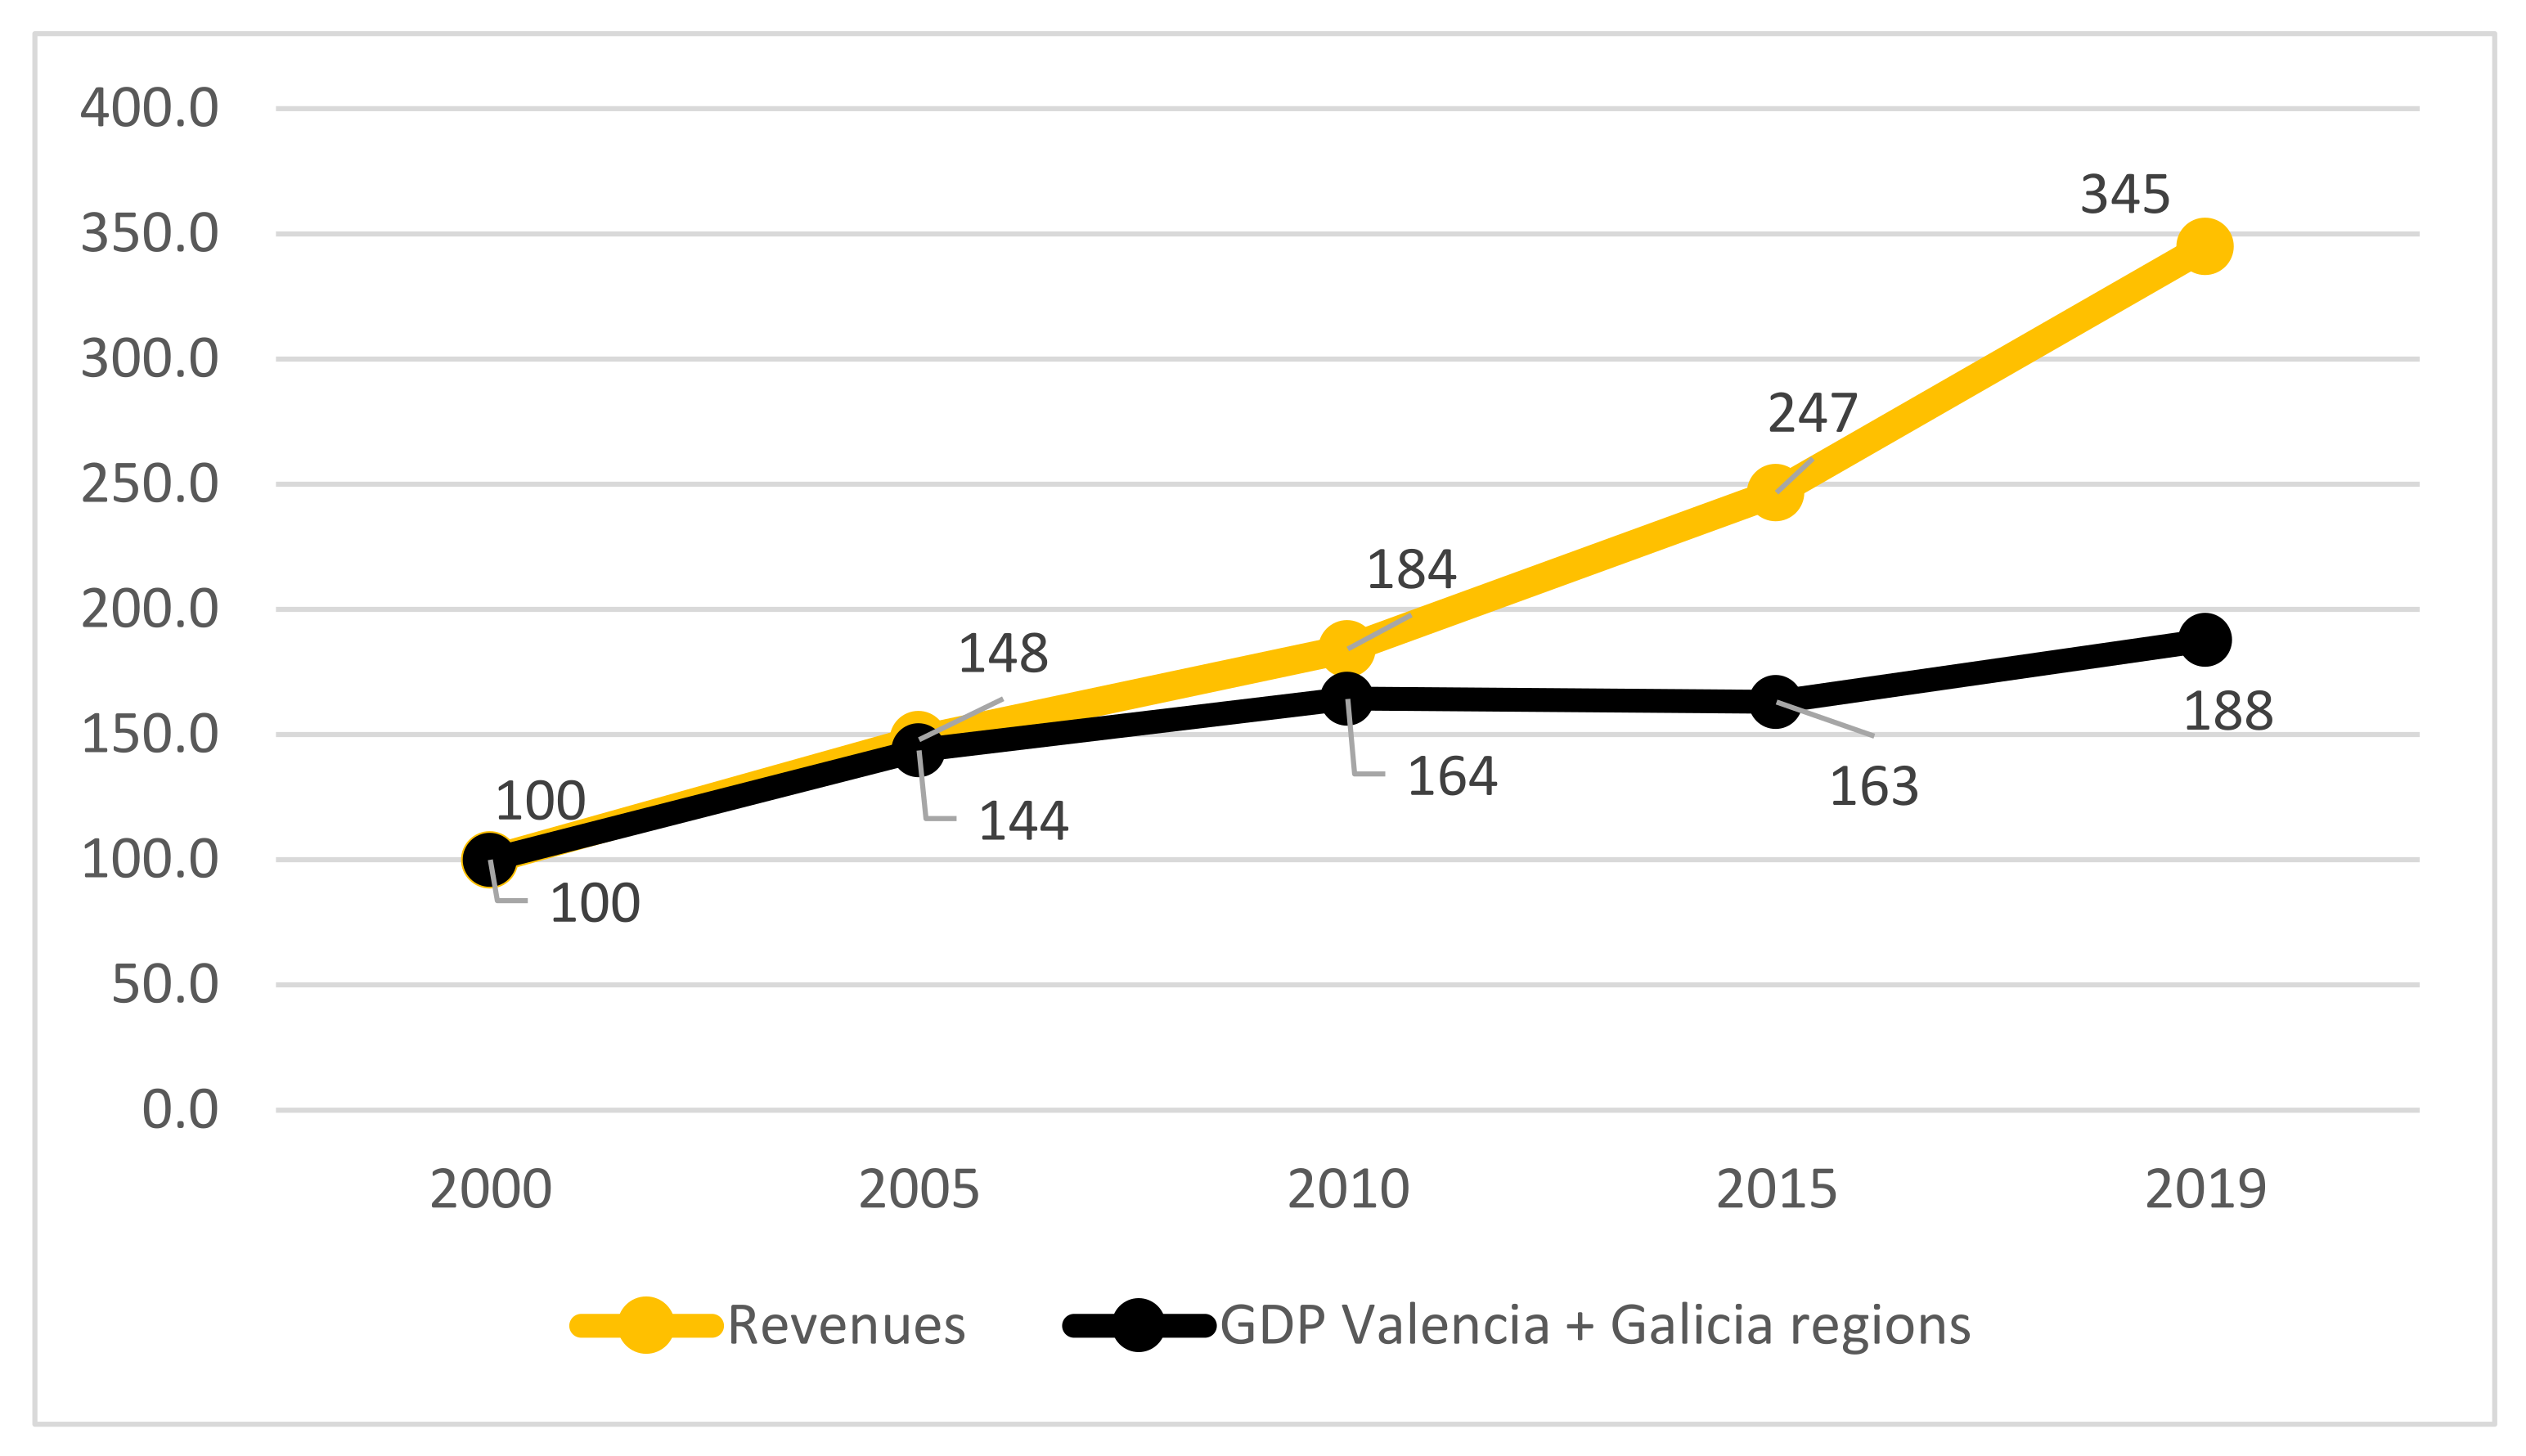
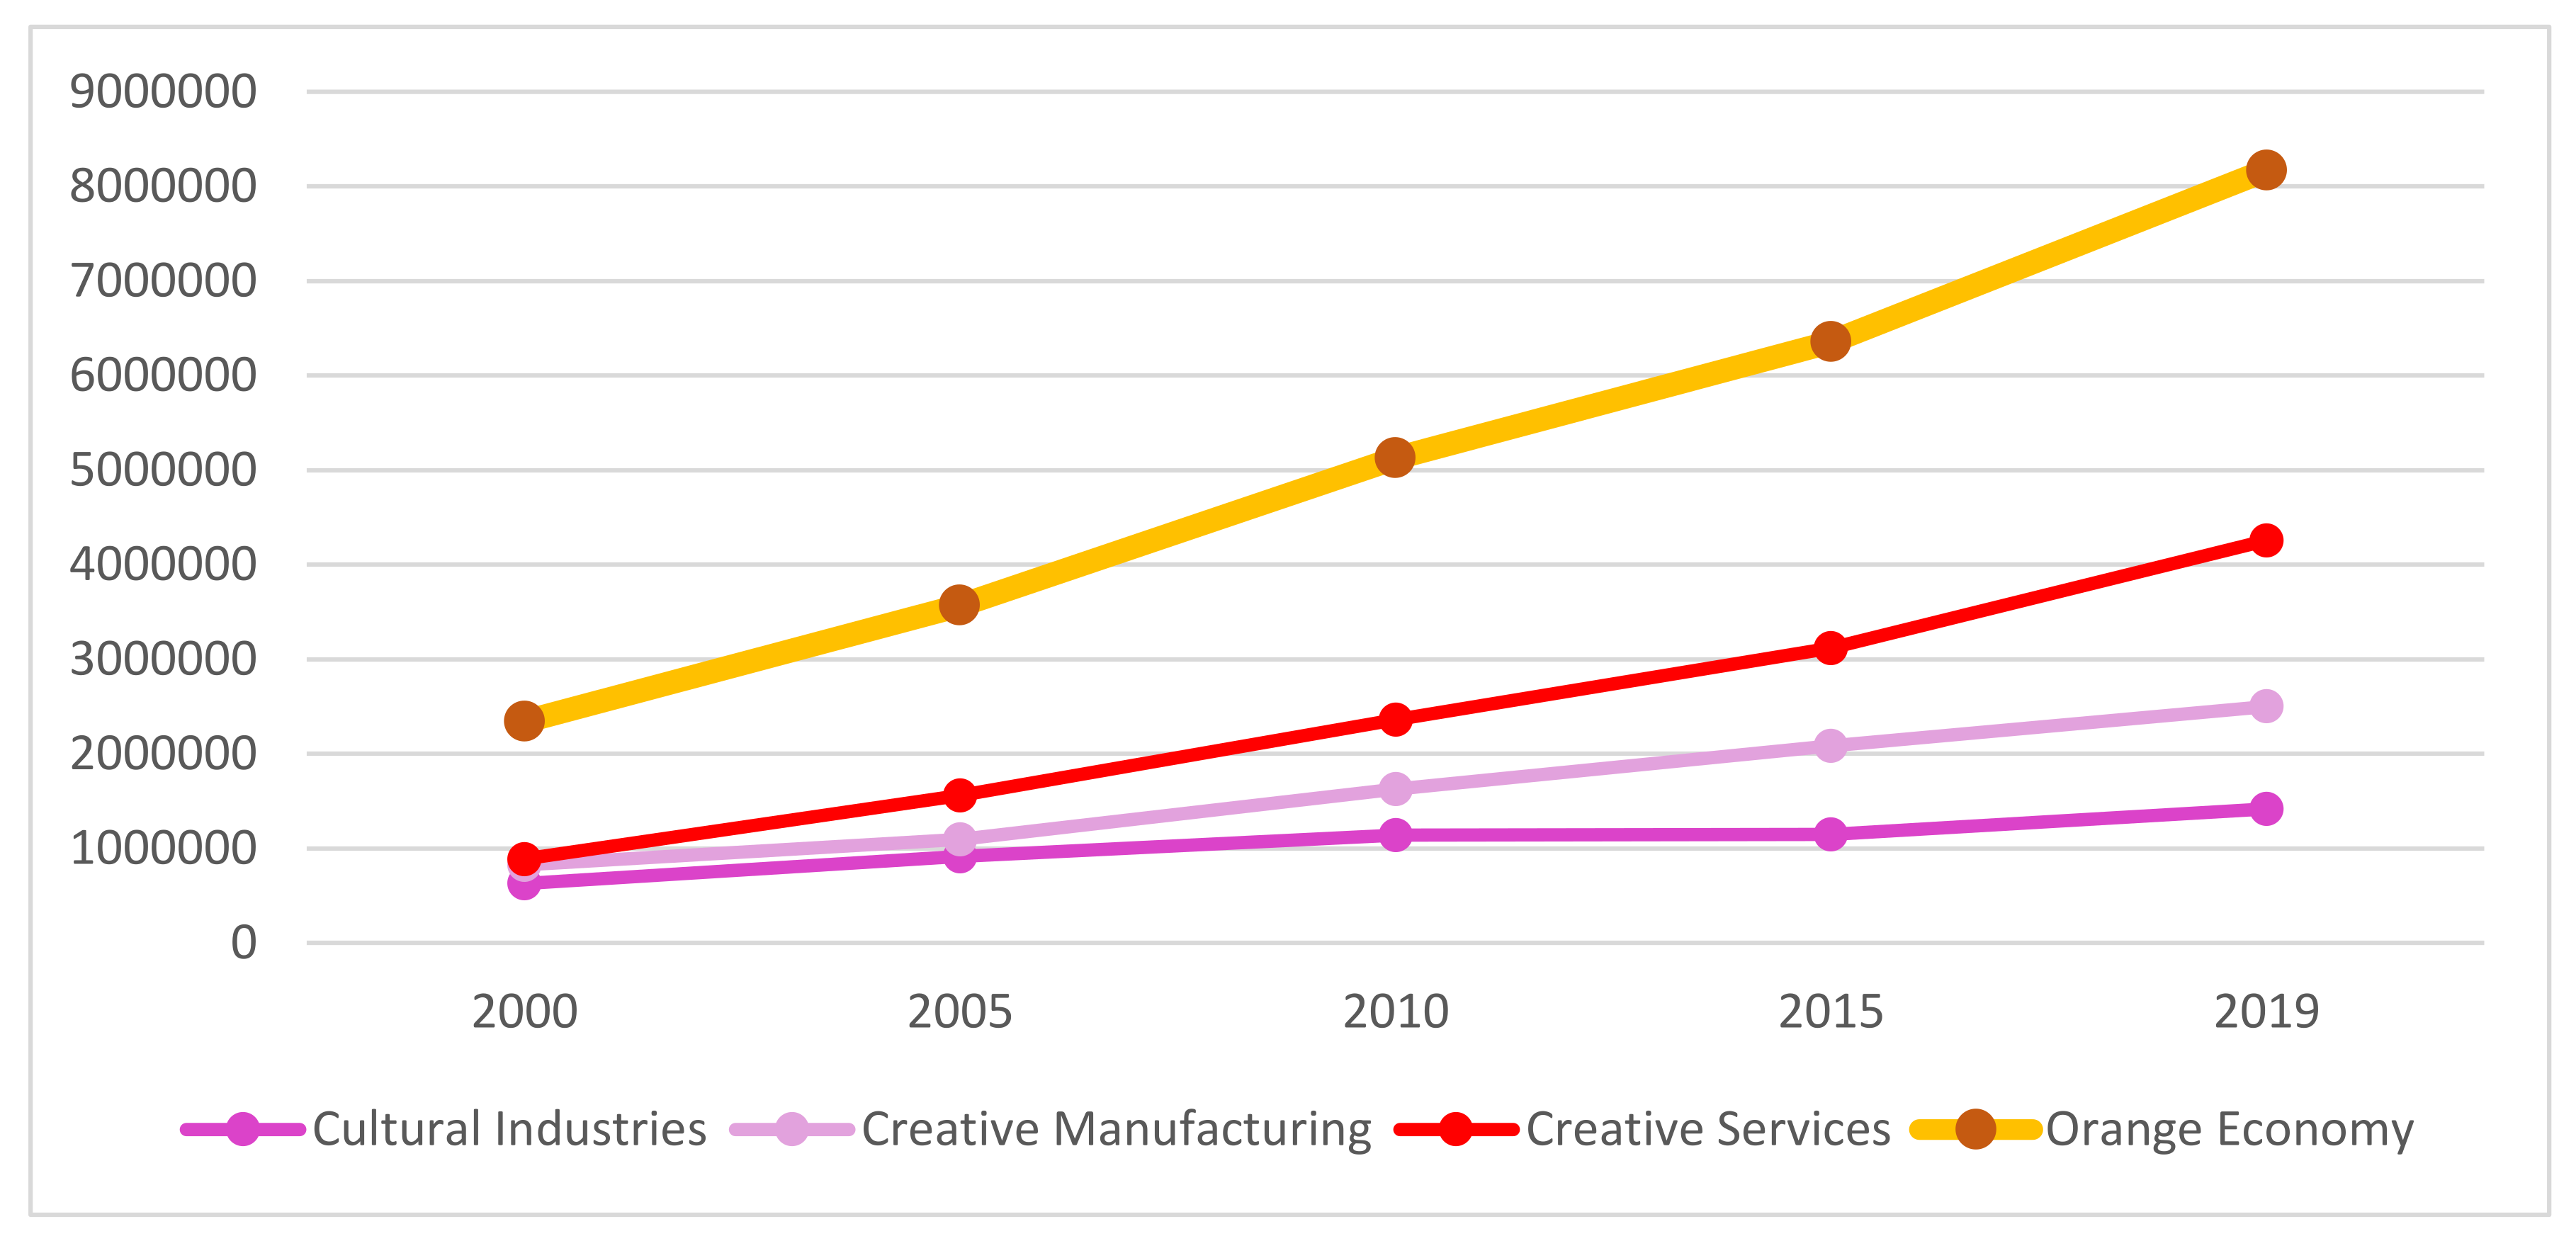
The Orange sector’s revenue growth has been much higher than the economy’s GDP. The Orange economy has experienced a significant increase for the period analyzed (2000–2019), more than triple the value at the beginning of the period. Thus, there was an increase of 344.9% in the sector’s revenue at current prices compared to a GDP growth of 87.6% in both regions (see Figure 2 and Table A4.). In terms of proportion, GDP revenues from the Orange economic sector reached 4.8% of GDP in 2019 compared to 2.6% in 2000. Another relevant figure is the turnover in Spain, which has increased by 22.1% in the period 2015–2019; an interval in which the Orange economy has risen by 39.9%. Growth occurred in all subgroups, with the creative services subgroup experiencing the largest increase in percentage terms (693.6%).
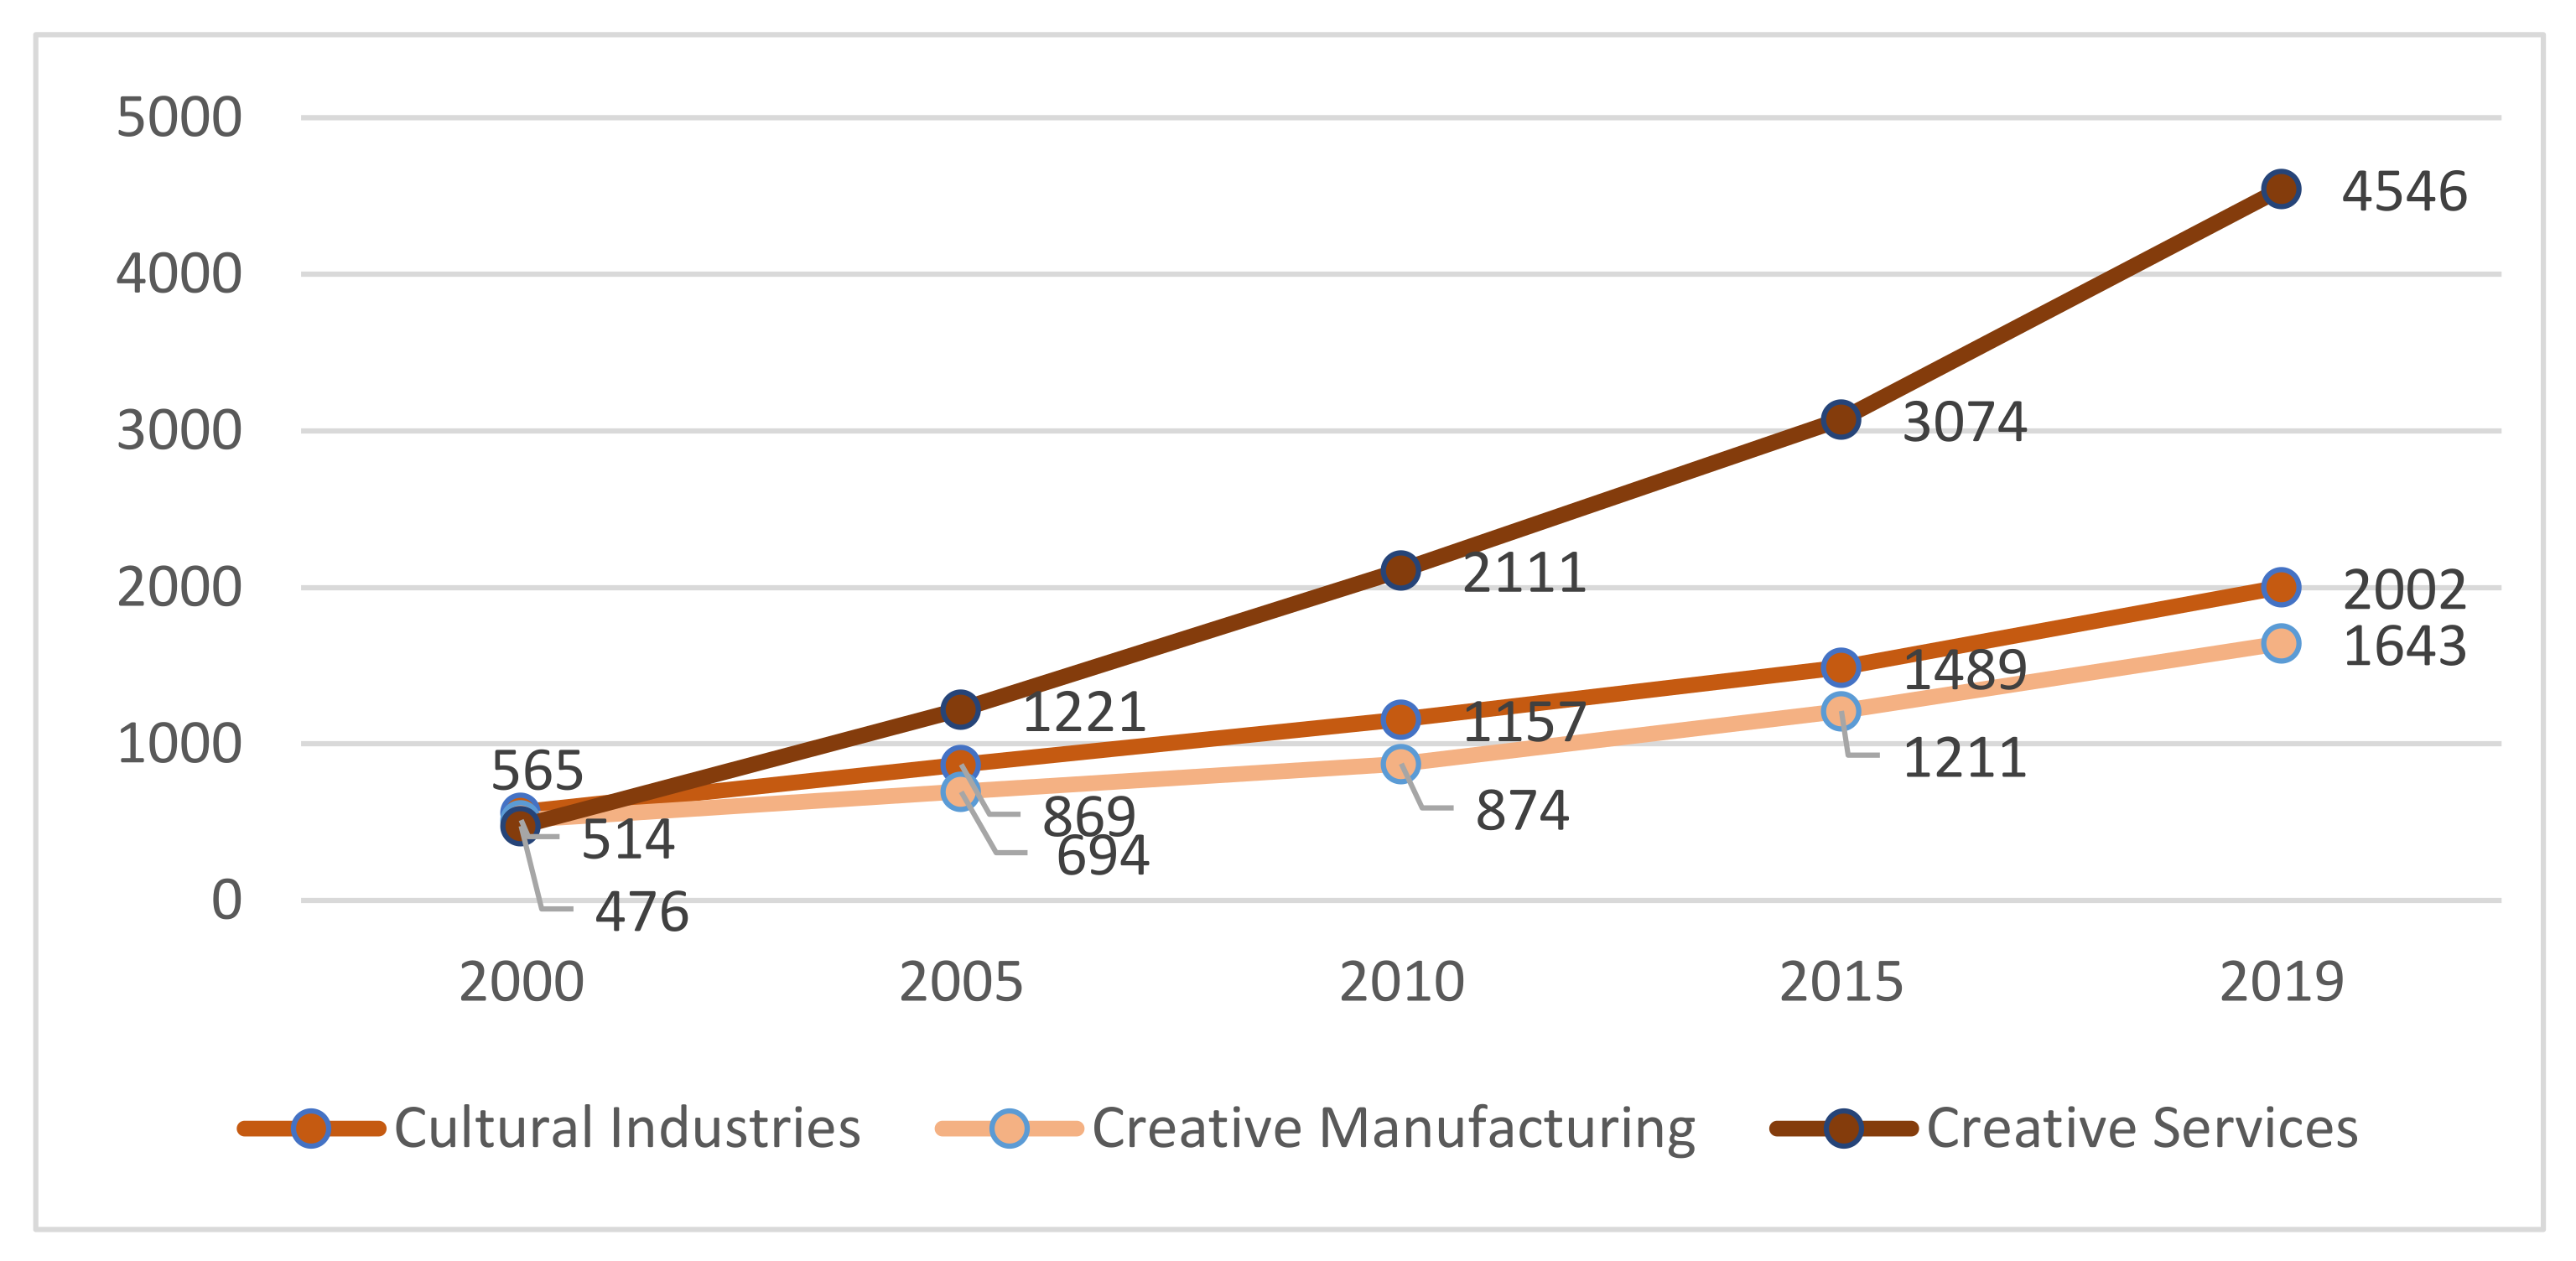
Another notable aspect is the increase in revenue and the number of companies in a period that has coincided with one of the biggest crises in the Spanish economy (spanning 2008 to 2014, when after several years of decline the annual GDP growth rate reached 1.4%.), which reveals the attractiveness of the Orange economy and its resilience, (Figure 3 and Table A5).
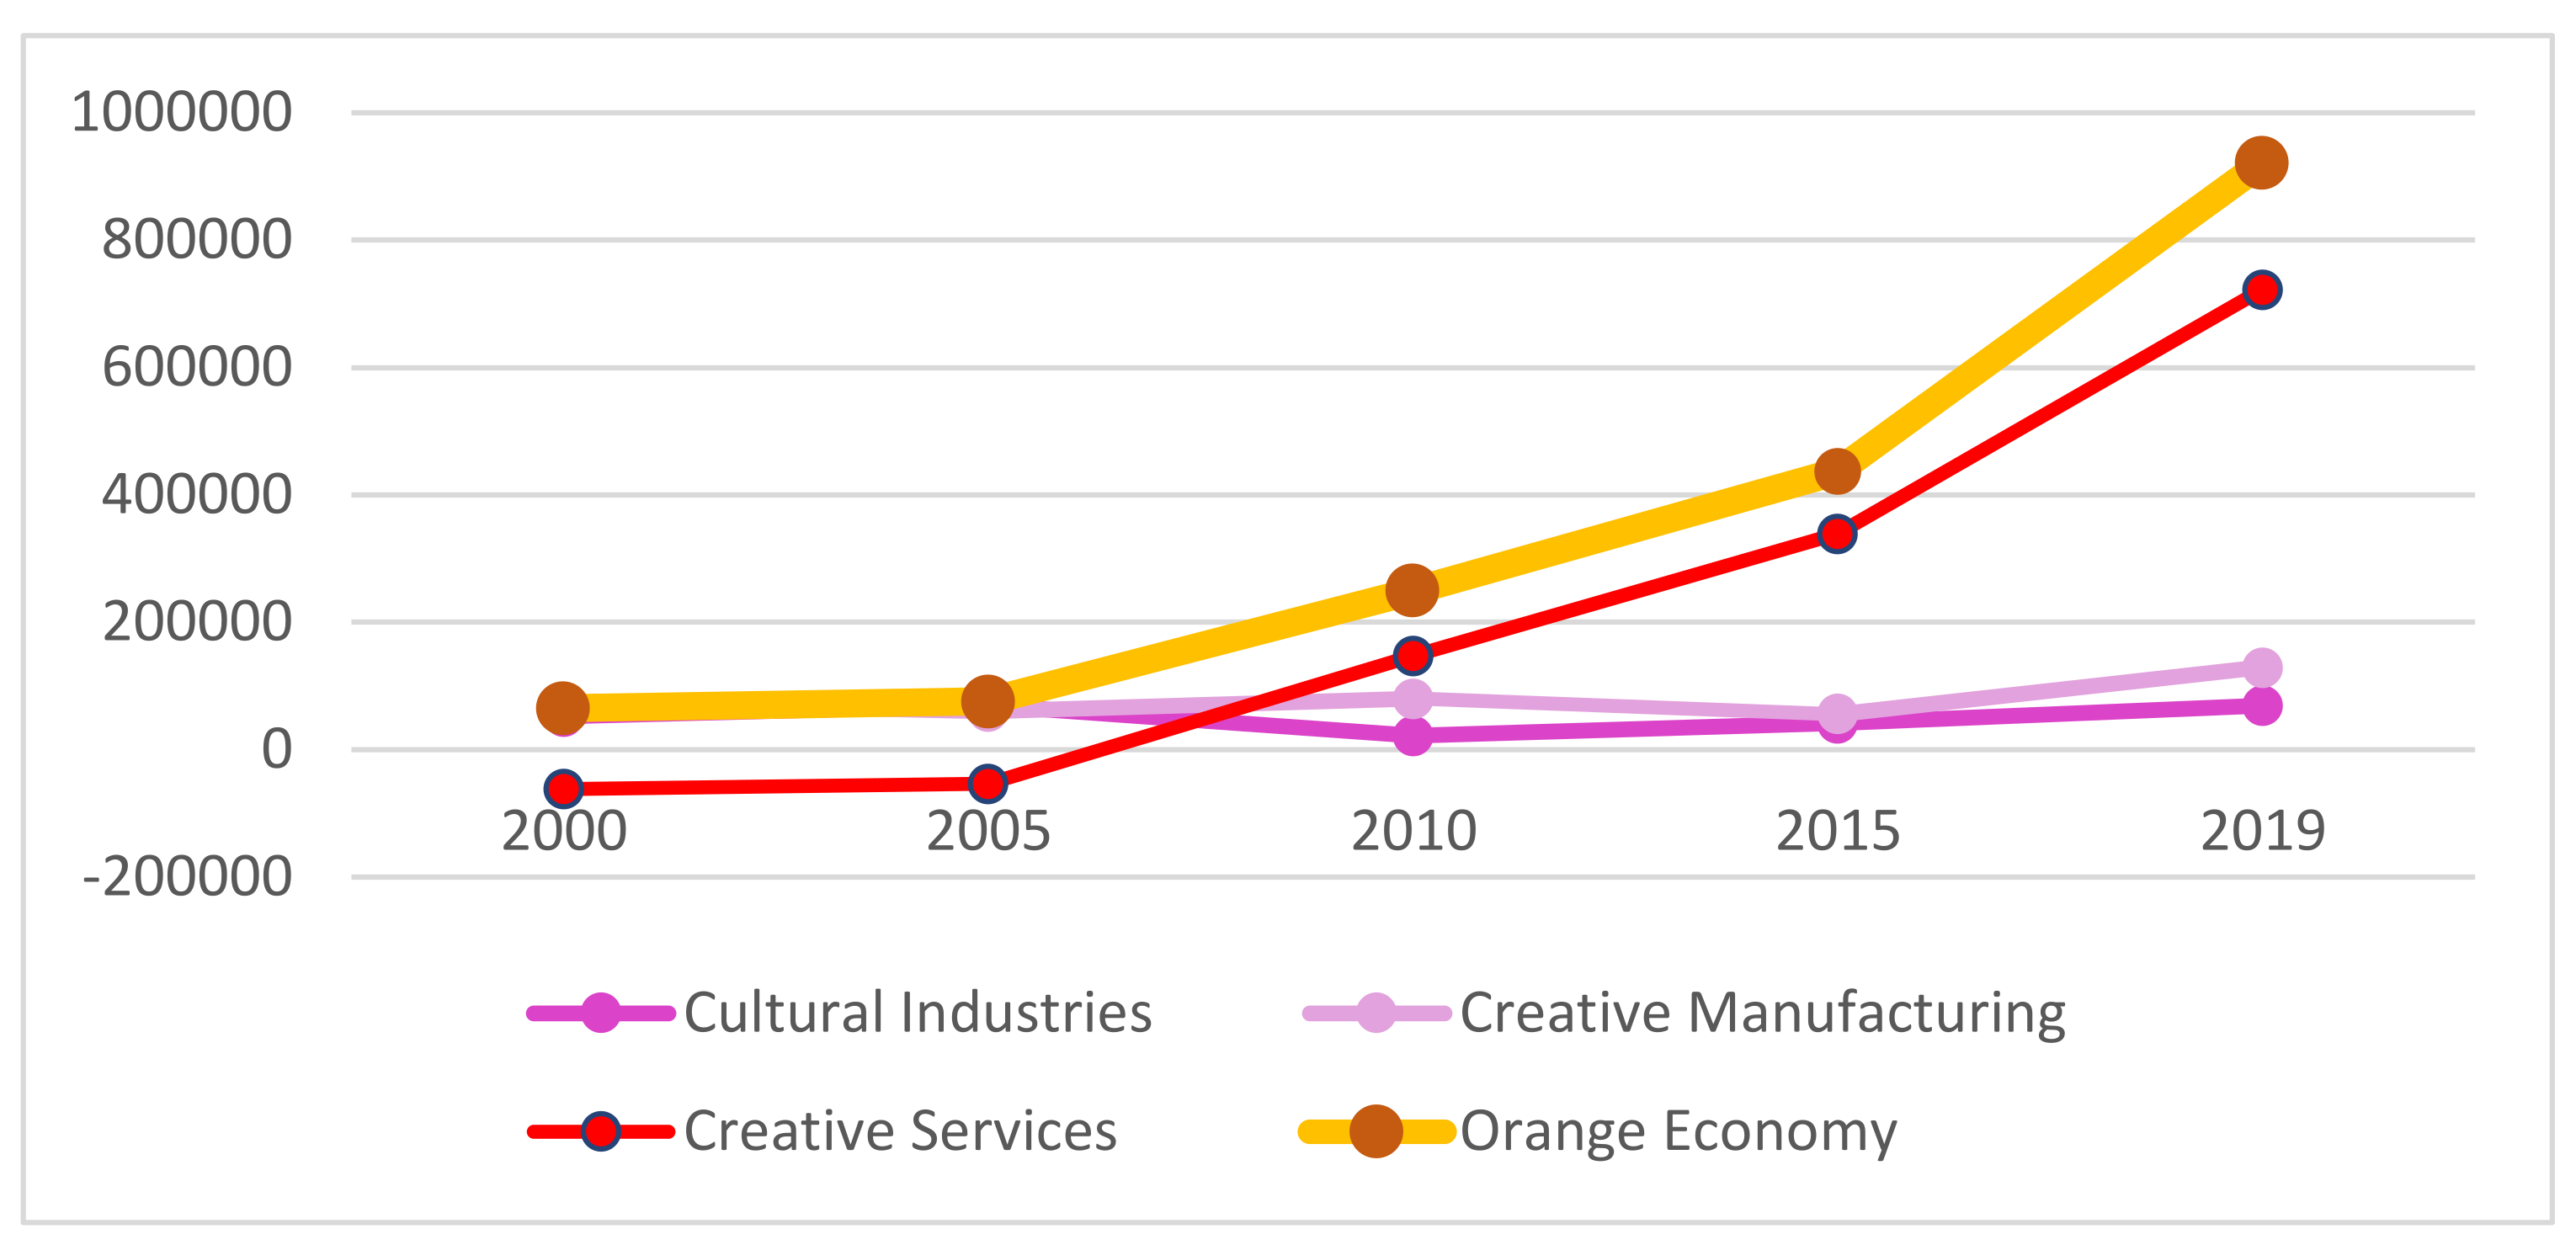
In terms of earnings before taxes (EBT) in current terms, the Orange economic sector has increased across 19 years more than 13 times their initial value (1316.2%), from €65,083 thousands in 2000 to €921,709 thousands in 2009 (see Table A6), a fact that evidences the good economic health of the sector. The EBTs of the Orange economy have been beneficial for society. Companies that obtain good profitability pay higher corporate taxes. If we consider that the tax rate is 25%, based on the data, the estimated collection of the State Agency of Tax Administration (AEAT) for corporations in 2019 will amount to €230,427.3 thousand. As for VAT, with a general tax rate of 21%, the VAT charged is estimated at €293,456 thousand.
In the analysis of the sector’s growth, it was considered appropriate to study the evolution of the correlations between the selected variables, measured by the Spearman coefficient (Table A7). For this purpose, the years 2005 (before the crisis), 2010 (during the crisis period), and 2019 (before the crisis caused by the COVID-19 pandemic) were considered. In the case of the correlation between revenues and earnings, the index is similar over time, although it decreases during the crisis period. As for the variable earnings and financial profitability, the index shows a moderate and unequal relationship over time, with a very weak relationship in the crisis period. In the case of financial profitability, measured by the ratio between earnings and shareholders’ equity, the low correlation between earnings and profitability can only be explained by a low relationship between earnings and shareholders’ equity. The decrease in the correlation between earnings and profitability in 2010 compared to 2005 is explained by a much larger drop in earnings than in shareholders’ equity. The higher ratio in 2019 is explained by a higher growth in earnings than in shareholders’ equity. Although the profitability of the sector is related to the following hypothesis, it has been considered appropriate to include it in this section, since the objective is to analyze its relationship with the variable revenues and earnings. The correlations between the different blocks of the Orange economy have also been analyzed (see Table A8).
It can be concluded that the first of the hypotheses is fulfilled, since the high growth of the Orange economy has been proven, with rates—even in periods of crisis—much higher than those of the Spanish economy as a whole.
Hypothesis 2. Profitability has been analyzed on the basis of the two traditional ratios: economic profitability and financial profitability. Economic profitability is determined from the ratio of earnings before taxes to total assets. Financial profitability is determined from the ratio of earnings before taxes to equity.
We understand that an activity will be economically sustainable when it is durable over time. For this, it is not enough for the level of income to increase or to be maintained in real terms. In addition, the earnings must be positive, although not necessarily during each of the years considered. The two ratios mentioned, economic and financial profitability, are also indicators of sustainability. The maintenance of an activity over time and, therefore, its capacity to generate employment in a sustainable manner in a free-market context requires that the capital invested in this activity achieves an attractive return on capital. If returns are positive and higher than in other sectors, capital flows into the activity, increasing income and employment.
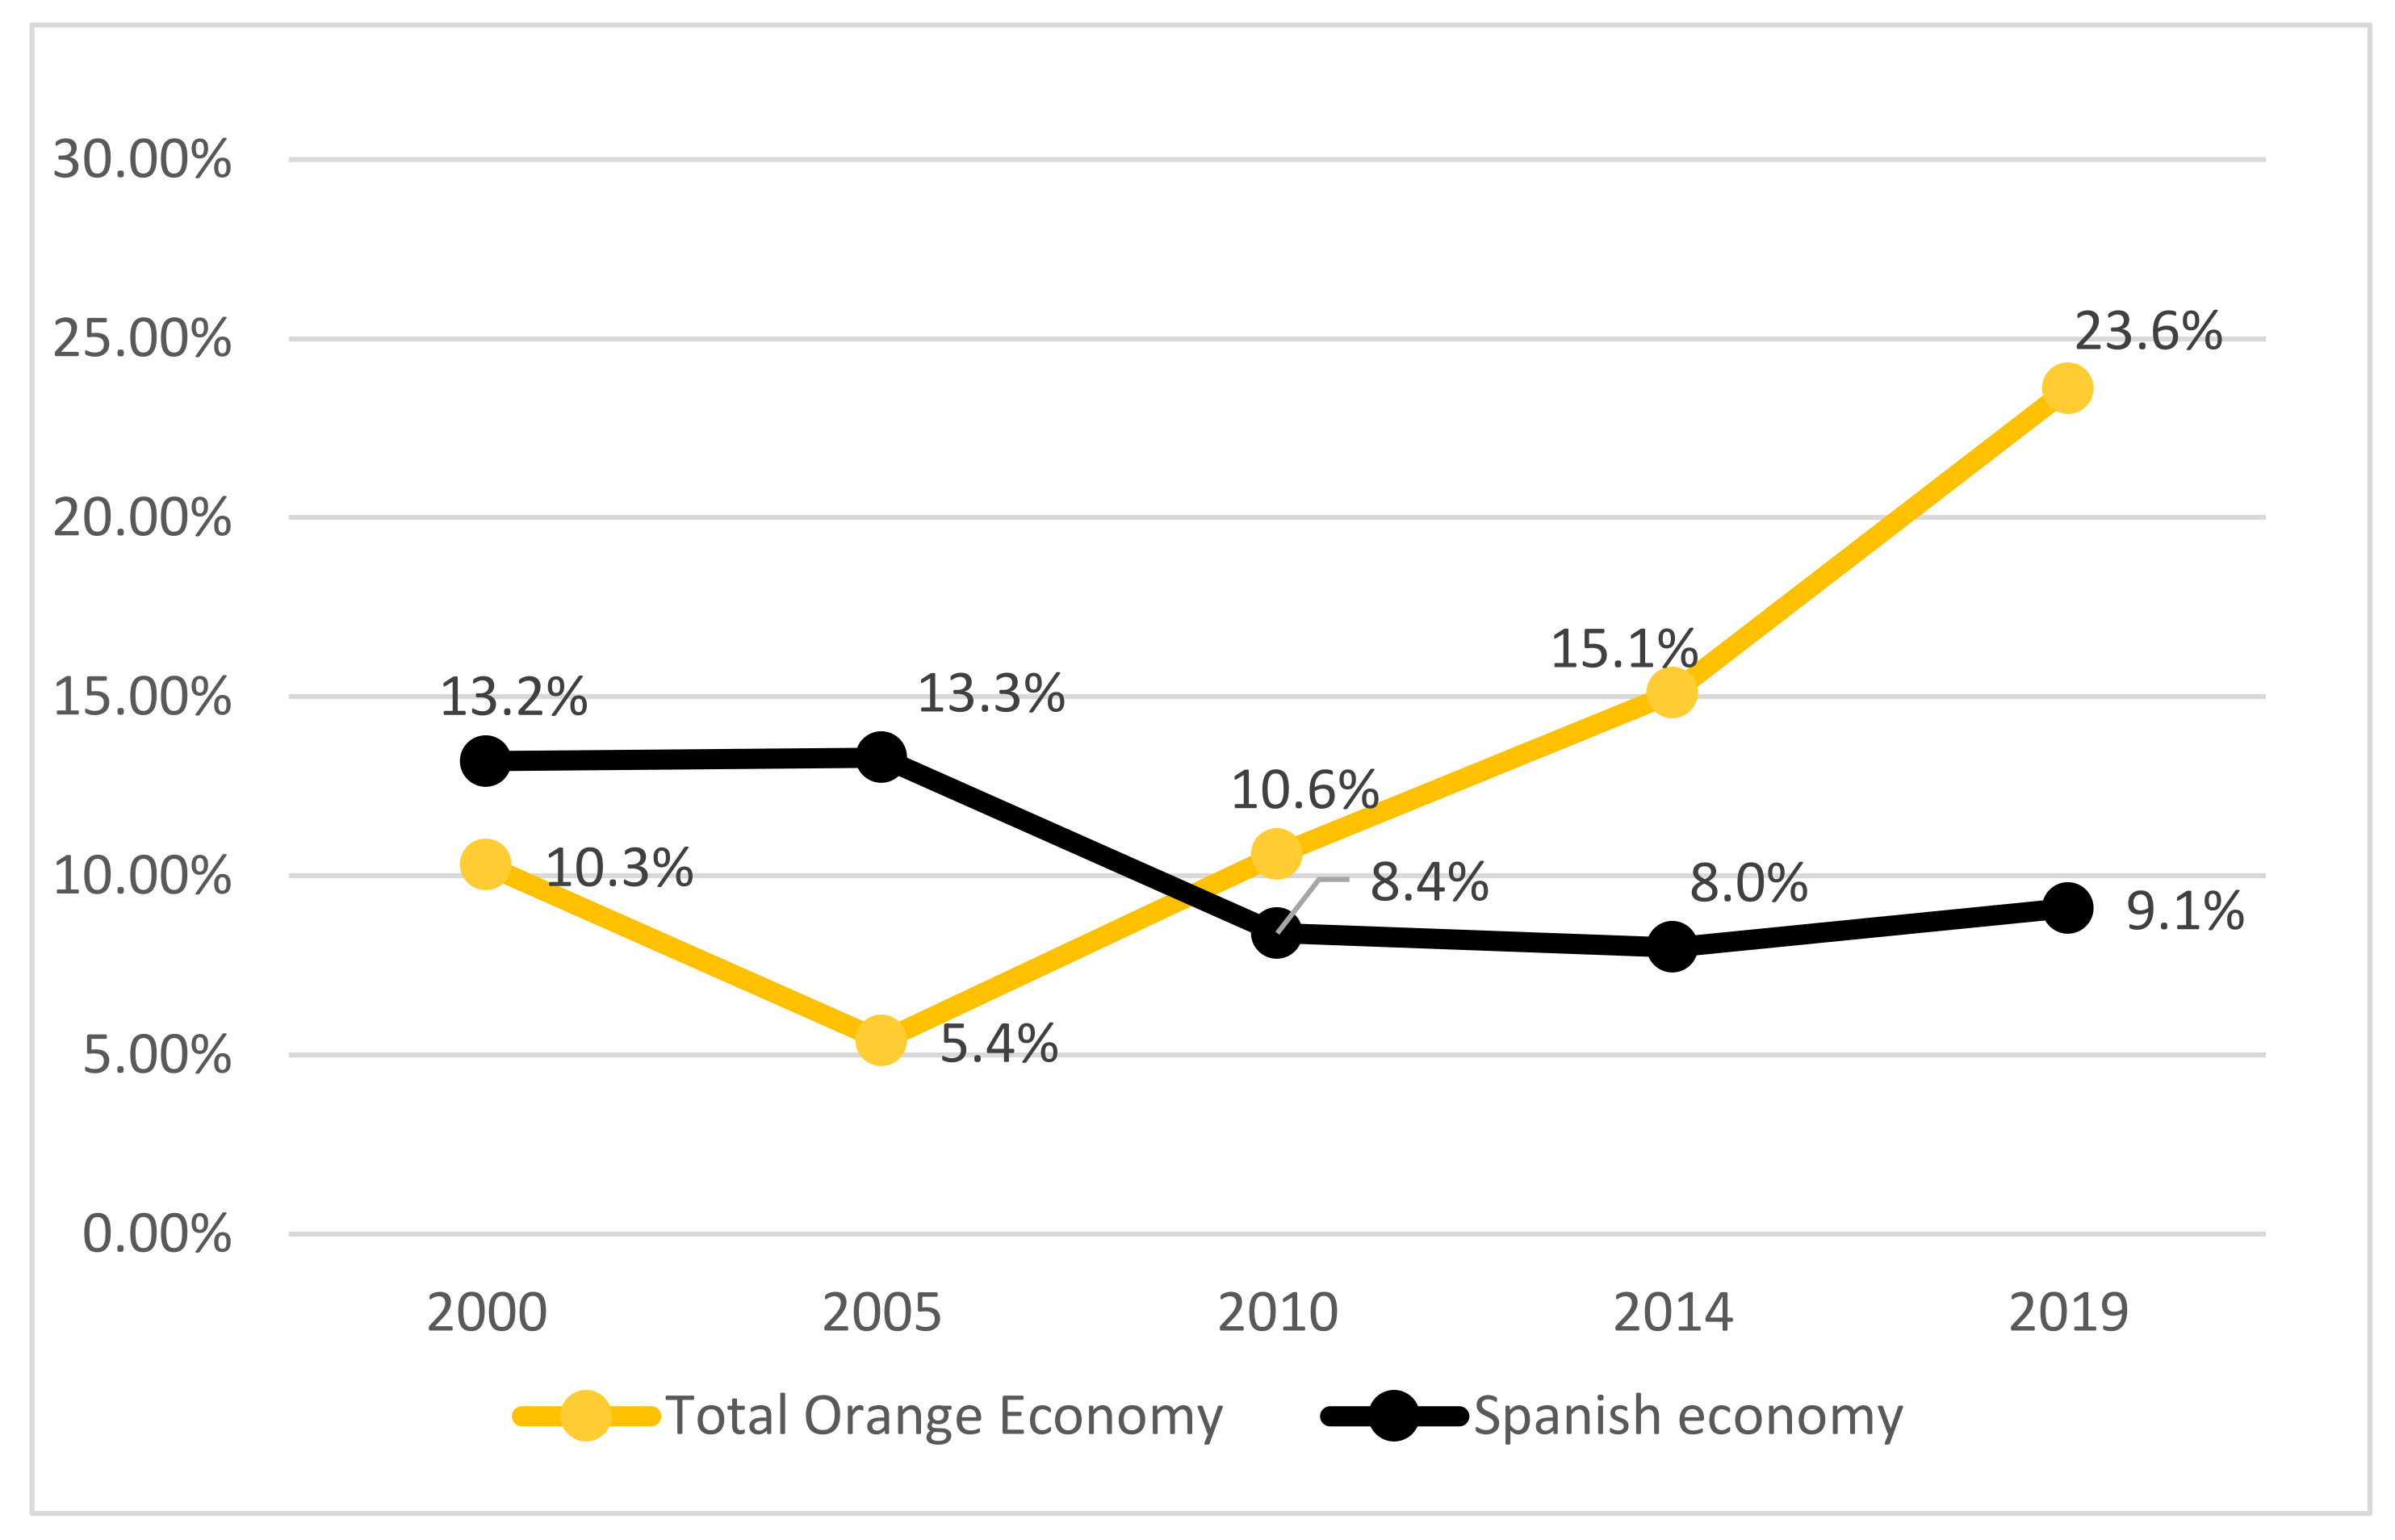
A key indicator of economic sustainability is economic profitability over time, which is shown in Figure 4 and 
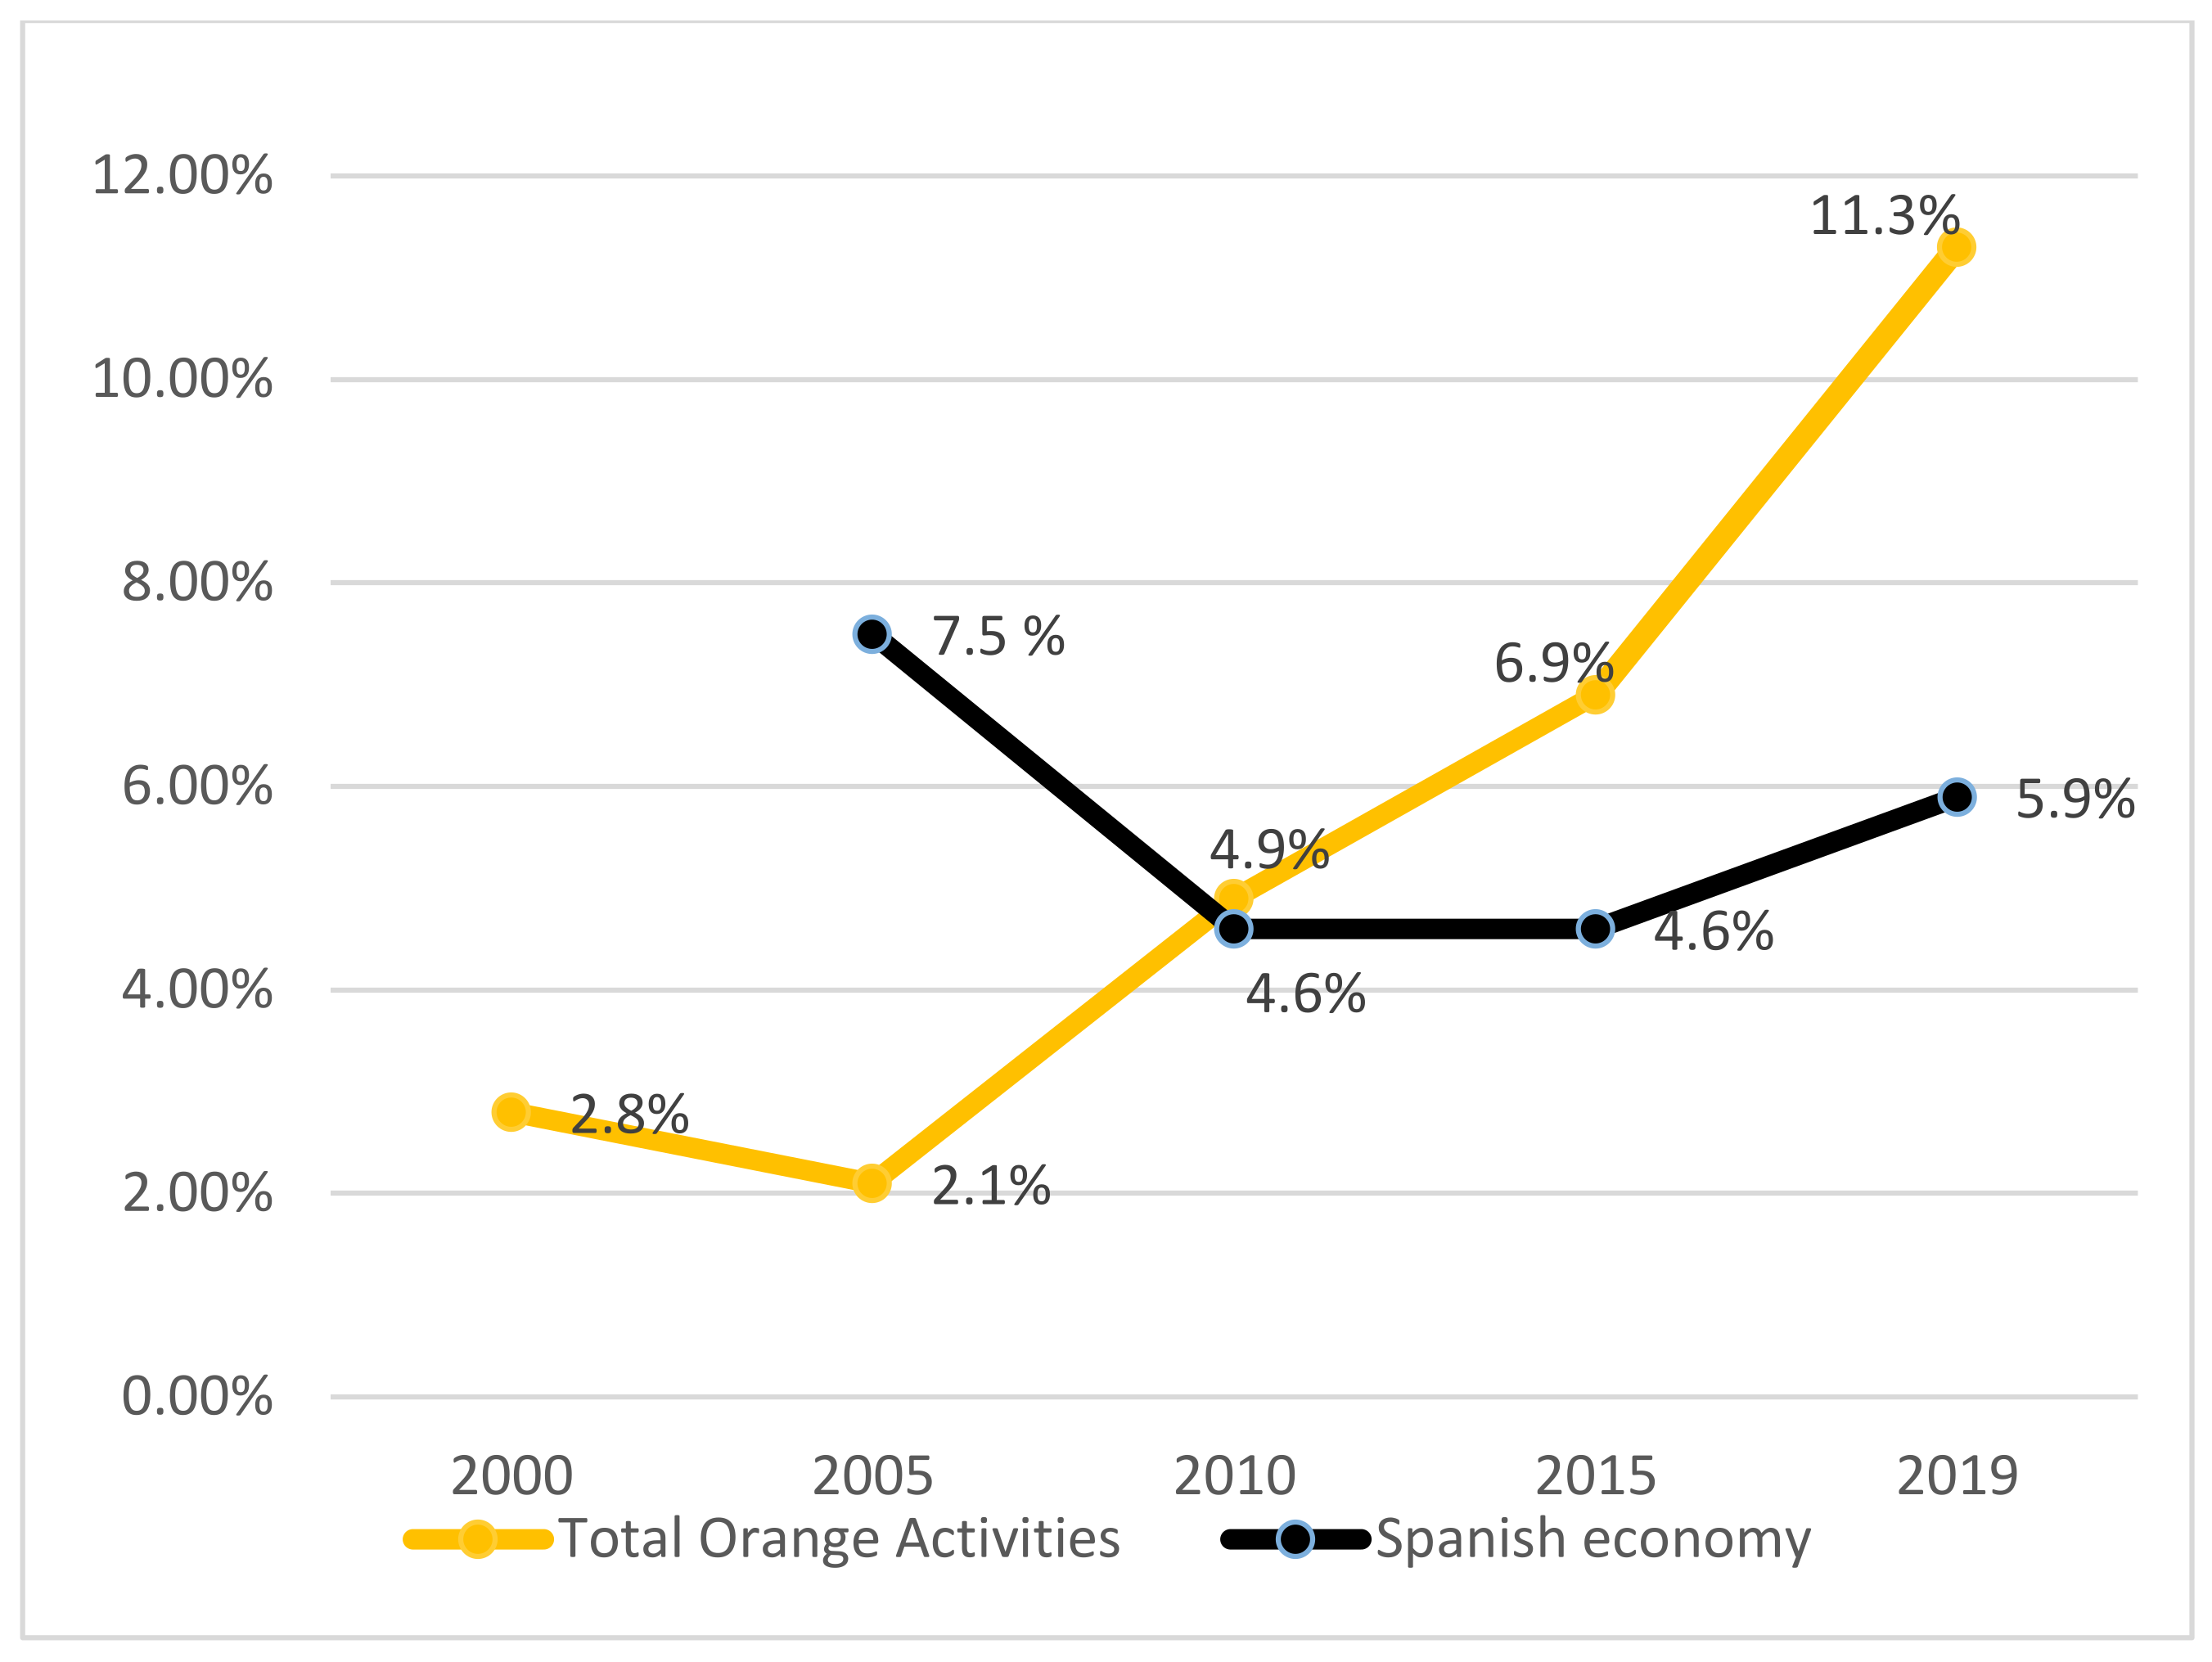
Table A9. The first conclusion that can be drawn is that the economic profitability of the Orange economic sector is higher than the general company’s profitability in Spain. In fact, there is an increase in the differences in each year of the 2000–2019 period, up to 11.3% compared to the 5.9% on average for the country.
If we look at the evolution of economic profitability, we can see that before the crisis, the profitability of the Orange sector was lower than that of the Spanish economy as a whole, but this behavior has changed since the crisis, as the economic profitability ratio of the Orange sector is much higher than that of the Spanish economy as a whole.
Financial profitability, in terms of evolution, shows a behavior similar to that of economic profitability. Before the crisis, the ratio was lower than that of the economy as a whole, and then it reversed. In this case, as in the case of economic profitability, which measures the proportion that EBT represents of the company’s level of equity; if we analyze the equity, it can be seen in Figure 5 and Table A10 that during the period 2000–2019 it multiplied more than 5 times, which again demonstrates the strength of the sector.
It can be concluded that the second hypothesis is fulfilled by demonstrating that since 2010 the economic and financial profitability of the Orange economy has substantially exceeded that obtained by the Spanish economy.
Hypothesis 3. It is noteworthy that for the period 2000–2019, operating revenues of the different subgroups and branches of the Orange economy have grown above the GDP growth at current prices, in all cases except for radio and television, which have suffered a decrease. The subgroup with the highest growth rate is creative services (693.6%). At the branch level, design, photography, and translation (3082.6%); artistic creation and cultural activities (1222.2%); and research and development services (1017.6%) stand out. Another noteworthy block is programming, which with a growth rate of 924.7%, ranks second in terms of turnover (see Table A4). The increase in revenue from the Orange economy is related to the sharp increase in companies from 1550 organizations in 2000 to 8191 in 2019. This represents an increase of 426.8% (Table A5), a general increase in all subgroups and all branches. This is evidence of the sector’s strength. There is an almost 100% correlation between turnover and the number of companies generated in all branches. In fact, the number of companies also grows in the branches with the highest turnover, such as creative manufacturing (319.6%), programming (1019%), and multimedia (772.7%). In addition, the spectacular growth of companies in education (2400%), architecture (1363.3%) and artistic creation (1321.9%) activity branches is noteworthy, which shows the absence of barriers to entry, except in the radio and television branch, where corporations have a greater presence (27.4%) and a negative correlation has been observed between turnover and company creation.
Table A11 shows the significance level of revenue by activity branches, obtained after applying a unifactorial variance analysis and Levene’s test for the most representative activity branches of the Orange economy. Levene’s test allows determining whether or not equal variances were assumed in the distribution of the compared data. The earnings show that the creative manufacturing branch has generated the most revenue in a very significant way sig < 0.001 (***) when compared to the other branches, except when compared to design and photography, which is the second with the highest average revenue.
If we talk about earnings in 2019, in this branch, the average earnings per company are 8.63 higher than the earnings per company for the sector as a whole. In the research services activity branch, the figure is also very high but somewhat lower, 7.56 times. Once again, the radio and television activity branch stands out in a negative sense, with losses amounting to 9.2 times the sectoral average. It should be taken into account that these activities are either public entities with the objective of providing a social service or they receive subsidies from the public sector. The case in culture-related education, with only 1.9% of the sectoral average, its average revenue amounted to 19% in 2019. (See Table A6)
An earnings comparison with revenue shows that the design, photography, and translation activity branch—in fourth place of the sector’s revenue (8.2%)—accounts for 47.8% of the sector’s total earnings. On the other hand, for the manufacturing activity branch, the behavior is reversed, with 45% of operating revenues and 14.5% of EBT. Programming, on the other hand, with 14.3% compared to an initial 10.2%, shows a similar proportion. Also noteworthy are the research services activity branch, with 16.1% of the earnings, and information and communication, which reached 12.6%.
If we analyze the earnings evolution, the high growth obtained by the design and photography activity branch is striking, which has gone from a value of €608 thousand in 2000 to €440,448 thousand in 2019. The initial value is multiplied by a little more than 724 times in 2019. In addition, the dynamism of the programming activity branch should also be noted, with earnings increasing from €5160 thousands in 2000 to €93,817 thousands in 2019, (Figure 6 and Table A6). Activities such as those carried out by the information and communication and research services activity branches, despite not being the most important in terms of revenue, have improved significantly, with growth rates of 1175% and 27,032.4%, respectively.
In terms of total assets, the analyses reveal that the branch requiring the most assets is creative manufacturing, reaching 30.6% of total assets in 2019. Other activities with high proportions are those related to: artistic creation (13.7% of the total) and programming (12.7% of the total). On the contrary, the education for culture activity branch requires few assets in relation to the sector average, which is not contradictory with having been the area with the highest growth in assets during the period 2000–2019, achieving a growth rate of 3900%. Design and photography again expresses its dynamism, with a 2715% growth in assets during this period. In similar terms, programming (1464.8%) and research services (1668.6%) activity branches show a similar growth in assets, with an increase of 249.2% in 19 years, which is indicative of an increase in investment in this sector (Figure 7 and, Table A12).
Additionally outstanding is the performance of the research and development services activity branch, with 22.9% of economic profitability, double the sector average and four times the national average. Its average earnings before tax has increased by 2070.6%, and that it has gone from profits of €546 thousand in 2000 to €148,143 thousand in 2019—the good performance of this branch is evident. However, its revenue over the total of the sector accounts for 2.8%, which places it in seventh place in this section. Information and communication also deserves a mention in this section, since with 18.7% profitability it is the third most profitable branch. Moreover, its growth in earnings before taxes has increased by 1175.5% over the last 19 years. On a negative note, it is worth mentioning the poor economic profitability of radio and television, as it is a low-yield sector with a need for high assets. The case of artistic creation is similar, with a low profitability of 0.7%, as it has an increase in assets that is much higher than EBT. Finally, it is worth noting that the education related to culture activity branch, without requiring many assets, has a return clearly below the average for the sector (Table A9).
The application of unifactorial variance method and Levene’s test make it possible to obtain the degree of significance in this section. Thus, Table A13 shows that the creative manufacturing activity branch has the highest level of assets in a significant way, but this is to the detriment of its economic profitability since this ratio does not show any significance with respect to the other blocks. The profitability of the design and photography activity branch is significant but only compared to editing, videogame editing, and graphic arts (third in terms of revenue). Moreover, even though it is the most profitable, it is not statistically significantly more profitable than the other activities. The comparison of economic profitability between the other branches does not allow us to conclude that the returns are statistically significant. Another noteworthy fact is that of the creative manufacturing and editing, videogame editing, and graphic arts, which occupy first and third place in turnover, respectively, and despite having financial profitability below the sector average, they have been higher than the Spanish average.
To determine the significance of financial profitability, it is necessary to apply variances with Levene’s test. In general terms, manufacturing repeats as the activity branch with the highest equity, and it is significant with respect to programming and to editing, videogame editing, and graphic arts (Table A14). In any case, it is not as significant as total assets. There are not statistically relevant differences in financial profitability; not even the design, photography, and translation branch, which had significant comparisons in its favor, shows its best financial ratios in statistical significance.
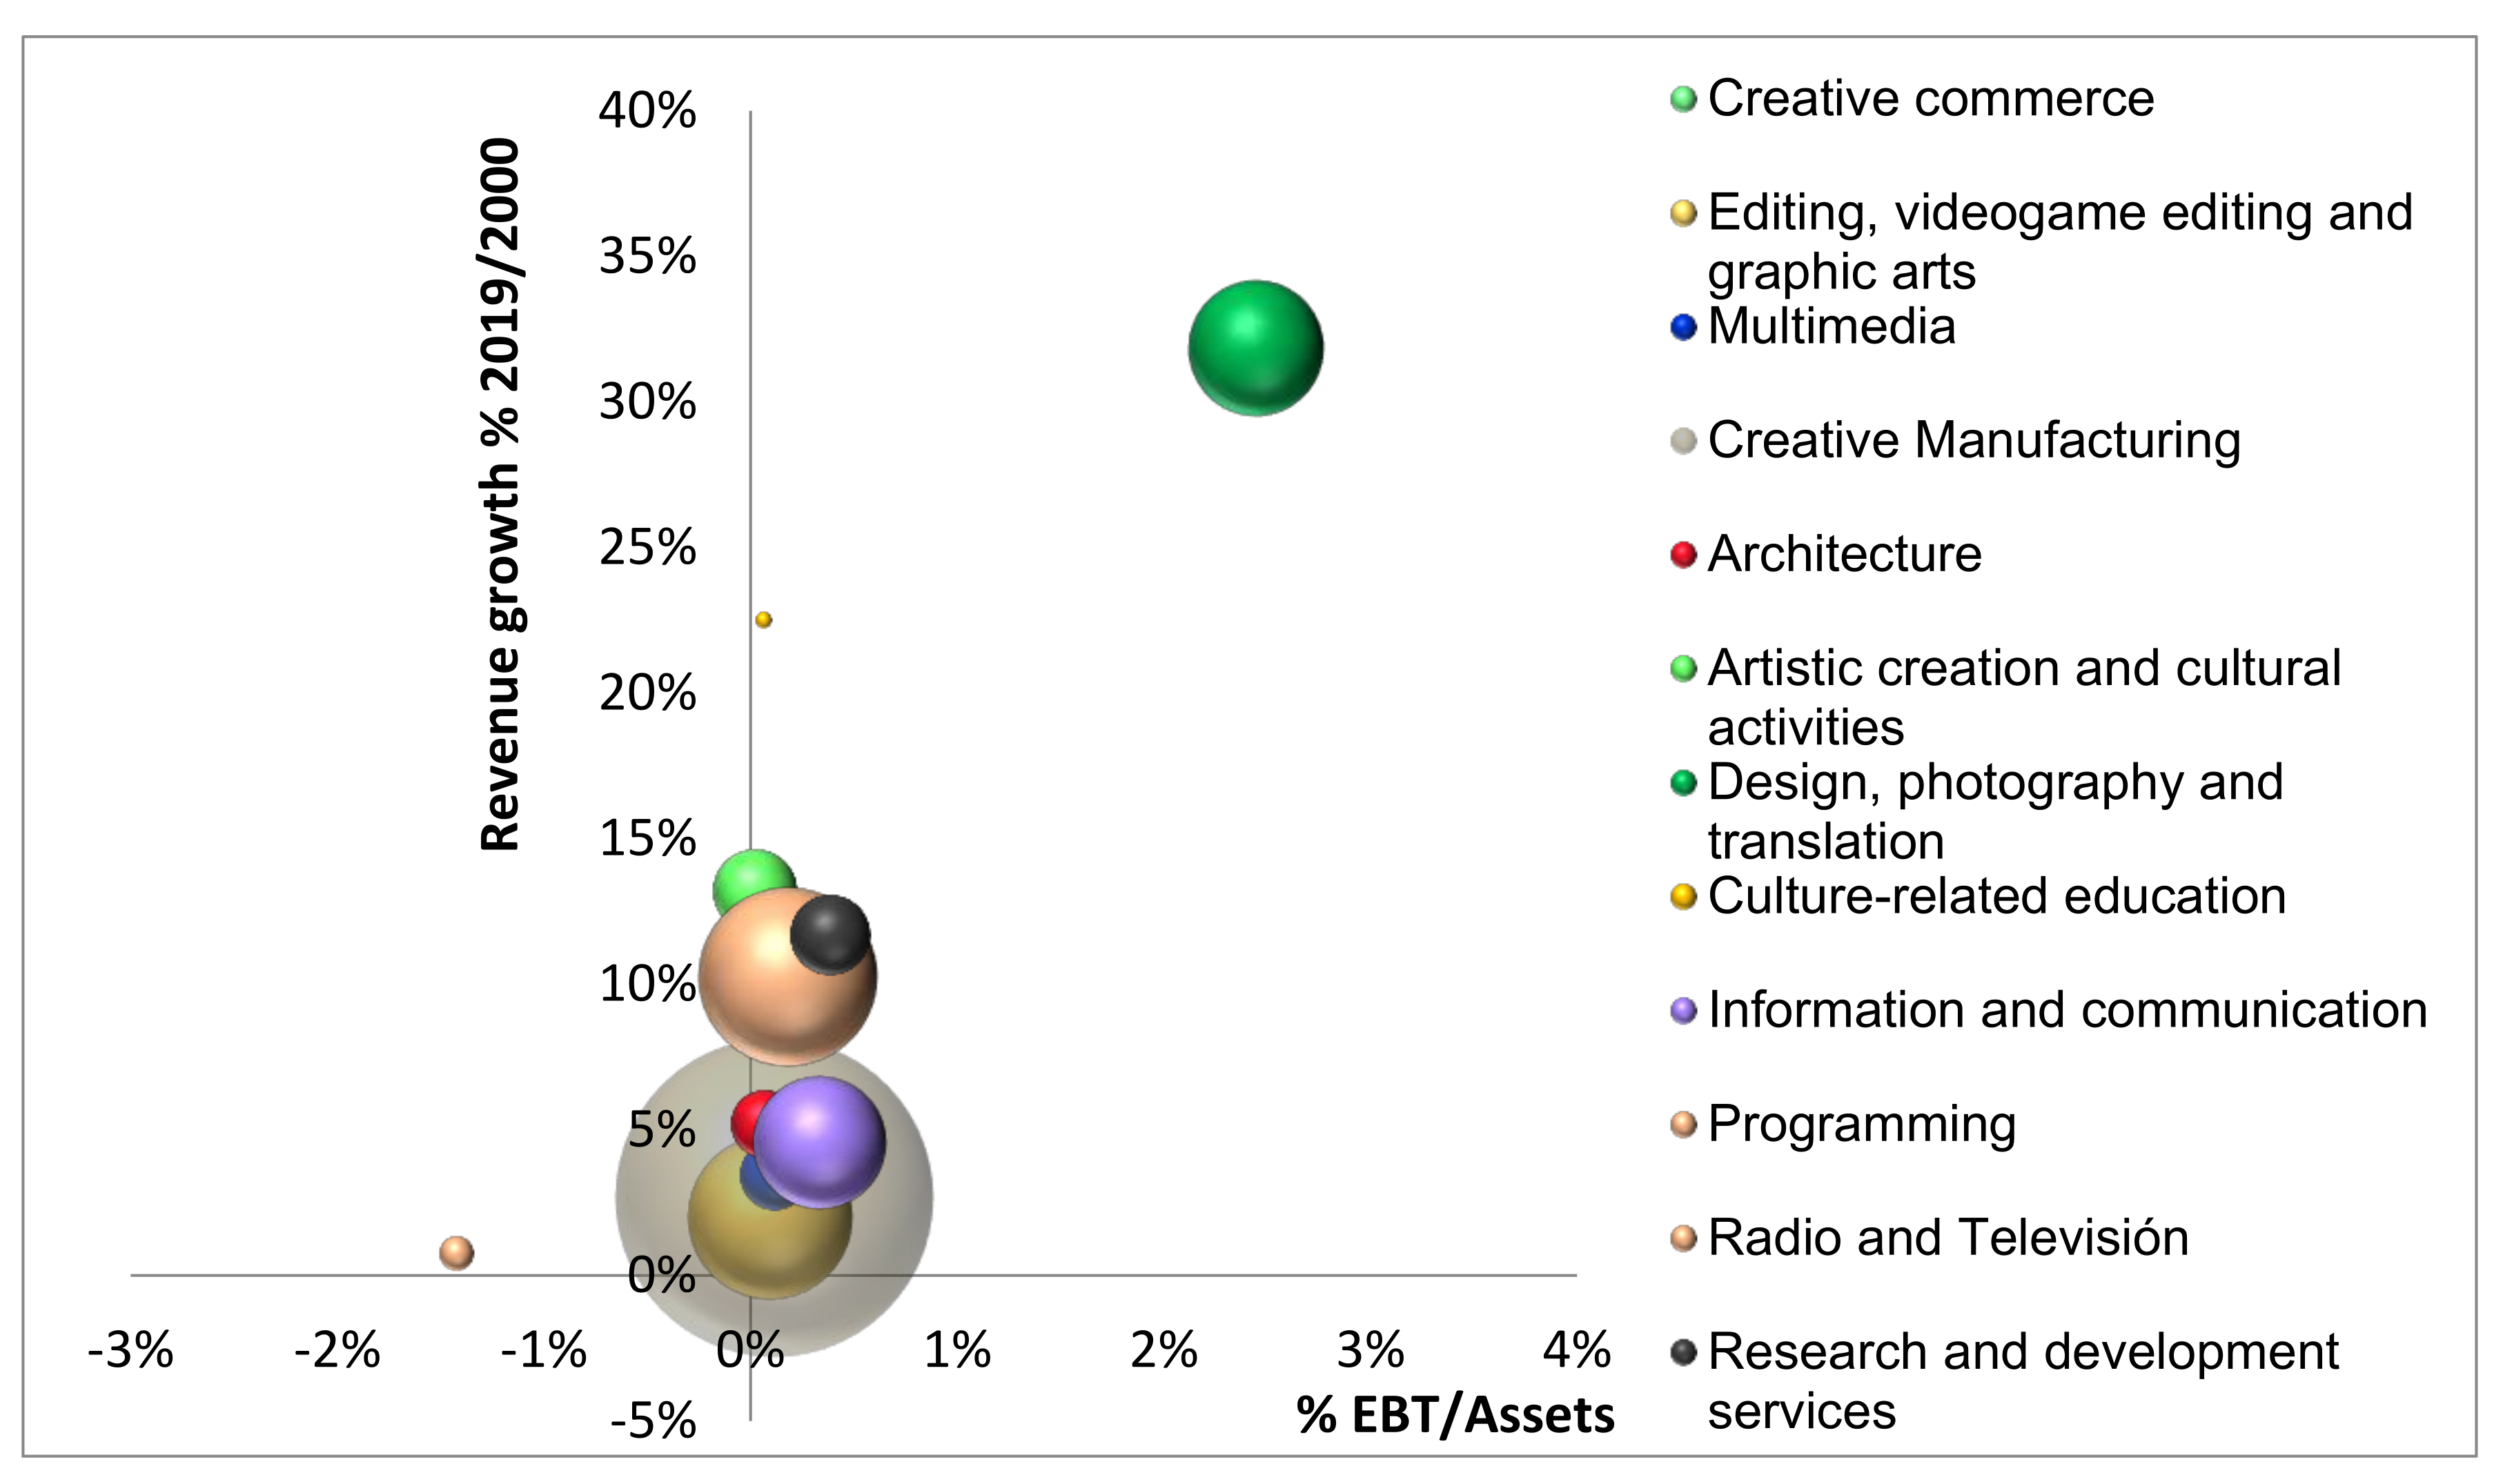
Figure 8 visually shows the importance or weight that each of the activity branches has in the Orange economy as a whole, measured in 2019 revenues (size of the figure), together with the dynamism shown in the period 2000–2019; comparing turnover levels (vertical) and % financial profitability (horizontal), it can be said:
  • It can be seen that the star sector of economic sustainability is the design, photography, and translation activity branch, with the highest growth in revenue, the highest financial profitability, and ranking fourth in terms of revenue.
  • The branch with the greatest current weight is creative manufacturing, which represents an average turnover for the period 2000–2019 of almost 50% of the sector’s total turnover. It has experienced a growth of 166.6% in that period, above the regional GDP (INE, 2021), which grew by 87.6%. Its financial profitability was 11.8% in 2019, above the national average (9.1%).
  • Few activities in Spain can boast a growth pattern of 924.7%, have the third highest financial profitability (18.4%), and hold the second place for revenue in the Orange economy (14.3%), such is the case of the programming branch activity.
  • A fourth branch with an outstanding position, but lower than the previous three, is research services. Its high profitability (38.5%) is the second highest in the sector. Moreover, its growth was 1071.6% during the period under study. On the other hand, its level of turnover is not very significant, representing only 2.8% of the Orange economy.
  • Finally, it is worth highlighting information and communication activity, since it ranks third in terms of financial profitability (38.5%). Although its growth (354.8%) was lower than that of other more dynamic blocks, it was higher than the average for the sector and for GDP. This block accounts for 7.9% of the sector’s total and therefore occupies a well-deserved fourth position.
It can be concluded that the third hypothesis is fulfilled, since it has been shown that there are differences in the variables’ evolution in the different blocks and branches of activity during the period analyzed. However, the ANOVA shows that the differences are not significant, so their inclusion in the same sector can be considered (see Table A13 and Table A14).

5. Discussion and Conclusions

The Orange economy, which encompasses the creative industries and the cultural sector, has been the subject of growing interest in the last two decades. Since the beginning of the 21st century, the potential of cultural and creative activities to generate sustainable growth has been increasingly recognized [5,7,12,15,16,18,27], showing greater resilience than the rest of the economy during the 2008 crisis [11,44] and higher growth after the crisis [13]. Many countries have opted for the implementation of policies to promote cultural and creative industries because of their capacity to generate employment [14]. Although consideration of the potential of the Orange economy as an engine of sustainable growth is quite widespread, empirically proven results are lacking [14,38]. This paper contributes to alleviating the lack of empirical studies, focused on the role of the Orange economy in two Spanish regions, with the aim of providing knowledge about the possibilities of this sector as a driver of the economy and assessing its economic sustainability.
On the other hand, as it is a sector formed by activities that differ significantly in their characteristics, it is not enough with a global vision and it is necessary to delve into the different activities that conform it [17]. This study provides specific knowledge of the different activities and valuable information for the design and the implementation of economic policy measures.
From the analyses conducted, it can be concluded that the Orange economy, inclusive of the creative industries, has behaved as a dynamic and economically sustainable sector. After the crisis, Orange economic growth, in relative terms, has been higher than in the economy as a whole and the same can be said of the economic and the financial profitability rates.
The analyses carried out allow us to conclude that Hypothesis 1 is fulfilled. The Orange economy is growing faster than the economy as a whole and it is an engine of growth. Starting with the operating revenue in the Orange sector, at the beginning of the period, in 2000 it represented 2.6% of GDP; and, at the end of the period, in 2019, this share rose to 4.8%. The results support the assertion of an increase in the share of the creative economy in the GDP of developed countries [40]. For the two regions considered together, the Valencian and the Galician regions, the growth rate of the Orange sector’s operating revenue for the period (2000–2019) amounts to 244.94%, while the GDP growth reaches 87.6%. Therefore, the Orange sector’s revenue growth rate is much higher than that of nominal GDP. The results of the study conducted are in line with those that point to the significant revenue generating capacity of creative industries and the cultural sector [7,14,39]. The growth is significant not only in revenues, since the number of enterprises is also increasing to a large extent. In 2000, in the regions of Valencia and Galicia, it amounted to 1555, and by the end of the period in 2019 the figure reached 8191 companies, an increase of 426.8%. As for the evolution of earning before taxes, if we compare the year 2000 with 2019, the variation rate is 1316.20%. The increase in earnings has been slightly more than 13 times the initial value, growing above the economy’s average. Good growth rates are positive for society; generating greater capital income means greater tax collection, which has an impact on governments’ budgetary capacity and, therefore, greater capacity to provide public goods and services. The results obtained support the affirmation of the Orange economy as an engine of economic growth [7,14,17,18,31,32].
Another aspect of interest is the sector’s resilience, i.e., its ability to cope with or recover from adverse situations such as the 2008 crisis. As to the question, are cultural and creative activities resilient? The data from the study indicate that during the 2008 crisis there was an increase in revenue and in the number of companies. These results are consistent with other studies. The results support the resilience of Orange activities [11,41]. Other cases, such as the study conducted for the United States, indicate that the cultural economy did not experience decline during the recession [44].
The study shows that, on average, companies in the Orange sector, have achieved higher levels of profitability when compared to the levels achieved by the economy as a whole, since the 2008 crisis. The higher profitability achieved since the crisis are evident in that the Orange economy is a resilient sector. Thus, the analyses carried out confirm Hypothesis 2.
The activities included in the Orange economy are very varied. It is not enough to have a global picture of the sector’s evolution, but it is necessary to delve deeper into the impact of the different activities on growth. The analyses carried out support the third hypothesis: it can be affirmed that there are differences in growth rates as well as in profitability levels, if we consider the different activities of the Orange sector, both by block and by branch of activity. For the period 2000–2019, the operating revenues of the different subsectors and activity branches of the Orange economy have grown above GDP growth, in all cases except for radio and television which suffered a decrease. The subsector with the highest growth rate is creative services (793.6%). At the activity branch level, design, photography, and translation (3182.6%); artistic creation and cultural activities (1222.2%); research and development services (1117.6%); and programming (1024.7%) stand out. If we analyze the center of the sector, the star activity is design, photography, and cultural activities, with the highest sales growth rate, the highest financial profitability, and a fourth position in terms of revenue. Contrary to the positive evolution of the design activity sector, creative manufacturing, which is the subsector with the highest weight, almost 50% of the turnover, is one of the least dynamic in terms of growth rates. In the case of programming activity, the growth is 924.7%, it has the third highest financial profitability (18.4%), and it represents the second place in revenue (14.3%).
In relation to the work limitations and future research lines, it should be noted that our analysis has an important limitation, we do not consider in the study those companies that due to their status as sole proprietors are not required to file accounts in the Mercantile Register and, therefore, do not appear in the SABI® database. This limitation is especially important in some activities as they involve numerous self-employed people [37]. Furthermore, we must delve deeper into the other two pillars of sustainability, the social pillar and the environmental pillar [45]. Once the sector’s capacity to generate income, employment, and positive earnings is known, we must assess the sector’s contribution to social sustainability by answering questions such as jobs generated, quality, salaries, and income distribution. To what extent does the Orange economy generate quality jobs? What is the distribution of income like? We should not stop at merely assessing growth. It is necessary to go further and study the impact on the welfare of the population.
Of course, assessing sustainability requires a response to aspects related to environmental impact. It has often been considered that creative sectors and Cultural industries are not polluting, but there are many activities included in this term and it does not seem to be possible to generalize. There is a lack of empirical evidence in this regard.
Beyond the study scope of sustainable economic, social, and environmental development, another aspect to be taken into account is to extend the study territory to include large and medium-sized cities, since creative activities are mainly concentrated in cities and it seems that the city’s size matters. As future research lines, it is proposed to extend the present investigation to other autonomous communities, as well as to carry out comparative studies with other countries.

Author Contributions

Conceptualization, F.J.F.-S.; A.L.-P. & G.R.-S.; methodology, F.J.F.-S.; A.L.-P. & G.R.-S.; software, F.J.F.-S.; A.L.-P. & G.R.-S.; validation, F.J.F.-S.; A.L.-P. & G.R.-S.; formal analysis, F.J.F.-S.; A.L.-P. & G.R.-S.; investigation and resources, F.J.F.-S.; A.L.-P. & G.R.-S.; data curation, F.J.F.-S.; A.L.-P. & G.R.-S.; writing—original draft preparation, F.J.F.-S.; A.L.-P. & G.R.-S.; writing—review and editing, F.J.F.-S.; A.L.-P. & G.R.-S.; visualization, F.J.F.-S.; A.L.-P. & G.R.-S. All authors have read and agreed to the published version of the manuscript.

Funding

This research received no external funding.

Institutional Review Board Statement

Not applicable.

Informed Consent Statement

Not applicable.

Data Availability Statement

Not applicable.

Conflicts of Interest

The authors declare no conflict of interest.

Appendix A

Table A1. Number of Orange economy companies classified by subgroups/branches of activity and communities.
Subgroup/BranchesC.A.
Valencian
%C.A.
Galicia
%Total
General
%
Cultural Industries126222.8%74027.8%200224.4%
 Creative commerce2424.4%1917.2%4335.3%
 Editing, videogame editing and graphic arts81814.8%41115.5%1.22915.0%
 Multimedia2023.7%1385.2%3404.2%
Creative Manufacturing142625.8%2178.2%1,64320.1%
 Creative manufacturing1.42625.8%2178.2%1.64320.1%
Creative Services284551.4%170164.0%454655.5%
 Architecture5039.1%31511.9%81810.0%
 Artistic creation and cultural activities2123.8%2117.9%4235.2%
 Design, photography and translation3105.6%1435.4%4535.5%
 Culture-related education210.4%271.0%480.6%
 Information and communication5429.8%33212.5%87410.7%
 Programming107619.4%58522.0%166120.3%
 Radio and Television661.2%281.1%941.1%
 Research and development services1152.1%602.3%1752.1%
Total general5533100.0%2658100.0%8191100.0%
 %s/total67.5% 32.5% 100.0%
Source: The authors base on SABI® (2021).
Table A2. Factorization principal component analysis (total variance explained).
ComponentInitial EigenvaluesSums of Squared Extraction Charges
Total% Variance% AccumulatedTotal% Variance% Accumulated
1235339.21%39.21%235339.21%39.21%
2113818.97%58.19%113818.97%58.19%
3106017.67%75.86%106017.67%75.86%
Source: Own elaboration results obtained from SABI® and processed in SPSS Statistics 28.
Table A3. Factor component matrix.
Component
123
Equity_20190.903−0.3340.174
Assets_200190.861−0.4220.228
Revenues_20190.6800.441−0.282
Earnings_20190.5750.590−0.347
Fin_P_20190.0170.3540.658
Econ_P_20190.0460.4260.587
Extraction method: principal component analysis. Source: Own elaboration results obtained from SABI® and processed in SPSS Statistics 28.
Table A4. Orange economy revenues by subgroups and activity branches for the period 2000–2019 (thousands of euros at current prices).
Subgroup/Branches20002005201020152019
Cultural Industries627,009892,253940,0351,031,2331,397,410
Creative commerce42,84782,907102,641111,456161,187
Editing, videogame editing and graphic arts529,517741,586744,362797,3671,047,141
Multimedia54,64567,76093,032122,410189,082
Creative Manufacturing1,468,2851,810,5222,204,7433,135,1913,914,265
Creative manufacturing1,468,2851,810,5222,204,7433,135,1913,914,265
Creative Services426,9831,029,1371,501,2842,053,9643,388,680
Architecture33,400143,150118,74492,088174,439
Artistic creation and cultural activities20,48581,52999,995126,433270,851
Design, photography and translation22,43348,755308,684538,335713,960
Culture-related education4312848399854809706
Information and communication151,247327,100377,255427,996687,855
Programming121,172311,719445,301681,0851,241,634
Radio and Television56,80760,48950,25237,30144,115
Research and development services21,00853,54797,055145,246246,120
Total2,522,2773,731,9124,646,0626,220,3888,700,355
GDP Valencia + Galicia96,182,387138,197,990157,968,726156,777,350180,445,213
% Total revenue/GDP2.6%2.7%2.9%4.0%4.8%
Source: The authors base on SABI® and INE (2021).
Table A5. Evolution of the number of Orange economy companies for the period 2000–2019.
Subgroup/Branches20002005201020152019
Cultural Industries565869115714892002
 Creative commerce87188254328433
 Editing, videogame editing and graphic arts4345917559541229
 Multimedia4490148207340
Creative Manufacturing51469487412111643
 Creative manufacturing51469487412111643
Creative Services4761221211130744546
 Architecture60270504621818
 Artistic creation and cultural activities3275169266423
 Design, photography and translation49113220315453
 Culture-related education210142948
 Information and communication123252402582874
 Programming16342667810831661
 Radio and Television3348596694
 Research and development services142765112175
Total15552784414257748191
Source: The authors base on SABI®.
Table A6. Earnings before tax (EBT) of the Orange economy by subgroup and activity branch (thousands of euros at current prices).
Subgroup/Branches20002005201020152019
Cultural Industries52,10669,12122,01141,78969,232
 Creative commerce282−2764001682337
 Editing, videogame editing and graphic arts44,45168,15924,04434,34352,711
 Multimedia73731238−2433727814,184
Creative Manufacturing74,84559,92080,49655,559129,621
 Creative manufacturing74,84559,92080,49655,559129,621
Creative Services−61,868−53,271146,930339,558722,856
 Architecture652137,9962844451314,557
 Artistic creation and cultural activities−28,732−42,319−56,060−42,8878049
 Design, photography and translation6081371239,140347,278440,448
 Culture-related education−43612−24102
 Information and communication907824,48824,63861,118115,793
 Programming516010,12225,70847,24193,817
 Radio and Television−55,045−87,114−97,407−86,931−98,053
 Research and development services546214980559250148,143
Total general65,08375,770249,437436,906921,709
Source: The authors base on SABI®.
Table A7. Spearman correlations of Orange economy.
Revenues 2019Earnings 2019
Earnings_2019Financial Profitability 2019
Year 20050.486 **0.028 **0.494 **
Year 20100.457 **0.068 **0.120 **
Year 20190.496 **0.164 **0.506 **
Source: Own elaboration results obtained from SABI® and processed in SPSS Statistics 28. Note: ** represents sig p < 0.01.
Table A8. Spearman correlations by activity blocks in the orange economy.
Revenues 2019Earnings 2019
Earnings_2019Financial Profitability 2019
Cultural industries0.469 **0.111 **0.471 **
Creative manufacturing0.546 **0.100 **0.404 **
Creative Services0.526 **0.220 **0.551 **
Total0.496 **0.164 **0.506 **
Source: Own elaboration results obtained from SABI® and processed in SPSS Statistics 28. Note: ** represents sig p < 0.01.
Table A9. % Economic profitability by subgroups and activity branches of the Orange economy.
Subgroup/Branches20002005201020152019
Cultural Industries8.3%7.6%1.9%3.6%4.9%
 Creative commerce1.1%−0.5%0.5%0.2%2.0%
 Editing, videogame editing and graphic arts8.4%9.6%2.8%3.9%5.0%
 Multimedia10.4%0.8%−1.2%4.0%5.6%
Creative Manufacturing9.1%5.5%5.0%2.7%5.2%
 Creative manufacturing9.1%5.5%5.0%2.7%5.2%
Creative Services−7.0%−3.4%6.2%10.9%17.0%
 Architecture30.6%21.0%0.9%1.5%4.0%
 Artistic creation and cultural activities−5.0%−5.6%−6.6%−4.4%0.7%
 Design, photography and translation5.1%4.2%106.3%76.0%130.6%
 Culture-related education−3.5%2.2%0.5%−0.7%2.2%
 Information and communication10.8%11.9%7.8%15.8%18.7%
 Programming7.8%5.9%7.1%7.7%9.0%
 Radio and Television−56.2%−71.3%−65.8%−80.7%−77.2%
 Research and development services1.5%2.2%4.9%3.4%22.9%
Total general2.8%2.1%4.9%6.9%11.3%
 Spanish economy7.5%4.6%4.6%5.9%
Source: The authors base on SABI® and INE (2019).
Table A10. Financial profitability by subgroups and branches of the Orange economy for the period 2000–2019.
Subgroup/Branches20002005201020142019
Cultural Industries21.7%18.7%4.5%7.9%10.0%
 Creative commerce4.8%−2.3%2.0%0.8%6.9%
 Editing, videogame editing and graphic arts21.9%23.4%6.2%8.2%9.8%
 Multimedia23.8%1.8%−2.8%8.7%11.4%
Creative Manufacturing24.9%13.6%13.5%6.4%11.8%
 Creative manufacturing24.9%13.6%13.5%6.4%11.8%
Creative Services−65.7%−8.9%11.6%22.7%34.3%
 Architecture72.9%36.6%1.5%2.5%6.6%
 Artistic creation and cultural activities−180.4%−15.1%−11.0%−9.8%2.0%
 Design, photography and translation17.2%15.5%177.2%134.7%244.9%
 Culture-related education−16.7%7.2%2.3%−5.3%6.2%
 Information and communication37.0%31.1%20.4%34.4%33.8%
 Programming26.0%17.7%17.0%19.9%18.4%
 Radio and Television−1637.3%−265.5%−113.6%−108.4%−142.4%
 Research and development services3.0%5.9%9.6%7.4%38.5%
Total10.3%5.4%10.6%15.1%23.6%
 Spanish economy13.2%13.3%8.4%8.0%9.1%
Source: The authors base on SABI® and INE (2021), Financial profitability is measured by dividing earnings before taxes by equity.
Table A11. Statistical significance analysis of average revenue by most relevant activity branches through Levene’s test, Year 2019.
BranchProgrammingEditing, Videogame EditingDesign, PhotographyInformation and Communication
Creative Manufacturing0.000 (***)0.000 (***)0.2200.000 (***)
Programming-0.4640.2470.793
Editing, videogame editing -0.2960.799
Design, photography -0.279
Source: The authors base on SABI® and SPSS. Note: *** sig represents p < 0.001.
Table A12. Total assets of the Orange economy ordered by subgroup and activity branch (thousands of euros at current prices).
Subgroup/Branches20002005201020152019
Cultural Industries627,091913,0981,135,8451,149,7931,416,200
 Creative commerce24,75752,67176,53885,133118,804
 Editing, videogame editing and graphic arts531,447708,752864,037884,6001,044,859
 Multimedia70,887151,675195,270180,060252,537
Creative Manufacturing825,1191,092,5611,625,5112,085,1292,498,963
 Creative manufacturing825,1191,092,5611,625,5112,085,1292,498,963
Creative Services887,4551,560,8152,363,8423,119,8244,255,578
 Architecture21,283180,912301,453300,242364,832
 Artistic creation and cultural activities569,282749,310843,329975,0621,117,796
 Design, photography and translation11,98232,676224,959456,645337,288
 Culture-related education1141654223236574560
 Information and communication83,877206,029314,864387,316619,234
 Programming66,326172,390363,480614,6621,037,890
 Radio and Television98,012122,175148,089107,702127,041
 Research and development services36,57995,669165,436274,538646,937
Total general2,339,6653,566,4745,125,1986,354,7468,170,741
Source: The authors base on SABI®.
Table A13. Statistical significance analysis of economic profitability by most relevant branches through independent samples and Levene’s test (2019).
ProgrammingEditing, Videogame
Editing
Design, PhotographyInformation
EBTTAEBT/TAEBTTAEBT/TAEBTTAEBT/TAEBTTAEBT/TA
Creative Manufacturing0.1950.000 (***)0.0730.0950.002 (**)0.1390.1410.011 (**)0.1750.4740.006 (**)0.184
Programming---0.3710.031 (*)0.1890.1320.4350.6700.2950.6140.945
Editing, videogame ---0.1250.6710.008 (**)0.2780.5570.224
Design, photography ---0.1720.9120.082
Source: The authors base on SABI®, EBT (Earnings before taxes), TA (Total assets), EBT/TA (economic profitability). Note: * represents sig p < 0.05; ** represents sig p < 0.01; *** represents sig p < 0.001.
Table A14. Statistical significance analysis of financial profitability by most relevant activity branches through independent samples and Levene’s test, Year 2019.
ProgrammingEditing, Videogame EditingDesign, Photography and TranslationInformation and Communication
EqEBT/EpEqEBT/EpEqEBT/EpEqEBT/Ep
Creative manufacturing0.000 (***)0.0780.015 (*)0.0510.0740.1530.1470.638
Programming--0.045 (*)0.3670.4750.4620.570.196
Editing, videogame editing --0.8200.8900.8680.156
Design, photography --0.9850.148
Source: The authors base on SABI®, Equity (Ep) and financial profitability (Earns before taxes/ Equity). Note: * represents sig p < 0.05; ** represents sig p < 0.01; *** represents sig p < 0.001.

References

  1. Rius-Sorolla, G.; Maheut, J.; Estelles-Miguel, S.; Garcia-Sabater, J.P. Protocol: Systematic Literature Review on coordination mechanisms for the mathematical programming models in production planning with decentralized decision making. WPOM-Working Pap. Oper. Manag. 2017, 8, 22. [Google Scholar] [CrossRef] [Green Version]
  2. Buitrago Restrepo, F.; Duque Márquez, I. La Economía Naranja: Una Oportunidad Infinita; Banco Interamericano de Desarrollo: Washington, DC, USA, 2013; Volume 1, ISBN 9789587586046. [Google Scholar]
  3. Prada Trigo, J. El debate de la creatividad y la economía en las ciudades actuales y el papel de los diferentes actores: Algunas evidencias a partir del caso de estudio de Madrid. Investig. Geogr. 2013, 87, 62–75. [Google Scholar] [CrossRef] [Green Version]
  4. Howkins, J. The Creative Economy: How People Make Money from Ideas, 2nd ed.; Penguin Press: London, UK, 2001; ISBN 9780141910239. [Google Scholar]
  5. UNCTAD. Creative Industries and Development Executive. Available online: https://unctad.org/system/files/official-document/tdxibpd13_en.pdf (accessed on 15 August 2021).
  6. Sung, T.K. The creative economy in global competition. Technol. Forecast. Soc. Change 2015, 96, 89–91. [Google Scholar] [CrossRef]
  7. UNCTAD. Creative Economy Report 2008. The Challenge of Assessing the Creative Economy: Towards Informed Policy-making. Available online: https://unctad.org/system/files/official-document/ditc20082cer_en.pdf (accessed on 15 August 2021).
  8. UNESCO. Creative Economy Report 2013; United Nations Development Programme: New York, NY, USA, 2013; ISBN 9789230012113. [Google Scholar]
  9. UNESCO. Framework for Cultural Statistics; UNESCO Institute for Statistics: Montreal, QC, Canada, 2009; ISBN 9789291890750. [Google Scholar]
  10. Verdini, G. Creative-led strategies for peripheral settlements and the uneasy transition towards sustainability. Int. Plan. Stud. 2021, 26, 149–164. [Google Scholar] [CrossRef]
  11. Rausell Köster, P.; Boix Doménech, R. Economía Naranja y los Sectores Culturales y Creativos (Scc) En la Comunitat Valenciana: Situación, Potencialidades y Definición de Propuesta de Actuación para su Fomento. Available online: http://www.hisenda.gva.es/documents/164158153/168073543/ECONOMIA+NARANJA+VER+DEFINITIVA3-1.pdf/abeff1a0-f6b7-4484-ab10-0264d576f27e (accessed on 15 August 2021).
  12. Florida, R. The Rise of the Creative Class; Basic Books: New York, NY, USA, 2019; ISBN 9781541617742. [Google Scholar]
  13. Pratt, A.C. The creative and cultural economy and the recession. Geoforum 2009, 40, 495–496. [Google Scholar] [CrossRef] [Green Version]
  14. Štreimikienė, D.; Kačerauskas, T. The creative economy and sustainable development: The Baltic States. Sustain. Dev. 2020, 28, 1632–1641. [Google Scholar] [CrossRef]
  15. UNCTAD. Creative Economy Report 2010: A Feasible Development Option. Available online: https://unctad.org/system/files/official-document/ditctab20103_en.pdf (accessed on 15 August 2021).
  16. Throsby, D. Development Strategies for Pacific Island Economies: Is There a Role for the Cultural Industries? Asia Pacific Policy Stud. 2015, 2, 370–382. [Google Scholar] [CrossRef]
  17. Lazzeretti, L.; Innocenti, N.; Capone, F. The impact of related variety on the creative employment growth. Ann. Reg. Sci. 2017, 58, 491–512. [Google Scholar] [CrossRef]
  18. Cerisola, S.; Panzera, E. Cultural and Creative Cities and Regional Economic Efficiency: Context Conditions as Catalyzers of Cultural Vibrancy and Creative Economy. Sustainability 2021, 13, 7150. [Google Scholar] [CrossRef]
  19. Olmedo Barchello, S. Interaction between the social economy and the creative economy as promoters of local economic development in Paraguay. Población Desarro 2017, 23, 61–73. [Google Scholar] [CrossRef]
  20. UN. Report of the World Commission on Environment and Development: Our Common Future. Available online: https://sustainabledevelopment.un.org/content/documents/5987our-common-future.pdf (accessed on 15 August 2021).
  21. UNESCO. Our Creative Diversity. Available online: https://unesdoc.unesco.org/ark:/48223/pf0000105586 (accessed on 15 August 2021).
  22. UNESCO. Políticas Culturales: Documento de Estocolmo 1998. Available online: https://culturalrights.net/descargas/drets_culturals419.pdf (accessed on 15 August 2021).
  23. UNESCO. The 2005 Convention on the Protection and Promotion of the Diversity of Cultural Expresions. Paris. Available online: https://en.unesco.org/creativity/sites/creativity/files/passeport-convention2005-web2.pdf (accessed on 15 August 2021).
  24. UNESCO. Re|Pensar las Políticas Culturales: Creatividad para el Desarrollo—UNESCO Biblioteca Digital; UNESCO: Paris, France, 2018; ISBN 9789233000933. [Google Scholar]
  25. UN. El Futuro Qque Queremos. Available online: https://www.un.org/ga/search/view_doc.asp?symbol=A/RES/66/288&Lang=E (accessed on 15 August 2021).
  26. UN. General Assembly UN. Declaration 2021 Year of Creative economy and Sustainable Development. Int. Organ. 2019, 19365, 49–116. [Google Scholar]
  27. Oyekunle, O.A. The contribution of creative industries to sustainable urban development in South Africa. Afr. J. Sci. Technol. Innov. Dev. 2017, 9, 607–616. [Google Scholar] [CrossRef]
  28. Sava, D.-C.; Badulescu, A. Dimensions and Performances of the Creative Economy in Romania. Available online: http://conference.management.ase.ro/archives/2018/pdf/2_3.pdf (accessed on 15 October 2021).
  29. Llorca-Ponce, A.; Rius-Sorolla, G.; Ferreiro-Seoane, F.J. Is Innovation a Driver of Sustainability? An Analysis from a Spanish Region. Sustainability 2021, 13, 9286. [Google Scholar] [CrossRef]
  30. Soini, K.; Dessein, J. Culture-Sustainability Relation: Towards a Conceptual Framework. Sustainability 2016, 8, 167. [Google Scholar] [CrossRef] [Green Version]
  31. Rodrigues, M.; Franco, M. Measuring the Performance in Creative Cities: Proposal of a Multidimensional Model. Sustainability 2018, 10, 4023. [Google Scholar] [CrossRef] [Green Version]
  32. Kirchberg, V.; Kagan, S. The roles of artists in the emergence of creative sustainable cities: Theoretical clues and empirical illustrations. City Cult. Soc. 2013, 4, 137–152. [Google Scholar] [CrossRef]
  33. Ernst and Young Creating Growth. Measuring Cultural and Creative Markets in the EU. Available online: http://www.creatingeurope.eu/en/wp-content/uploads/2014/11/study-full-en.pdf (accessed on 15 October 2021).
  34. Oakley, K.; Ward, J. The art of the good life: Culture and sustainable prosperity. Cult. Trends 2018, 27, 4–17. [Google Scholar] [CrossRef]
  35. Hesmondhalgh, D.; Nisbett, M.; Oakley, K.; Lee, D. Were New Labour’s cultural policies neo-liberal? Int. J. Cult. Policy 2015, 21, 97–114. [Google Scholar] [CrossRef] [Green Version]
  36. Oakley, K. This Is a Repository Copy of Creating Space: A Re-Evaluation of the Role of Culture in Regeneration. Available online: http://eprints.whiterose.ac.uk/88559/ (accessed on 15 October 2021).
  37. Istudor, L.G. Innovation and entrepreneurship in Romania’s cultural and creative industries. Proc. Int. Conf. Bus. Excell. 2018, 12, 498–507. [Google Scholar] [CrossRef] [Green Version]
  38. Kačerauskas, T.; Streimikiene, D.; Bartkute, R. Environmental Sustainability of Creative Economy: Evidence from a Lithuanian Case Study. Sustainability 2021, 13, 9730. [Google Scholar] [CrossRef]
  39. Stojčić, N.; Bačić, K.; Aralica, Z. Is Creative Economy in Croatia a Myth or Reality? Some Evidence on the Impact of Creativity on Regional Economic Growth. Croat. Econ. Surv. 2016, 18, 113–138. [Google Scholar] [CrossRef] [Green Version]
  40. Fazlagić, J.; Skikiewicz, R. Measuring sustainable development—the creative economy perspective. Int. J. Sustain. Dev. World Ecol. 2019, 26, 635–645. [Google Scholar] [CrossRef]
  41. Banks, M. Creative economies of tomorrow? Limits to growth and the uncertain future. Cult. Trends 2018, 27, 367–380. [Google Scholar] [CrossRef] [Green Version]
  42. Evans, G. Creative Cities, Creative Spaces and Urban Policy. Urban Stud. 2009, 46, 1003–1040. [Google Scholar] [CrossRef] [Green Version]
  43. Grodach, C.; Loukaitou-Sideris, A. Cultural Development Strategies and Urban Revitalization. Int. J. Cult. Policy 2007, 13, 349–370. [Google Scholar] [CrossRef] [Green Version]
  44. Grodach, C.; Seman, M. The cultural economy in recession: Examining the US experience. Cities 2013, 33, 15–28. [Google Scholar] [CrossRef]
  45. Pickett, K.; Wilkinson, R. The Spirit Level: Why Equality Is Better for Everyone; Penguin Books: London, UK, 2010; ISBN 9780241954294. [Google Scholar]
Figure 1. Number of Orange economy companies classified by subgroups/branches of activity, 2019. Source: The authors base on SABI® from 2019 information.
Sustainability 14 03400 g001
Figure 2. Growth rates of the Orange sector revenues and GDP of the regional economy. Source: The authors base on SABI®.
Sustainability 14 03400 g002
Figure 3. Growth in the number of companies in the Orange economy. Source: The authors base on SABI®.
Sustainability 14 03400 g003
Figure 4. Evolution of economic profitability in the Orange sector compared to the Spanish economy for the period 2000–2019.
Sustainability 14 03400 g004
Figure 5. Evolution of financial profitability in the Orange sector compared to the Spanish economy for the period 2000–2019. Source: The authors base on SABI® and INE (2021). Financial profitability is measured by dividing earnings before taxes by equity.
Sustainability 14 03400 g005
Figure 6. Earnings before taxes of Orange economy ordered by subgroups, 2000–2019. Source: The authors base on SABI®.
Sustainability 14 03400 g006
Figure 7. Total assets of the Orange economy by subgroup (thousands of euros at current prices). Source: The authors base on SABI®.
Sustainability 14 03400 g007
Figure 8. Growth and financial profitability in the Orange economy. Source: The authors base on SABI®. Vertical axis (% revenue growth 2019/2000); horizontal axis (% financial profitability 2019) and size of the figure (revenue thousands of euros in 2019).
Sustainability 14 03400 g008
Publisher’s Note: MDPI stays neutral with regard to jurisdictional claims in published maps and institutional affiliations.

