Article

A Study on Temperature Distribution within HVDC Bushing Influenced by Accelerator Content during the Curing Process

1
The Wind Solar Storage Division of State Key Lab of Control and Simulation of Power System and Generation Equipment, School of Electrical Engineering, Xinjiang University, Urumqi 830046, China
2
State Key Lab of Control and Simulation of Power System and Generation Equipment, Department of Electrical Engineering, Tsinghua University, Beijing 100084, China
3
College of Information Engineering, Zhejiang University of Technology, Hangzhou 310014, China
*
Authors to whom correspondence should be addressed.
Sustainability 2022, 14(6), 3393; https://doi.org/10.3390/su14063393
Submission received: 11 February 2022 / Revised: 5 March 2022 / Accepted: 9 March 2022 / Published: 14 March 2022
(This article belongs to the Special Issue Sustainable Power Systems and Optimization)

Abstract

:
Power transmission technology plays an important role in energy sustainability. Bushing is an indispensable type of equipment in power transmission. In production, the accelerator changes the temperature distribution during the curing process, influencing the formation of defects and thus the safety output of renewable energy. In this study, uncured epoxy resin samples with different accelerator contents were prepared and measured by differential scanning calorimetry (DSC). The obtained heat flow curves were analyzed for curing kinetics. Then, the curing process of large length–diameter ratio bushings was simulated by using the finite element method combined with a curing kinetics model, transient Fourier heat transfer model, and stress–strain model. The study reveals that the curing system can be established by the Sestak–Berggren autocatalytic model with different accelerator contents. The overall curing degree and the maximum radial temperature difference of the capacitor core tend to increase and then decrease with the accelerator content. This is mainly attributable to the rapid exotherm excluding the participation of some molecular chains in the reaction, resulting in permanent under-curing. As the accelerator content increases, the strain peak decreases and then increases. This paper provides guidance for the comprehensive evaluation and manufacturing of the low-defect capacitor cores of large-size high voltage direct current (HVDC) bushings.

1. Introduction

In recent years, sustainable development and carbon-neutrality have been promoted around the world [1]. Energy transition is one of the key methods proposed to cleanse and decarbonize the world’s energy consumption structure [2,3,4]. Due to demand for the large-scale production of renewable energy sources such as photovoltaics and wind power, high voltage direct current (HVDC) transmission has also developed dramatically around the world, owing to its advantages such as economy, stability and flexibility [5,6]. In an HVDC project, bushing is an indispensable component, connecting the valve hall and other power equipment [7]. Although oil-type bushings grab a large slice of the market, dry-type bushings are being promoted in recent years, which can be attributed to their excellent electrical, oil-free, and flame-retardant characteristics.
During production, the capacitor core of dry-type bushing needs to be cured after it is impregnated with epoxy resin. As the curing reaction of epoxy resin is exothermic, the heat released by the curing reaction fails to be transferred in time. This is because of the large size of the HVDC bushing along both the axial and radial directions. The capacitor core suffers from an obvious inhomogeneous temperature distribution during the curing process, which makes the expansion and contraction of the epoxy resin unbalanced, and thus causes the accumulation of internal stress [8]. As the internal stress exceeds a certain value, defects such as cracks and bubbles occur inside the capacitor core [9]. In operation, these tiny bubbles and cracks inside the capacitor core can lead to electric field distortion, which causes partial discharge and eventually insulation failure. Therefore, studying temperature distribution during the curing process of the capacitor core is of great significance to the margin design for bushing construction.
Due to the high cost, long duration, and the limitations of experimental methods, simulation has become the preferred option. Although a great deal of research has been done on the curing temperature distribution of epoxy resin and insulators, less attention was paid to large-size bushing [10,11,12]. During the curing process of the bushing capacitor core, the accelerator is an economical and easy means for speeding up the reaction process, which plays a vital role in the curing conditions and the performance of the cured products. So far, for accelerators, scholars have focused more on the gel time and the rheological properties of the reaction system [13,14,15], as well as the glass transition temperature, tensile modulus, elongation at break, elastic modulus, dielectric loss, and other properties of the cured products [16,17,18,19,20]. However, less research has been carried out to analyze the effect of the accelerator contents on the internal temperature distribution of large-size bushing with different length-to-diameter ratios during the curing process, which is important for the regulation of the curing conditions and the performance of the bushings.
Therefore, in this study, non-isothermal differential scanning calorimetry (DSC) tests were conducted to reveal the curing kinetics of the E51/methyl tetrahydrophthalic anhydride (MeTHPA)/N,N-dimethylbenzylamine (BDMA) system. Based on the obtained curing kinetics and the actual direct current (DC) dry-type bushings with different voltage levels, a simulation model of the temperature distribution within the capacitor core during curing was constructed using curing kinetics theory coupled with a Fourier heat transfer model. The characteristics of the temperature, curing degree, and stress–strain during the curing process are studied, and the influence of the accelerator content on the curing properties of bushings is comprehensively evaluated.

2. Materials and Methods

2.1. Specimen Preparation

The epoxy equivalent (eq/100 g) of the bisphenol A epoxy resin E-51 was 180–200. The curing agent was MeTHPA. The accelerator was BDMA. The ratio between the epoxy resin and the curing agent was 100:85. The mass fractions of the BDMA were 0.5 wt.%, 1 wt.%, 2 wt.%, and 3 wt.% of the epoxy resin. Constant stirring was carried out at the speed of 500 r min−1, 1000 r min−1, and 2000 r min−1 for 2.5 min, 2.5 min, and 5 min, respectively. Finally, the mixture was vacuumized for 30 min to exhaust the bubbles inside the epoxy resin.

2.2. DSC Measurement

A non-isothermal DSC test was conducted to obtain the reaction kinetic parameters and the reaction mechanisms of samples with different accelerator contents [21]. Approximately 5 mg of the liquid epoxy resin mixture was measured under nitrogen conditions. The exothermic profiles were recorded during constant heating. The temperature range was 40–300 °C, and the heating rate was controlled at 5 °C min−1, 10 °C min−1, 15 °C min−1, and 20 °C min−1.

2.3. Simulation Model

Incorporating the temperature distribution properties and the stress–strain evolution process of the capacitor core insulated with the epoxy resin of the HVDC bushings, a model was constructed based on a transient Fourier heat transfer field coupled with a solid mechanics field and a curing degree field defined by a partial differential equation. Probes at different locations were set up to extract data and the bottom heating was set at 90 °C. The specific simulation model used is shown in Figure 1. The simulation model was set up with aluminum foil as the capacitive screen. To maintain the same comparison conditions and to simplify the simulation, the number of capacitor screen layers was taken as 65% of the actual number of layers. Considering that the thermal conductivity of aluminum foil is much higher than that of epoxy resin, a thermally thin approximation was used in the calculation, which only considered the heat transfer contribution in the tangential direction of the aluminum foil.
The transient Fourier heat conduction model of the epoxy resin casting is shown as the following [22]:
ρ C T t = x ( k x T x ) + y ( k y T y ) + z ( k z T z ) + Q
where C is the specific heat capacity of the epoxy resin, and ρ is the density of the epoxy resin. In Equation (1), kx, ky, and kz are the thermal conductivity of the epoxy resin in the corresponding three directions under the space rectangular coordinate system. Because of the isotropic properties of liquid epoxy resin and the low content of the accelerator, the density ρ, thermal conductivity k, and specific heat capacity C of the epoxy resin under different systems were controlled to be the same to eliminate the influence of other factors when studying the effect of accelerator content. Specific parameters can be seen in Table 1 [23]. The value Q is the reaction heat generation rate of resin cross-linking polymerization that can be determined by Equation (2)
Q = ρ H r d α d t
where α is the curing degree, /dt is the curing reaction rate of the epoxy resin, and Hr is the total heat release.
The stress–strain field required an explicit curing mecha–nism model and a non-mechanical strain model for the epoxy resin. Among those available, CHILE is a widely adopted curing mechanism model. The non-mechanical strain model mainly considers the thermal strain increment and chemical shrinkage strain increment [24].

3. Results and Discussion

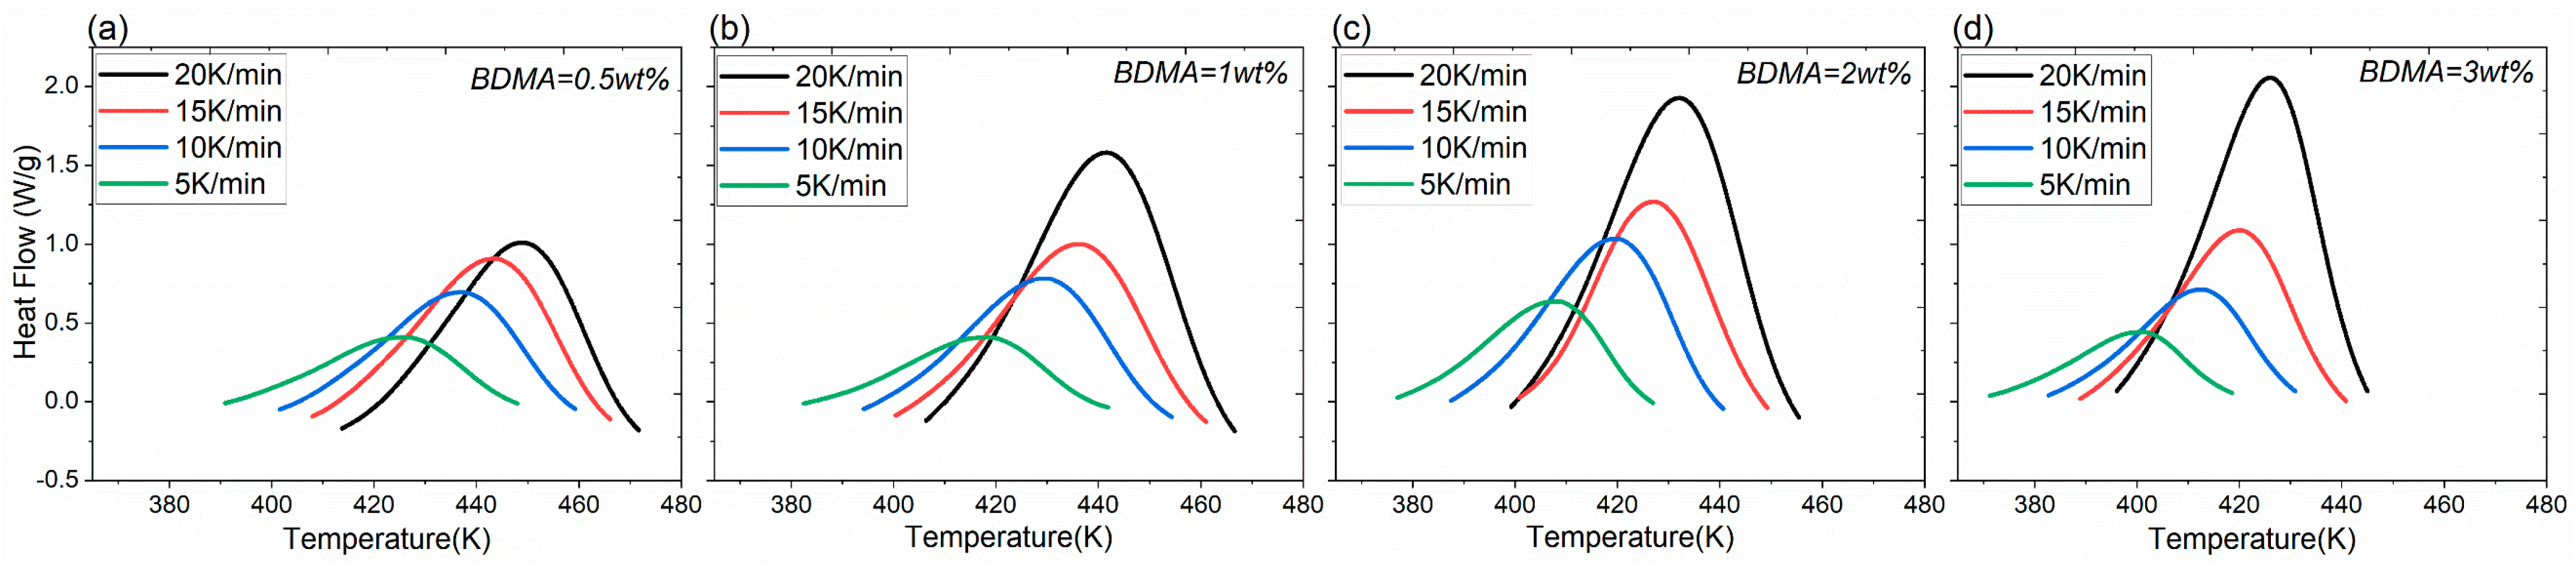
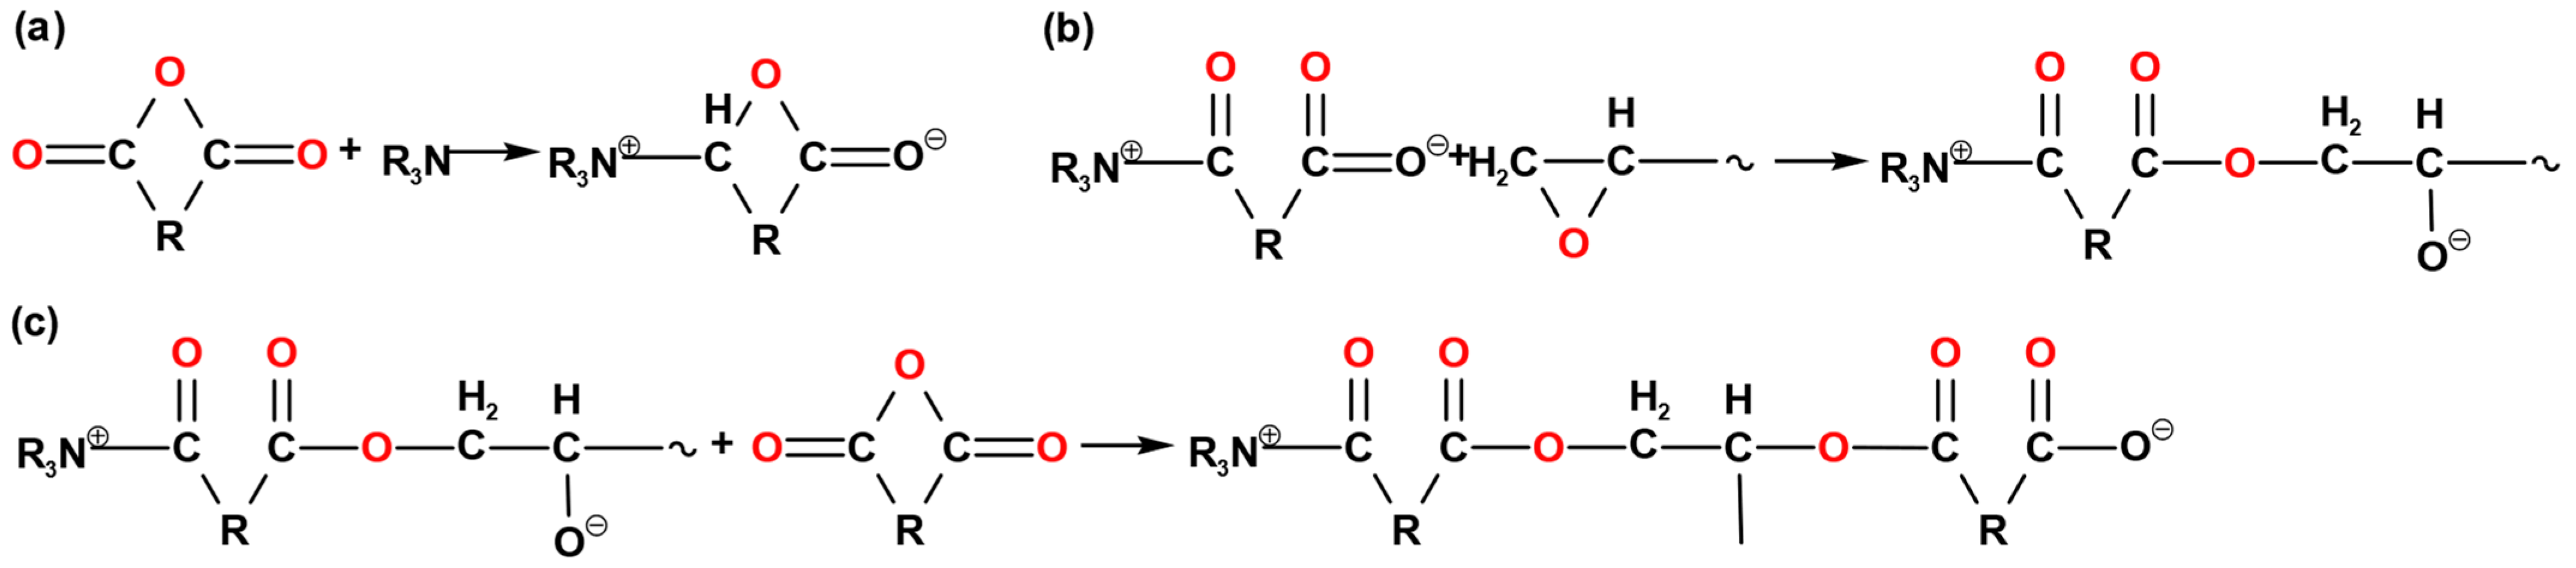
3.1. Analysis of Curing Kinetics

Figure 2 shows the exotherm curve of epoxy resin with different accelerator contents at different heating rates. Although the accelerator content is different, the curve change with the heating rate is basically the same. As the heating rate increases, the peak temperature and amplitude of the DSC curve moves to a higher temperature, shortening the curing time. The exothermic curve area of the curing reaction gradually increases, and the exothermic peak gradually becomes steeper [25]. There is sufficient time to release heat at a low heating rate. However, the thermal inertia becomes greater, and the system fails to have enough time to react sufficiently as the heating rate increases, so the heat release lags as the temperature rises. Thus, the heat release peak of the curing system moves towards higher temperatures.
Figure 3 illustrates that an increase in the accelerator content decreased the onset temperature, peak temperature, and endset temperature monotonously. The reason is that the accelerator served as a catalyst, which increased the effective collision probability between molecules and made the system easier to crosslink. In addition, since the reaction happened in a shorter time, the heat release was concentrated. Hence the peak height increased continuously with the accelerator content, thanks to the accelerated reaction rate. The exothermic enthalpy is the integral of the heat flow curve from the onset temperature to endset temperature over time.
Table 2 gives the average value of the enthalpy of samples with different accelerator content. The enthalpy increases with the accelerator content. A higher enthalpy means a more complete reaction.
In 1957, Kissinger proposed a linear relationship between the reaction exotherm and the curing degree [26]. There is a linear relationship between the reaction exotherm and the curing degree, as shown in Equation (3)
α = H t Δ H
where Ht is the magnitude of the heat flow at time t and ΔH represents the total heat release from the entire curing reaction. In the DSC study of the kinetics of thermosetting resins mentioned above, the basic assumption was that the exotherm recorded by DSC was proportional to the degree of the consumption of the reacting groups and that the rate of reaction was proportional to the measured heat flow [27].
As for a complex curing reaction, activation energy Ea reflects the difficulty of the reaction. In order to accurately obtain the activation energy of the curing reaction, the Flynn–Wall–Ozawa (FWO) method was used as shown in Equation (4) [28]:
ln β = lg [ A E a R G ( α ) ] 2.315 0.4567 E a R T
where β represents the heating rate, A is the preexponential factor, R is the molar gas constant, G(α) is the integral form of the reaction mechanism function in the formula, and T is the absolute temperature corresponding to the curing degree α.
Table 3 illustrates that as the accelerator content increased, the probability of effective collisions between molecules increased, making the system easier to crosslink and cure. The reaction was facilitated, and therefore, the activation energy was lower [15]. This can be explained by the curing reaction mechanism. It is known that an anhydride curing reaction in the presence of BDMA is activated by the attack of a Lewis base accelerator on the anhydride. The main reactions are [29]:
(1)
The accelerator attacks the anhydride to generate carboxylate anion, as shown in Figure 4a;
(2)
The carboxylate anion attacks the epoxy group and opens the epoxy group to generate an oxygen anion, as shown in Figure 4b;
(3)
Oxygen anions continue to attack other anhydride groups to form carboxylate anions, as shown in Figure 4c.
First, the tertiary amine of BDMA reacts with anhydride groups to form carboxylate anions and participates in the curing reaction as a reaction center. The increase in the accelerator content increases the number of reaction centers. Secondly, the increase in the accelerator content intensifies the exothermic reaction process. Thus, the heating release rate becomes faster; the migration of molecular chains and groups is promoted. Therefore, in light of these two factors, the activation energy of diffusion is reduced.

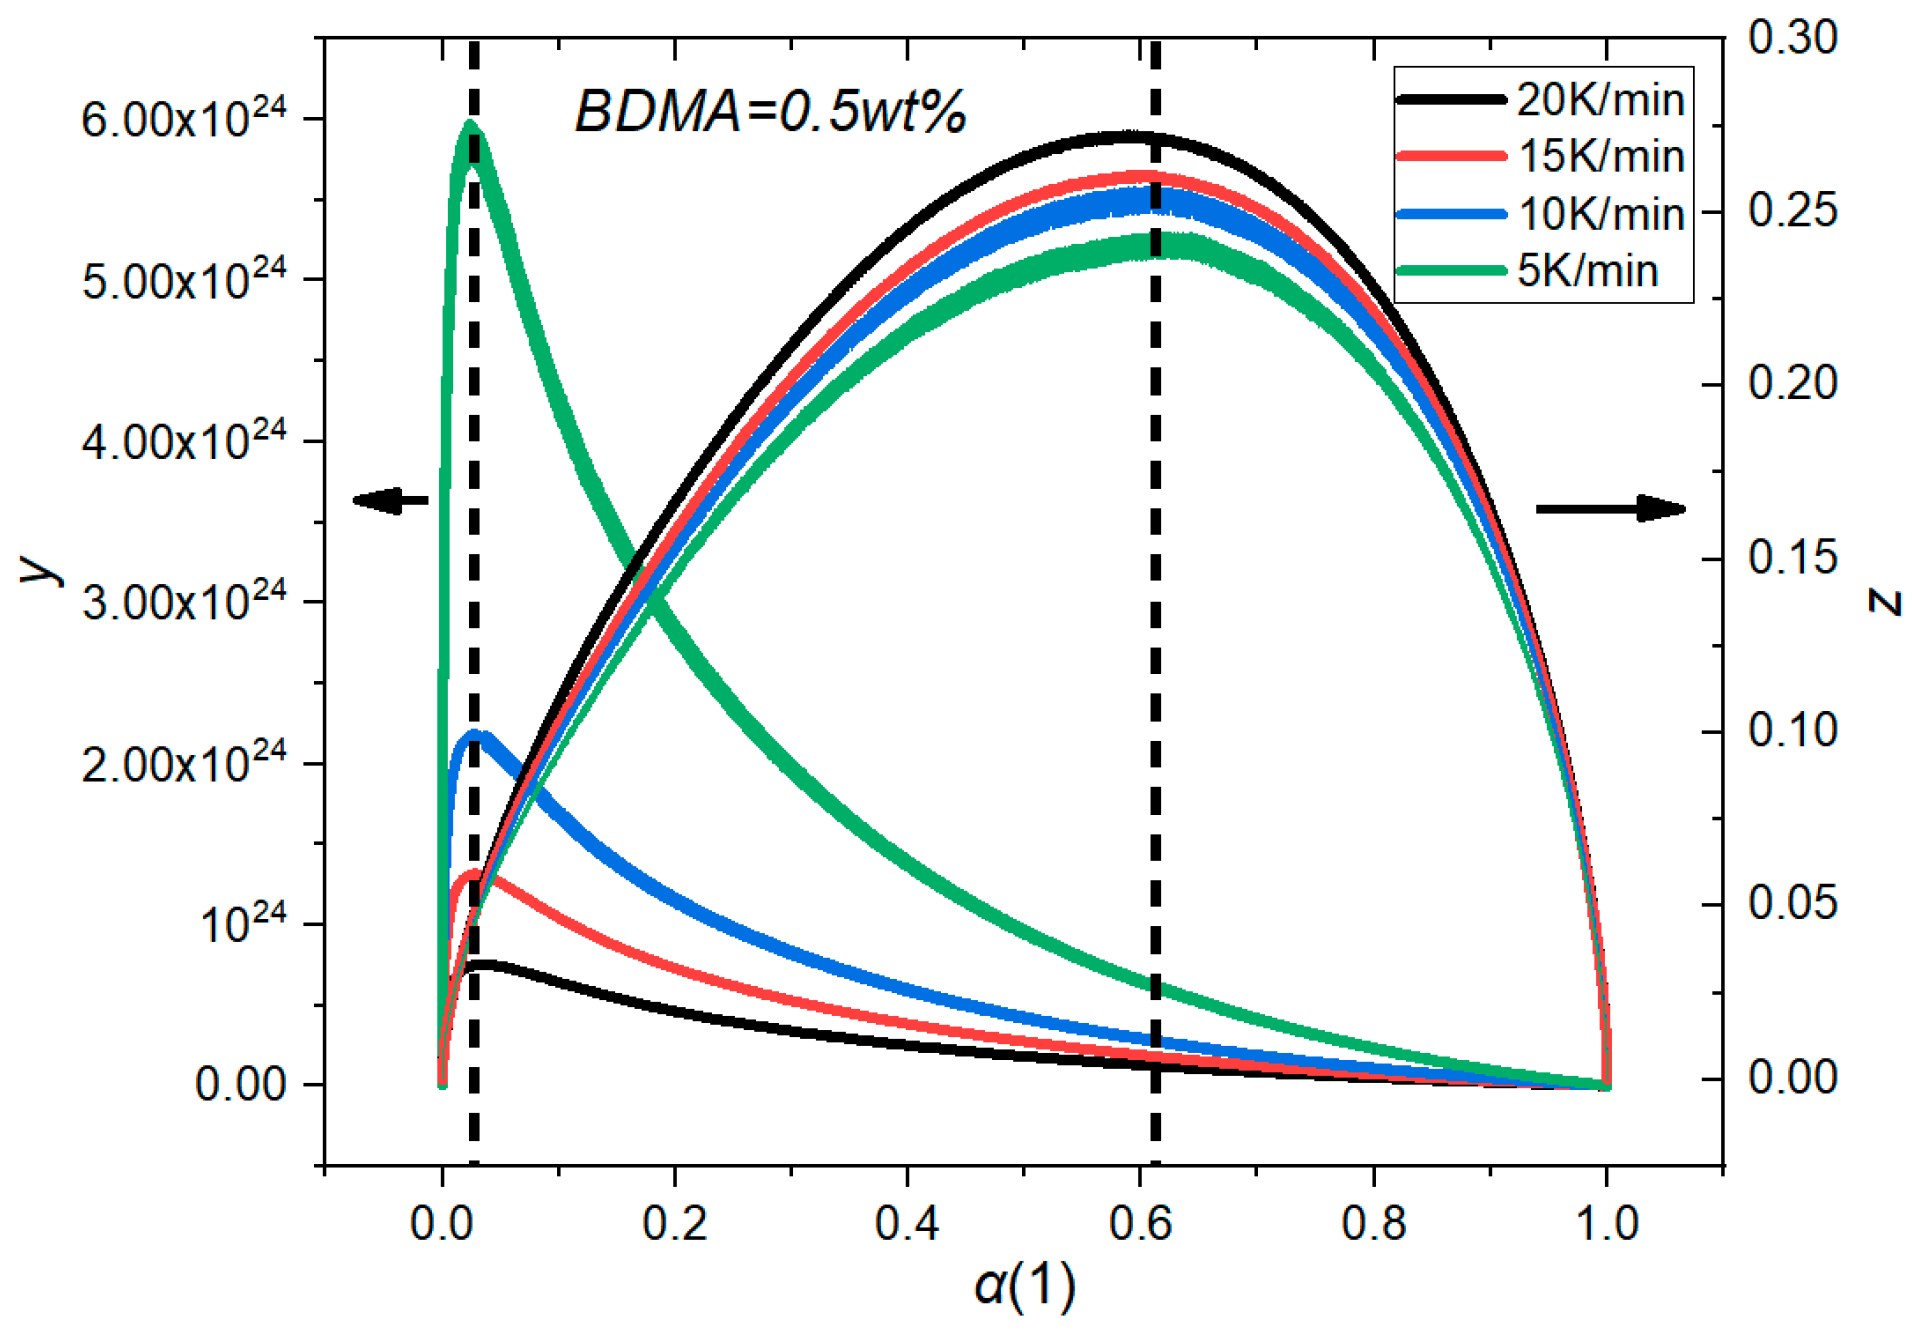
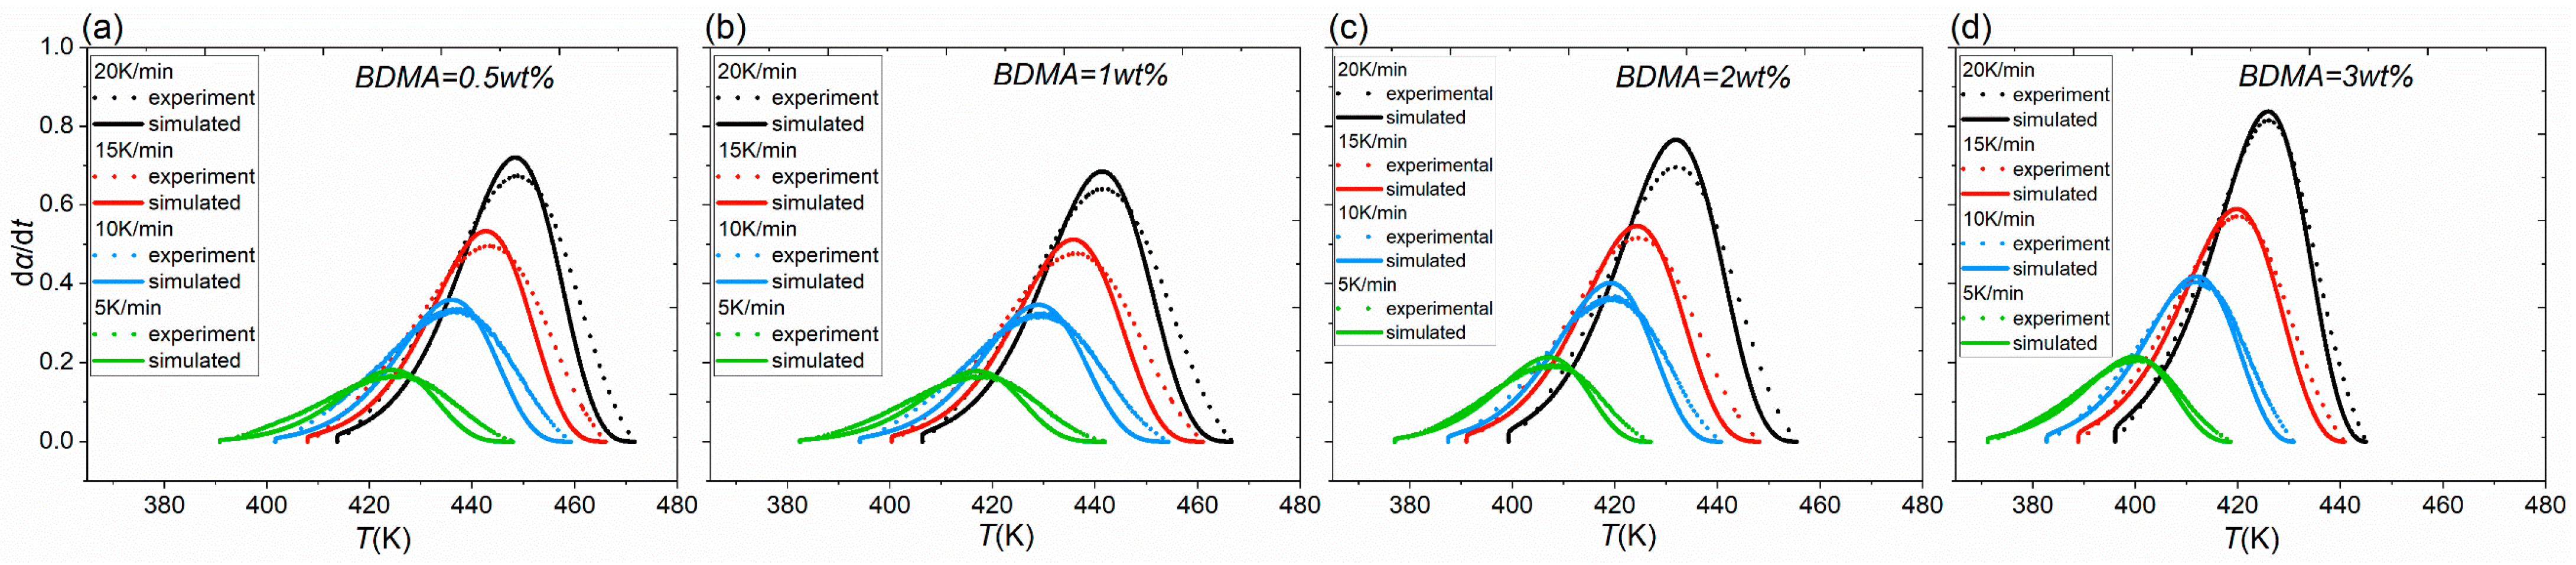
3.2. Determine the Curing Reaction Model

The Málek method is a common method for calculating the kinetic parameters to determine the curing kinetic model at different heating rates. The reaction mechanism function f(α) of different systems can be determined by three special functions of the Málek method, as shown in Equations (5)–(7) [30]
y ( α ) = d α d t e λ
z ( α ) = π ( λ ) d α d t T β
π ( λ ) = λ 3 + 18 λ 2 + 88 λ + 96 λ 4 + 20 λ 3 + 120 λ 2 + 240 λ + 120
where λ = Ea/RT, e is the natural exponential, and β is the heating rate. The DSC curve is differentiated to obtain the functional relationship diagram between /dt and α. The data are substituted into Equations (5)–(7) to obtain the functional relationship diagram between y(α), z(α), and α [31]. This is shown in Figure 5, which takes BDMA = 0.5 wt.% as an example.
The reaction mechanism was analyzed by the characteristic values αM and αp, with the conversion rate αM corresponding to the maximum value of y(α) and the conversion rate αp corresponding to the maximum reaction rate of z(α). The results showed that 0 < αM < 1 and αp ≠ 0.632 at different heating rates, which indicated that the curing reaction was an autocatalytic reaction and is able to be described by the Sestak–Berggren(SB) two-parameter model [32]. The SB(m,n) model describes the maximum reaction rate within a period of time after the start of curing. The function y(α) is proportional to the kinetic equation, so it can represent the reaction rate of the curing system to a certain extent, which is in accordance with the results in Figure 5. The curing reaction kinetics equation of the SB(m,n) model can be expressed by Equation (8).
d α d t = A exp ( E a R T ) α m ( 1 α ) n
In the formula, m and n are the reaction order. Let p = m/n = αM(1 − αM), put p into the formula, and take the logarithm on both sides to sort out the Equation (9).
ln ( d α d t exp ( E a R T ) ) = ln A + n ln ( α p ( 1 α ) )
Plotting and linear fitting ln((/dt)exp(Ea/RT)) versus ln(αp(1 − α)) in the range of 0.1 < α < 0.9, n and lnA can be extracted from the slope and the intercept of the fitting, respectively, calculating the value of m according to p = m/n [33,34,35]. The values of m, n, and lnA were basically the same at different heating rates, indicating that the Málek method can ensure the uniqueness of the rate equation during non-isothermal curing. Table 4 shows the average values of m, n, and A for different heating rates and the curing kinetic model.
To some extent, m represents an autocatalytic reaction and n stands for a non-autocatalytic reaction. The result that m, n ≠ 0 demonstrates that the autocatalytic reaction and the non-autocatalytic reaction occur simultaneously. The values of A and n monotonously decrease and m monotonously increases. The increasing value of m indicates an increasing contribution of the autocatalytic reaction to the curing reaction. However, for the entire system, the value of m is much smaller than the value of n. In other words, although the E51/MeTHPA system is subordinate to the autocatalytic reaction, the contribution of the non-autocatalytic reaction is much greater than that of the autocatalytic reaction. This indicates that the autocatalytic properties of the system are not dominant and high temperatures are required to induce the curing reaction.
The curing kinetic model was compared with the experimental data to verify its correctness and the results are shown in Figure 6. It can be seen that some deviations occurred in the later stage of the curing reaction, which were caused by the transformation from the activity control to the diffusion control of the chemical reaction as the temperature increased. As a result, the activity of the reactive group was limited, and the reaction rate of the system was significantly reduced. This deviation can be interpreted as a lower curing degree for simulations. To achieve the same curing degree, the simulated cure time needs to be longer than the actual cure time. Nevertheless, in terms of the overall fit, the reaction experimental data were well fitted by the SB model generally [36]. This shows that the obtained kinetic equation is suitable to describe the non-isothermal curing process, which further proves the correctness of the curing kinetic model.

3.3. Simulation of a HVDC Bushing Capacitor Core

In order to study the temperature distribution and the curing degree of an 800 kV bushing capacitor core during curing, the internal curing process was simulated on the basis of the curing reaction kinetics obtained above. With the intention of forming a “refill” effect, bottom heating was generally used during the actual curing process of bushing [37]. Figure 7 shows the temperature and the curing degree distribution of the capacitor core at different times during the curing process. For a more complete display of the geometric model, the coordinate scale is included.
From the simulation results, the curing time was found to be about 960 h, which is similar to that of the actual production and further validated the reliability of the simulation. As can be seen from Figure 7a, the temperature transfer takes place from the bottom to upwards of the capacitor core, generating a noticeable axial temperature gradient. Due to the poor thermal conductivity of epoxy resin, the center temperature of the capacitor core rises slowly. The bottom temperature is higher than the top temperature at all times. It is clear from the Figure 7b that the boundaries of the capacitor core were cured first. The existence of temperature gradients leads to the uneven heating of the capacitor core. As curing degree is a function of temperature, this also leads to inconsistent curing in different temperature zones. This asynchronous curing in turn results in internal stresses and quality defects.
As can be seen in Figure 7b, the epoxy resin was cured at the bottom probe after 10 h of heating and the curing history was relatively complete by reason of the priority curing at the bottom, so it was deemed reasonable to carry out a comparison of temperature differences at 10 h. Therefore, in this simulation model, a boundary probe is arranged along the radial direction at the bottom of the capacitor core in order to obtain the radial temperature and curing degree distribution, as shown in Figure 8.
Figure 8 shows the maximum radial temperature difference for the simulation results for 10 h of curing. More specifically, in the range of 0.5 wt.% to 3 wt.%, the radial temperature difference tends to increase and then decrease as the accelerator content increases. In practice, the lower the radial temperature gradient of the capacitor core during the curing process, the lower the residual stress and the higher the reliability of the cured product.
The record of temperatures and curing degrees at different accelerator contents is shown in Figure 9. At 960 h, it is difficult to make a comparison, considering that the curing degrees of 1 wt.%, 2 wt.%, and 3 wt.% are all a value of 1. As can be seen in Figure 9b, the curing degree at 800 h is close to the final curing degree. After 800 h, the curing degree differences among these groups are obvious enough to be observed and analyzed. More importantly, the ranking of the curing degrees remains the same. As a result, the curing degree results at 800 h have been chosen for comparison and shown in Figure 9b. First of all, it can be clearly seen from Figure 9 that the temperature and the curing degree were not synchronized, namely, a high temperature did not correspond to a high curing degree. Secondly, the temperature tended to decrease and then increase, while the curing degree tended to increase and then decrease with accelerator content in the range from 0.5 wt.% to 3 wt.%.
When the accelerator content was below a certain value, the curing system with a higher accelerator content had a shorter curing time and its reaction rate became faster as the reaction proceeded. As the temperature was in the process of increasing, the activity of the system became higher, as well as the probability of intermolecular collisions.
When the accelerator content was relatively high, the curing degree decreased instead, which can be explained in the following three ways:
(1)
Positive and negative radicals collided to form molecules, which is the reverse reaction of the curing agent decomposition reaction. Due to the excessive use of an accelerator, the reverse reaction rate between the accelerator and the primary radical was greater than the rate of the primary radical initiating monomer. The conversion rate decreased, namely, the product performance was reduced [38].
(2)
Owing to the accelerator content increase, the violent reaction resulted in a lack of adequate gel time for the system. Some of the monomers were not involved in the cross-linking reaction, which is one of the reasons for the low overall exothermic levels and the low rate of temperature rise [39].
(3)
The lack of a sufficient exothermic peak temperature triggered the continuous release of free radicals from the curing agent, reducing the cross-linking reaction and thus, resulted in permanent under-curing.
The above results show that the curing properties did not vary monotonically with the accelerator content, namely, the fixed amount of heat being released when a certain amount of epoxy resin is cured. However, the heat release rate, the temperature rise rate, and the maximum temperature that the system could reach depended on many factors, such as the accelerator content and the volume of the casting system [40].
Comparing Figure 8 and Figure 9, the effect of accelerator content on the curing characteristics of capacitor cores can be assessed in terms of both the maximum radial temperature difference and the overall curing degree of the capacitor core. However, both of these increase and then decrease with increasing accelerator content, indicating a contradiction between them. Therefore, this should ensure a small radial temperature difference and a sufficient curing degree, as well as an appropriate curing temperature and curing time.

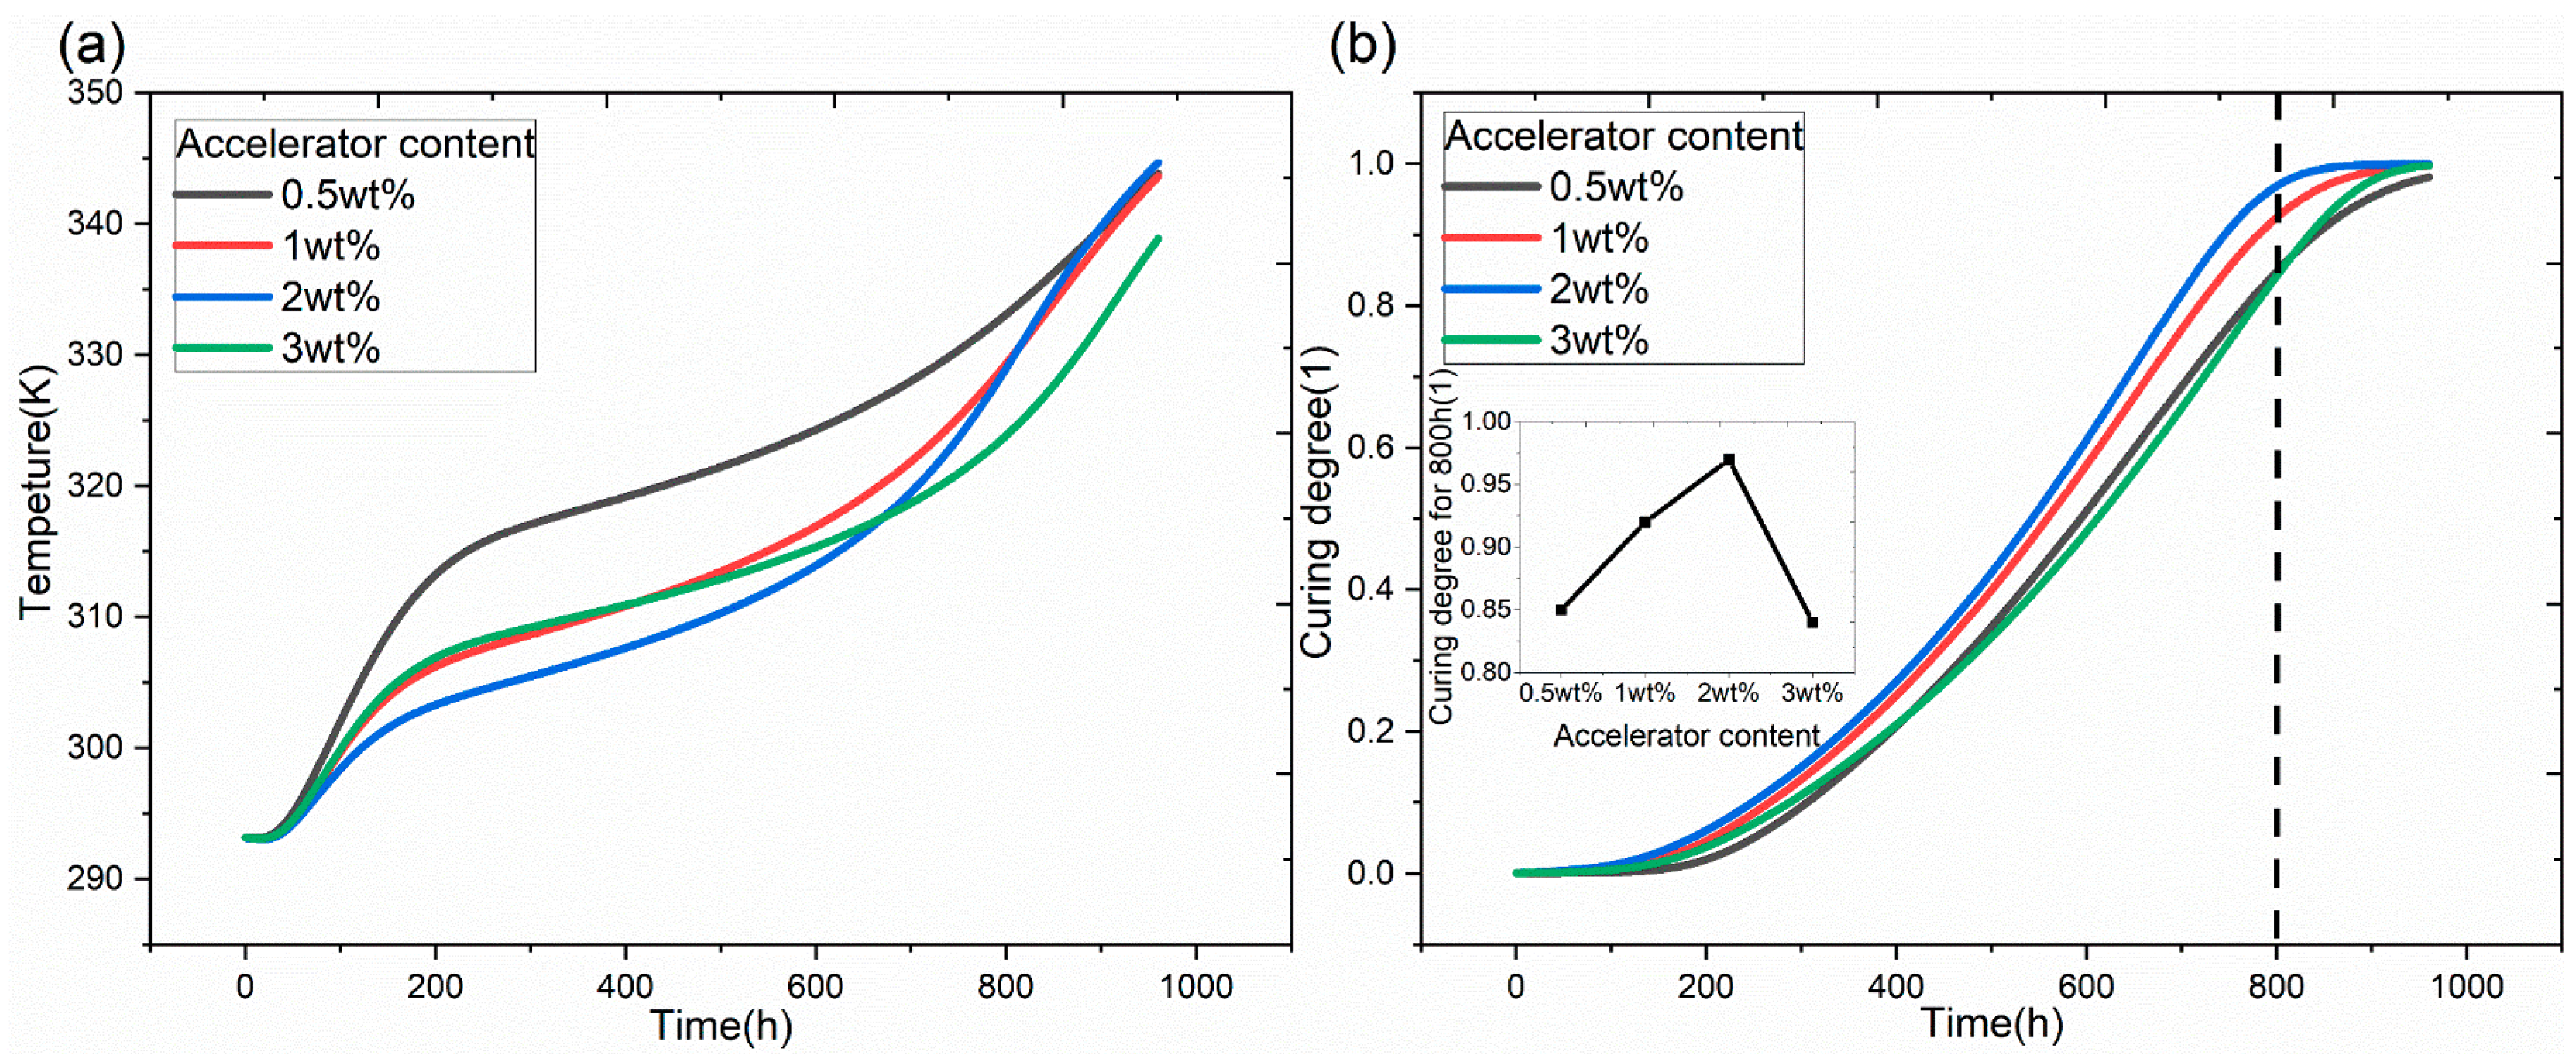
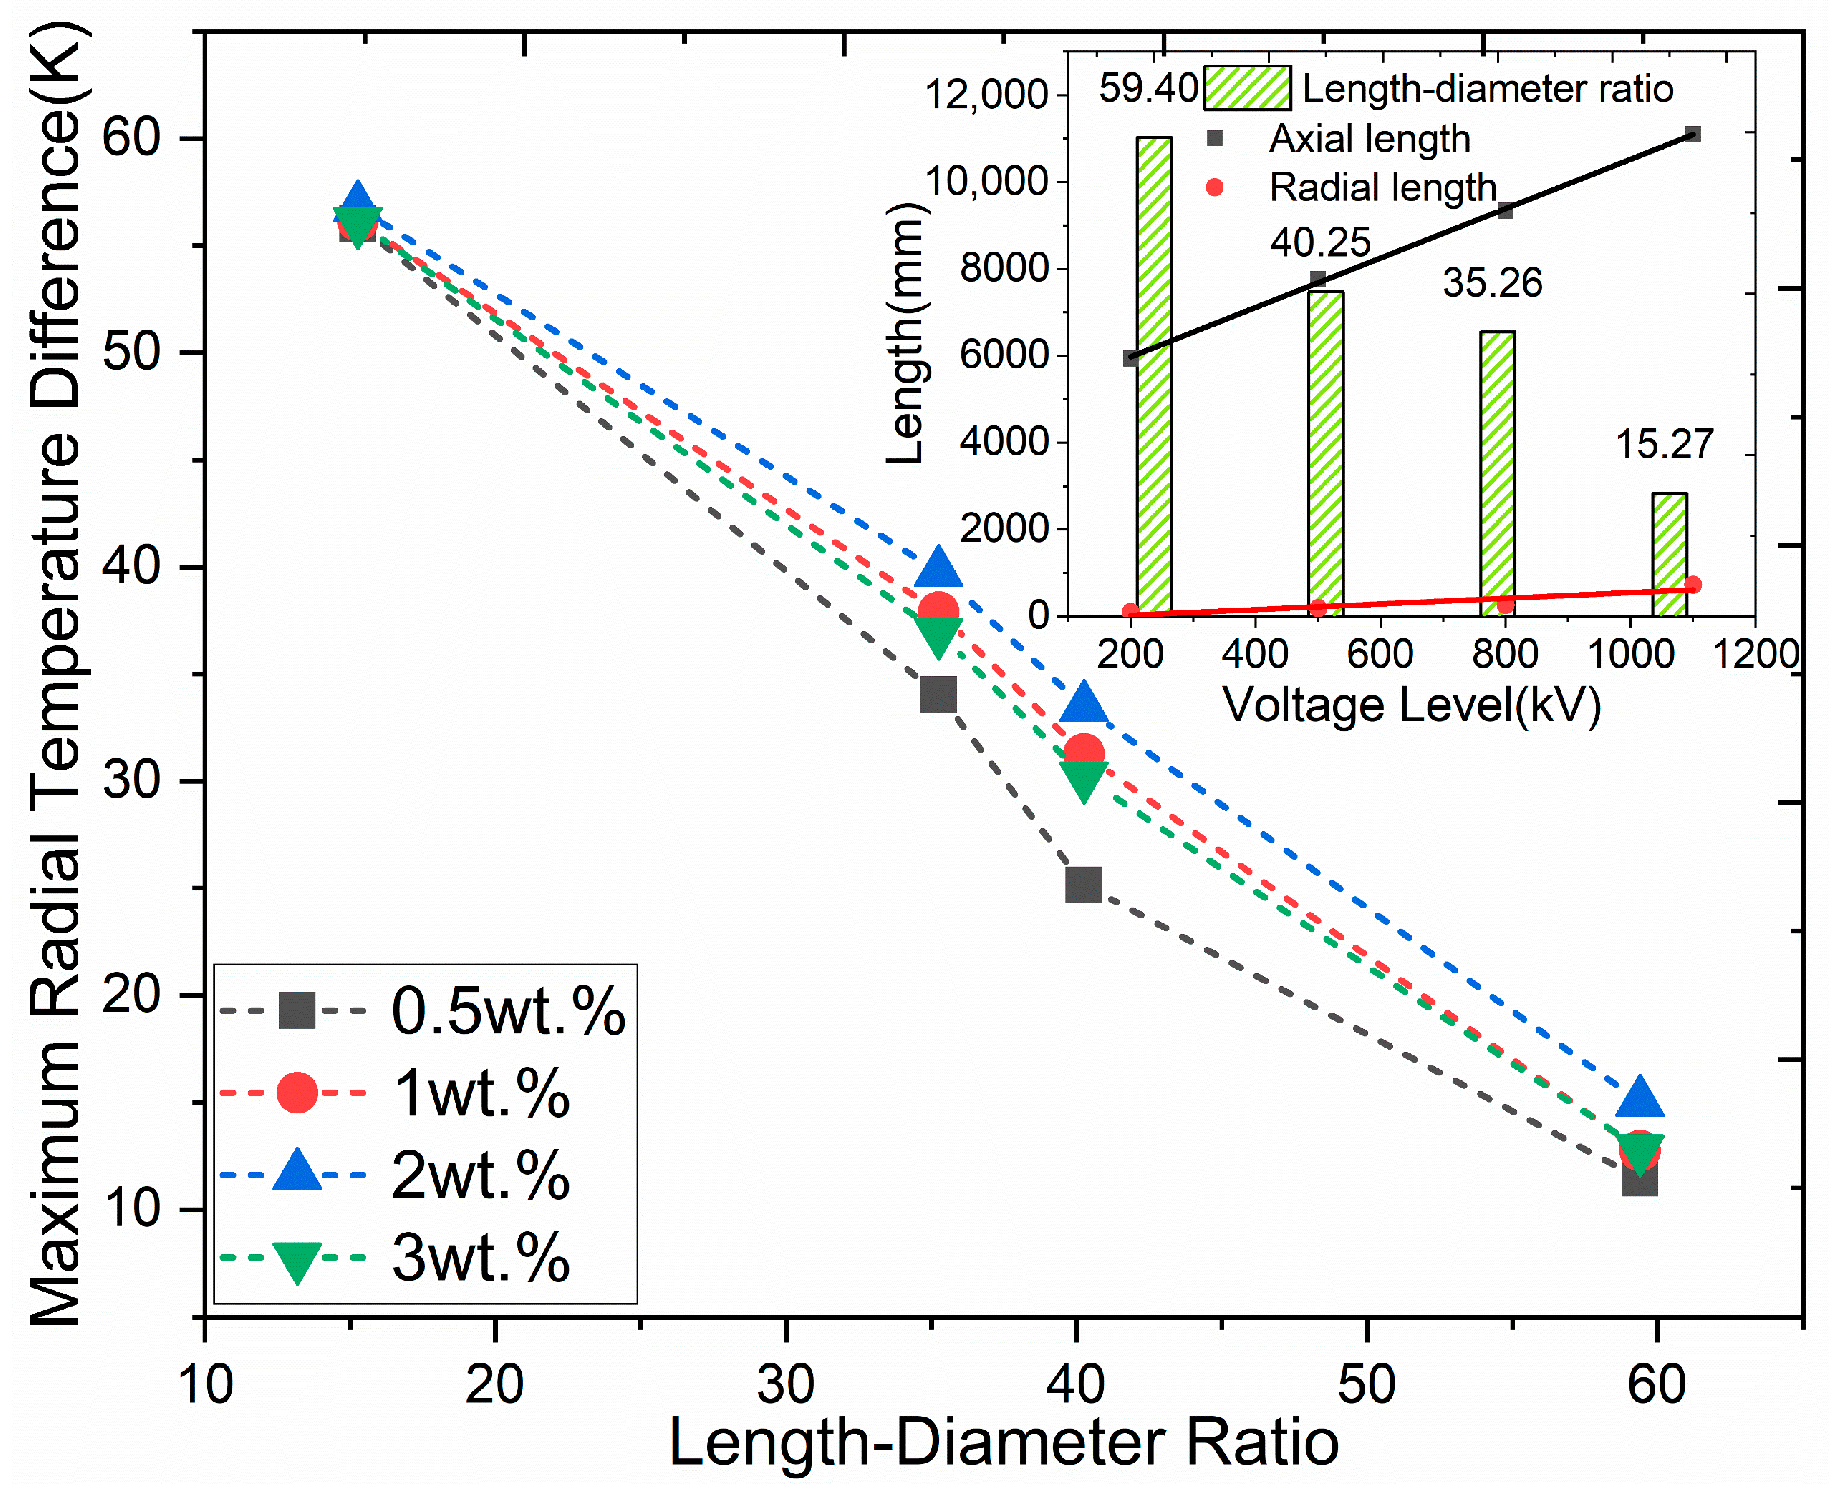
3.4. Effect of Bushing Size on the Curing Process

Next, we consider the effect of bushing size on the curing process due to the complex curing behavior of the large-volume capacitor core. In this paper, the temperature distribution and stress–strain evolution process of ultra high voltage (UHV) bushing during curing was investigated based on the structural parameters of bushing at 200 kV, 500 kV, 800 kV, and 1100 kV [41,42,43]. The radial temperature difference induced by the accelerator contents became obvious near the 40 h mark. A large temperature difference induced a significant stress concentration, which leads to insulation defects. Therefore, the data at 40 h were chosen for comparison. The maximum radial temperature difference for different voltage levels and bushing sizes with different accelerator contents is shown in Figure 10. As the voltage level increases, the length–diameter ratio decreases, and the maximum radial temperature difference increases continuously. Meanwhile the radial length growth rate is greater than the axial; its effect on the temperature distribution is more significant.
Figure 11 shows the variations of curing degree and stress with temperature for the different voltage levels of bushing when BDMA = 1 wt.%. Firstly, the curing degree changed with the temperature in an “S” shape because the reaction rate is at first slow, then fast, and then slow again at the end [44,45]. Secondly, the onset and endset temperatures decreased with the increasing voltage level. This is mainly because the larger-volume epoxy resin requires a longer gel time, which allows enough time for the epoxy resin molecules to align neatly and reduces the activation energy. In addition, the stress becomes greater as the temperature increases. As the voltage level increases, the temperature of stress initiation decreases. Due to the inhomogeneity caused by the large-size bushing, the change in stress significantly lagged behind the curing process, and the stress reached its maximum value after the curing was completed.
Figure 12 shows the relationship between the length–diameter ratio, accelerator content, and peak strain. As can be seen, the strain peak decreased and then increased with increasing accelerator content; the strain peak temperature decreased and the strain peak increased as the voltage level increased. The same trend in strain is evident at different voltage levels. The strain curve can be roughly divided into five stages. In the first stage, the epoxy resin is in a viscous flow state, thermal expansion and chemical shrinkage do not contribute to the internal stress, and the strain is level is zero. In the second stage, the epoxy resin starts to gel; thermal expansion and chemical shrinkage occur simultaneously, so the strain starts to decrease. In the third stage, as temperature rises continually, the effect of thermal expansion is greater than the chemical shrinkage, and the strain level starts to rise. In the fourth stage, the chemical shrinkage of the epoxy resin dominates. When the temperature tends to be constant, the strain decreases as only chemical shrinkage remains active. In the fifth stage, the thermal shrinkage of the epoxy resin dominates, and the final residual strain is about 0.015. The trend was the same for different accelerator contents. With increasing voltage levels, the bushing length–diameter ratio decreased and the strain peak increased. This indicates that the increase in radial length amplified the effect of thermal expansion [46].

4. Conclusions

Based on the curing kinetic analysis of the E51/MeTHPA/BDMA system, coupled with the transient Fourier heat transfer model and a solid mechanical field, a curing simulation of the capacitor core of HVDC bushing was performed. The effect of the accelerator content on the distribution of temperature, the curing degree, and the stress–strain of large-size bushing was investigated, and the following conclusions were obtained:
(1)
As the accelerator content increases, the enthalpy increases, the activation energy decreases, and the curing reaction occurs at a lower temperature.
(2)
The obtained curing kinetic model shows that in the range from 0.5 wt.% to 3 wt.%, as the accelerator content increases, the preexponential factor A decreases, the order of reaction m increases, and n decreases. The value of n is always greater than m, and the curing process can be represented well by the Sestak–Berggren autocatalytic model.
(3)
The finite element simulation results show that as the accelerator content increases, the overall degree of curing of the capacitor core and the maximum radial temperature difference both increase and then decrease, and the strain peak decreases and then increases. As the voltage level increases, both the maximum radial temperature difference and the peak strain increase, which is mainly attributable to the larger radial length.

Author Contributions

Conceptualization, formal analysis, investigation, data curation, and writing—review and editing, C.T. and X.W.; methodology, resources, writing—original draft preparation, software, project administration, and funding acquisition, Y.Z. (Yuanxiang Zhou); validation, visualization, and supervision, Y.Z. (Yunxiao Zhang), X.H. and J.C. All authors have read and agreed to the published version of the manuscript.

Funding

This research was funded by the National Natural Science Foundation of China (No.52037009 and No.51907101) and a grant-in-aid for scientific research from the National Natural Science Foundation of China (No.51977186).

Institutional Review Board Statement

Not applicable.

Informed Consent Statement

Not applicable.

Data Availability Statement

Not applicable.

Acknowledgments

We thank all the reviewers for their valuable comments for the improvement of our manuscript.

Conflicts of Interest

The authors declare no conflict of interest.

References

  1. Brent, A.C. Renewable energy for sustainable development. Sustainability 2021, 13, 6920. [Google Scholar] [CrossRef]
  2. Khan, N.; Sudhakar, K.; Mamat, R. Role of biofuels in energy transition, green economy and carbon neutrality. Sustainability 2021, 13, 12374. [Google Scholar] [CrossRef]
  3. Batrancea, L.; Pop, M.C.; Rathnaswamy, M.M.; Batrancea, I.; Rus, M.I. An empirical investigation on the transition process toward a green economy. Sustainability 2021, 13, 13151. [Google Scholar] [CrossRef]
  4. Wu, J.; Tan, Z.; Wang, K.; Liang, Y.; Zhou, J. Research on multi-objective optimization model for hybrid energy system considering combination of wind power and energy storage. Sustainability 2021, 13, 3098. [Google Scholar] [CrossRef]
  5. Wei, C.; Zhao, Y.B.; Zheng, Y.F.; Xie, L.Y.; Smedley, K. Analysis and design of a non-isolated high step-down converter with coupled inductor and ZVS operation. IEEE Trans. Ind. Electron. 2021, 1. [Google Scholar] [CrossRef]
  6. Du, B.X.; Wang, Q.; Tu, Y.P.; Tanaka, Y.; Li, J. Guest editorial: Advanced materials for HVDC insulation. High Volt. 2020, 5, 351–352. [Google Scholar]
  7. Liu, Y.X.; Hu, M.Z.; Dai, Q.M.; Le, H.F.; Liu, Y. Online recognition method of partial discharge pattern for transformer bushings based on small sample ultra-micro-CNN network. AIP Adv. 2021, 11, 045221. [Google Scholar] [CrossRef]
  8. Xie, L.Y.; Guo, X.; Wei, C.; Zhang, Y.B.; Chen, Y.; Liang, C.B.; Xue, Y.T.; Zhao, E. adaptive droop control of the MTDC system with high-capacity energy storage based on dynamic and static power decoupling method. Front. Energy Res. 2021, 10, 9. [Google Scholar] [CrossRef]
  9. Xie, Q.; Liang, S.D.; Liu, B.W.; Fu, K.X.; Zhan, Z.Y.; Lu, L.; Yang, X.M.; Lu, F.C.; Huang, Z.Y. Structure, microparameters and properties of crosslinked DGEBA/MTHPA: A molecular dynamics simulation. AIP Adv. 2018, 8, 075332. [Google Scholar] [CrossRef] [Green Version]
  10. Yi, X.L.; Kuang, X.; Kong, L.; Dong, X.; Feng, Z.H.; Wang, D.J. A simplified chemorheological model of viscosity evolution for solvent containing resol resin in RTM process. J. Appl. Polym. Sci. 2017, 134, 45282. [Google Scholar] [CrossRef]
  11. Duan, Y.J.; Gao, Y.W. Delamination and current-carrying degradation behavior of epoxy-impregnated superconducting coil winding with 2G HTS tape caused by thermal stress. AIP Adv. 2020, 10, 025320. [Google Scholar] [CrossRef]
  12. Lin, P.Y.; Lee, S. Modeling and characterization of cure-dependent viscoelasticity of molded underfill in ultrathin packages. IEEE Trans. Compon. Packag. Manuf. Technol. 2020, 10, 1491. [Google Scholar] [CrossRef]
  13. Kiattipornpithak, K.; Thajai, N.; Kanthiya, T.; Rachtanapun, P.; Noppol Leksawasdi, P.; Phimolsiripol, Y.; Rohindra, D.; Ruksiriwanich, W.; Sommano, S.R.; Jantanasakulwong, K. Reaction mechanism and mechanical property improvement of poly(lactic acid) reactive blending with epoxy resin. Polymers 2021, 13, 2429. [Google Scholar] [CrossRef] [PubMed]
  14. Teng, C.Y.; Zhou, Y.X.; Zhang, L.; Zhang, Y.X.; Huang, X.; Chen, J.N. Improved electrical resistivity-temperature characteristics of insulating epoxy composites filled with polydopamine-coated ceramic particles with positive temperature coefficient. Compos. Sci. Technol. 2022, 221, 109365. [Google Scholar] [CrossRef]
  15. Wei, W.; Sun, X.; Ye, W.T.; Zhang, B.W.; Fei, X.M.; Li, X.J.; Liu, X.Y. Thermal latent curing agent for epoxy resins from neutralization of 2-methylimidazole with a phosphazene–containing polyfunctional carboxylic acid. Polym. Adv. Technol. 2021, 31, 4884. [Google Scholar] [CrossRef]
  16. Li, C.Y.; Zhang, R.; Wang, G.P.; Shi, Y.M. The mechanical properties of epoxy resin composites modified by compound modification. AIP Adv. 2018, 8, 105325. [Google Scholar] [CrossRef] [Green Version]
  17. Teng, C.Y.; Zhou, Y.X.; Li, S.H.; Zhang, L.; Zhang, Y.X.; Zhou, Z.L.; Zhao, L. Regulation of temperature resistivity characteristics of insulating epoxy composite by incorporating positive temperature coefficient material. IEEE Trans. Dielectr. Electr. Insul. 2020, 27, 512–520. [Google Scholar] [CrossRef]
  18. Sun, X.; Wang, Y.M.; Tang, Y.Y.; Zhang, B.W.; Wei, W.; Li, X.J.; Fei, X.M.; Liu, X.Y. Synthesis ofisocyanurate-based imidazole carboxylate as thermal latent curing accelerator for thermosetting epoxy resins. J. Appl. Polym. Sci. 2020, 137, 49221. [Google Scholar] [CrossRef]
  19. Hubbard, R.L. Low-temperature processing of electronic materials using uniform microwave fields. IEEE Trans. Electron Devices 2021, 68, 3170. [Google Scholar] [CrossRef]
  20. Teng, C.Y.; Zhou, Y.X.; Wu, C.; Zhang, L.; Zhang, Y.X.; Zhou, W.J. Optimization of the temperature-dependent electrical resistivity in epoxy/positive temperature coefficient ceramic nanocomposites. IEEE Trans. Dielectr. Electr. Insul. 2021, 28, 468–475. [Google Scholar] [CrossRef]
  21. Nikzamir, M.; Mortezaei, M.; Jahani, M. Effect of surface area of nanosilica particles on the cure kinetics parameters of an epoxy resin system. J. Appl. Polym. Sci. 2019, 34, 136. [Google Scholar] [CrossRef]
  22. Dong, H.X.; Lia, Y.H.; Zhang, J.; Liu, L.J.; Cao, L.Y.; Ming, P.J.; Liu, W.J.; Zhang, C.H.; Liu, L.H.; Wei, H. Kinetics simulation and a novel curing procedure to avoid thermal shock during the curing process of epoxy composites. RSC Adv. 2016, 70, 65533. [Google Scholar] [CrossRef]
  23. Pi, B.S.; Yu, H.P.; Qin, F.; Chen, P.; Cai, A.W. Thermal conductivity of epoxy resin using molecular dynamics simulation. In Proceedings of the 2018 19th International Conference on Electronic Packaging Technology (ICEPT), Shanghai, China, 8–11 August 2018. [Google Scholar]
  24. Ma, B.; Wang, X.Q.; Zhou, X.Y.; Wei, K.; Huang, W. Measurement and analysis of thermophysical parameters of the epoxy resin composites shape-stabilized phase change material. Constr. Build. Mater. 2019, 223, 368. [Google Scholar] [CrossRef]
  25. Liu, Y.H.; Lin, Y.; Wang, L.; Wang, H.N. Internal curing reaction and numerical analysis of temperature field of cycloaliphatic epoxy resin insulators. High Volt. Eng. 2020, 46, 1986. [Google Scholar]
  26. Wang, L.; Yuan, D.P.; Hao, L.C.; Kan, C.H.; Wang, B. Effect of oven structure on insulator temperature field distribution during curing process. High Volt. Eng. 2019, 45, 2748. [Google Scholar]
  27. Kolyshkin, V.A.; Kerber, M.L.; Gorbunova, I.Y. Study of the effect of the accelerator content on the properties of an adhesive composite based on epoxy resin ED-22 and dicyanodiamine. Int. Polym. Sci. Technol. 2006, 33, 37. [Google Scholar] [CrossRef]
  28. Hayaty, M.; Honarkar, H.; Beheshty, M.H. Curing behavior of dicyandiamide/epoxy resin system using different accelerators. Iran. Polym. J. 2013, 22, 591–598. [Google Scholar] [CrossRef]
  29. Zhao, Y.S.; He, Y.H.; Yang, K.R.; Wang, X.P.; Bai, J.H.; Du, B. Improving the surface insulating performance of epoxy resin-Al2O3 composite materials by extending chain of liquid epoxy resin with Me-THPA. High Volt. 2020, 5, 472–481. [Google Scholar] [CrossRef]
  30. Yang, T.; Zhang, C.F.; Zhang, J.Y.; Cheng, J. The influence of tertiary amine accelerators on the curing behaviors of epoxy/anhydride systems. Thermochim. Acta 2014, 577, 11. [Google Scholar] [CrossRef]
  31. Wu, F.; Zhou, X.P.; Yu, X.H. Reaction mechanism, cure behavior and properties of a multifunctional epoxy resin, TGDDM, with latent curing agent dicyandiamidet. RSC Adv. 2018, 8, 8248. [Google Scholar] [CrossRef] [Green Version]
  32. Zhang, C.F.; Liu, X.D.; Cheng, J.; Zhang, J.Y. Study on curing kinetics of diglycidyl 1,2-cyclohexane dicarboxylate epoxy/episulfide resin system with hexahydro-4-methylphthalic anhydride as a curing agent. J. Therm. Anal. Calorim. 2015, 120, 1893. [Google Scholar] [CrossRef]
  33. Gibson, R.L.; Simmons, J.H.; Stitt, E.H.; West, J.; Wilkinson, S.K.; Gallen, R.W. Kinetic modelling of thermal processes using a modified Sestak-Berggren equation. Chem. Eng. J. 2021, 408, 127318. [Google Scholar] [CrossRef]
  34. Sakib, A.R.N.; Jha, V.; Mavinkurve, A.; Chopin, S. Reaction Kinetics and Rheological Model Coefficient Extraction for Epoxy Mold Compounds. In Proceedings of the 2018 17th IEEE Intersociety Conference on Thermal and Thermomechanical Phenomena in Electronic Systems (ITherm), San Diego, CA, USA, 29 May–1 June 2018. [Google Scholar]
  35. Li, C.; Liu, M.H.; Liu, Z.Y.; Qing, M.L.; Wang, G. DSC and curing kinetics of epoxy resin using cyclohexanediol diglycidyl ether as active diluents. J. Therm. Anal. Calorim. 2013, 116, 411. [Google Scholar] [CrossRef]
  36. Kelley, M.; Abdol, N.; Soroushian, P.; Keating, K.; Balachandra, A.M.; Meldrum, T. Monitoring real-time curing of epoxies in situ using single-sided NMR. J. Polym. Sci. 2020, 58, 616. [Google Scholar] [CrossRef]
  37. Lucio, B.; Fuente, J.L. Non-isothermal DSC and rheological curing of ferrocene-functionalized, hydroxyl-terminated polybutadiene polyurethane. React. Funct. Polym. 2016, 107, 60–68. [Google Scholar]
  38. Yang, Q.; Liang, G.Z. Sturdies on flexible unsaturated polyester resin from polyether gdycol and its flexible curing system. Thermosetting Resin 2007, 22, 9–12. [Google Scholar]
  39. Ma, J.X.; Hu, Z.Y.; Wang, Y.C. Rapid curing of epoxy resin /multithiol compounds at low temperature. Thermosetting Resin 2011, 26, 35–38. [Google Scholar]
  40. Li, X.Q.; Chen, W.B. Study of improving the adhesion of white unsaturated polyester primers. Shanghai Coat. 2015, 53, 6–10. [Google Scholar]
  41. Chen, M.; Liu, X.D.; Sun, Y.H.; Wu, Z.C.; Tang, H. Influence of material volume conductivity on electric field and surface charge of RIP valve-side bushing core under DC electro-thermal coupling stress. IEEE Trans. Dielectr. Electr. Insul. 2020, 27, 164–171. [Google Scholar] [CrossRef]
  42. Du, B.X.; Sun, H.L.; Jiang, J.P.; Kong, X.X.; Yang, W. Temperature-dependent electric field distribution in ±800 kV valve-side bushing insulation for a converter transformer. High Volt. 2021, 6, 106–115. [Google Scholar] [CrossRef]
  43. Wang, Q.Y.; Xie, G.S.; Tian, H.D.; Peng, Z.R.; Yang, X. Impact of temperature on the transient DC field distribution of ±1100 kV UHVDC wall bushing. IEEE Trans. Power Deliv. 2021, 36, 1449–1457. [Google Scholar] [CrossRef]
  44. Yu, S.Z.; Li, X.D.; Zou, M.S.; Li, Z.R.; Wang, S.; Wang, D.H. Tetrafunctional epoxy resin-based buoyancy materials curing kinetics and properties. Polymers 2020, 12, 1732. [Google Scholar] [CrossRef]
  45. Geramil, G.; Bagheril, R.; Darvishi, R. Investigation of isothermal and dynamic cure kinetics of epoxy resin/nadic methyl anhydride/dicyandiamide by differential scanning calorimetry (DSC). J. Therm. Anal. Calorim. 2018, 7961. [Google Scholar]
  46. Yamaguchi, H.; Enomoto, T.; Sato, T. Stress Variation Analysis during Curing Process of Epoxy Underfill. In Proceedings of the 2014 International Conference on Electronics Packaging (ICEP), Toyama, Japan, 23–25 April 2014. [Google Scholar]
Figure 1. Capacitor core curing simulation model.
Sustainability 14 03393 g001
Figure 2. (ad) represent dynamic curing DSC curves at different accelerator content.
Sustainability 14 03393 g002
Figure 3. The influence of different accelerator content on characteristic temperature and peak height.
Sustainability 14 03393 g003
Figure 4. Reaction mechanisms of the acid anhydride system under the effect of BDMA. (a) The accelerator attacks the anhydride. (b) The carboxylate anion attacks the epoxy group. (c) Oxygen anions attack other anhydride groups.
Sustainability 14 03393 g004
Figure 5. Relationship between y(α), z(α), and α.
Sustainability 14 03393 g005
Figure 6. (ad) represent the comparison of experimental values with the calculated values of autocatalytic models at different accelerator contents.
Sustainability 14 03393 g006
Figure 7. Cloud diagrams (a,b) represent the simulation results of the temperature and the curing degree fields for 10 h, 100 h, 600 h, and 960 h.
Sustainability 14 03393 g007
Figure 8. Maximum temperature differences for 10 h curing for different groups.
Sustainability 14 03393 g008
Figure 9. (a,b) represent temperature and curing degree histories at different accelerator contents.
Sustainability 14 03393 g009
Figure 10. Effect of length–diameter ratio and accelerator content on the maximum temperature.
Sustainability 14 03393 g010
Figure 11. Relationship between the curing degree, stress, and temperature with different voltage levels of bushing.
Sustainability 14 03393 g011
Figure 12. Relationship between the strain peak and length–diameter ratio with different accelerator contents.
Sustainability 14 03393 g012
Table 1. Relevant parameters of epoxy resin material.
Matrix Materialkx,y,z/[W (m K)−1]C/[J (kg K)−1]ρ/[kg m−3]
Epoxy Resin0.16 × (1 − α) + 0.22α1763 × (1 − α) + 1171α1109 × (1 − α) + 1169α
Table 2. Variation of enthalpy with accelerator content.
Accelerator Content0.5 wt.%1 wt.%2 wt.%3 wt.%
Enthalpy [J g−1]126.52153.39161.56167.89
Table 3. The influence of different accelerator content on activation energy.
Accelerator Content0.5 wt.%1 wt.%2 wt.%3 wt.%
Activation Energy [kJ mol−1]186.36174.02165.05160.90
Table 4. m, n and A with different accelerator content.
Accelerator ContentAmn
0.5 wt.%1.79 × 10244.07 × 10−21.75
1 wt.%1.15 × 10235.33 × 10−21.74
2 wt.%6.98 × 10216.10 × 10−21.51
3 wt.%5.04 × 10207.39 × 10−21.31
0.5 wt.% d α d t = 1.79 × 10 24 exp ( 186363.43 R T ) α 0.04 ( 1 α ) 1.75 1 wt.% d α d t = 1.15 × 10 23 exp ( 174015.60 R T ) α 0.05 ( 1 α ) 1.74
2 wt.% d α d t = 6.98 × 10 21 exp ( 165052.20 R T ) α 0.06 ( 1 α ) 1.51 3 wt.% d α d t = 5.04 × 10 20 exp ( 160897.79 R T ) α 0.07 ( 1 α ) 1.31
Publisher’s Note: MDPI stays neutral with regard to jurisdictional claims in published maps and institutional affiliations.

