Article

Low-Carbon Governance, Fiscal Decentralization and Sulfur Dioxide Emissions: Evidence from a Quasi-Experiment with Chinese Heavy Pollution Enterprises

1
School of Economics & Trade, Hunan University, Changsha 410079, China
2
School of Economics & Trade, Hunan University of Technology and Business, Changsha 410205, China
3
School of Public Administration, Hunan University, Changsha 410079, China
*
Author to whom correspondence should be addressed.
Sustainability 2022, 14(6), 3220; https://doi.org/10.3390/su14063220
Submission received: 10 February 2022 / Revised: 3 March 2022 / Accepted: 4 March 2022 / Published: 9 March 2022

Abstract

:
This paper investigates the effects of enterprise environmental governance under low-carbon pilot policies in China with a difference in differences (DID) design. In examining the development of these policies, we focus on exploring their effects on sulfur dioxide emissions of heavily polluting enterprises based on prefectural city- and firm-level data. Overall, the policies significantly increased enterprise sulfur dioxide emission, and the underlying reason being that investments in carbon dioxide emissions control crowded out investment in sulfur dioxide emission control in enterprises in low-carbon pilot regions. We also find that the implementation of low-carbon pilot policies resulted in greater sulfur dioxide emission from state-owned enterprises and enterprises in western regions than from non-state-owned enterprises and those in eastern regions. It is further found that fiscal decentralization and the associated mediating effect of market segmentation promote enterprises’ carbon dioxide emissions control and inhibit their sulfur dioxide emission control. This study helps us re-examine the overall environmental effects of low-carbon policies and has implications for the revision and improvement of environmental governance policies in developing countries.

1. Introduction

With rapid economic development, air pollution caused by industrial production in China has become increasingly serious [1,2], with air pollution problems caused by emissions of carbon dioxide (CO2) and sulfur dioxide ( SO 2 ) becoming a particular focus of attention [3,4]. Poor air quality can lead to major public health and welfare problems [5]. Many cities around the world have constructed low-emission zones as an important measure to enhance urban competitiveness, reduce greenhouse emissions, decrease air pollution, and improve the resident well-being. In terms of academic research, scholars outside China have extensively investigated the role of low-emission zones in pollution governance [6,7,8]. Ellison et al. [6] explored the relationship between air quality in low-emission zones and that of surrounding regions before and after policy implementation and assessed the impact of low-emission policies implemented in London on regional air quality. Wolff [7] assessed the impact of low-emission area policies implemented in Europe on regional air quality by using a difference-in-differences (DID) design to determine the treatment effects across regions and over time. Gehrsitz [8] also used DID to investigate the effect of low-emission zone policies implemented in Germany on air quality and infant mortality. All of the above studies found that low-emission policies significantly improved air quality in the regions where the policies were implemented.
To improve air quality and control environmental pollution, the Chinese government has also developed and implemented a series of environmental governance measures [9,10], with the Low-Carbon Pilot Policy (LCPC) being one of the most important institutional arrangements. In July 2010, the Chinese government issued a notice on the first round of low-carbon provincial and municipal pilot programs and areas, including Guangdong, Guiyang, and 13 other provinces and cities. In November 2012, the “Notice on the Second Batch of Low-Carbon Provincial and Municipal Pilots” was issued, covering 29 provinces and cities such as Hainan and Zhenjiang. Numerous studies have shown that the LCPC has significantly reduced CO 2 emissions [11,12,13,14]. However, whether this policy can reduce emissions of SO 2 and gases other than CO 2 and improve overall environmental management is still an important issue of study that has not yet attracted active attention in academia.
Research literature focusing on the impact of the LCPC on SO 2 emissions is still scant. As a comprehensive environmental regulatory tool, the LCPC differs from traditional single environmental regulations in that its goal is to achieve emission reductions of CO 2 , SO 2 , and other pollutant gases [15,16], but it requires greater reductions of CO 2 than of SO 2 . Song et al. [17] used single-period DID to analyze the relationship between the LCPC and urban air pollution in China and found that the LCPC reduced the air pollution index (API) (The urban API includes a combined assessment of PM 10 ,   SO 2 ,   NO 2 , etc.) of pilot cities by fostering upgrades and innovation in the industrial structure. However, Peng et al. [18] found that the LCPC has no significant effect on SO 2 emissions in small and medium-sized cities and megacities based on a single-period DID.
It can be seen that the depth and breadth of the existing literature is far from adequate in terms of the mechanisms whereby the LCPC impacts SO 2 emissions. The LCPC places environmental regulatory pressure on enterprises in pilot regions and increases their actual pollution emission costs [16]. Regional governments attach much more importance to CO 2 than SO 2 emission reductions [13]. On the one hand, enterprises may invest in technology and equipment to reduce CO 2 and SO 2 emissions. On the other hand, to maximize profit and meet the higher CO 2 reduction targets, enterprises may increase their capital investment in CO 2 governance, which may crowd out funds for governance of other polluting gases such as SO 2 and result in an increase in enterprise emissions of these pollutants.
In addition, most of the existing literature evaluates the effects of the LCPC by using single-period DID designs, which may suffer from endogeneity problems. Specifically, the LCPC has been implemented in rounds, and samples covering different periods have different characteristics, such as differences in economic development levels. These variables may affect SO 2 emissions, and their omission could bias the estimation results obtained.
Therefore, to examine the development of the LCPC, this paper uses data on prefecture-level cities and enterprises in China from 2003 to 2013 and applies a multiperiod DID to investigate the relationship between the LCPC and SO 2 emissions. It attempts to explore the following core issues: Does the LCPC curb SO 2   (It would be preferable to examine the impacts on more than one pollutant. However, for industrial pollution, the central government of China previously focused on only SO 2 among air pollutants and chemical oxygen demand (COD) for water pollution.) emissions from heavily polluting enterprises? What are the mechanisms whereby SO 2 emissions from heavy polluters are affected? What impact did fiscal decentralization have on them? Answering the above questions will help clarify the relationship between low-carbon policies and pollution emissions and help us re-examine the overall environmental governance effects of the LCPC.
The potential contributions of this paper relate mainly to the following three aspects.
First, in terms of the research perspective, this paper focuses on assessing the impact of the LCPC on SO 2 emissions from heavy polluters, complementing previous studies on China that have focused on the role of the LCPC in reducing CO 2 emissions. Previous studies have found that the LCPC can effectively reduce CO 2 emissions [19], but the impact on SO 2 emissions remains to be verified. Moreover, this paper enriches and complements the research on the impact of the LCPC on cleaner production in heavily polluting enterprises. In particular, most of the literature on the impact of low-carbon policies on regional air quality has focused on developed countries, and few studies have focused on China, the largest developing country. Therefore, this quasinatural experimental study of the LCPC based on a sample of Chinese firms is innovative, providing new empirical evidence for developing countries and complementing existing studies.
Second, from a data and methodological perspective, one of the challenges commonly faced in existing literature evaluating environmental policy effects is endogeneity problems. Due to the late start of environmental policies in China and data limitations, there is less literature examining the effects of environmental remediation that effectively addresses these endogeneity problems. Thus, this paper uses a multiperiod DID approach based on firm-level pollution data for the period 2003–2013 and takes the LCPC as a quasinatural experiment to better alleviate endogeneity problems and data limitations, providing new empirical and methodological ideas for related studies.
Third, the mechanism by which the LCPC affects the SO2 emissions of heavy polluters is explored. The mechanism analysis finds that the LCPC has a crowding-out effect on financial investment for the treatment of SO 2 . This decrease in investment in SO 2 control causes an increase in SO 2 emissions. Moreover, existing studies suggest that the LCPC can influence the environmental investment decisions of enterprises [20,21,22]; however, whether the LCPC influences the SO 2 emissions of heavy polluters has not been demonstrated. Therefore, we test the mechanism with a moderating effect model. Our findings suggest that the LCPC increases financial investment in the treatment of CO 2 and crowds out investment in the treatment of SO 2 , which in turn increases SO2 emissions among heavily polluting enterprises.
The remainder of this paper is structured as follows: The second part introduces the LCPC with respect to its formulation, implementation background and potential effect mechanism. The third part presents the data used in the empirical study and sets up an econometric regression model to implement the identification strategy. The fourth part reports the analysis of the empirical results and conducts robustness and mechanism tests. The fifth part offers a heterogeneity analysis. The sixth part presents further discussion from the perspective of fiscal decentralization, and the seventh part offers the conclusion and policy implications.

2. Policy Background and Research Hypotheses

2.1. China’s Low-Carbon Pilot Policy (LCPC)

As shown in Figure 1, China’s economic growth has been accompanied by a yearly increase in energy consumption, and China’s primary energy consumption has grown at a slower rate than GDP since 2010. The huge level of fossil energy consumption and increasing industrialization have made China the world’s largest emitter of anthropogenic air pollutants [23]. The massive increase in the total volume of industrial waste gas emission has become a major threat to public health, leading to about 350 thousand to 1 million premature deaths in recent years [24,25] and, consequently, a rapid annual increase in petitions and administrative penalties related to environmental issues [9].
In this context, to control emissions of greenhouse and polluting gases, China has successively introduced a series of energy conservation and emission reduction policies. In 2010, the National Development and Reform Commission issued the “Notice on the Piloting of Low-Carbon Provinces and Low-Carbon Cities” and successively selected pilot provinces and cities. The pilots were initiated to promote scientific and technological innovation, upgrade growth patterns, and develop green industries [26]. The first round of pilots was implemented from 2010, with 13 provinces and cities selected, including Guangdong, Liaoning, Hubei, Shaanxi, Yunnan, Tianjin, Chongqing, Xiamen, Shenzhen, Hangzhou, Nanchang, Guiyang, and Baoding. The second round of pilots was implemented from 2013, covering 29 provinces and cities (Beijing, Shanghai, Hainan, Shijiazhuang, Qinhuangdao, Jincheng, Hulunbeier, Jilin, Daxinganling, Suzhou, Huaian, Zhenjiang, Ningbo, Wenzhou, Chizhou, Nanping, Jingdezhen, Ganzhou, Qingdao, Jiyuan, Wuhan, Guangzhou, Guilin, Guangyuan, Zunyi, Kunming, Yan’an, Jinchang, and Urumuqi.) including Hainan Province, Beijing, and Shanghai. In addition, 28 other cities were selected for the third round of low-carbon pilots in 2017.
These environmental policies have enabled China to achieve significant results in addressing climate change. Coal consumption accounted for 64.0% of total energy consumption in 2015, down 5.2 percentage points from 2010; the share of non-fossil energy consumption reached 12.0%, up 2.6 percentage points from 2010 [27]. CO 2 emissions per unit of GDP decreased by 6.2% year-on-year in 2014 and by 15.8% cumulatively from 2010 [28].
Overall, the LCPC has achieved positive results in reducing CO 2 emissions [19], but there are some institutional weaknesses, especially the lack of a clear definition of low-carbon pilot areas, an effective evaluation system and comprehensive development goals and the implementation of multiple parallel programs that confuse the process [29]. In turn, local governments lack awareness over the progress of the low-carbon economic transition and clarity surrounding the concepts of energy conservation and a circular, low-carbon, sustainable economy. This irrational design and consequent implementation problems lead to distortions in resource allocation and efficiency losses, which can easily lead to a green paradox [30].
At the pilot region level, the LCPC imposes clear CO 2 emission reduction requirements [13] but advocates only voluntary reductions in other emissions such as SO2 [31]. Although most pilot regions use a combination of three regulatory tools, namely, mandates, market tools and voluntary initiatives, to pursue policies [32], the specific implementation process uses mainly mandates [21]: for example, shutdowns of enterprises violating CO 2 emission standards, setting of mandatory CO 2 emission intensity targets per unit of GDP, and delegation of CO 2 emission control to lower levels of government and enterprises [31]. In addition, government officials in the pilot regions generally regard the central government’s assessment targets for CO 2 emission reduction as their top priority because compliance affects their personal careers. In addition, they pay no attention to emissions other than those targeted for assessment unless they become components of the higher-level assessment [33,34]. As a result, the intensity of CO 2 emission control may be greater than that of SO2 emission control in low-carbon pilot regions in China.
For enterprises, as rational economic agents, the optimal choice in complying with the LCPC is to increase their investment in CO 2 treatment. This inevitably requires significant financial support, forcing enterprises to redirect their environmental funds to reducing CO 2 emissions. However, many enterprises in heavily polluting industries have limited environmental protection expenditures because of financial and technological constraints [35], and enterprises may reconfigure these expenditures in the presence of regulation. This may make it difficult to increase capital investment in the treatment of SO2 in line with increases in enterprise production. Thus, the implementation of the LCPC and increase in investment in CO2 control is likely to be accompanied by a crowding-out effect on investment in SO2 control, with SO 2 emissions among heavy polluters in pilot areas correspondingly increasing.

2.2. Theoretical Analysis and Research Hypothesis

As urban environmental regulations proposed to implement China’s climate action goals, LCPC is sector-specific and is characterized by weak constraints and policy combinations [21]. In general, in order to adapt to the requirements of LCPC, firms in LCPC areas will increase their technology and equipment investment and improve their pollution emission management capacity [16]. Among them, the effectiveness of LCPC with respect to CO2 emissions has been widely demonstrated [13,14]. However, in the context of this paper, it still needs to be analyzed in depth how LCPC specifically affects enterprises’ SO2 emissions. From the perspective of policy implementation, the fact that LCPC focuses more on the management of CO 2 emissions compared to other emissions such as SO2 emissions may bring two unintended results. On the one hand, if the total budget for environmental protection is set, enterprises may choose to invest more in the treatment of CO 2 and less in the treatment of SO2, which has a crowding-out effect and may lead to an increase in the emission of SO2; on the other hand, since the financial lending policy in LCPC is also focused on the treatment of CO 2 emissions, it is easy for enterprises to obtain low-carbon loans for CO 2 emissions, but it is relatively difficult for enterprises to obtain loans for SO2 treatment, which will further promote enterprises to apply for loan funds for the treatment of CO 2 emissions and weaken their investment in SO2 treatment [21], thereby contributing to increased SO2 emissions. Therefore, the theoretical framework of LCPC affecting SO2 emissions is constructed in this paper as shown in Figure 2.
To analyze the mechanism of LCPC’s effect on the treatment of CO 2 and SO2, we drew on the framework of Berman and Bui [36] and Liu et al. [37] to construct a production function that includes “quasi-fixed” input factors, calculate firms’ pollution emissions, and then introduce environmental regulations into the pollutant function. In particular, according to Brown and Christensen [38], “quasi-fixed” input factors can be determined by exogenous constraints. As the main tool for the LCPC, the command-and-control policy requires firms to meet emission standards by a deadline, and firms must invest more in CO 2 emission control in the short term or have their operations suspended or even shut down. Therefore, we consider the pollutant treatment inputs for LCPC compliance to be “quasi-fixed” input elements.
Assume that a cost-minimizing heavy polluter operates in a perfectly competitive market. The capital quantity k is the sum of the “quasi-fixed” input z (z = z c + z s ) and the fixed input u. The production function has the following form:
q = f ( u , l ,   z c , z s )
where q is the output, l is the labor input, and z c ,   z s are the CO 2 treatment input the SO2 treatment input of the LCPC, which we consider “quasi-fixed” input factors. We use a linear equation to approximate:
q = η + α u + β l + τ ( z c + z s )
Referring to the Levinson [39] approach, total emissions of pollutants E are assumed to be:
E   = v q
In the above equation, v is the pollutant pollution emission intensity, and q is the output. Equation (2) brought into Equation (3) gives:
E = v η + v α u + v β l + v τ ( z c + z s )
Referring to Li and Peng [40], we can simplify the effect of environmental regulation (R) on pollution emissions as:
E = δ + µ R
The impact of environmental regulation (R) on pollution emissions is achieved through the following mechanisms:
d E d R = v d u d R + v d l d R + v d z c d R + v d z s d R
The input factor market is assumed to be perfectly competitive, so any change in environmental regulation will not affect factors l and u. In addition, the pollutant emission intensity is determined by the firms’ emission reduction technology and emission reduction equipment, which are not affected by the environmental regulation in the short run. Therefore, the first and second terms in Equation (6) are dropped, leaving the third and fourth terms. These terms reflect the impact of the LCPC on the “quasi-fixed” CO 2 and SO2 treatment inputs, respectively. Since the LCPC regulates CO2 more strongly than SO2 emissions, i.e., d R c > d R s , d z c > d z s . Since z = z c + z s , in the case of z remaining unchanged, enterprises can only control the “quasi-fixed” SO2 treatment inputs ( z s , i.e., SO2 governance input) by crowding out “quasi-fixed” CO 2 treatment inputs.
Therefore, with z (z = z c + z s ) held constant, z c > 0 and z s < 0 . Hence, d z c d R >   0 and d z s d R < 0.
In addition, it has been shown [41] that d E / d z > 0, so that we can derive d E C d R > 0 and d E S d R < 0 . It is clear that the LCPC has a crowding-out effect on the “quasi-fixed” SO2 control inputs. If the “quasi-fixed” SO2 control input is reduced, SO2 emissions increase. Based on this, this paper proposes the following.
Hypothesis 1.
Low-carbon pilot policies aggravate SO2 emissions by heavy polluters.
Hypothesis 2.
Low-carbon pilot policies increase CO2 inputs and inhibit SO2 inputs among heavy polluters.
In addition, in China’s low-carbon pilot regions, financial support is an important institutional arrangement for CO 2 governance. The low-carbon planning programs of the pilot regions have proposed various low-carbon financial policies to reduce CO 2 emissions, including special funds for low-carbon development; industry subsidies, preferential loans with reduced interest rates, and specific loan funding arrangements for CO 2 reduction; and low-carbon tax exemptions. These financial policies can increase investment in low-carbon projects and direct more capital to low-carbon industries and production processes by allocating capital among different types of industries, thus alleviating the financing constraints that enterprises may face and helping them reduce their CO 2 emissions [42,43]. This low-carbon finance policy focuses on management of CO 2 emissions and requires enterprises to meet certain treatment input requirements for CO 2 reduction. However, the LCPC does not set out a financial support policy for reducing SO2 emissions; thus, enterprises in high-pollution industries are more willing to invest in governance to meet CO2 emission standards and to complete the tasks assigned by local governments but less willing to invest in governance of SO2 and other pollutants, which may exacerbate SO2 emissions. Accordingly, this paper proposes the following.
Hypothesis 3.
Low-carbon pilot policies related to financing lead heavy polluters to increase their CO2 treatment inputs and inhibit SO2 treatment inputs through a crowding-out effect on SO2 reduction inputs.

3. Data and Empirical Strategy

3.1. Data Sources

To comprehensively examine the impact of the LCPC on the SO2 emissions of heavily polluting enterprises and its influence mechanism, this paper integrates multiple sets of statistical data and finally integrates them to construct a comprehensive database including Chinese industrial enterprise data, enterprise pollution data, and municipal-level statistics. The details are as follows.
First, we use data on Chinese industrial enterprises (CIED). The data come from the National Bureau of Statistics, covering all industrial enterprises above a certain size. (The CIED has been widely used in the research on China problem (see, for example, Brandt et al. (2012) [44]; Brandt et al. (2017) [45]; Liu et al.(2021) [37]).) This database contains basic information such as the enterprise name, legal person code, enterprise address, and many financial indicators such as total assets and sales. This database, which offers the advantages of a large sample size and rich information, has been widely used in recent studies. Referring to Brandt et al. [44,45] and others, the following processing was performed on the database of industrial enterprises before matching: (1) enterprises with duplicate legal person codes were eliminated; (2) enterprises whose data do not comply with general accounting standards (e.g., had current assets exceeding total assets, net fixed assets greater than total assets, or a missing number of employees) were eliminated; (3) enterprises with missing key indicators were eliminated; (4) the 4-digit industry codes from 1998–2013 were standardized according to the industry cross-reference table published by the National Bureau of Statistics; (5) a cross-year panel was constructed through the method of sequential matching; and (6) enterprises with a large number of missing data were removed.
Second, we use Chinese industrial enterprises’ pollution data. The China Environmental Statistics Database (CESD) offers the most detailed environmental statistics available in China, covering the whole country, and is considered to be the most comprehensive and reliable environmental microeconomic database in the country [46]. The Ministry of Environmental Protection (MEP) has established an environmental information system covering all major emission sources. However, the CESD has long been confidential and was only recently made available to researchers [47]. Each company self-reports data on a seasonal basis, which is then compiled by the MEP. Local environmental protection agencies (EPAs) confirm the data quality through unannounced inspections and other monitoring activities. The local EPA then generates a final report that is sent to the provincial EPA. After review and approval, the certification information is sent to the MEP. National and provincial environmental authorities often review local EPAs’ statistical work via a variety of methods, including random spot checks. If problems are found, on-site inspections are conducted when necessary. Higher-level governments also directly conduct flight inspections, cross-checks, and on-site verifications of enterprise pollution emissions. The CESD is the most comprehensive environmental set of microdata in China, covering approximately 85% of annual emissions of major pollutants (e.g., SO2 and COD). The CESD contains basic enterprise information (e.g., enterprise name, legal person code [48], district code and industry code), pollution emissions, environmental equipment (e.g., number of exhaust gas treatment facilities and wastewater treatment facilities), and other environmental information of the enterprise (e.g., pollutant removal, treatment capacity, and operating costs of abatement facilities). For our empirical analysis, we use CESD information on SO2 emissions, number of SO2 exhaust treatment facilities [49], statistical year, ownership type, area code, and industry code.
In terms of other data, we use the annual municipal statistics produced by the National Bureau of Statistics of China and the China City Statistical Yearbook, covering the main socioeconomic statistics of 289 municipalities.
Given that the most recent data from the China industrial enterprise database are available only through 2013, the sample period for this study ends in 2013, and the first- and second-round pilot municipalities are selected as the treatment group. We exclude the third round of pilot cities from our study analysis because they are still in the initial stage of the policy implementation and have limited data available. At the enterprise level, data on SO2 emissions, nitrogen oxide emissions, the number of CO 2 and other waste gas treatment facilities, and the number of SO2 waste gas treatment facilities of heavily polluting enterprises were obtained from the CESD, and other data were obtained from the China Industrial Enterprises Database. At the city level, city data were obtained from the China City Statistical Yearbook for previous years. This paper matches the CESD, China industrial enterprise database, and prefecture-level city data based on the legal person code, enterprise name and enterprise location. In this paper, only heavily polluting enterprises are retained in the industry screening. To mitigate the influence of outliers on our results, we winsorize all continuous variables at the 1st and 99th percentiles.

3.2. Model Specification

The question explored in this paper is the effect of the LCPC on SO2 emissions from heavy polluters. To address the endogeneity problems commonly faced in the literature, this paper constructs a multiperiod double-difference model using the LCPC as a quasinatural experiment, divides the study population into a treatment group (areas where the policy has been implemented) and a control group (areas where the policy has not been implemented), and removes the time trend. The net effect of the policy implementation is identified by differentiating the time trend before and after policy implementation and the difference between the treatment and control groups to isolate the policy effect from the influence of time-varying and unobservable factors. This method has been widely used in existing policy studies [17,50]. In this paper, the provinces and cities included in the scope of the first two rounds of low-carbon pilot projects are used as the treatment group, and the remaining provinces and cities are used as the control group to quantitatively assess the effect of LCPC implementation on SO2 emissions from heavily polluting enterprises. The specific model settings are as follows:
ln ( SO 2 ) i t = β 1 + β 2 DID i t + β 5 Z + μ i + μ t + ε i t
postit is used to distinguish the years before and after the low-carbon pilot, where postit = 0 means the year before the pilot and postit = 1 the year after the pilot; treatit = 1 indicates areas where the policy has been implemented and treatit = 0 areas where the policy has not implemented; and DID i t is the interaction term between treatit and postit, which takes the values 0 or 1. If firm I belongs to the low-carbon pilot region in year t, DID i t is assigned a value of 1 in that year and each year after, and 0 otherwise. β 2 is the focus of the paper: if the coefficient is significantly positive, it indicates that the LCPC increases SO2 emissions in the treatment group. This indicates that the LCPC significantly increases the SO2 emissions of heavily polluting enterprises. Z represents enterprise and geographical control variables; μ i represents enterprise fixed effects, μ t year fixed effects, and ε i t the random error term. In the model, ln ( SO 2 ) i t represents the logarithm of SO2 emissions from enterprise i in year t.

3.3. Variable Selection

3.3.1. Dependent Variable

SO2 emissions ( lnSO 2 ). Drawing on Liu et al. [37], we use enterprise SO2 emissions for this indicator. SO2 most intuitively reflects the enterprise exhaust emission problem and is quantifiable and representative. In the robustness check, this paper also uses nitrogen oxide emission data from the Chinese industrial enterprise database as the explanatory variable to ensure the robustness of the benchmark analysis.

3.3.2. Independent Variable

LCPC treatment (DID). The key independent variable is the dummy variable DID, obtained based on the list of low-carbon cities in the “Notice on Conducting the Pilot Program of Low-Carbon Provinces and Cities” and the time of program establishment.

3.3.3. Control Variables

Control variables (Z). Considering that other factors at the enterprise and municipal levels may have potential effects on the SO2 emissions of heavy polluters, we select a series of enterprise economic characteristics and municipal-level influencing factors as control variables in this paper. (i) Enterprise size (lnsize). It has been shown in the literature that larger enterprises make more stable governance investments to meet environmental protection standards for the sustainability of their development [51,52]. In this paper, the logarithm of total firm capital at the end of the year is used to measure the firm size. (ii) Firm age (age). The age of a firm usually represents its maturity, and studies have shown that more mature firms tend to have stronger operational capabilities [53]. In this paper, the number of years that a firm has been in business since its inception is used to measure firm age. (iii) Firm performance–related variables. Drawing on Cai et al. [54], this paper controls for both firm capital intensity (capital) and firm profit (profit) to account for the influence of factors such as firm performance. Capital intensity is expressed as the ratio of the firm’s fixed assets to total assets; corporate profit is expressed as the logarithm of the firm’s total profit. (iv) Relevant variables at the city level. To account for the possible effects of regional openness, the economic development level and industrial structure changes at the city level on the SO2 emissions of heavily polluting enterprises [55,56], this paper controls for foreign investment share (lncityfdi), per capita GDP (lnpgdp), and industrial structure (lndustry). The foreign investment share is the ratio of the total output value of foreign-invested industrial enterprises to the total industrial output value of the region, GDP per capita is the logarithm of GDP per capita at the city level, and the industrial structure is expressed as the share of the secondary industry in GDP at the city level.
Table 1 shows the summary statistics of the main variables used (sample size, mean, standard deviation, minimum, and maximum values). Panel A of Table 1 shows the descriptive statistics for the complete sample. Panels B and C of Table 2 show descriptive statistics for the main variables for the treatment and control groups, respectively. On average, approximately 49.34% of the company-year observations are covered by the LCPC during our sample period.

4. Results

4.1. Main Results

The results of the baseline regression of the effect of the LCPC on SO2 emissions are shown in Table 2. lnSO 2 is the explanatory variable. Column (1) shows that the coefficient of the core explanatory variable is 0.08 and significant at the 1% confidence level after we add only the core explanatory variable DID and the two-way year and region fixed effects, indicating that the low-carbon pilot reform increases the SO2 emissions of heavily polluting enterprises in the jurisdiction by 8%. The coefficient of the core explanatory variable is 0.138 and significant at the 1% confidence level after we add the firm-level control variables (firm size, age, capital intensity, and profit) in column (2), indicating that the low-carbon pilot reform increases the SO2 emissions of heavily polluting firms in the jurisdiction by 13.8% after the firm-level variables are controlled for. Column (3) further controls for three indicators reflecting regional economic development (the foreign investment share, GDP per capita and industrial structure of prefecture-level cities), and the coefficient of the core explanatory variable is 0.143 and significant at the 1% confidence level, indicating that the low-carbon pilot reform increases SO2 emissions among heavily polluting enterprises in the jurisdiction by 14.3% after firm- and prefecture-level variables are controlled for. Overall, this indicates that the LCPC is significantly and positively related to the SO2 emissions of heavily polluting enterprises, indicating that hypothesis 1 is valid.
A large body of literature has been published on the factors affecting SO2 emissions from different perspectives. The existing literature proves that there is a close relationship between socioeconomic and demographic factors and SO2 pollution, such as economic growth, industrialization level, energy consumption, foreign direct investment, international trade, government environmental regulations, urbanization, and some meteorological factors such as wind speed and direction [57,58,59,60,61,62,63,64,65]. This paper focuses on the impact of LCPC on SO2 emissions from heavy polluters with the entry point of SO2 emissions from heavy polluters, which is a useful supplement to existing studies. The results of the baseline regression study in this paper are similar to those of Liu et al. [35], who found different effects of low-carbon policies on different air pollutants using city-level data.

4.2. Robustness Checks

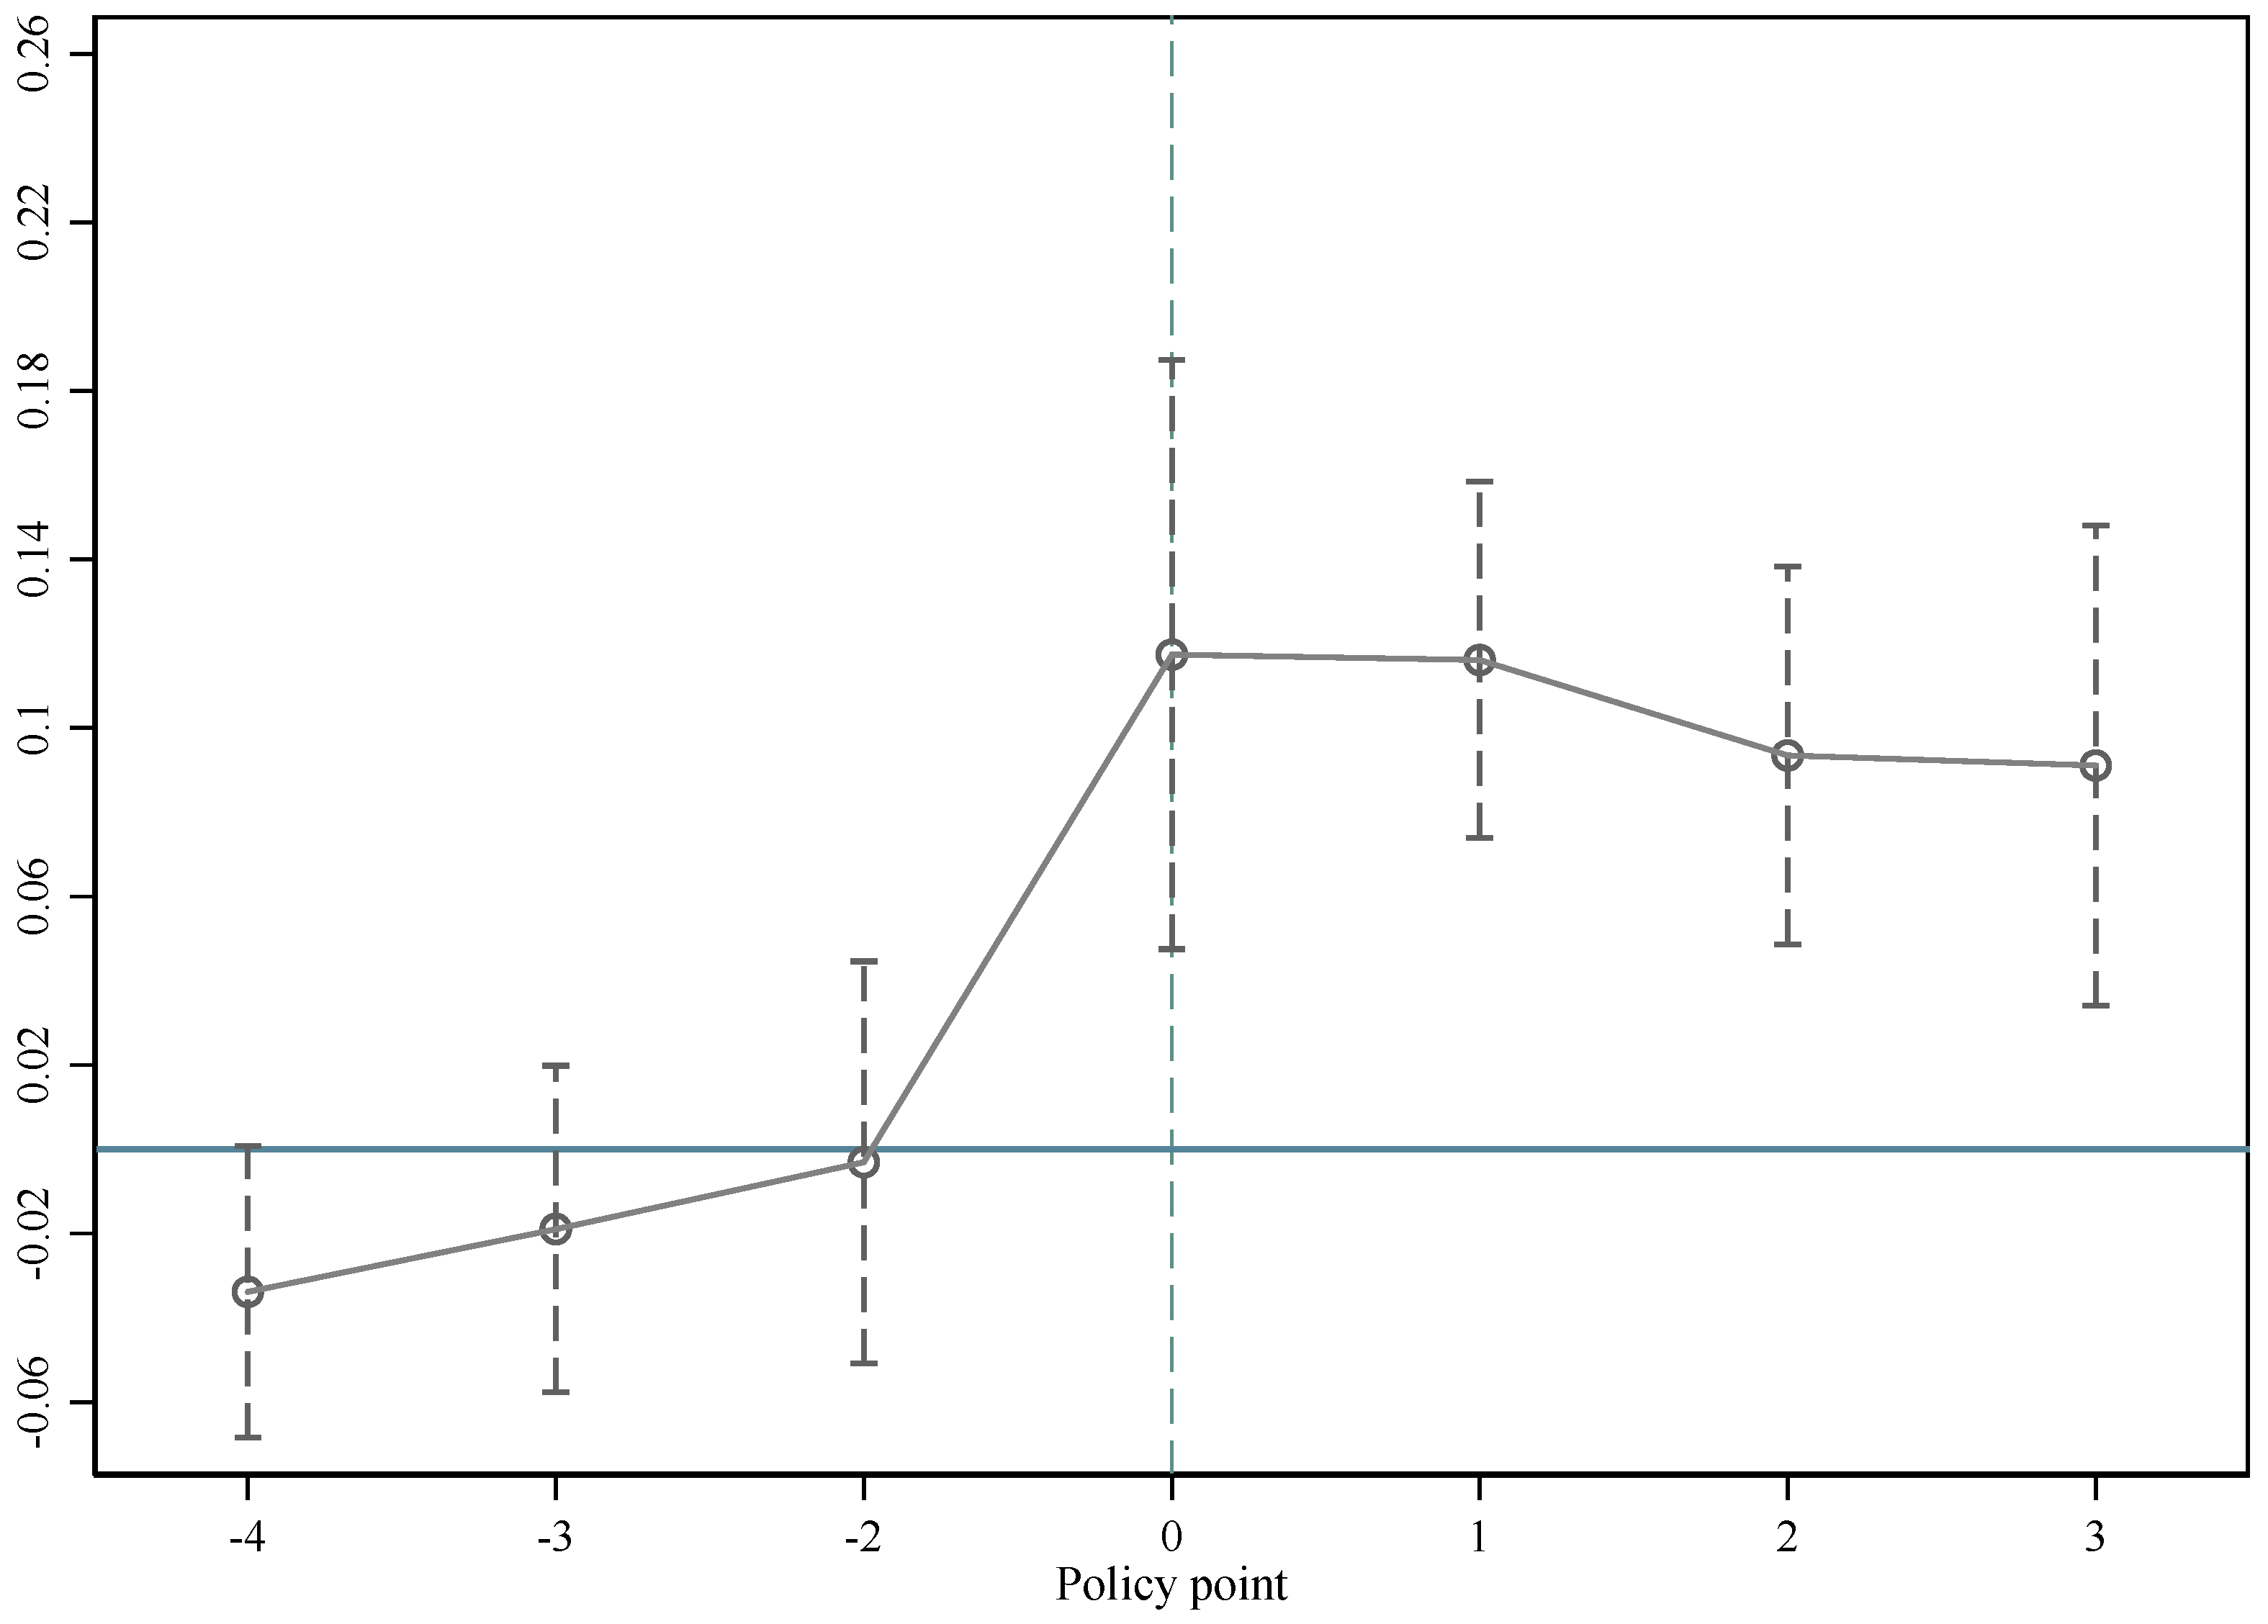
4.2.1. Parallel Trend Hypothesis and Dynamic Test

An important assumption required for the policy assessment using the multiperiod double-difference method is that the time trends of the treatment and control groups would have been the same in the absence of the policy shock, and thus, a parallel trend test of this assumption is required. For this purpose, we set up the following econometric model:
ln ( SO 2 ) i t = α + β 2 DID i t 4 + β 3 DID i t 3 + + β 9 DID i t 4 + γ Z + μ i + μ t + ε i t
In the model, DID i t ± j is a series of dummy variables, DID it j takes the value of 1 when the treatment group is in year j before the low-carbon pilot reform, and DID i t + j takes the value of 1 when it is in year j after the low-carbon pilot reform; otherwise, DID it ± j takes the value of 0. We take the year before the low-carbon pilot reform as the reference category for the coefficient of DID it ± j in the regression. This coefficient indicates whether there is a significant difference in the trend of SO2 emissions between the treatment and control groups of enterprises in year j before and after the low-carbon pilot reform in comparison with this difference in the control group. To represent the estimation results visually, we present the trend of the coefficient of DID it ± j in Figure 1, with the horizontal axis indicating the years before and after the distance from the pilot and the vertical axis indicating the magnitude of the estimated value.
From Figure 3, it can be seen that the coefficients of DID are not significant when j = −4, −3, −2, and −1, which means that there is no significant difference in the trend of SO2 emission changes of enterprises in the treatment and control groups before the low-carbon pilot reform, so the hypothesis of parallel trends cannot be rejected. In the time after the low-carbon pilot reform, the coefficient of DID i t + j on enterprise SO2 is significant at the 1% level from the year of reform, which means that the low-carbon pilot reform intensifies enterprise SO2 emissions basically without a time lag and the effect can last for quite a long period of time.

4.2.2. Alternative Estimation Method

Considering that the sample used in this paper uses matched data at the firm and the prefectural city level, we adopt a standard error clustering analysis to circumvent the heteroskedasticity problem. Specifically, the sample standard errors are clustered at the prefectural city level, and the results show that the significance of the estimated coefficients of the core explanatory variables of the article does not change. The results based on the alternative estimation method are given in row (1) of Table 3, verifying the robustness of the results in Table 2.

4.2.3. Controls for Potential Omitted Variables

Although we have included firm and year fixed effects and controlled for key indicators at the prefecture level, there is still a possibility of omitted variable bias. Therefore, the firm-level variable corporate indebtedness (lndebts) is added to the basic measurement equation. Corporate indebtedness reflects the market’s evaluation of a firm’s creditworthiness [66], and a moderately indebted operation allows firms to have more abundant funds for activities such as technical equipment improvement and process upgrades. This indicator is measured in this paper by the logarithm of the firm’s loan amount to total assets ratio in the current year. We further consider the return on total assets (ROA) of the enterprise, expressed as the ratio of enterprise net profit to total assets.
Referring to the method of Xu and Cui [21], we further add the following prefectural city-level variables: the level of financial development (Credit), measured by the ratio of total loans from all financial institutions in the region to regional GDP; the level of infrastructure (Infrastructure), measured by the number of telephone subscribers; and the fiscal expenditure of the prefecture-level city (Fiscal), measured by the current year’s fiscal expenditure. All variables are taken as natural logarithms, except for the level of financial development. The results in row (2) of Table 3 show that the regression coefficients of DID change very little in comparison to those in Table 2 after we control for municipality- and firm-level variables, indicating that these potential omitted variables do not impact the basic findings.

4.2.4. Impact of the LCPC on Total SO2 and CO2 Emissions at the Municipal Level

A potential limitation of using firm-level data is that we can only observe the impact on existing firms. However, environmental regulations may also lead to closures and entry restrictions among industrial firms if the cost of enhanced environmental regulations is so large that firms cannot continue to be profitable [37]. Therefore, this paper further collects municipal-level data for the analysis, and the estimation results are presented in row (3) of Table 3. The LCPC has a significant effect on SO2 and CO2 emissions, the coefficients of the double-difference term of SO2 emissions in prefecture-level cities are all significantly positive at the 1% level, and the coefficients of the double-difference term of CO 2 in prefecture-level cities are all significantly negative at the 1% level. This indicates that the LCPC decreases CO2 emissions but increases SO2 emissions. This result is consistent with the previous analysis. Therefore, the results of the firm-level analysis are reasonable.

4.2.5. Alternative Explanatory Variable

Other unobservable factors have the potential to confound the conclusions of the main regression model. In this paper, we use other measures of corporate exhaust emissions (e.g., NOx emissions) for robustness testing. This indicator is useful to further rule out confounding factors that affect the explanatory variables. To ensure the robustness of the benchmark results, we replace the explanatory variables in model (1) here with the logarithm of NOx emissions to examine the effect of the LCPC on the SO2 emissions of enterprises, and the regression results are shown in row (4) of Table 3. The coefficients of the double-difference terms of nitrogen oxide emissions are all significantly positive at the 1% level. This indicates that the LCPC increases the emissions of pollutant gases other than SO2 gas in the enterprise. This corroborates the robustness of the above baseline analysis.

4.3. Mechanisms

The above analysis shows that the implementation of the LCPC significantly promotes SO2 emissions from heavy polluters. Therefore, what are the specific transmission mechanisms? In other words, what are the key variables that the LCPC affects to change the level of enterprise SO2 emissions?

4.3.1. Impact of the LCPC on Abatement Inputs

Given that we have rich and detailed information on enterprise-level production and pollution in relation to each production process, including the amount of pollution generated in the enterprise’s production process and emission reduction facilities, we can measure the enterprise’s financial investment in controlling CO 2 and SO2 [37]. The total corporate environmental protection input is influenced by corporate output [67], on the basis of which we construct a proxy variable for total corporate environmental protection input. In this paper, the provinces and cities included in the scope of the first two rounds of low-carbon pilot projects are used as the treatment group, and the remaining provinces and cities are used as the control group. To analyze the mechanism whereby the LCPC influences enterprise production, we take the increase in the amount of end-of-pipe equipment to control CO 2 and SO2 emissions is taken as the proxy variable for enterprise capital investment to control CO 2 and SO2 emissions, and enterprise output is the proxy variable for total enterprise environmental protection input. The specific model settings are as follows:
ln ( M j ) i t = β 1 + β 2 DID i t + β 3 t r e a t i t + β 4 p o s t i t + β 5 Z + μ i + μ t + ε i t
ln ( M j ) i t is the logarithm of the amount of equipment for pollutant j of enterprise i in year t. If j = 1 , ln ( M 1 ) i t refers to the total environmental protection input of enterprise i in year t. If j = 2 , ln ( M 2 ) i t refers to the logarithm of the amount of CO 2 equipment used by enterprise i in year t; if j = 3 , ln ( M 3 ) i t refers to the logarithm of the amount of SO 2 equipment used by enterprise i in year t. The other variables are as in model (1).
From Table 4 (1), we find that the coefficient of total environmental protection investment of heavily polluting enterprises in pilot areas after the implementation of the LCPC is 0.021 and significant at the 1% level, indicating that the low-carbon pilot reform increases the total environmental protection investment of heavily polluting enterprises in the jurisdiction by 2.1%. From Table 4 (2), we find that the reform causes a significant increase of 4.5% in capital investment for CO 2 treatment by heavily polluting enterprises in the jurisdiction; this figure is higher than the growth rate of total environmental protection investment. From Table 4 (3), we find that the reform does not significantly increase capital investment in SO2 treatment by heavy polluters in the jurisdiction. Under normal circumstances, the growth rates of SO2- and CO2-related capital investment and total environmental protection investment are similar; however, implementation of the LCPC makes the growth rate of CO 2 -related investment much higher than that of total environmental protection investment, crowding out SO 2 -related investment, so that the latter does not increase significantly. This naturally leads SO 2 emissions to increase. Thus, hypothesis 2 is verified.
Liu et al. (2021) used the cases of three cities to analyze the mechanisms by which LCPC affects pollutant gas emissions in terms of the energy structure, the industrial situation, and residents’ lifestyles. Liu et al. (2021) concluded that the reason for the differential environmental regulation effects of LCPC on different pollutant gas emissions is that the energy structure, industrial situation, and residents’ lifestyles differs between regions. This paper, on the other hand, looks at the effect of LCPC on corporate emissions. This paper analyzes the mechanism from the perspective of the assessment weights of LCPC of different pollutant gases emitted by enterprises and finds that there is a crowding-out effect of enterprises’ capital investment in the treatment of CO 2 on the capital investment in the treatment of SO2, which provides a useful supplement to the existing research.

4.3.2. Impact of the Low-Carbon Finance Policy

The low-carbon pilot regions have all deployed low-carbon financial policies, aiming to provide financial support for the low-carbon transition in the pilot regions. Such policies can facilitate financing for enterprises [21] and alleviate their financial pressure in the process of managing CO 2 emissions, which in turn encourages enterprises to increase their financial investment in managing CO 2 but reduce their investment in SO 2 management. Here, overall credit at the municipal level is used as a proxy variable for low-carbon financial policy to test whether implementation of the LCPC leads enterprises to increase their investment in CO 2 treatment through financial policy and produce a crowding-out effect on investment in SO 2 treatment. In this paper, on the basis of model (9), we take the increase in the amount of end-of-pipe equipment for CO 2 and SO 2 treatment as the proxy variable for the increase in enterprise financial investment in CO 2 and SO 2 treatment and add the loan variable lnloanct at the municipal level to construct a triple-difference model as follows:
ln ( M j ) i t = α + β 1 DID i t l n l o a n c t + β 2 P o s t i t l n l o a n c t + β 23 T r e a t i t l n l o a n c t + γ Z + μ i + μ t + ε i t
where l n l o a n c t is the logarithm of the balance of all loans of financial institutions in city c at the end of year t. ln ( M j ) i t is the logarithm of the amount of equipment in enterprise i in year t. If j = 1, ln ( M 1 ) i t refers to the logarithm of the amount of CO 2 equipment used by enterprise i in year t; if j = 2, ln ( M 2 ) i t refers to the logarithm of the amount of SO 2 equipment used by enterprise i in year t. The regression results are shown in Table 5. The coefficient of the triple-difference term is significantly positive in Table 5 (1), which indicates that the LCPC leads enterprises to increase their capital investment in CO 2 treatment through the corresponding financial policies; on the other hand, Table 5 (2) shows that financial policies inhibit enterprises’ capital investment in SO 2 treatment. The possible reason is that the low-carbon financial policies proposed by the pilot regions under their respective low-carbon planning programs mainly target green and low-carbon development, i.e., green industries, projects, and production processes. The financial support for increased inputs SO 2 control is insufficient. At this point, hypothesis 3 is verified.
The results of this study are similar to those of Xu and Cui [21], who found that the green finance policies proposed by LCPC in their respective low-carbon city planning scenarios mainly target low-carbon development. However, there is insufficient financial support for enterprises to combat SO2, which in turn can affect their environmental investment behavior.

5. Effect Heterogeneity

Although the previous analyses have demonstrated that the LCPC promotes corporate SO 2 emissions, do different types of companies respond differently to this policy? Do different regions implement the policy in different ways? Do different degrees of fiscal decentralization have an impact on the effectiveness of policy implementation? This section discusses heterogeneity in the policy effect in terms of the intrinsic characteristics of firms, regions, and the degree of fiscal decentralization.

5.1. Heterogeneity by Ownership Type

Compared with that in developed countries in Europe and the United States, legal and institutional development in developing countries is weaker, and regionally based environmental policies often face greater obstacles and difficulties at the implementation level [68,69]. In the case of enterprises with different ownership types, state-owned enterprises (SOEs) are those invested in or controlled by the central or local governments; SOEs have a significant advantage in resource allocation, especially in terms of receiving financial support [70], and are not particularly sensitive to either the compliance cost pressure from environmental regulations or the economic innovation incentives provided by government finance to support environmental protection. In contrast, non-SOEs are self-sustaining, and they face greater expectations to improve their environmental performance through environmental technology innovation [71]. On the other hand, in terms of information on resource reallocation and technological improvements, non-state enterprises are more flexible in adjusting and reforming their internal institutional mechanisms and the flow of production factors within the enterprise in response to compliance pressures and are more efficient in reallocating resources under environmental regulations than state-owned enterprises. Therefore, here, the overall sample is divided into three subsamples (state-owned enterprises, private enterprises, and foreign enterprises) and the benchmark model is re-estimated to further investigate whether the LCPC produces heterogeneous SO 2 emission effects for different types of enterprises.
The estimated results are shown in Table 6. The double-difference term coefficient is significantly positive in the subsample of state-owned enterprises corresponding to column (1); the double-difference term coefficient is significantly positive for the private enterprises in column (2), but the rate of increase is much lower than that in state-owned enterprises. In addition, the coefficient of the double-difference term is not significant for the subsample of foreign firms in column (3). This suggests that there is indeed heterogeneity at the level of enterprise ownership type in the effect of the LCPC on enterprises’ exhaust emissions: the LCPC more significantly exacerbates the SO 2 emissions of state-owned enterprises and private enterprises, and the increase is larger in the former than in the latter. The possible reason is that SOEs have stronger path-dependent effects and are generally subject to weaker environmental regulation constraints due to their important responsibilities in local economic development. This is consistent with the findings of Ren et al. [71], Han and Sang [72], etc. Ren et al. [71] find that the emissions trading system has a greater effect on the total factor productivity of non-SOEs than SOEs. Han and Sang [72] find that SOEs are less motivated to move their products in cleaner directions when facing environmental regulatory constraints because their own political power can reduce the pressure from regulation. For foreign firms, the effect of the LCPC on SO 2 emissions is not significant: it is known that foreign firms have better environmental performance than domestic firms. Due to the fact that foreign firms are relatively more technologically advanced, have stronger operational capabilities, and are more aware of environmental protection needs, environmental regulations have little effect on their environmental investment and thus no significant effect on their SO 2 emissions. Therefore, non-SOEs’ SO 2 emissions are more likely to be exacerbated by the LCPC than SOEs’ in high-pollution industries.

5.2. Heterogeneity by Region

Considering that the economic development conditions and industrial bases of each region differ greatly, the LCPC may have heterogeneous effects on enterprise emissions across regions, and thus, we divide the sample into eastern, central, and western regions. The results in columns (1)–(3) of Table 7 show that the coefficients of DID are significant at 0.105, 0.178 and 0.274, respectively; i.e., the pilot LCPC reform has a significant effect on enterprise emissions in the east, central region and west of the country. The effect gradually increases from east to west, due to the relatively greater development and stronger business operation capacity in the east, stronger governance capacity of the eastern government, and better policies under the low-carbon pilot reform. The effect of the LCPC in the central and western parts is relatively worse. This finding is similar to that of Fu and Luo [73]. Fu and Luo [73] found that environmental governance is more effective in the eastern region. The reason for this is that the government in the eastern region has stronger governance capacity and better policy implementation.

6. Further Discussion

6.1. Impact of Fiscal Decentralization

Fiscal decentralization also has implications for environmental regulation [74]. Fiscal decentralization gives local governments fiscal autonomy and a “residual claim” on revenues so that they can implement public policies that suit their interests relatively independently to achieve their policy targets for CO 2 reduction. Fiscal decentralization gives local governments the right to dispose of resources to ensure the effectiveness of incentives in political promotion tournaments [75]. Due to the fact that the LCPC also involves assessment of local governments, LCPC regional governments have incentives to use the fiscal autonomy granted by fiscal decentralization to meet carbon targets, resulting in fiscal support that inhibits control of SO 2 . Fiscal policy focused on reducing CO 2 may crowd out enterprises’ SO 2 -related investment, which in turn inhibits enterprises’ management of SO 2 . In short, in low-carbon pilot regions, due to the pressure of performance assessment, local governments are more willing to adopt fiscal tools to reduce CO 2 emissions, which suppresses fiscal support for SO 2 treatment. The higher the degree of fiscal decentralization, the greater is the fiscal autonomy of the region and the fiscal support for reducing CO 2 emissions, which in turn discourages enterprises from investing in SO 2 control.
The existing literature disagrees about how to measure fiscal decentralization, using three main kinds of indicators: expenditure indicators, revenue indicators, and fiscal autonomy indicators. This paper draws on the approach of Guo et al. [20] to construct fiscal decentralization (FD) indicators for prefecture-level municipalities. The higher the degree of fiscal decentralization, the greater the fiscal autonomy of the region, the greater the fiscal support for reducing CO 2 emissions, and the greater the crowding-out effect on the enterprises’ investment in managing SO 2 emissions. In this paper, based on model (9), we take the increase in the amount of end-of-pipe equipment to control CO 2 and SO 2 as proxy variables for enterprises’ inputs to control CO 2 and SO 2 and add the fiscal decentralization variable FD at the municipal level to construct a triple-difference model as follows:
ln ( M j ) i t = α + β 1 DID i t F D c t + β 2 P o s t i t F D c t + β 3 T r e a t i t F D c t + β 4 DID + γ Z + μ i + μ t + ε i t
where F D c t is the fiscal weight of municipality c in year t. ln ( M j ) i t is the logarithm of the amount of equipment in enterprise i in year t. If j = 1, ln ( M 1 ) i t refers to the logarithm of the amount of CO 2 equipment in enterprise i in year t. If j = 2, ln ( M 2 ) i t refers to the logarithm of the amount of SO 2 equipment in enterprise i in year t. The regression results are shown in Table 8. The coefficient of the triple-difference term is significantly positive in column (1), which indicates that by enhancing financial and taxation support at the municipal level, the LCPC leads enterprises to increase their investment in CO 2 control; on the other hand, it can be seen from Table 8 (2) that the financial and taxation policies do not prompt enterprises to significantly increase their investment in SO 2 control. The possible reason is that the fiscal support policies proposed by the pilot regions in their respective low-carbon planning programs target mainly green and low-carbon development, i.e., green industries, projects, and production processes. The fiscal and taxation policies to boost SO 2 inputs are not strong enough. The results of this study are similar to those of Zhang [75], who found that fiscal decentralization creates financial incentives for local government officials, thus creating incentives for incomplete enforcement of environmental regulations.

6.2. Impact of Market Segmentation

Fiscal decentralization can cause local governments to compete with each other, which in turn causes market segmentation [76]. Is there a moderating effect of this market segmentation behavior on the LCPC’s influence on enterprise inputs into CO 2 and SO 2 management? In this paper, an interaction term between a local market segmentation indicator and the LCPC indicator is introduced into model (9) to test this conjecture, and a triple-difference model is constructed as follows:
ln ( M j ) i t = α + β 1 DID i t S E G c t + β 2 P o s t i t S E G c t + β 3 T r e a t i t S E G c t + β 4 DID + γ Z + μ i + μ t + ε i t + γ Z + μ i + μ t + ε i t
S E G c t is the market segmentation index of city c in year t. The other indicators are the same as in model (11). The regression results are shown in Table 9. The coefficient of the triple-difference term is not significant in column (1) and significantly negative in column (2), which indicates that the LCPC inhibits enterprise inputs into SO 2 control through the mediating effect of market segmentation, exacerbating enterprises’ SO 2 emissions. The possible reason is that LCPC has different assessments of local governments’ efforts to control CO 2 and SO 2 intensity, and local governments have more incentives to suppress SO 2 control inputs through market segmentation.

7. Conclusions

This paper focuses on the impact of the LCPC on the SO 2 emissions of heavily polluting enterprises. The findings include the following: First, overall, LCPC significantly exacerbated SO 2 emissions of heavy polluting enterprises in the pilot area compared with non-pilot cities, thus Hypothesis 1 was verified. The effect of environmental treatment of enterprises in LCPC needs to be improved. Second, the main transmission mechanism that this paper found is that the LCPC provides more loan support for enterprises in the pilot area to control CO 2 inputs through low-carbon financial policies, which inhibits loan support for SO 2 inputs, as well as the different assessment strengths of the LCPC for enterprises’ CO 2 emissions and SO 2 emissions, resulting in the crowding-out effect of enterprises’ CO 2 inputs on SO 2 inputs. As a result, LCPC promotes enterprises in high-pollution industries in the pilot area to control CO 2 and suppress SO 2 inputs, which causes enterprises to increase SO 2 emissions; this verifies Hypothesis 2 and Hypothesis 3.Third, the LCPC has significantly aggravated the SO 2 emissions of enterprises across the eastern, central and western regions, on the one hand, and private and state-owned enterprises, on the other, with an increasing trend across these two sets of subsamples. Fourth, it is further found that fiscal decentralization and the market segmentation resulting from fiscal decentralization mediate the effect on enterprise CO 2 control and inhibit inputs into SO 2 control.
The findings of this paper have the following three policy implications.
First, an LCPC is a city-level environmental governance policy that allows each pilot city to draw up its own low carbon development implementation plan based on the regional industrial structure and development situation, and it is a weakly binding policy instrument. The results of this paper show that an LCPC has a negative effect on driving enterprises to manage SO 2 emissions, which is not in line with the original intention of LCPC implementation. The significant policy implication is that policy-makers are required to design LCPC environmental policies and optimization policies with integrated consideration of synergistic management measures of CO 2 and SO 2 and other pollutant gases, and it is necessary to develop adequate trade-offs and quantitative management evaluation criteria to drive enterprises to strengthen the management of CO 2 emissions along with other gases such as SO 2 .
The financial policies supporting an LCPC play an important role in the process of implementing it. Therefore, our policy recommendations are to establish an effective financial policy mechanism for cross-sectoral coordination and information sharing; to increase the weighting of emissions of SO2 and other gases in the environmental performance assessment of local governments; to encourage local governments and local financial institutions to support and promote the development of green finance to coordinate the management of CO 2 and SO2 and other polluting gases; and to provide financial incentives for enterprises to manage CO2 and SO2 emissions. Through policy design and institutional arrangements, the positive externalities of green projects and the negative externalities of pollution investments can be made visible to provide sufficient incentives for combating the emissions gases such as SO2.
Third, in the process of implementing pilot policies for low-carbon cities, the role of precise policy-making and categorical governance should be given more importance. There is currently great heterogeneity in the ownership and regional and financial autonomy in the effects of LCPC implementation, and such differences require governments to formulate environmental policies that fully account for different corporate natures and regional and financial autonomy. In addition to creating a good level playing field for less developed regions and non-state enterprises, the design of an effective supervision mechanism can also put more pressure on less-developed regions, regions with greater financial autonomy, and state-owned enterprises to comply. In addition, it is necessary to increase the development of a market economy, reduce unnecessary government intervention in the economy, control the negative effects of fiscal decentralization, and promote a better role of the market in resource allocation.
This paper initially examines the impact of LCPC on SO2 emissions of heavy polluters, but due to the availability of data, this paper still has some limitations to account for in the future. In addition, since LCPC itself is still in the process of promotion and expansion, with the disclosure of more data, such policies can be tracked and analyzed in the future, and further studies can be conducted that consider more of its dimensions. China’s sustained high economic growth for more than 40 years has brought about severe resource and environmental pressure; alleviating this pressure requires continuous efforts and reforms, and the LCPC is one of the flagship efforts among many environmental reforms. A scientific and systematic assessment of the effectiveness of the regional-based LCPC provides experience and inspiration to formulate relevant environmental pollution prevention and control policies in developing countries in the short term; in the long term, it is of great practical significance to help developing countries to build ecological civilization as a millennium plan for sustainable development.

Author Contributions

P.G.: conceptualization, supervision; J.L.: methodology, software, formal analysis, data curation, writing—original draft, writing—review and edit, visualization; J.K.: methodology, writing—review and edit, validation, funding acquisition; Y.Z.: methodology, validation; R.X.: validation, writing—review and edit; D.D.: methodology, validation; B.H.: methodology, validation. All authors have read and agreed to the published version of the manuscript.

Funding

This paper was supported by the National Natural Science Foundation of China (grant number: 42071161), the National Social Science Foundation of China (grant number: 20BTJ011), the General Project of Hunan Provincial Philosophy and Social Science Planning (grant number: XSP20YBC051), and the General Project of Hunan Provincial Education Department for Scientific Research (grant number: 19C1032).

Institutional Review Board Statement

Not applicable.

Informed Consent Statement

Not applicable.

Data Availability Statement

The datasets used during the current study are available from the corresponding author on reasonable request. The code used during the current study is available from the corresponding author on reasonable request.

Conflicts of Interest

The authors declare no conflict of interest.

References

  1. Hao, Y.; Peng, H.; Temulun, T.; Liu, L.Q.; Mao, J.; Lu, Z.N.; Chen, H. How harmful is air pollution to economic development? New evidence from PM2.5 concentrations of Chinese cities. J. Clean Prod. 2018, 172, 743–757. [Google Scholar] [CrossRef]
  2. Mujtaba, G.; Shahzad, S.J.H. Air pollutants, economic growth and public health: Implications for sustainable development in OECD countries. Environ. Sci. Pollut. Res. 2021, 28, 12686–12698. [Google Scholar] [CrossRef] [PubMed]
  3. Zhou, Z.; Ye, S.Y.; Ge, X.Y. The Impacts of Technical Progress on Sulfur Dioxide Kuznets Curve in China: A Spatial Panel Data Approach. Sustainability 2017, 9, 674. [Google Scholar] [CrossRef] [Green Version]
  4. Zhang, N.; Zhao, K.; Yu, Y. The effect of environmental regulation on air pollution, productivity, and factor structure: A quasi-natural experiment evidence from China. Environ. Sci. Pollut. Res. 2020, 27, 20392–20409. [Google Scholar] [CrossRef] [PubMed]
  5. WHO(World Health Organization). Ambient Air Pollution: A global Assessment of Exposure and Burden of Disease. Available online: https://www.who.int/news/item/12-05-2016-air-pollution-levels-rising-in-many-of-the-world-s-poorest-cities (accessed on 2 February 2022).
  6. Ellison, R.B.; Greaves, S.P.; Hensher, D.A. Five years of London’s low emission zone: Effects on vehicle fleet composition and air quality. Transp. Res. D Transp. Environ. 2013, 23, 25–33. [Google Scholar] [CrossRef]
  7. Wolff, H. Keep your clunker in the suburb: Low-emission zones and adoption of green vehicles. Econ. J. 2014, 124, F481–F512. [Google Scholar] [CrossRef]
  8. Gehrsitz, M. The effect of low emission zones on air pollution and infant health. J. Environ. Econ. Manag. 2017, 83, 121–144. [Google Scholar] [CrossRef] [Green Version]
  9. Chen, B.; Cheng, Y.S. The Impacts of Environmental Regulation on Industrial Activities: Evidence from a Quasi-Natural Experiment in Chinese Prefectures. Sustainability 2017, 9, 571. [Google Scholar] [CrossRef] [Green Version]
  10. He, L.; Wang, B.; Xu, W.; Cui, Q.; Chen, H. Could China’s long-term low-carbon energy transformation achieve the double dividend effect for the economy and environment? Environ. Sci. Pollut. Res. 2021, 29, 20128–20144. [Google Scholar] [CrossRef]
  11. Lin, J.; Jacoby, J.; Cui, S.; Liu, Y.; Lin, T. A model for developing a target integrated low carbon city indicator system: The case of Xiamen, China. Ecol. Indic. 2014, 40, 51–57. [Google Scholar] [CrossRef]
  12. Dai, R.; Cao, J.H. The effect of China’s first low-carbon pilot: DID estimation of five cities and eight provinces. Sci. Technol. Manag. Res. 2015, 12, 56–61. Available online: https://kns.cnki.net/kcms/detail/detail.aspx?FileName=KJGL201512011&DbName=CJFQ2015 (accessed on 2 February 2022).
  13. Feng, T.; Lin, Z.; Du, H.; Qiu, Y.; Zuo, J. Does low-carbon pilot city program reduce carbon intensity? Evidence from Chinese cities. Res. Int. Bus. Financ. 2021, 58, 101450. [Google Scholar] [CrossRef]
  14. Hong, M.; Chen, S.; Zhang, K. Impact of the “low-carbon city pilot” policy on energy intensity based on the empirical evidence of Chinese cities. Front. Environ. Sci. 2021, 9, 257. [Google Scholar] [CrossRef]
  15. Tan, S.; Yang, J.; Yan, J.; Lee, C.; Hashim, H.; Chen, B. A holistic low carbon city indicator framework for sustainable development. Appl. Energy 2017, 185, 1919–1930. [Google Scholar] [CrossRef]
  16. Chen, H.; Guo, W.; Feng, X.; Wei, W.; Liu, H.; Feng, Y.; Gong, W. The impact of low-carbon city pilot policy on the total factor productivity of listed enterprises in China. Resour. Conserv. Recycl. 2021, 169, 105457. [Google Scholar] [CrossRef]
  17. Song, H.; Sun, Y.; Chen, D. Assessment for the effect of government air pollution control policy: Empirical evidence from “low-carbon city” construction in China. Manag. World 2019, 35, 95–108. [Google Scholar] [CrossRef]
  18. Peng, J.; Li, J.; Ding, Y. Influence and mechanism analysis of pilot policies of low-carbon cities on. J. Urban Issues 2020, 10, 88–97. [Google Scholar] [CrossRef]
  19. Song, Q.; Zhou, N.; Liu, T.; Siehr, S.A.; Qi, Y. Investigation of a “coupling model” of coordination between low-carbon development and urbanization in China. Energy Policy 2018, 121, 346–354. [Google Scholar] [CrossRef] [Green Version]
  20. Guo, S.; Wen, L.; Wu, Y.; Yue, X.; Fan, G. Fiscal decentralization and local environmental pollution in China. Int. J. Environ. Res. Public Health 2020, 17, 8661. [Google Scholar] [CrossRef]
  21. Xu, J.; Cui, J.B. Low-carbon cities and firms’ green technological innovation. China Ind. Econ. 2020, 12, 178–196. [Google Scholar] [CrossRef]
  22. Ji, X.; Umar, M.; Ali, S.; Ali, W.; Tang, K.; Khan, Z. Does fiscal decentralization and eco-innovation promote sustainable environment? A case study of selected fiscally decentralized countries. Sustain. Dev. 2021, 29, 79–88. [Google Scholar] [CrossRef]
  23. Zheng, B.; Tong, D.; Li, M.; Liu, F.; Hong, C.; Geng, G.; Li, H.; Li, X.; Peng, L.; Qi, J.; et al. Trends in China’s anthropogenic emissions since 2010 as the consequence of clean air actions. Atmos. Chem. Phys. 2018, 18, 14095–14111. [Google Scholar] [CrossRef] [Green Version]
  24. Chen, Z.; Wang, J.-N.; Ma, G.-X.; Zhang, Y.-S. China tackles the health effects of air pollution. Lancet 2013, 382, 1959–1960. [Google Scholar] [CrossRef]
  25. Cohen, A.J.; Brauer, M.; Burnett, R.; Anderson, H.R.; Frostad, J.; Estep, K.; Balakrishnan, K.; Brunekreef, B.; Dandona, L.; Dandona, R.; et al. Estimates and 25-year trends of the global burden of disease attributable to ambient air pollution: An analysis of data from the Global Burden of Diseases Study 2015. Lancet 2017, 389, 1907–1918. [Google Scholar] [CrossRef] [Green Version]
  26. Liu, W.; Qin, B. Low-carbon city initiatives in China: A review from the policy paradigm perspective. Cities 2016, 51, 131–138. [Google Scholar] [CrossRef]
  27. MEEC (Ministry of Ecology and Environment of China). Bulletin on the State of Ecological Environment in China. Available online: http://www.mee.gov.cn/hjzl/sthjzk/zghjzkgb/ (accessed on 2 February 2022).
  28. NDRCC (National Development and Reform Commission of China). China’s Policies and Actions on Climate Change. Available online: http://www.ncsc.org.cn/yjcg/cbw/201511/t20151120_609693.shtml (accessed on 2 February 2022).
  29. Khanna, N.; Fridley, D.; Hong, L. China’s pilot low-carbon city initiative: A comparative assessment of national goals and local plans. Sustain. Cities Soc. 2014, 12, 110–121. [Google Scholar] [CrossRef]
  30. Sinn, H.W. Public policies against global warming: A supply side approach. Int. Tax Public Financ. 2008, 15, 360–394. [Google Scholar] [CrossRef]
  31. Song, Q.; Liu, T.; Qi, Y. Policy innovation in low carbon pilot cities: Lessons learned from China. Urban Clim. 2021, 39, 100936. [Google Scholar] [CrossRef]
  32. Wang, Y.; Song, Q.; He, J.; Qi, Y. Developing low-carbon cities through pilots. Clim. Policy 2015, 15, S81–S103. [Google Scholar] [CrossRef]
  33. Qi, Y. Annual Review of Low-Carbon Development in China: 2010; World Scientific: Singapore, 2013. [Google Scholar]
  34. NDRC China’s Policies and Actions on Climate Change; NDRC: Beijing, China, 2014.
  35. Liu, T.L.; Song, Q.J.; Jiaqi, L.U.; Qi, Y. An integrated approach to evaluating the coupling coordination degree between low-carbon development and air quality in Chinese cities. Adv. Clim. Chang. Res. 2021, 12, 710–722. [Google Scholar] [CrossRef]
  36. Berman, E.; Bui, L.T.M. Environmental regulation and labor demand: Evidence from the South Coast air basin. J. Public Econ. 2001, 79, 265–295. [Google Scholar] [CrossRef]
  37. Liu, M.; Tan, R.; Zhang, B. The costs of “blue sky”: Environmental regulation, technology upgrading, and labor demand in China. J. Dev. Econ. 2021, 150, 102610. [Google Scholar] [CrossRef]
  38. Brown, R.S.; Christensen, L.R. Estimating Elasticities of Substitution in A Model of Partial Static Equilibrium: An Application to US Agriculture, 1947–1974 (No. 2242-2019-3082); MIT Press: Cambridge, MA, USA, 1980. [Google Scholar]
  39. Levinson, A. Technology, international trade, and pollution from US manufacturing. Am. Econ. Rev. 2009, 99, 2177–2192. [Google Scholar] [CrossRef] [Green Version]
  40. Li, B.; Peng, X. Studies on spatial heterogeneity effects of environmental regulation instruments: Spatial empirical analysis from the perspective of transformation of government functions. Ind. Econ. Res. 2013, 6, 38–47. [Google Scholar]
  41. Copeland, B.R.; Taylor, M.S. Trade and the Environment: Theory and Evidence; Princeton University Press: Princeton, NJ, USA, 2005. [Google Scholar]
  42. Wang, M.; Li, Y.; Li, M.; Shi, W.; Quan, S. Will carbon tax affect the strategy and performance of low-carbon technology sharing between enterprises? J. Clean. Prod. 2019, 210, 724–737. [Google Scholar] [CrossRef]
  43. Nwani, C.; Omoke, P.C. Does bank credit to the private sector promote low-carbon development in Brazil? An extended STIRPAT analysis using dynamic ARDL simulations. Environ. Sci. Pollut. Res. 2020, 27, 31408–31426. [Google Scholar] [CrossRef]
  44. Brandt, L.; Van Biesebroeck, J.; Zhang, Y. Creative accounting or creative destruction? Firm-level productivity growth in Chinese manufacturing. J. Dev. Econ. 2012, 97, 339–351. [Google Scholar] [CrossRef] [Green Version]
  45. Brandt, L.; Van Biesebroeck, J.; Wang, L.; Zhang, Y. WTO accession and performance of Chinese manufacturing firms. Am. Econ. Rev. 2017, 107, 2784–2820. [Google Scholar] [CrossRef] [Green Version]
  46. Zhang, B.; Chen, X.; Guo, H. Does central supervision enhance local environmental enforcement? Quasi-experimental evidence from China. J. Public Econ. 2018, 164, 70–90. [Google Scholar] [CrossRef]
  47. Chen, Y.J.; Li, P.; Lu, Y. Career concerns and multitasking local bureaucrats: Evidence of a target-based performance evaluation system in China. J. Dev. Econ. 2018, 133, 84–101. [Google Scholar] [CrossRef]
  48. Chen, Z.; Kahn, M.E.; Liu, Y.; Wang, Z. The consequences of spatially differentiated water pollution regulation in China. J. Environ. Econ. Manag. 2018, 88, 468–485. [Google Scholar] [CrossRef]
  49. Cole, M.A.; Elliott, R.J. Do environmental regulations cost jobs? An industry-level analysis of the UK. BE J. Econ. Anal. Policy 2007, 7. [Google Scholar] [CrossRef]
  50. Beck, T.; Levine, R.; Levkov, A. Big bad banks? The winners and losers from bank deregulation in the United States. J. Financ. 2010, 65, 1637–1667. [Google Scholar] [CrossRef] [Green Version]
  51. Li, W.; Zheng, M. Is it substantive innovation or strategic innovation? Impact of macroeconomic policies on micro-enterprises’ innovation. Econ. Res. J. 2016, 4, 60–73. Available online: https://kns.cnki.net/kcms/detail/detail.aspx?FileName=JJYJ201604005&DbName=CJFQ2016 (accessed on 9 February 2022).
  52. Bu, M.; Qiao, Z.; Liu, B. Voluntary environmental regulation and firm innovation in China. Econ. Model. 2020, 89, 10–18. [Google Scholar] [CrossRef]
  53. Huang, J.; Cao, J.; Hasan, T.; Zhao, J. Low-carbon city initiatives and firm risk: A quasi-natural experiment in China. J. Financ. Stab. 2021, 57, 100949. [Google Scholar] [CrossRef]
  54. Cai, W.X.; Ni, X.R.; Zhao, P.; Yang, T.T. The impact of business groups on innovation outputs: Evidence from Chinese manufacturing firms. China Ind. Prod. 2019, 137–155. [Google Scholar] [CrossRef]
  55. Yu, Y.Z.; Zhang, S.H. Urban housing prices, purchase restriction policy and technological innovation. China Ind. Econ. 2017, 6, 100–118. [Google Scholar] [CrossRef]
  56. Jin, G.; Shen, K.R. Polluting thy neighbor or benefiting thy neighbor: Enforcement interaction of environmental regulation and productivity growth of Chinese cities. Manag. World 2018, 34, 43–55. [Google Scholar] [CrossRef]
  57. Zheng, Z.; Wu, Z.; Chen, Y.; Yang, Z.; Marinello, F. Exploration of eco-environment and urbanization changes in coastal zones: A case study in China over the past 20 years. Ecol. Indic. 2020, 119, 106847. [Google Scholar] [CrossRef]
  58. Miao, Z.; Liu, S.; Chen, X. Driving factors and spatio-temporal features underlying industrial SO2 emissions in “2+ 26” in North China and extended cities. Chin. J. Popul. Resour. Environ. 2020, 18, 296–318. [Google Scholar] [CrossRef]
  59. Huo, T.; Ma, Y.; Cai, W.; Liu, B.; Mu, L. Will the urbanization process influence the peak of carbon emissions in the building sector? A dynamic scenario simulation. Energy Build. 2021, 232, 110590. [Google Scholar] [CrossRef]
  60. Yang, X.; Wang, S.; Zhang, W.; Li, J.; Zou, Y. Impacts of energy consumption, energy structure, and treatment technology on SO2 emissions: A multi-scale LMDI decomposition analysis in China. Appl. Energy 2016, 184, 714–726. [Google Scholar] [CrossRef]
  61. Cao, X.; Wang, P.; Zhu, B. Has foreign direct investment increased air pollution in China? A hierarchical linear model approach. Nat. Hazards 2018, 91, 659–669. [Google Scholar] [CrossRef]
  62. Zhong, Q.; Shen, H.; Yun, X.; Chen, Y.; Ren, Y.A.; Xu, H.; Tao, S. Effects of international fuel trade on global sulfur dioxide emissions. Environ. Sci. Technol. Lett. 2019, 6, 727–731. [Google Scholar] [CrossRef]
  63. Hao, Y.U.; Deng, Y.; Lu, Z.N.; Chen, H. Is environmental regulation effective in China? Evidence from city-level panel data. J. Clean. Prod. 2018, 188, 966–976. [Google Scholar] [CrossRef]
  64. Huang, J.T. Sulfur dioxide (SO2) emissions and government spending on environmental protection in China-Evidence from spatial econometric analysis. J. Clean. Prod. 2018, 175, 431–441. [Google Scholar] [CrossRef]
  65. Xu, Y.; Zhang, W.; Wang, J.; Ji, S.; Wang, C.; Streets, D.G. Investigating the spatially heterogeneous impacts of urbanization on city-level industrial SO2 emissions: Evidence from night-time light data in China. Ecol. Indic. 2021, 133, 108430. [Google Scholar] [CrossRef]
  66. Meuleman, M.; De Maeseneire, W. Do R&D subsidies affect SMEs’ access to external financing? Res. Policy 2012, 41, 580–591. [Google Scholar] [CrossRef]
  67. Lannelongue, G.; Gonzalez-Benito, J.; Gonzalez-Benito, O. Input, output, and environmental management productivity: Effects on firm performance. Bus. Strategy Environ. 2015, 24, 145–158. [Google Scholar] [CrossRef]
  68. Greenstone, M.; Hanna, R. Environmental regulations, air and water pollution, and infant mortality in India. Am. Econ. Rev. 2014, 104, 3038–3072. [Google Scholar] [CrossRef] [Green Version]
  69. Li, P.; Lu, Y.; Wang, J. Does flattening government improve economic performance? Evidence from China. J. Dev. Econ. 2016, 123, 18–37. [Google Scholar] [CrossRef]
  70. Allen, F.; Qian, J.; Qian, M. Law, finance, and economic growth in China. J. Financ. Econ. 2005, 77, 57–116. [Google Scholar] [CrossRef] [Green Version]
  71. Ren, S.G.; Zheng, J.J.; Liu, D.H.; Chen, X. Does emissions trading system improve firm’s total factor productivity-evidence from Chinese listed companies. China Ind. Econ. 2019, 5, 5–23. [Google Scholar] [CrossRef]
  72. Han, C.; Sang, R.C. Enterprises’ product switching and product quality improvement under environmental regulation. China Ind. Econ. 2018, 2, 43–62. [Google Scholar] [CrossRef]
  73. Fu, Y.; He, C.; Luo, L. Does the low-carbon city policy make a difference? Empirical evidence of the pilot scheme in China with DEA and PSM-DID. Ecol. Indic. 2021, 122, 107238. [Google Scholar] [CrossRef]
  74. Jain, V.; Purnomo, E.P.; Islam, M.; Mughal, N.; Guerrero, J.W.G.; Ullah, S. Controlling environmental pollution: Dynamic role of fiscal decentralization in CO2 emission in Asian economies. Environ. Sci. Pollut. Res. 2021, 28, 65150–65159. [Google Scholar] [CrossRef]
  75. Zhang, H. Strategic interaction of regional environmental regulation: An explanation on the universality of incomplete enforcement of environmental regulation. China Ind. Econ. 2016, 7, 74–90. [Google Scholar] [CrossRef]
  76. Deng, H.H.; Yang, L.X. Haze governance, local competition and industrial green transformation. China Ind. Econ. 2019, 10, 118–136. [Google Scholar]
Figure 1. Gross domestic product (GDP) (China’s gross domestic product (GDP) data are from the National Bureau of Statistics, China Statistical Yearbook.) and energy consumption (Energy consumption data from Statistical Review of World Energy https://www.bp.com/en/global/corporate/energy-economics/statistical-review-of-world-energy.html (accessed on 26 February 2022)) for the period 2000–2020.
Sustainability 14 03220 g001
Figure 2. Theoretical framework of LCPC affecting SO2 emissions.
Sustainability 14 03220 g002
Figure 3. Parallel trend test. Data source: Drawn by the author.
Sustainability 14 03220 g003
Table 1. Descriptive statistics.
(1)(2)(3)(4)(5)
VARIABLESNMeansdMinMax
Panel A: Descriptive statistics of full sample
age535,51511.589.455239
capital535,1400.3390.23400.784
profit388,0038.1742.0464.36911.72
lnsize535,14011.101.5178.65414.09
lncityfdi527,5490.1920.1730.01110.580
lnpgdp534,76210.360.6989.04611.49
lndustry535,0953.9430.1473.6304.170
lnSO2390,7887.2173.8370.17712.72
Panel B: Descriptive statistics of treatment group
age264,29812.129.514239
capital264,0210.3340.23200.784
profit188,9098.2352.0714.36911.72
lnsize264,02111.211.5208.65414.09
lncityfdi262,0980.2540.1910.01110.580
lnpgdp263,95010.520.7049.04611.49
lndustry263,8563.9340.1463.6304.170
lnSO2185,9847.1343.8470.17712.72
Panel C: Descriptive statistics of control group
age271,21711.059.366239
capital271,1190.3450.23500.784
profit199,0948.1162.0214.36911.72
lnsize271,11910.991.5068.65414.09
lncityfdi265,4510.1310.1250.01110.545
lnpgdp270,81210.200.6549.04611.49
lndustry271,2393.9510.1473.6304.170
lnSO2204,8047.2933.8270.17712.72
Note: Continuous variables are winsorized at 1% and 99%.
Table 2. Baseline results.
(1)(2)(3)
DID0.080 ***0.138 ***0.143 ***
(0.010)(0.013)(0.013)
scale_ass 0.105 ***0.103 ***
(0.007)(0.007)
profit 0.015 ***0.014 ***
(0.003)(0.003)
capital −0.001−0.001
(0.019)(0.019)
age 0.0010.001
(0.001)(0.001)
lncityfdi 0.447 ***
(0.087)
lncityrjgdp 0.032
(0.026)
lncitycyjg −0.022
(0.054)
Constant10.050 ***8.785 ***8.533 ***
(0.009)(0.072)(0.266)
Year FEYESYESYES
Observations233,600167,569164,488
R squared0.8880.8910.892
Notes: This table reports regression coefficients and robust standard errors (clustered within cities and robust to heteroskedasticity) in parentheses for the full sample regression results using the DID method. Continuous variables are winsorized at 1% and 99%. Firm-year fixed effects are included in the regression estimations. *** represents significance levels of 1%. These notes apply to all subsequent tables. Year FE of YES means that this part of the study controls for time-related fixed effects.
Table 3. Robustness tests.
Inspection Method
(1)Alternative estimation methodAdopting standard error clustering analysis at the prefecture level to circumvent the heteroskedasticity problem0.143 ***
(0.021)
(2)Controls for potential omitted variablesAdding firm- and prefecture-level control variables0.132 ***
(0.015)
(3) Impact   of   the   LCPC   on   total   S O 2   and   CO 2 emissions at the municipal level Using   the   logarithm   of   CO 2 emissions from prefecture-level cities−0.060 ***
(0.001)
Using   the   logarithm   of   S O 2 emissions from prefecture-level cities0.028 ***
(0.003)
(4)Alternative explanatory variableUsing the logarithm of nitrogen oxide emissions0.239 ***
(0.020)
Notes: This table reports regression coefficients and robust standard errors in parentheses for the full sample regression results using the DID method. Continuous variables are winsorized at 1% and 99%. Firm-year fixed effects are included in the regression estimations. *** represents significance levels of 1%.
Table 4. Total investment in environmental protection, capital investment in CO 2 control and capital investment in SO 2 control.
(1)(2)(3)
ln ( M 1 ) ln ( M 2 ) ln ( M 3 )
DID0.021 ***0.045 ***0.002
(0.009)(0.005)(0.002)
Constant5.48 ***−0.156−0.157 ***
(0.187)(0.102)(0.044)
City FEYESYESYES
Firm FEYESYESYES
Year FEYESYESYES
Observations203,673214,800214,800
R squared0.1620.3710.064
Notes: ln( M 1 ) is a proxy variable for the growth rate of total investment in environmental protection. ln( M 2 ) is a proxy variable for the growth rate of capital investment in the treatment of CO 2 . ln( M 3 ) is a proxy variable for the growth rate of capital investment in the treatment of SO 2 . City FE of YES means that this part of the study controls for urban fixed effects. Firm FE of YES means that this part of the study controls for firm fixed effects. Year FE of YES means that this part of the study controls for time-related fixed effects. *** represents significance levels of 1%.
Table 5. Low-carbon financial policy impacts.
(1)(2)
ln ( M 1 ) ln ( M 2 )
lncityloan_DID0.023 ***−0.006 ***
(0.003)(0.001)
Constant−0.216 *−0.244 ***
(0.116)(0.050)
City FEYESYES
Firm FEYESYES
Year FEYESYES
Observations214,800214,800
R squared0.3710.064
Notes: ln( M 1 ) is a proxy variable for the increase in capital investment in the enterprise’s governance of CO 2 . ln( M 2 ) is a proxy variable for the increase in capital investment in the enterprise’s governance of SO 2 . City FE of YES means that this part of the study controls for urban fixed effects. Firm FE of YES means that this part of the study controls for firm fixed effects. Year FE of YES means that this part of the study controls for time-related fixed effects. lncityloan_DID is the interaction term between the logarithmic value of each loan balance of the municipal financial institution and the DID. *** and * represent significance levels of 1 and 10%, respectively.
Table 6. Heterogeneity by ownership.
(1)(2)(3)
State-Owned EnterprisesPrivate EnterprisesForeign-Owned Enterprises
DID0.275 ***0.167 ***−0.007
(0.066)(0.015)(0.035)
Constant9.981 ***8.779 ***8.443 ***
(1.032)(0.309)(0.767)
City FEYESYESYES
Firm FEYESYESYES
Year FEYESYESYES
Observations14,601127,71122,127
R squared0.6840.8400.850
Notes: City FE of YES means that this part of the study controls for urban fixed effects. Firm FE of YES means that this part of the study controls for firm fixed effects. Year FE of YES means that this part of the study controls for time-related fixed effects. *** represents significance levels of 1%.
Table 7. Heterogeneity by region.
(1)(2)(3)
EASTMIDWEST
DID0.105 ***0.178 ***0.274 ***
(0.015)(0.039)(0.048)
Constant7.822 ***11.188 ***11.024 ***
(0.351)(0.654)(1.011)
City FEYESYESYES
Firm FEYESYESYES
Year FEYESYESYES
Observations105,12937,67221,687
R squared0.8610.8180.764
Notes: City FE of YES means that this part of the study controls for urban fixed effects. Firm FE of YES means that this part of the study controls for firm fixed effects. Year FE of YES means that this part of the study controls for time-related fixed effects. *** represents significance levels of 1%.
Table 8. Impact of fiscal decentralization.
(1)(2)
ln ( M 1 ) ln ( M 2 )
FD_DID0.336 ***0.003
(0.026)(0.011)
Constant−0.543 ***−0.497 ***
(0.159)(0.067)
City FEYESYES
Firm FEYESYES
Year FEYESYES
Observations152,170152,170
R squared0.4410.085
Notes: ln( M 1 ) is a proxy variable for the increase in capital investment in the enterprise’s governance of CO 2 . ln( M 2 ) is a proxy variable for the increase in capital investment in the enterprise’s governance of SO 2 . City FE of YES means that this part of the study controls for urban fixed effects. Firm FE of YES means that this part of the study controls for firm fixed effects. Year FE of YES means that this part of the study controls for time-related fixed effects. FD_DID is the interaction term between the city’s financial weighting value FD and the DID. *** represents significance levels of 1%.
Table 9. Impact of market segmentation.
(1)(2)
ln ( M 1 ) ln ( M 2 )
SEG_DID−0.014−0.040 ***
(0.034)(0.014)
Constant0.191−0.549 ***
(0.148)(0.063)
City FEYESYES
Firm FEYESYES
Year FEYESYES
Observations152,170152,170
R squared0.4410.085
Notes: ln( M 1 ) is a proxy variable for the increase in capital investment in the enterprise’s governance of CO 2 . Ln( M 2 ) is a proxy variable for the increase in capital investment in the enterprise’s governance of SO 2 . City FE of YES means that this part of the study controls for urban fixed effects. Firm FE of YES means that this part of the study controls for firm fixed effects. Year FE of YES means that this part of the study controls for time-related fixed effects. SEG_DID is the interaction term between the prefecture-level market segmentation index SEG and DID. *** represents significance levels of 1%.
Publisher’s Note: MDPI stays neutral with regard to jurisdictional claims in published maps and institutional affiliations.

