
Mobile Learning Acceptance Post Pandemic: A Behavioural Shift among Engineering Undergraduates


Abstract
:1. Introduction
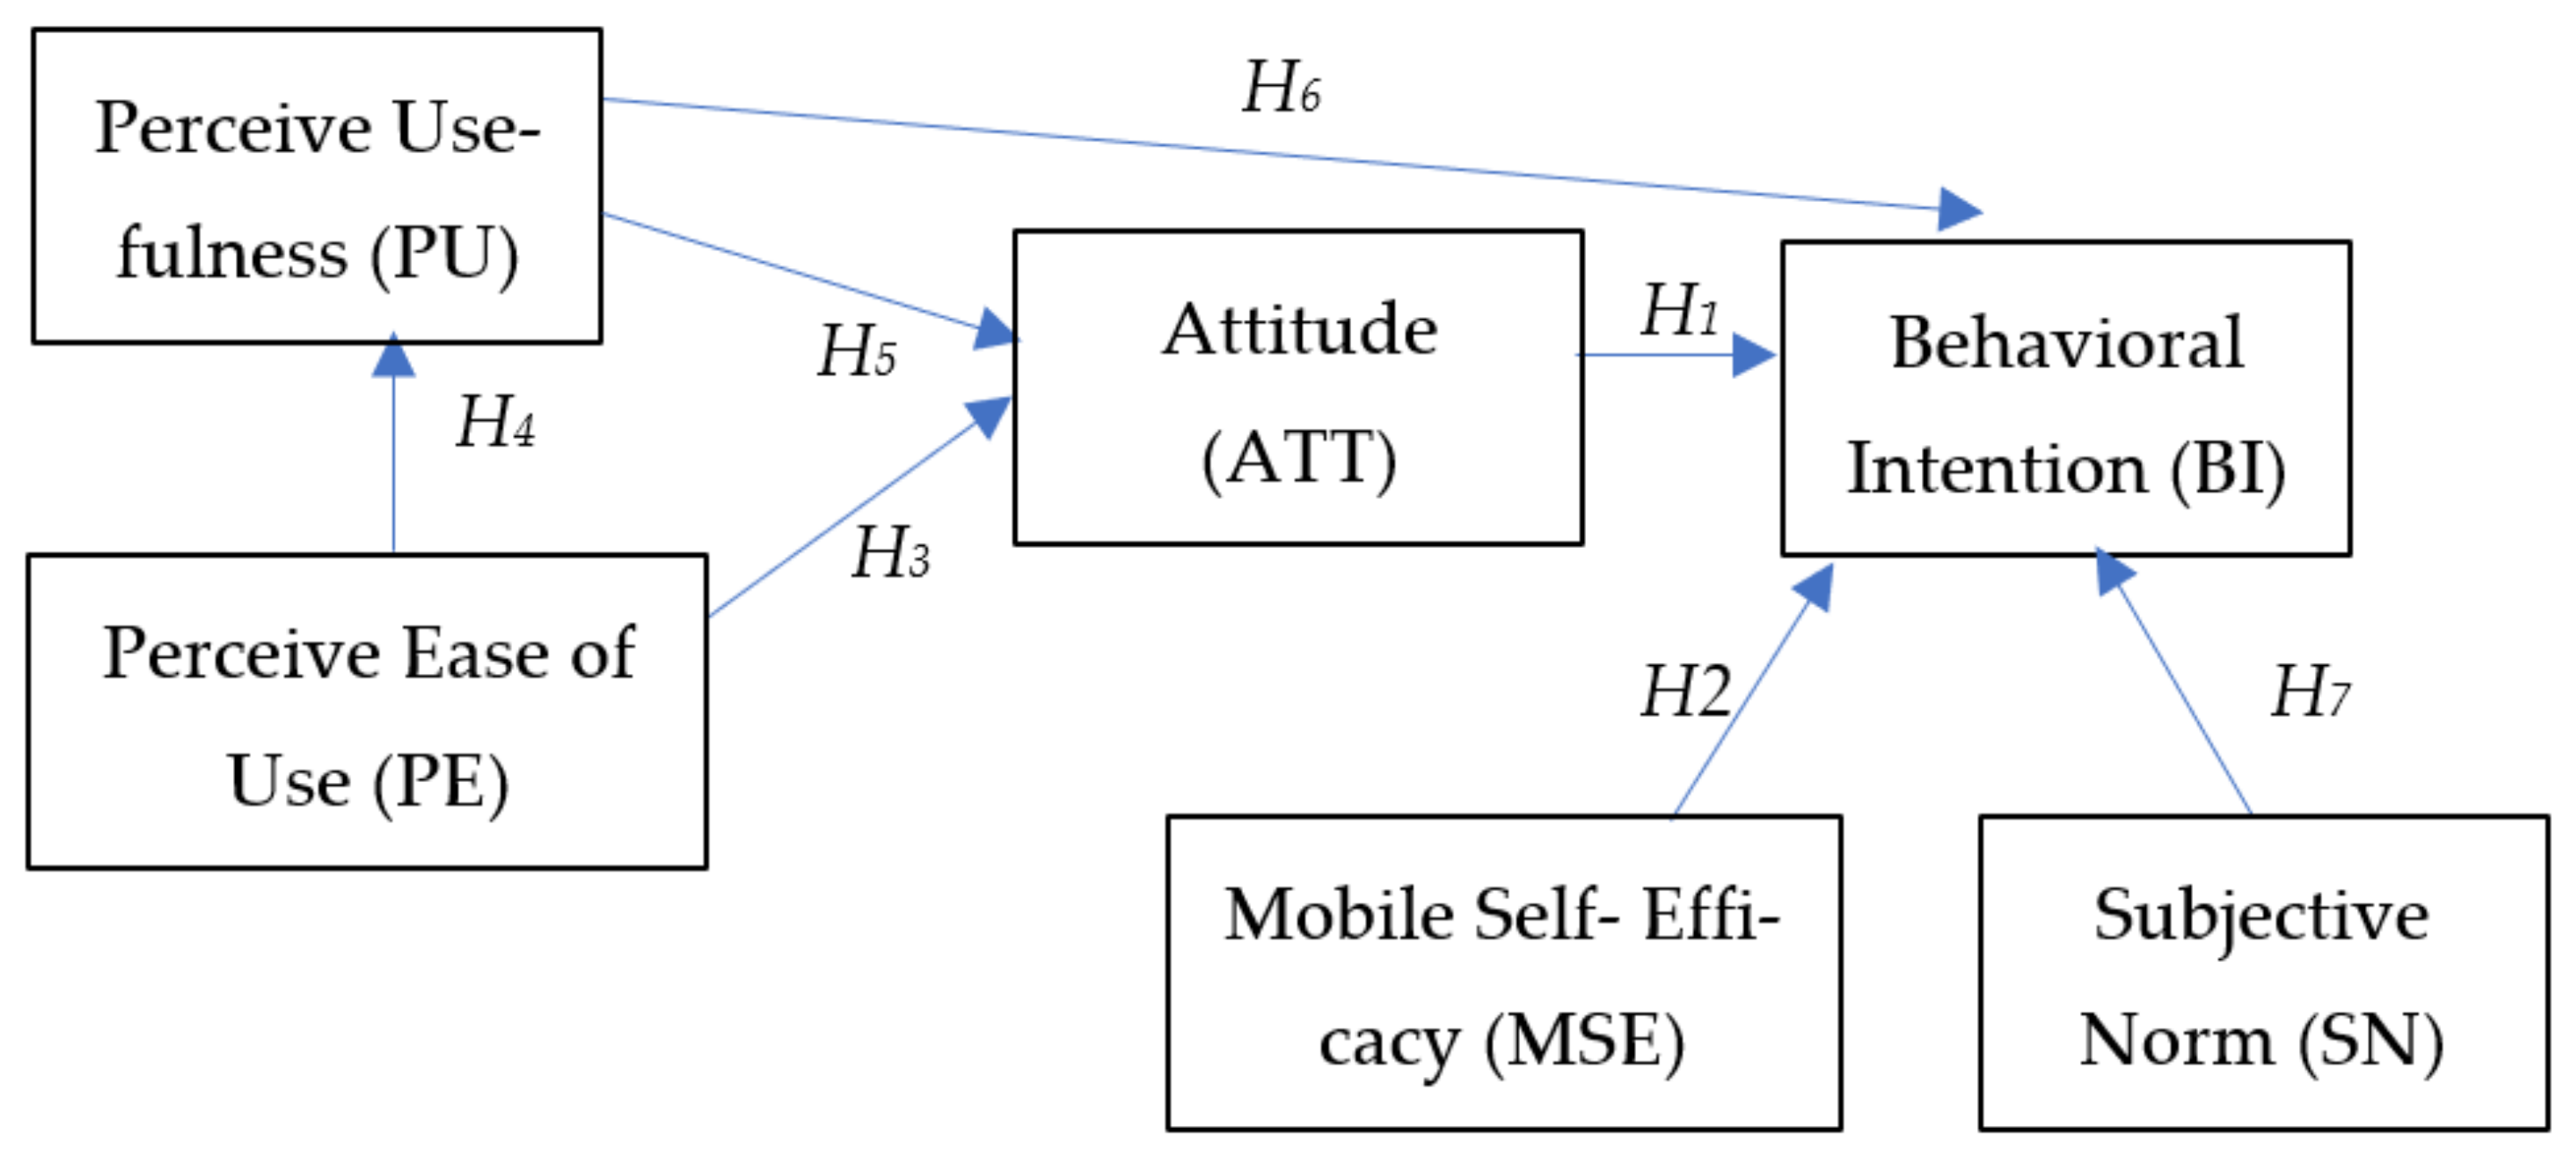
2. Hypotheses and Model Development
3. Research Design
4. Results
4.1. Respondents Profile
4.2. Study Power
4.3. Measurement Model Analysis
4.4. Structural Model
5. Discussion and Conclusions
6. Limitations and Future Studies
Author Contributions
Funding
Institutional Review Board Statement
Informed Consent Statement
Data Availability Statement
Acknowledgments
Conflicts of Interest
References
- Criollo-C, S.; Guerrero-Arias, A.; Jaramillo-Alcázar, Á.; Luján-Mora, S. Mobile learning technologies for education: Benefits and pending issues. Appl. Sci. 2021, 11, 4111. [Google Scholar] [CrossRef]
- Qiang, T.; Gao, H.; Ma, X. Pro-environmental behavior and smartphone uses of on-campus engineering students in Xi’an, China. PLoS ONE 2021, 16, 1–15. [Google Scholar] [CrossRef] [PubMed]
- Samad, M.R.A.; Ihsan, Z.H.; Khalid, F. The use of mobile learning in teaching and learning session during the Covid-19 pandemic in Malaysia. J. Contemp. Soc. Sci. Educ. Stud. 2021, 1, 46–65. [Google Scholar]
- Buabeng-Andoh, C. Exploring university students’ intention to use mobile learning: A research model approach. Educ. Inf. Technol. 2021, 26, 241–256. [Google Scholar] [CrossRef]
- Almaiah, M.A.; Al Mulhem, A. Analysis of the essential factors affecting of intention to use of mobile learning applications. Educ. Inf. Technol. 2019, 24, 1433–1468. [Google Scholar] [CrossRef]
- Kumar, J.A.; Rajamanickam, S.; Osman, S. Exploring the use of mobile apps for learning: A case study on final year engineering undergraduates in Malaysia. ASM Sci. J. 2020, 13, 63–67. [Google Scholar]
- Gezgin, D.M.; Adnan, M.; Acar Guvendir, M. Mobile learning according to students of computer engineering and computer education: A comparison of attitudes. Turk. Online J. Distance Educ. 2018, 19, 4–17. [Google Scholar] [CrossRef] [Green Version]
- Alturki, U.; Aldraiweesh, A. Students’ perceptions of the actual use of mobile learning during COVID-19 pandemic in higher education. Sustainability 2022, 14, 1125. [Google Scholar] [CrossRef]
- Güler, Ç. Use of WhatsApp in higher education what’s up with assessing peers anonymously? J. Educ. Comput. Res. 2017, 55, 272–289. [Google Scholar] [CrossRef]
- Kumar, J.A.; Bervell, B.; Annamalai, N.; Osman, S. Behavioral intention to use mobile learning: Evaluating the role of self-efficacy, subjective norm, and WhatsApp use habit. IEEE Access 2020, 8, 208058–208074. [Google Scholar] [CrossRef]
- Viberg, O.; Grönlund, Å. Understanding students’ learning practices: Challenges for design and integration of mobile technology into distance education. Learn. Media Technol. 2017, 42, 357–377. [Google Scholar] [CrossRef]
- Al-Emran, M.; Elsherif, H.M.; Shaalan, K. Investigating attitudes towards the use of mobile learning in higher education. Comput. Human Behav. 2016, 56, 93–102. [Google Scholar] [CrossRef]
- Almaiah, M.A.; Alamri, M.M.; Al-Rahmi, W. Applying the UTAUT model to explain the students’ acceptance of mobile learning system in higher education. IEEE Access 2019, 7, 174673–174686. [Google Scholar] [CrossRef]
- Mallya, K.R.; Srinivasan, B. Effect of cloud based mobile learning on engineering education. Int. J. Mech. Eng. Technol. 2019, 10, 614–621. [Google Scholar]
- Annamalai, N.; Kumar, J.A. Understanding smartphone use behavior among distance education students in completing their coursework in English: A mixed-method approach. Ref. Libr. 2020, 61, 199–215. [Google Scholar] [CrossRef]
- Garcia, A.; Vidal, E. Mobile-learning experience as support for improving the capabilities of the English area for engineering students. In Proceedings of the International Conference on Virtual Reality and Visualization (ICVRV), Hong Kong, China, 18–19 November 2019; pp. 202–204. [Google Scholar]
- Rafiq, K.R.M.; Hashim, H.; Yunus, M.M. Sustaining education with mobile learning for English for specific purposes (ESP): A systematic review (2012–2021). Sustainability 2021, 13, 9768. [Google Scholar] [CrossRef]
- Saikat, S.; Dhillon, J.S.; Ahmad, W.F.W.; Jamaluddin, R.A. A systematic review of the benefits and challenges of mobile learning during the covid-19 pandemic. Educ. Sci. 2021, 11, 459. [Google Scholar] [CrossRef]
- Almaiah, M.A.; Almomani, O.; Al-Khasawneh, A.; Althunibat, A. Predicting the Acceptance of Mobile Learning Applications During COVID-19 Using Machine Learning Prediction Algorithms. In Emerging Technologies During the Era of COVID-19 Pandemic. Studies in Systems, Decision and Control; Arpaci, I., Al-Emran, M., A. Al-Sharafi, M., Marques, G., Eds.; Springer: Cham, Switzerland, 2021; Volume 348, pp. 319–332. [Google Scholar]
- Al-Hamad, M.Q.; Mbaidin, H.O.; Alhamad, A.Q.M.; Alshurideh, M.T.; Al Kurdi, B.H.; Al-Hamad, N.Q. Investigating students’ behavioral intention to use mobile learning in higher education in UAE during Coronavirus-19 pandemic. Int. J. Data Netw. Sci. 2021, 5, 321–330. [Google Scholar] [CrossRef]
- Khlaif, Z.N.; Sanmugam, M.; Ayyoub, A. Impact of technostress on continuance intentions to use mobile technology. Asia Pac. Educ. Res. 2022, 1–12, Online ahead of print. [Google Scholar] [CrossRef]
- Loh, X.-K.; Lee, V.-H.; Loh, X.-M.; Tan, G.W.-H.; Ooi, K.-B.; Dwivedi, Y.K. The dark side of mobile learning via social media: How bad can it get? Inf. Syst. Front. 2021, 1–18. [Google Scholar] [CrossRef]
- Eneje, S. Real-world applications of mobile learning tools in engineering: Prospects, hindrances and accessibility in conjunction with scholastic views. In Proceedings of the IEEE Canadian Conference on Electrical and Computer Engineering (CCECE), London, ON, Canada, 30 August–2 September 2020; Volume 2020, pp. 1–8. [Google Scholar]
- Rumreich, L.E.; Kecskemety, K.M. First-year engineering student perceptions and use of iPad technologies: A quantitative investigation of mobile learning. In Proceedings of the 2019 IEEE Frontiers in Education Conference (FIE), Covington, KY, USA, 16–19 October 2019; pp. 1–5. [Google Scholar] [CrossRef] [Green Version]
- Corral Abad, E.; Gómez García, M.J.; Diez-Jimenez, E.; Moreno-Marcos, P.M.; Castejón Sisamon, C. Improving the learning of engineering students with interactive teaching applications. Comput. Appl. Eng. Educ. 2021, 29, 1665–1674. [Google Scholar] [CrossRef]
- Arain, A.A.; Hussain, Z.; Rizvi, W.H.; Vighio, M.S. Extending UTAUT2 toward acceptance of mobile learning in the context of higher education. Univers. Access Inf. Soc. 2019, 18, 659–673. [Google Scholar] [CrossRef]
- Cheon, J.; Lee, S.; Crooks, S.M.; Song, J. An investigation of mobile learning readiness in higher education based on the theory of planned behavior. Comput. Educ. 2012, 59, 1054–1064. [Google Scholar] [CrossRef]
- Gómez-Ramirez, I.; Valencia-Arias, A.; Duque, L. Approach to M-learning acceptance among university students. Int. Rev. Res. Open Distrib. Learn. 2019, 20, 141–164. [Google Scholar] [CrossRef]
- Taylor, S.; Todd, P.A. Understanding information technology usage: A test of competing models. Inf. Syst. Res. 1995, 6, 144–176. [Google Scholar] [CrossRef]
- Lai, C.L. Trends of mobile learning: A review of the top 100 highly cited papers. Br. J. Educ. Technol. 2020, 51, 721–742. [Google Scholar] [CrossRef]
- Oke, A.; Fernandes, F.A.P. Innovations in teaching and learning: Exploring the perceptions of the education sector on the 4th industrial revolution (4IR). J. Open Innov. Technol. Mark. Complex. 2020, 6, 31. [Google Scholar] [CrossRef]
- Yang, H.; Su, C. Learner behaviour in a MOOC practice-oriented course: In empirical study integrating TAM and TPB. Int. Rev. Res. Open Distrib. Learn. 2017, 18, 35–63. [Google Scholar] [CrossRef] [Green Version]
- Al-Mamary, Y.H.; Al-nashmi, M.; Hassan, Y.A.G.; Shamsuddin, A. A critical review of models and theories in field of individual acceptance of technology. Int. J. Hybrid Inf. Technol. 2016, 9, 143–158. [Google Scholar] [CrossRef]
- Morchid, N. The current state of technology acceptance: A comparative study. IOSR J. Bus. Manag. 2020, 22, 1–16. [Google Scholar] [CrossRef]
- Han, S.; Yi, Y.J. How does the smartphone usage of college students affect academic performance? J. Comput. Assist. Learn. 2019, 35, 13–22. [Google Scholar] [CrossRef] [Green Version]
- Moorthy, K.; Tzu Yee, T.; Chun T’ing, L.; Vija Kumaran, V. Habit and hedonic motivation are the strongest influences in mobile learning behaviours among higher education students in Malaysia. Australas. J. Educ. Technol. 2019, 35, 174–191. [Google Scholar] [CrossRef] [Green Version]
- Alasmari, T.; Zhang, K. Mobile learning technology acceptance in Saudi Arabian higher education: An extended framework and A mixed-method study. Educ. Inf. Technol. 2019, 24, 2127–2144. [Google Scholar] [CrossRef]
- Briz-Ponce, L.; Pereira, A.; Carvalho, L.; Juanes-Méndez, J.A.; García-Peñalvo, F.J. Learning with mobile technologies—Students’ behavior. Comput. Hum. Behav. 2017, 72, 612–620. [Google Scholar] [CrossRef]
- Park, S.Y. An analysis of the technology acceptance model in understanding university students’ behavioral intention to use e-learning research hypotheses. Educ. Technol. Soc. 2009, 12, 150–162. [Google Scholar]
- Cain, M.K.; Zhang, Z.; Yuan, K.-H. Univariate and multivariate skewness and kurtosis for measuring nonnormality: Prevalence, influence and estimation. Behav. Res. Methods 2016, 49, 1716–1735. [Google Scholar] [CrossRef]
- Zhang, Z.; Yuan, K.-H. Practical Statistical Power Analysis Using Webpower and R; ISDSA Press: Granger, IN, USA, 2018. [Google Scholar]
- Hair, J.F.; Risher, J.J.; Sarstedt, M.; Ringle, C.M. When to use and how to report the results of PLS-SEM. Eur. Bus. Rev. 2019, 31, 2–24. [Google Scholar] [CrossRef]
- Ramayah, T.; Yeap, J.A.L.J.; Ahmad, N.N.H.; Abdul-Halim, H.; Rahman, S.A.; Halim, H. Testing a confirmatory model of Facebook usage in SmartPLS using consistent PLS. Int. J. Bus. Innov. 2017, 3, 1–14. [Google Scholar] [CrossRef] [Green Version]
- Hair, J.F.; Ringle, C.M.; Sarstedt, M. Partial least squares structural equation modeling: Rigorous applications, better results and higher acceptance. Long Range Plan. 2013, 46, 1–12. [Google Scholar] [CrossRef]
- Dijkstra, T.K.; Henseler, J. Consistent and asymptotically normal PLS estimators for linear structural equations. Comput. Stat. Data Anal. 2015, 81, 10–23. [Google Scholar] [CrossRef] [Green Version]
- Henseler, J.; Ringle, C.M.; Sarstedt, M. A new criterion for assessing discriminant validity in variance-based structural equation modeling. J. Acad. Mark. Sci. 2015, 43, 115–135. [Google Scholar] [CrossRef] [Green Version]
- Henseler, J.; Hubona, G.; Ray, P.A. Using PLS path modeling in new technology research: Updated guidelines. Ind. Manag. Data Syst. 2016, 116, 2–20. [Google Scholar] [CrossRef]
- Hair, J.F.; Howard, M.C.; Nitzl, C. Assessing measurement model quality in PLS-SEM using confirmatory composite analysis. J. Bus. Res. 2019, 109, 101–110. [Google Scholar] [CrossRef]
- Shmueli, G.; Sarstedt, M.; Hair, J.F.; Cheah, J.H.; Ting, H.; Vaithilingam, S.; Ringle, C.M. Predictive model assessment in PLS-SEM: Guidelines for using PLSpredict. Eur. J. Mark. 2019, 53, 2322–2347. [Google Scholar] [CrossRef]
- Ringle, C.M.; Sarstedt, M. Gain more insight from your PLS-SEM results the importance-performance map analysis. Ind. Manag. Data Syst. 2016, 116, 1865–1886. [Google Scholar] [CrossRef]
- Ong, A.K.S.; Prasetyo, Y.T.; Young, M.N.; Diaz, J.F.T.; Chuenyindee, T.; Kusonwattana, P.; Yuduang, N.; Nadlifatin, R.; Redi, A.A.N.P. Students’ preference analysis on online learning attributes in industrial engineering education during the covid-19 pandemic: A conjoint analysis approach for sustainable industrial engineers. Sustainability 2021, 13, 8339. [Google Scholar] [CrossRef]
- Kumar, J.A. Educational chatbots for project-based learning: Investigating learning outcomes for a team-based design course. Int. J. Educ. Technol. High. Educ. 2021, 18, 65. [Google Scholar] [CrossRef]
- Kumar, J.A.; Silva, P.A. Work-in-progress: A preliminary study on students’ acceptance of chatbots for studio-based learning. In Proceedings of the IEEE Global Engineering Education Conference (EDUCON), Porto, Portugal, 27–30 April 2020; pp. 1627–1631. [Google Scholar]


| Study1 | Study2 | |||||
|---|---|---|---|---|---|---|
| Statistic | df | Sig. | Statistic | df | Sig. | |
| Perceive ease of use (PE) | 0.171 | 326 | 0.000 | 0.107 | 349 | 0.000 |
| Perceive usefulness (PU) | 0.127 | 326 | 0.000 | 0.114 | 349 | 0.000 |
| Attitude (ATT) | 0.153 | 326 | 0.000 | 0.142 | 349 | 0.000 |
| Behavioural intention (BI) | 0.166 | 326 | 0.000 | 0.147 | 349 | 0.000 |
| Mobile learning self-efficacy (MSE) | 0.170 | 326 | 0.000 | 0.143 | 349 | 0.000 |
| Subjective norm (SN) | 0.172 | 326 | 0.000 | 0.165 | 349 | 0.000 |
| Item | Description | Study1 | Study2 | ||
|---|---|---|---|---|---|
| n | % | n | % | ||
| 1.Gender | Male | 195 | 59.8 | 223 | 63.9 |
| Female | 131 | 40.2 | 126 | 36.1 | |
| 2. Mobile devices commonly used for learning | Netbook/Laptop | 113 | 26.46 | 262 | 43.74 |
| Smart Phone | 303 | 70.96 | 315 | 52.59 | |
| Tab | 11 | 2.58 | 22 | 3.67 | |
| Others | 0 | 0.00 | 0 | 0.00 | |
| Total | 427 | 599 | |||
| 3. Mobile applications most commonly used to communicate with learning peer | 296 | 34.26 | 345 | 46.12 | |
| 133 | 15.39 | 32 | 4.28 | ||
| Telegram | 137 | 15.86 | 262 | 35.03 | |
| Short Messaging System (SMS) | 135 | 15.63 | 15 | 2.01 | |
| Google Hangout | 83 | 9.61 | 28 | 3.74 | |
| IMO video chat | 77 | 8.91 | 38 | 5.08 | |
| Others (WeChat, Instagram, Snapchat, MS Teams, Discord) | 3 | 0.35 | 28 | 3.74 | |
| Total | 864 | 748 | |||
| 4. Mobile applications most commonly used to communicate with lecturers | 293 | 47.33 | 311 | 50.16 | |
| 58 | 9.37 | 5 | 0.81 | ||
| Telegram | 69 | 11.15 | 259 | 41.77 | |
| Short Messaging System (SMS) | 89 | 14.38 | 2 | 0.32 | |
| Google Hangout | 55 | 8.89 | 27 | 4.35 | |
| IMO video chat | 34 | 5.49 | 5 | 0.81 | |
| Others (WeChat, MS Teams) | 21 | 3.39 | 11 | 1.77 | |
| Total | 619 | 620 | |||
| 5. Mobile applications most commonly used to share information/notes with learning peers? | 299 | 40.68 | 340 | 51.83 | |
| 115 | 15.65 | 10 | 1.52 | ||
| Telegram | 113 | 15.37 | 274 | 41.77 | |
| Short Messaging System (SMS) | 74 | 10.07 | 4 | 0.61 | |
| Google Hangout | 79 | 10.75 | 16 | 2.44 | |
| IMO video chat | 50 | 6.80 | 5 | 0.76 | |
| Others (WeChat, MS Teams) | 5 | 0.68 | 7 | 1.07 | |
| Total | 735 | 656 | |||
| 6. Mobile applications used for learning | Email (e.g., Gmail, Yahoo Mail etc.) | 258 | 14.60 | 214 | 16.58 |
| Calendar (e.g., Google Calendar) | 139 | 7.87 | 39 | 3.02 | |
| Cloud storage (e.g., Dropbox, Google Drive etc.) | 180 | 10.19 | 118 | 9.14 | |
| Creating and editing documents (e.g., Google docs, Mobile Office 365 etc.) | 232 | 13.13 | 159 | 12.32 | |
| Educational games (e.g., Kahoot) | 191 | 10.81 | 89 | 6.89 | |
| Online learning platforms (e.g., Moodle, MOOC, CIDOS, Google Classroom) | 256 | 14.49 | 272 | 21.07 | |
| Internet surfing for learning Contents (e.g., Chrome, Firefox, YouTube) | 279 | 15.79 | 207 | 16.03 | |
| Reading (e.g., Adobe, Epub reader) | 232 | 13.13 | 56 | 4.34 | |
| Video conferencing (WebEx, Zoom, etc.) | 0 | 0.00 | 137 | 10.61 | |
| Total | 1767 | 1291 | |||
| 7. Access to internet | Personal data plan | 297 | 32.39 | 319 | 59.63 |
| WIFI at the institution | 261 | 28.46 | 57 | 10.65 | |
| WIFI at home | 179 | 19.52 | 137 | 25.61 | |
| Public WIFI | 180 | 19.63 | 22 | 4.11 | |
| Total | 917 | 535 | |||
| VAR | Item | Study1 | Study2 | ||||||||||
|---|---|---|---|---|---|---|---|---|---|---|---|---|---|
| Loadings | IR | CR | α | rho_A | AVE | Loadings | IR | CR | α | rho_A | AVE | ||
| ATT | ATT1 | 0.857 | 0.926 | 0.904 | 0.841 | 0.842 | 0.759 | 0.885 | 0.941 | 0.886 | 0.806 | 0.82 | 0.886 |
| ATT2 | 0.865 | 0.930 | 0.774 | 0.880 | |||||||||
| ATT3 | 0.891 | 0.944 | 0.885 | 0.941 | |||||||||
| BI | BI1 | 0.896 | 0.947 | 0.935 | 0.895 | 0.896 | 0.827 | 0.889 | 0.943 | 0.924 | 0.877 | 0.877 | 0.924 |
| BI2 | 0.918 | 0.958 | 0.907 | 0.952 | |||||||||
| BI3 | 0.913 | 0.956 | 0.890 | 0.943 | |||||||||
| MSE | MSE1 | 0.881 | 0.939 | 0.929 | 0.884 | 0.885 | 0.812 | 0.936 | 0.967 | 0.947 | 0.917 | 0.921 | 0.947 |
| MSE2 | 0.920 | 0.959 | 0.923 | 0.961 | |||||||||
| MSE3 | 0.902 | 0.950 | 0.918 | 0.958 | |||||||||
| PE | PE1 | 0.816 | 0.903 | 0.908 | 0.865 | 0.866 | 0.712 | 0.856 | 0.925 | 0.895 | 0.843 | 0.847 | 0.895 |
| PE2 | 0.837 | 0.915 | 0.769 | 0.877 | |||||||||
| PE3 | 0.874 | 0.935 | 0.864 | 0.930 | |||||||||
| PE4 | 0.847 | 0.920 | 0.810 | 0.900 | |||||||||
| PU | PU1 | 0.832 | 0.912 | 0.891 | 0.836 | 0.844 | 0.672 | 0.835 | 0.914 | 0.890 | 0.834 | 0.841 | 0.890 |
| PU2 | 0.788 | 0.888 | 0.792 | 0.890 | |||||||||
| PU3 | 0.893 | 0.945 | 0.880 | 0.938 | |||||||||
| PU4 | 0.759 | 0.871 | 0.760 | 0.872 | |||||||||
| SN | SN1 | 0.923 | 0.961 | 0.936 | 0.897 | 0.904 | 0.829 | 0.922 | 0.960 | 0.933 | 0.892 | 0.895 | 0.933 |
| SN2 | 0.911 | 0.954 | 0.923 | 0.961 | |||||||||
| SN3 | 0.898 | 0.948 | 0.876 | 0.936 | |||||||||
| Variables | ATT | BI | MSE | PE | PU | SN |
|---|---|---|---|---|---|---|
| Study1 | ||||||
| Attitude (ATT) | - | |||||
| Behavioural intention (BI) | 0.989 | - | ||||
| Mobile self-efficacy (MSE) | 0.902 | 0.935 | - | |||
| Perceive ease of use (PE) | 0.926 | 0.873 | 0.807 | - | ||
| Perceive usefulness (PU) | 0.986 | 0.911 | 0.862 | 0.966 | - | |
| Subjective norm (SN) | 0.836 | 0.814 | 0.86 | 0.782 | 0.84 | - |
| Study2 | ||||||
| Attitude (ATT) | - | |||||
| Behavioural intention (BI) | 0.984 | - | ||||
| Mobile self-efficacy (MSE) | 0.863 | 0.894 | - | |||
| Perceive ease of use (PE) | 0.949 | 0.858 | 0.785 | - | ||
| Perceive usefulness (PU) | 0.952 | 0.870 | 0.856 | 0.964 | - | |
| Subjective norm (SN) | 0.856 | 0.851 | 0.830 | 0.819 | 0.854 | - |
| Model | Study 1 | Study 2 | ||||
|---|---|---|---|---|---|---|
| Saturated Model | HI95 | Conclusion | Saturated Model | HI95 | Conclusion | |
| SRMR | 0.029 | 0.062 | Supported | 0.052 | 0.084 | Supported |
| d_ULS | 0.174 | 0.817 | Supported | 0.559 | 1.484 | Supported |
| d_G | 0.223 | 0.324 | Supported | 0.450 | 0.526 | Supported |
| Relationship | Study 1 | Study 2 | ||||||||||||||
|---|---|---|---|---|---|---|---|---|---|---|---|---|---|---|---|---|
| β | Stdev | t | p | CI 2.5% | CI 95% | f2 | VIF | β | Stdev | t | p | CI 2.5% | CI 95% | f2 | VIF | |
| H1: ATT → BI | 0.443 | 0.066 | 6.702 | 0.000 | 0.311 | 0.571 | 0.262 | 3.961 | 0.443 | 0.064 | 6.898 | 0.000 | 0.313 | 0.562 | 0.279 | 3.177 |
| H2: MSE → BI | 0.370 | 0.070 | 5.255 | 0.000 | 0.236 | 0.512 | 0.217 | 3.320 | 0.329 | 0.059 | 5.608 | 0.000 | 0.220 | 0.445 | 0.160 | 3.082 |
| H3: PE → ATT | 0.340 | 0.065 | 5.258 | 0.000 | 0.210 | 0.470 | 0.131 | 3.140 | 0.444 | 0.061 | 7.292 | 0.000 | 0.323 | 0.559 | 0.206 | 2.968 |
| H4: PE → PU | 0.826 | 0.020 | 41.368 | 0.000 | 0.784 | 0.863 | 2.140 | 1.000 | 0.814 | 0.019 | 41.986 | 0.000 | 0.773 | 0.851 | 1.968 | 1.000 |
| H5: PU →ATT | 0.546 | 0.062 | 8.751 | 0.000 | 0.420 | 0.668 | 0.338 | 3.140 | 0.420 | 0.065 | 6.457 | 0.000 | 0.295 | 0.549 | 0.184 | 2.968 |
| H6: PU →BI | 0.122 | 0.060 | 2.043 | 0.041 | 0.006 | 0.241 | 0.022 | 3.636 | 0.033 | 0.058 | 0.566 | 0.571 | -0.081 | 0.147 | 0.001 | 3.297 |
| H7: SN →BI | 0.038 | 0.065 | 0.588 | 0.557 | -0.089 | 0.167 | 0.003 | 2.903 | 0.161 | 0.057 | 2.818 | 0.005 | 0.052 | 0.280 | 0.041 | 2.860 |
| Variables | Study 1 | Study 2 | ||
|---|---|---|---|---|
| R2 | R2 Adjusted | R2 | R2 Adjusted | |
| ATT | 0.720 | 0.718 | 0.678 | 0.676 |
| BI | 0.811 | 0.809 | 0.779 | 0.777 |
| PU | 0.682 | 0.681 | 0.663 | 0.662 |
| Variable | Study 1 | Study 2 | ||||
|---|---|---|---|---|---|---|
| SSO | SSE | Q² (1-SSE/SSO) | SSO | SSE | Q² (1-SSE/SSO) | |
| ATT | 978.000 | 451.195 | 0.539 | 1047.000 | 542.601 | 0.482 |
| BI | 978.000 | 330.339 | 0.662 | 1047.000 | 401.746 | 0.616 |
| MSE | 978.000 | 978.000 | 0.000 | 1047.000 | 1047.000 | 0.000 |
| PE | 1304.000 | 1304.000 | 0.000 | 1396.000 | 1396.000 | 0.000 |
| PU | 1304.000 | 716.554 | 0.450 | 1396.000 | 782.615 | 0.439 |
| Variable | Indicator | Study 1 | Study 2 | ||||||||
|---|---|---|---|---|---|---|---|---|---|---|---|
| PLS | LM | a-b | PLS | LM | a–b | ||||||
| RMSE (a) | Q2 predict | RMSE (b) | Q2 predict | RMSE (a) | Q2 predict | RMSE (b) | Q2 predict | ||||
| ATT | ATT1 | 0.504 | 0.557 | 0.499 | 0.565 | 0.005 | 0.641 | 0.536 | 0.613 | 0.575 | 0.028 |
| ATT2 | 0.710 | 0.384 | 0.643 | 0.495 | 0.067 | 0.664 | 0.303 | 0.618 | 0.395 | 0.046 | |
| ATT3 | 0.591 | 0.465 | 0.554 | 0.531 | 0.037 | 0.643 | 0.483 | 0.622 | 0.517 | 0.021 | |
| BI | BI1 | 0.536 | 0.578 | 0.543 | 0.567 | −0.007 | 0.566 | 0.52 | 0.568 | 0.517 | −0.002 |
| BI2 | 0.506 | 0.606 | 0.507 | 0.604 | −0.001 | 0.575 | 0.539 | 0.579 | 0.532 | −0.004 | |
| BI3 | 0.498 | 0.638 | 0.491 | 0.648 | 0.007 | 0.562 | 0.638 | 0.541 | 0.666 | 0.021 | |
| PU | PU1 | 0.689 | 0.357 | 0.698 | 0.340 | −0.009 | 0.713 | 0.485 | 0.658 | 0.560 | 0.055 |
| PU2 | 0.568 | 0.524 | 0.534 | 0.579 | 0.034 | 0.721 | 0.398 | 0.702 | 0.430 | 0.019 | |
| PU3 | 0.470 | 0.577 | 0.463 | 0.589 | 0.007 | 0.615 | 0.542 | 0.574 | 0.601 | 0.041 | |
| PU4 | 0.668 | 0.354 | 0.643 | 0.401 | 0.025 | 0.745 | 0.334 | 0.722 | 0.375 | 0.023 | |
| Variable | Study 1 | Study 2 | ||
|---|---|---|---|---|
| Importance- Total Effects | Performance- Index Values | Importance- Total Effects | Performance- Index Values | |
| Attitude (ATT) | 0.463 | 80.572 | 0.458 | 74.574 |
| Mobile self-efficacy (MSE) | 0.372 | 73.096 | 0.300 | 64.756 |
| Perceive ease of use (PE) | 0.514 | 79.47 | 0.373 | 70.055 |
| Perceive usefulness (PU) | 0.411 | 77.14 | 0.221 | 69.492 |
| Subjective norm (SN) | 0.039 | 72.934 | 0.152 | 67.345 |
Publisher’s Note: MDPI stays neutral with regard to jurisdictional claims in published maps and institutional affiliations. |
© 2022 by the authors. Licensee MDPI, Basel, Switzerland. This article is an open access article distributed under the terms and conditions of the Creative Commons Attribution (CC BY) license (https://creativecommons.org/licenses/by/4.0/).
Share and Cite
Kumar, J.A.; Osman, S.; Sanmugam, M.; Rasappan, R. Mobile Learning Acceptance Post Pandemic: A Behavioural Shift among Engineering Undergraduates. Sustainability 2022, 14, 3197. https://doi.org/10.3390/su14063197
Kumar JA, Osman S, Sanmugam M, Rasappan R. Mobile Learning Acceptance Post Pandemic: A Behavioural Shift among Engineering Undergraduates. Sustainability. 2022; 14(6):3197. https://doi.org/10.3390/su14063197
Chicago/Turabian StyleKumar, Jeya Amantha, Sharifah Osman, Mageswaran Sanmugam, and Rasammal Rasappan. 2022. "Mobile Learning Acceptance Post Pandemic: A Behavioural Shift among Engineering Undergraduates" Sustainability 14, no. 6: 3197. https://doi.org/10.3390/su14063197
APA StyleKumar, J. A., Osman, S., Sanmugam, M., & Rasappan, R. (2022). Mobile Learning Acceptance Post Pandemic: A Behavioural Shift among Engineering Undergraduates. Sustainability, 14(6), 3197. https://doi.org/10.3390/su14063197