Article

Exchange Rates, Optimization of Industrial Resources Allocation Efficiency, and Environmental Pollution: Evidence from China Manufacturing

School of Economics and Management, Wuhan University, Wuhan 430072, China
*
Author to whom correspondence should be addressed.
Sustainability 2022, 14(5), 3121; https://doi.org/10.3390/su14053121
Submission received: 18 January 2022 / Revised: 24 February 2022 / Accepted: 1 March 2022 / Published: 7 March 2022

Abstract

:
The impact of exchange-rate fluctuations on resource reallocation is of particular interest to researchers and policymakers with China’s further opening to the international market and the transformation of economic growth. With high-speed growth, pollution issues have become an international concern. This paper examines how RMB exchange-rate movements affect resource allocation efficiency within industries at different pollution levels, based on the data of Chinese industrial enterprises during 1998–2007. Unlike previous studies, we analyze how within-industry productivity dispersion reacts to exchange-rate appreciation from the perspective of the heterogeneity across firms in their exposure to foreign competition in each industry. Our findings suggest that appreciation causes an increase in productivity dispersion, which implies a decrease in resource allocation efficiency. The increased dispersion of industries with higher pollution levels is more diminutive than lower levels. The productivity dispersion is intended to shrink for high-polluting industries due to the real exchange-rate appreciation. Appreciation plays a positive role in efficiency for pollution-intensive industries.

1. Introduction

The decline of China’s economic growth rate means development driven through investment is unsustainable. Improving resource allocation efficiency has become a social consensus. Changes in the global trade environment, especially the deterioration of China–US relations, have profoundly affected the behavior and performance of Chinese companies participating in the globalized market and have significantly impacted resource allocation efficiency within industries. As more and more companies are involved in globalized trading activities, the impact of changes in trade conditions due to exchange-rate fluctuations on resource allocation has received increasing attention from academics and policymakers. In addition, the environmental pollution that accompanies China’s rapid growth is also paid international attention. Production’s environmental problems lead to substantial healthcare costs and welfare losses and constrain sustainable economic development. China’s rapid economic development has become unsustainable through inefficient and energy-intensive production patterns. The Chinese government has implemented relevant laws and policies to control the environmental problems caused by the production activities. The paper attempts to study the heterogeneous effects of external shocks on the allocation of resources within industries at different pollution levels from the perspective of the distribution of companies within industries. The paper aims to (i) analyze and explore the mechanism of the impact of external shocks on the allocative efficiency within industries, and (ii) to investigate how the heterogeneity across industries in pollution affects the impact of a change in international competitive pressure industrial performance and restructuring.
The difference in environmental regulations between developed and emerging countries may play an essential role in forming the comparative advantages of China’s firms in international trade [1]. It is generally acknowledged that environments are a kind of resource, and environmental regulations impose high costs and therefore hinder the ability of domestic firms to compete in international markets. This loss of competitiveness may drive private firms and the economy to innovate and improve production efficiency. As a factor endowment, environment monitoring affects the trade of a country. Under free trade conditions, developing countries are relatively rich in labor and natural resource and thus produce labor-intensive and resource-intensive products, which are generally accompanied by high pollution [2]. Developed countries have comparative advantages in human capital and technology and have relatively clean production patterns. With the further development of China’s economy and more stringent environmental requirements, the change in the production costs of pollute-intensive industries from environment regulations will inevitably cause a loss of the firms’ comparative advantage in the international market and thus affect China’s trade patterns. A series of hypotheses has successfully identified the relationship between trade and environmental quality. Foremost among these is the pollution haven hypothesis and the Porter hypothesis. The pollution haven hypothesis suggests that environmental regulation makes the production of pollution-intensive goods expensive, so industries with dirtier production methods would move to relatively low-income developing countries with less stringent environmental requirements. Related compliance costs are hence generally lower. Therefore, products in high-pollution industries may be competitive for emerging countries than those in low-pollution industries, and high-pollution industries will attract more foreign direct investment. From the view of the Porter hypothesis, appropriate environmental regulation can encourage enterprises to carry out more innovative activities, increasing enterprises’ productivity. Therefore, the costs of enterprises caused by environmental protection are offset, and the profitability improves. Whichever theories it is, the distribution of firms that joined in international trade within those industries most affected by environmental regulation may be much different from that in cleaner industries.
Exchange-rate fluctuation can affect the efficiency of resource allocation within industries through market structure and establishment-level productivity variation. Appreciations of the home currency usually increase the relative price of domestic goods in the international market and decrease the relative price of foreign products in the domestic market. The patterns of firms exposed to international competition due to the real appreciation and the distribution of these firms within an industry determine the performance reallocation efficiency of the industry. Empirical evidence from developed countries shows that real exchange-rate appreciations make it more difficult for domestic firms to compete in export markets, reducing the export scale and decreasing their total revenue, similarly affecting their level of productivity, i.e., scale effect. For smaller, less productive firms, the decreased relative prices of imported goods due to appreciation lead to an increase in domestic market competition and are forced to exit the market, which can increase industry-level productivity because of truncating the lower end of the productivity distribution. This is known as the selection effect [3]. The effect of imported inputs—which constitute most of the emerging country trade—on firm productivity is also an important channel. The reduction of imported inputs price decreases the firms’ production costs, increases the number of imported products, and raises domestic products [4]. All these three effects may affect industrial resource allocation efficiency.
The differences in environmental regulations between countries tend to cause different trade structures. As the largest emerging market country which majority trade with the developed countries, China is more competitive in labor-intensive industries, which is generally accompanied by high pollution, lower elasticity of products demand, and therefore lower elasticity of substitution in foreign markets than in capital-intensive industries. Furthermore, foreign investors in pollution-intensive industries from developed countries prefer emerging countries with lower environmental costs imposed with high environmental regulation costs. Although high-tech industries are generally skill-intensive and less harmful to the environment, Chinese firms in these industries may not be competitive in international markets and even in domestic markets. For these reasons, the heterogeneity in pollution levels across industries can lead to different impacts of China’s real exchange-rate appreciation on resource allocation efficiency within industries.
This paper assembles and assesses the evidence on whether the allocation efficiency responses to exchange-rate appreciation differ between high and low pollution levels. We explore mechanisms for the different responses. The terms of the debate and the nature of the problems are relevant to policymakers’ decisions and enterprise managers’ behaviors in response to external shocks, significantly as the Chinese government has been strengthening and improving environmental policies and regulations to prevent environmental pollution and improve environmental quality. Theoretically, as environmental regulations are strengthened, firms in industries most affected by regulations will bear significantly increasing production costs. However, the industries friendly to the environment could be less affected by environmental regulations. Therefore, the driven companies at different productivity also have different environmental costs, leading to changes in resource allocation. On the other hand, cost changes by companies at different productivity due to environmental regulations lead to their heterogeneous responses to exchange-rate shocks, which affect resource allocation within the industry.
Industry productivity dispersion is generally used to measure resource allocation efficiency [3,5,6,7]. In the absence of market distortions and frictions, market resources and production factors are allocated according to product price, reflecting firm productivity, and therefore there is no resource misallocation. Nevertheless, in the presence of market distortions and frictions, market prices do not fully reflect the productivity level of companies, and resources are misallocated. When an industry is more efficient in resource allocation, the productivity of companies calculated using earnings will tend to be consistent, and therefore the productivity dispersion, which aims to measure the deviation of productivity from the industry mean, will decrease. On the contrary, in the case of less efficient resource allocation, companies’ productivity calculated with their earnings will show deviation from the industry productivity mean, and then the productivity dispersion will increase [8]. Therefore, the paper researches the role of environmental protection efforts on resource allocation efficiency by studying the effect of exchange rates on productivity dispersion in industries with different pollution levels [9,10,11,12].

2. Review of the Literature

The related literature can be divided into two categories: one category relates to the correlation between the environmental pollution level in industries and comparative advantage in trade. The other category believes that high-pollution industries in developing countries have more comparative advantage than developed countries. Robison [13] discovers that the degree of environmental regulation impacts the comparative advantage of US industries; the high-pollution industries are more inclined to import, while low-pollution industries are more inclined to import when the degree of environmental regulation increases. Lucas [14] discovered that the degree of environmental regulation in the OECD countries increases, and the pollution intensity in emerging market countries gradually increases. It is shown by Mani and Wheeler [15] research that environmental regulations reduce the comparative advantage of industries and that the shift of polluting industries abroad is only temporary. Quiroga [16] empirical research also suggests that developing countries have a comparative advantage in international trade if they have lower levels of environmental regulation. As for the Chinese data, Chen [17] shows that the improvement of environmental pollution in China after trade liberalization is mainly due to a decrease in the consumption of fossil fuels such as coal and the improvement of enterprise technology. Li and Lu [18] discover the non-linear effect of environmental regulation on the comparative advantage of Chinese industries in trade. Some literature suggests that changes in environmental costs may change companies’ comparative advantage in international trade by altering their incentives for innovation activities. According to the research findings of Zhu [19], local governments may attract FDI through environmental regulation conditions. Porter and Linde [20] and Ambec and Barla [21] find that reasonable environmental regulations can promote more technological innovation activities by companies and thus improve their productivity and competitiveness. This literature implies that in the case of weak environmental regulations in international trade, the products from high-pollution industries may be less substitutable than products from low-pollution industries in developed countries with a substantial degree of environmental regulations, and foreign companies may also favor high-pollution industries.
The literature regarding the impact of exchange rates on the allocation of resources in industries mainly relates to the impact of changes in the relative prices of imported and exported products on changes in the allocation of resources within industries. The channels through which the exchange rate affects productivity can be divided into three categories: foreign sales channel, intermediate goods import channel, and imported products market competition channel. The impact of exchange rate on productivity distribution is related to the trade distribution of companies related to the three channels. The related literature is illustrated in these three aspects.
There are three main aspects in the distribution of exporting companies within an industry that affect the response of company behavior to the exchange rate: export dependence, export industry costs, and export exchange rate elasticity. In general, the export dependence of companies is positively correlated with the negative impact of exchange-rate appreciation. Ekholm [22] theoretically illustrate, assuming constant prices and sales volume in foreign markets, the elasticity of exporters’ earnings to the exchange rate is equal to the share of export earnings in companies’ total earnings, i.e., every 1% appreciation of the exchange rate results in decline in companies’ total earnings being equal to the share of export earnings. Dai and Xu [23] find that the export dependence of companies, as reflected in the export earnings share, is positively correlated with the output and labor demand reduction effect due to exchange-rate appreciation. Differences in the elasticity of companies’ exports to the exchange rate also affect the export scale effect. Berman [24] discovered that companies with higher production efficiency take market-based pricing steps, with a slight change in export volume to the exchange rate related to selling costs in the export destination country. Li [25] finds using Chinese manufacturing data that an increase in company TFP by one standard error decreases the elasticity of export volume by 10.5%, and the cost of sales in the export destination country is negatively correlated with the response of export volume to the exchange rate. The export fixed costs affect the export of some companies within an industry. Bernard [26] finds using U.S. data that on average, less than 50% of companies in an industry are exporters; on average, exporting companies are more productive than non-exporting companies, and the share of exports of the high-productivity company rises as trade costs fall. For the distribution of exporting companies, higher productivity within the industry can cover the fixed cost of exports and help access export opportunities. The higher the productivity of companies, the smaller the marginal cost, the larger the export size. However, the export exchange rate is less elastic while output is also larger. In the case of exchange-rate appreciation, higher-productivity companies’ export scale decline range and industry productivity dispersion show a decreasing tendency. From the perspective of export exchange-rate elasticity, exchange-rate appreciation increases the export scale gap between exporting companies and further expands industry productivity dispersion. Therefore, the impact of exchange-rate appreciation on industry productivity dispersion may be related to the difference in export shares between different productivity companies within the industry and export exchange-rate elasticity.
There are two mechanisms relating to the impact of imports of intermediate goods on company productivity: first similar to the quality ladder model in which the quality of imported intermediate goods is generally higher than domestic ones, intermediate goods imports can improve the quality of domestic companies’ products and enhance their competitiveness; secondly, similar to the product diversification model in which there is imperfect substitution between intermediate imported goods and domestically produced intermediate goods, importing foreign intermediate goods is helpful to alleviate domestic companies’ production constraints and improve their production technology [4]. The increase in imports of input goods has a significant promotion effect on productivity, the presence of foreign companies, the cost of importing companies, the initial import scale, and other factors that can affect the productivity growth effect brought by the import of intermediate goods [27,28,29]. It is shown from other studies using Chinese data that SOEs and FDI also affect the productivity growth effect of imports of intermediate goods. Brandt [30] research on the impact of the decline in import tariffs on the productivity distribution of Chinese manufacturing companies after China’s accession to the WTO shows that the decline in input tariffs has a boosting effect on the productivity of Chinese companies, and this effect is more evident for private companies and new entrants. Companies with higher productivity and lower cost of access to foreign product information can import more quantities and more types of intermediate goods. The fixed cost of importing intermediate goods in the industry, the distribution of foreign companies, and the production constraints of companies may influence the response of industry productivity dispersion to the exchange rate. The decrease in the import price of intermediate goods enhances the quality of imported products, reduces production costs and technical constraints, lowers industry prices. Then resources are transferred from inefficient companies to highly productive ones, while potential competitors with higher productivity can enter the market, expanding the industry productivity.
The decrease in the relative prices of foreign imported products has increased the market’s competitiveness. Changes in allocating resources within an industry are related to competition in the market and differences between companies’ and foreign products [31]. Melitz [32] theatrically demonstrates that the entry of foreign goods into the domestic market makes domestic companies bear higher competitive pressure, and their profits decline. Companies with lower productivity in the industry will exit the market. Market share will be redistributed among companies to improve resource allocation efficiency. Pavcnik [33] research data show that for the productivity gains from import competition in the Chilean manufacturing industry, the import-competitive sector over-performs by 3–10% over the non-tradable sector, and the competition from imported products causes inefficient domestic companies to exit the market and improves efficient resource allocation, which promotes a significant increase in the efficiency of the Chilean manufacturing industry. Topalova and Khandelwal [29] believe the reduction in tariffs on final goods leads to an increase in productivity of Indian manufacturing companies, and the contribution rate of the upgrading effect to the productivity increase of companies within the sample is 21%. Tomlin and Fung [3] empirically that exchange-rate appreciation for the Canadian manufacturing industry leads to an increase in productivity for companies in the lower quartile of the productivity distribution (selection effect), but a decrease in productivity for companies in the higher quartile. Yu [34] finds using double difference, based on the 2005 timetable of RMB exchange-rate regime reform, and the competitive environment leads to a 1.1% increase in company productivity. Lucia [35] finds the innovation induced by competition can also affect productivity dispersion. There is also evidence from the empirical literature finding that the competitive effect of imported products reduces the productivity of surviving companies.

3. Data Description and Variable Measurement

Our empirical results draw on both an extensive and comprehensive micro-database of Chinese manufacturing firms and macro-level indicators constructed from various data sources. We describe these data below.

3.1. Firm-Level Production Data

The firm production-side information in the paper is obtained from the Annual Surveys of Industrial Production (ASIP), conducted by the National Bureau of Statistics of China (NBC), over 1998–2007. The China Industrial Enterprise Database (or Annual Surveys of Industrial Production) is established by the National Bureau of Statistics of China, and its data mainly comes from the quarterly and annual reports submitted by sample enterprises to the local Bureau of Statistics. Its sample range is all state-owned industrial enterprises and non-state-owned industrial enterprises above designated size, and its statistical unit is corporate legal person. The database includes the basic information and the financial data of the enterprises. More details about ASIP can be obtained from http://www.stats.gov.cn/ (accessed on 15 January 2022). The samples from ASIP over 1998–2007 are widely used in China’s manufacturing micro-level economic studies, especially firms’ productivity, such as Brandt [30,36], Li [25], Dai [23] Hsieh [6] and so on. The reason that these studies choose the sample over 1998–2007 may be the global financial crisis in 2008, which leads to amounts of firms to exit abnormally. In addition, after 2011, the statistical standard of firms’ revenue in ASIP has changed to 20 million RMB from 5 million RMB. In addition, the data of ASIP from 2013 onwards are not yet published. Referring to Brandt [30], data from all years are combined, and all national industry classification codes are converted to classification standards after 2003. Outliers are removed according to the following methods: excluding sample values with less than eight employees, total output equal to or less than 0, total assets less than fixed assets, negative fixed costs, and negative inputs. Referring to price deflators provided by Brandt [36], the total output value, value-added and intermediate inputs are converted to their actual values. The enterprise labor productivity ratio is actual output and employees discounted using the deflator. The total factor productivity of companies is calculated using the actual output in the database of industrial companies according to the method provided by Olley and Pakes [37]. In this paper, attention is only paid to the manufacturing industry. Therefore, only the Chinese industry category (CIC) coded 13–42 remains, with about 1.5 million samples from 1998 to 2007.

3.2. Country-Level and Industry-Level Data

There are two sources of trade data used in this paper. The trade data for calculating the real effective exchange rate and the data for counting the imports and exports of other countries with China are obtained from the CEPII database according to Xi [38], Disdier [39], Wei [40], Porteous [41] and so on. The CEPII is the leading French center for research and expertise on the world economy. The database is built from data directly reported by each country to the United Nations Statistical Division (Comtrade). You can obtain these data from http://www.cepii.fr/CEPII/en/bdd_modele/presentation.asp?id=37) (accessed on 15 January 2022). The trade data of companies with different productivity levels within industries is obtained from the Chinese customs database, mainly from 2000 to 2006. The paper draws on the approach of Li [25], the data from the customs database are processed to remove outliers in the following manner: excluding data with missing trade values and quantities; excluding samples of products with annual growth in unit export values and quantities in the top 5% and bottom 5% of the industry. Then the data in the customs database are matched with the industrial enterprise database, based on the enterprise name and year, which aims to exclude any samples of companies whose exports are more extensive than their outputs and whose imported intermediate inputs are more significant than the total intermediate inputs used. The trade statistics values of each industry from 2000 to 2006 are calculated based on the trade data of the matched companies, and the annual average values are taken as the proxy variables for studying the trade characteristics statistics of each industry.
The real GDP and inflation indices, nominal exchange rate data, and Chinese TFP used in this paper are from the Penn World Table (PWT9.0). Data on China’s tariffs are obtained from the WITS database. Data on China’s FDI-restricted entry policies are obtained from Brandt [36].
Industry pollution intensity data are from Li [42] and the China Environmental Yearbook.

3.3. Variable Measurement

Industry productivity dispersion. According to Hsieh and Klenow [6] and Balasubramanian and Sivadasan [5], resource allocation efficiency in the industry is measured at the productivity dispersion. In the benchmark regression, this paper takes the standard deviation of labor productivity of companies in the industry as a proxy for productivity dispersion. The enterprise labor productivity is the logarithm of the ratio of actual enterprise output to the number of employees. Then the standard deviation of enterprise labor productivity within the industry is calculated at the four-digit code level in the Chinese National Industrial Classification Standard, which is the industry productivity dispersion. The productivity dispersion of the industry i in the t year can be expressed as
d i s p e r s i o n i t = s d ln p r o d u c t i v i t y i k t
where p r o d u c t i v i t y i k t is the labor productivity for a firm k within industry i in year t . In the robustness test, we take firm total factor productivity to replace labor productivity to calculate the industry-standard deviation as a proxy for industry productivity dispersion, i.e., d i s p e r s i o n i t = s d ln T F P i k t , where T F P i k t represents the total factor productivity for firm k in industry i in year t . The frequency of dispersion is yearly. Therefore, we obtain 3520 samples over 1998–2007.
Real effective exchange rate. The real effective exchange rate for industry i in year t is the weighted average of the RMB’s real exchange rate against each country’s currency by share of trade in the industry i in that country. The real exchange rate is defined as the nominal exchange rate of the foreign currency against the Chinese RMB, multiplied by the ratio of the Chinese CPI to the foreign CPI.
r e r j t = n e r j / C H N , t × C P I C H N , t C P I j t
where j represents a foreign country. n e r j / C H N , t is the nominal exchange rate of country j against the RMB and C P I j t represents the CPI of country j. By this definition, an increase in the exchange-rate value implies an appreciation of the Chinese RMB against the currency of a foreign country.
The real exchange rate is then normalized for each country using 1998 as the base year, giving us a relative real exchange rate:
r r e r = r e r j t r e r j 1998 × 100
Industry-specific trade weights are constructed based on exports and imports from each industry’s trading partners. The weights are based on lagged exports and imports, with trade data collected from CEPII. The trade-weighted effective real exchange rate t w r e r i t for industry i in year t is calculated as follows:
t w r e r i t = j ( T W i j , t 1 × r r e r j t )
T W i j , t 1 = ( X + M ) i j , t 1 j ( X + M ) i j , t 1
where T W i j , t 1 is the trade value share of country j in total trade with China in industry i during year t 1 . X + M is the total trade value, i.e., exports plus imports. Therefore, the real effective exchange rate of the industry i in year t is the weighted average of the relative real exchange rate, weighted with trade share of j country with China in the last year. Figure 1 shows the relationship between the productivity dispersion and the effective real exchange rate.
Industry pollution level. The pollution level of industry i is measured with the pollution intensity. Pollution intensity is obtained by linearly standardizing the industry’s emissions per unit of output value for wastewater, waste gas, and solid waste, simply averaging the standardized emissions and then averaging the pollution intensity annually over the sample period. High-pollution is a dummy variable that classifies industries above the median pollution intensity as high-pollution industries and records as 1, and industries below the median as low-pollution industries, records as 0.
The change of productivity dispersion overtime for the high and low-pollution industries is shown in Figure 2. Figure 2 shows that the productivity dispersion of the low-pollution industry is higher than that of the high-pollution industry before 2003, and the productivity dispersion of the low-pollution industry is lower than that of the high-pollution industry after 2003.

3.4. Distribution of Companies in Industries with Different Pollution Levels

As mentioned in the literature review, the impact of exchange rate on productivity dispersion in different industries can be compared and analyzed in three channels with different impact effects: export scale effect, intermediate goods import price effect, and final-goods import market competition effect. To explore the impact of exchange-rate appreciation on productivity dispersion in industries with different pollution levels, we divide industries into high and low-pollution industries and compare the differences in trade structure between the two industries. The paper compares the trade structures of industries with different pollution levels from the two dimensions: first, the trade structures of industries with different pollution levels over time; second, the comparison of trade structures of companies with different productivity in industries with different pollution levels.
Figure 3 shows the share of exports and imports of high and low-pollution industries in the value of trade, i.e., the percentage of exports and imports of high and low-pollution industries, respectively, in the total value of exports and imports. Figure 3a,b indicate that in terms of export and import value, low-pollution industries are higher than high-pollution industries, and the gap is evident over time. Therefore, for the Chinese manufacturing industry, the trade of products from low-pollution industries plays a dominant role, with more than 70% of both export and import values in 2007.
For exchange-rate shocks, the differences between export intensity, import intensity, and import penetration within an industry are crucial in explaining the efficiency of resource allocation within the industry. Industry export intensity is defined as the ratio of industry exports to total output. Industry import intensity is defined as the ratio of the value of industry imports of intermediate goods to industry input costs, where input costs are the sum of intermediate inputs and employee wages. Industry import penetration is the ratio of the value of final goods imported by the industry to the value of domestic sales of the industry. The average values of export intensity and import intensity of high and low-pollution industries are shown in Figure 4. It is shown from Figure 4 that the export intensity and import intensity of low-pollution industries are higher than those of high-pollution industries. There is an increasing trend for all industries over time for export intensity.
The change of industry import intensity over time fluctuates obviously. The change of the average value of industry import penetration over time is shown in Figure 4, and it is shown that the import penetration of high-pollution industries is higher than that of low-pollution industries, which implies that exchange-rate appreciation may make the market competition of products within the high-pollution industry fiercer than that of the low-pollution industry. Figure 5 represents the net exposure of the industry, which is the industry average, by subtracting the import intensity from the export intensity of the industry. It is seen from Figure 5 that the net trade intensity tends to increase over time, and there is no significant difference in the mean values of net trade exposure between high and low-pollution industries.
From the above conclusions, it is shown that there is no fundamental change in the position of high and low-pollution industries in trade.
The companies with labor productivity below 10% are marked as ten quantile groups. The companies with labor productivity quantile above 10% but below 20% are marked as 20 quantile groups. The companies with labor productivity quantile above 90% are marked as 100 quantile groups. The export intensity of a company is defined as the ratio of the value of the company’s exports to the value of the company’s total output. Import intensity is defined as the ratio of the intermediate inputs imported by the company to the total input cost of the company, which is the sum of the value of inputs and employee wages. Then the export and import intensities of each company within a group in the industry are summed to obtain that group’s export and import intensities. Each group’s export and import intensities are averaged over the years as a measure of the export and import intensities of each group, and the results are shown in Figure 6.
In terms of export intensity, the export intensity of low-pollution industries is higher than that of high-pollution industries at different productivity levels. The relationship between export intensity and productivity in low-pollution industries shows an inverted-U-shaped trend. In contrast, the relationship between export intensity and productivity in high-pollution industries is positive, and the higher the productivity, the higher the export intensity. For a net exporter, appreciation negatively affects both ends of the productivity distribution of low-pollution industries less than those in the middle. In contrast, the negative effect for high-productivity industries is more remarkable for higher-productivity companies, while low-productivity companies may not be significant. As for the import intensity, the import intensity of low-pollution industries is higher than that of high-pollution industries except for the 100 quantile group. Import intensity increases with increasing productivity for all industries. It is shown by comparing import intensities at different productivities within the same industry. There is a more noticeable difference in import intensities between the ten quantile group and the 100 quantile group for the high-pollution industries than those for the low-pollution industries. Suppose the decrease in the import price of intermediate goods favors increased productivity. In that case, the increasing difference in import intensity between high- and low-productivity companies will increase the industry productivity dispersion and the efficiency of resource allocation decrease. The net exposure of different productivity is equal to the export intensity minus the import intensity, as shown in Figure 7. It is possible to conclude that the net exposure of high-productivity companies is lower than that of low-productivity companies. The net exposure of low-pollution industries is higher than that of high-pollution industries, which implies that exchange-rate appreciation may make the negative effect of low-pollution industries greater than that of high-pollution industries. The net exposure of low-productivity companies is higher than that of high-productivity companies, implying that the exchange-rate appreciation may cause the negative effect of low-productivity companies to be greater than that of high-productivity companies, and therefore the productivity dispersion rises.
The import penetration of different productivity is shown in Figure 8, and the import penetration of each quartile group of the industry is calculated by dividing the value of imports of final goods within that group by the value of domestic sales. The figure shows that the import penetration of high-pollution industries is higher than that of low-pollution industries, and low-pollution industries show the more negligible difference of import penetration at different productivities. The import penetration of companies in the tail of the productivity distribution of high-pollution industries is higher than that of companies in the middle, which means that high-pollution industries may face higher competitive pressure in the market after the exchange-rate appreciation.

4. Regression Model and Results

4.1. Regression Model

To investigate how pollution varieties affect the relationship between exchange-rate appreciation and productivity dispersion for industries, we employ fixed effect model with an unbalanced panel to estimate the impact of the real effective exchange rate on productivity dispersion for industries with different pollution levels. Our analysis uses disaggregated trade-weighted exchange rate, which enables us to control for country-time fixed effected, therefore eliminating spurious correlation due to aggregate shocks to the manufacturing sector. In this way, we can consider real exchange-rate (RER) movements as shifts in the relative price of tradable goods that operate as shocks exogenous to individual firms [43]. Meanwhile, a large body of empirical work has shown that the RER contains an important autonomous component driven by changes in the nominal exchange rate and that fluctuations in the RER are very hard to predict with fundamentals in the short and medium run [43,44]. Omitted-variable bias is perhaps more of a concern. In particular, positive aggregate supply shocks should be positively correlated with the RER, while positive demand shocks should negatively correlate with the RER. Therefore, we always control for the aggregate growth rate of the economy. In addition, we identify the causal impact of RER movements using exchange-rate weighted by lagged trade. The fixed effect model can control industry-level time-unvaried variables, which can avoid omitted-variable bias. The control variables include China’s aggregate technology improvement in year t , t f p t . The logarithm of the weighted average of the real GDP of exporting countries captures foreign market demand for products in industry i in year t , ln g d p i t . The logarithm of China’s real GDP controls domestic demand, c h n g d p t . Import tariff in year t in industry i is t a r i f f i t . The simple average of the industry’s export tariff to each country of industry i in year t is t a r i f f i t * . f d i i t , a dummy variable for barriers to foreign direct investment entry in year t in industry i , where 1 means that the country has restrictions on foreign direct investment entry and 0 represents no restrictions. s c a l e i t measures the average company size, which is expressed as the logarithm of the company’s employees. s t a t e i t aims to control the share of the output of state-owned firms and f o r e i g n i t to measure the share of the output of foreign-owned firms in industry i in year t .
The empirical model in this paper is shown in Equation (6)
d i s p e r s i o n i t = β 1 ln t w r e r i t + β 2 ln t w r e r i t * ϕ i + β 3 X i t + β 4 α t + α i
where d i s p e r s i o n i t represents the productivity dispersion in the t period of the four-digit code classification industry i   ln t w r e r i t is the logarithm of the real effective exchange rate in the t period of the industry i . ϕ i represents the pollution intensity of industry i . X i t is the vector of controls, including the import tariff t a r i f f i t * and export tariff t a r i f f i t that the firms of industry i faced in year t . α t is the vector of time-invariant controls, including t f p t and the real GDP. α i is the industry-level fixed effects. When the pollution level is measured with the dummy variable, a highly polluting industry is 1. Otherwise, it will be 0.

4.2. Regression Results

The paper first regresses the productivity dispersion using the real effective exchange rate, and the regression results are shown in Table 1. Column (1) random-effects model is employed in the table. The fixed-effects model is used in Column (2), the country-level control variable is added in Column (3), the industry-level control variable is added in Column (4), and the industry mean of the company-level control variable is added in Column (5). The regression results from Table 1 show that appreciations increase industry productivity dispersion, which is significant at the 1% confidence level. The industry productivity dispersion expands by 0.14 every 1% appreciation of the exchange rate.
The interaction term between industry pollution intensity p o l l u t e i , which measures the degree of industrial pollution, and the exchange rate is included. Since pollution intensity is an industry variable that does not vary over time, its coefficient is fully co-linear with the fixed-effects term. The pollution intensity coefficient is not included when the fixed-effects model is used. The regression results are shown in Table 2. Column (1) indicates the regression results when no country- and industry-level control variables are included. Column (2) indicates the inclusion of country-level control variables, and Column (3) indicates the inclusion of industry-level control variables. The regression results show that exchange-rate appreciation causes industry productivity dispersion to widen, and the effect of exchange rate on industry production dispersion decreases as the pollution level increases, which implies that the higher the pollution level of the industry, the less the industry productivity dispersion widens as the exchange-rate appreciates. Both the estimated exchange rate and the interaction term coefficients are significant at the 1% confidence level.
The dummy variable h i g h i aims to measure the degree of pollution, the value “1” means a high-pollution industry and 0 means a low-pollution industry, and the regression results are shown in Table 3. Column (1) indicates no other control variables, Column (2) indicates the inclusion of country-level control variables, and Column (3) indicates the inclusion of industry-level control variables. The results in Table 3 show that exchange-rate appreciation increases productivity dispersion in high-pollution industries, smaller than that in low-pollution industries. At 1% exchange-rate appreciation, the productivity dispersion increases by 0.383% for low-pollution industries, but for the high-pollution industries, the exchange-rate appreciation makes the productivity dispersion decrease by 0.142% ((0.383–0.525) ×1%).

4.3. Robustness Tests

The dependent variable productivity dispersion is replaced with the total factor productivity standard deviation. The regression results are shown in Table 4 and Table 5. Table 4 indicates the degree of pollution is based on regression results of the pollution intensity of the industry. Table 5 indicates that the degree of pollution is based on the dummy variable of whether it is a highly polluting industry. The regression results show that the higher the exchange-rate appreciation, the higher the pollution degree of the industry, the smaller the expansion of total factor productivity dispersion, and the smaller the decrease of resource allocation efficiency. It is shown from Table 5 every 1% exchange-rate appreciation, the total factor productivity dispersion of the low-pollution industry increases by 0.325%, and the total factor productivity dispersion of the high-pollution industry decreases by 0.159%. The exchange-rate appreciation makes resource allocation efficiency of low-pollution industry decrease, and resource allocation efficiency of high-pollution industry increase, which is consistent with the results of the benchmark regression.

4.4. Exit and Entry of Companies

Entry and exit are important ways for companies to allocate resources within an industry. To analyze the mechanism of resource allocation efficiency changes in different pollution-level industries, we analyze the response of company entry and exit to exchange-rate appreciation in industries with different pollution levels. Three regression models are employed for the regression: linear probability, probit, and logit. The regressions are conducted for high and low-pollution industries, respectively. The probability of entry and exit of companies with different pollution levels due to exchange-rate appreciation is analyzed according to the productivity grouping of the companies. Table 6 shows the regression results of exchange-rate appreciation on the exit probability of companies in different pollution industries. It is concluded from Table 6 that the effect of exchange-rate appreciation on the exit probability of companies in high-pollution industries is not significant, while the probability of low-pollution industries is positive and significant, which may be related to the ownership attributes of companies. Due to exchange-rate appreciation and lower import prices of final goods, the relative prices of domestic goods will rise, their competitiveness may decline, and their profits may decrease. Chinese high-pollution industry has a comparative advantage in the international market with a small share of state-owned companies and a high share of private and foreign companies; private companies can adjust more effectively, while foreign companies have better risk resistance to exchange rate shocks. Foreign-funded companies are generally advantaged in information and have a higher share of imported intermediate goods, and exchange-rate appreciation will lead to lower costs. Compared with the state-owned companies, private companies have a better ability to adjust in the case of the price drop of foreign inputs, and they can improve their production methods, increase production efficiency, and deal with the adverse effects of the competition of export and foreign products. The proportion of state-owned companies in low-pollution industries is relatively high. When the export side is negatively impacted, China implements the SOEs reform policy and does not subsidize inefficient SOEs, increasing their probability of exiting the market.
Table 7 shows the estimated impact of exchange-rate appreciation on the entry of companies in industries with different pollution levels. It is concluded from Table 6 that exchange-rate appreciation all makes an entry of high-productivity companies more possible but makes an entry of low-pollution industries more impossible. In the case of exchange-rate appreciation, input import prices fall, Companies with production constraints may enter the market by importing inputs. In addition, the appreciation of the exchange rate makes the import price of final products decrease, inefficient companies exit, the market entry threshold rises, and potential entrants with higher efficiency enter, which makes the efficiency of the right end of the industry productivity distribution increase. It is shown by comparing the regression results of high-pollution industries and low-pollution industries, the entry probability of companies in low-pollution industries is negative: the higher the productivity, the smaller the absolute value of the probability, which means that for low-pollution industries, exchange-rate appreciation is not significant for companies at different productivities. For highly polluting industries, the entry probability of high-productivity companies is positive when the exchange-rate appreciates, while the entry probability of low-productivity companies is not significant.

5. Conclusions

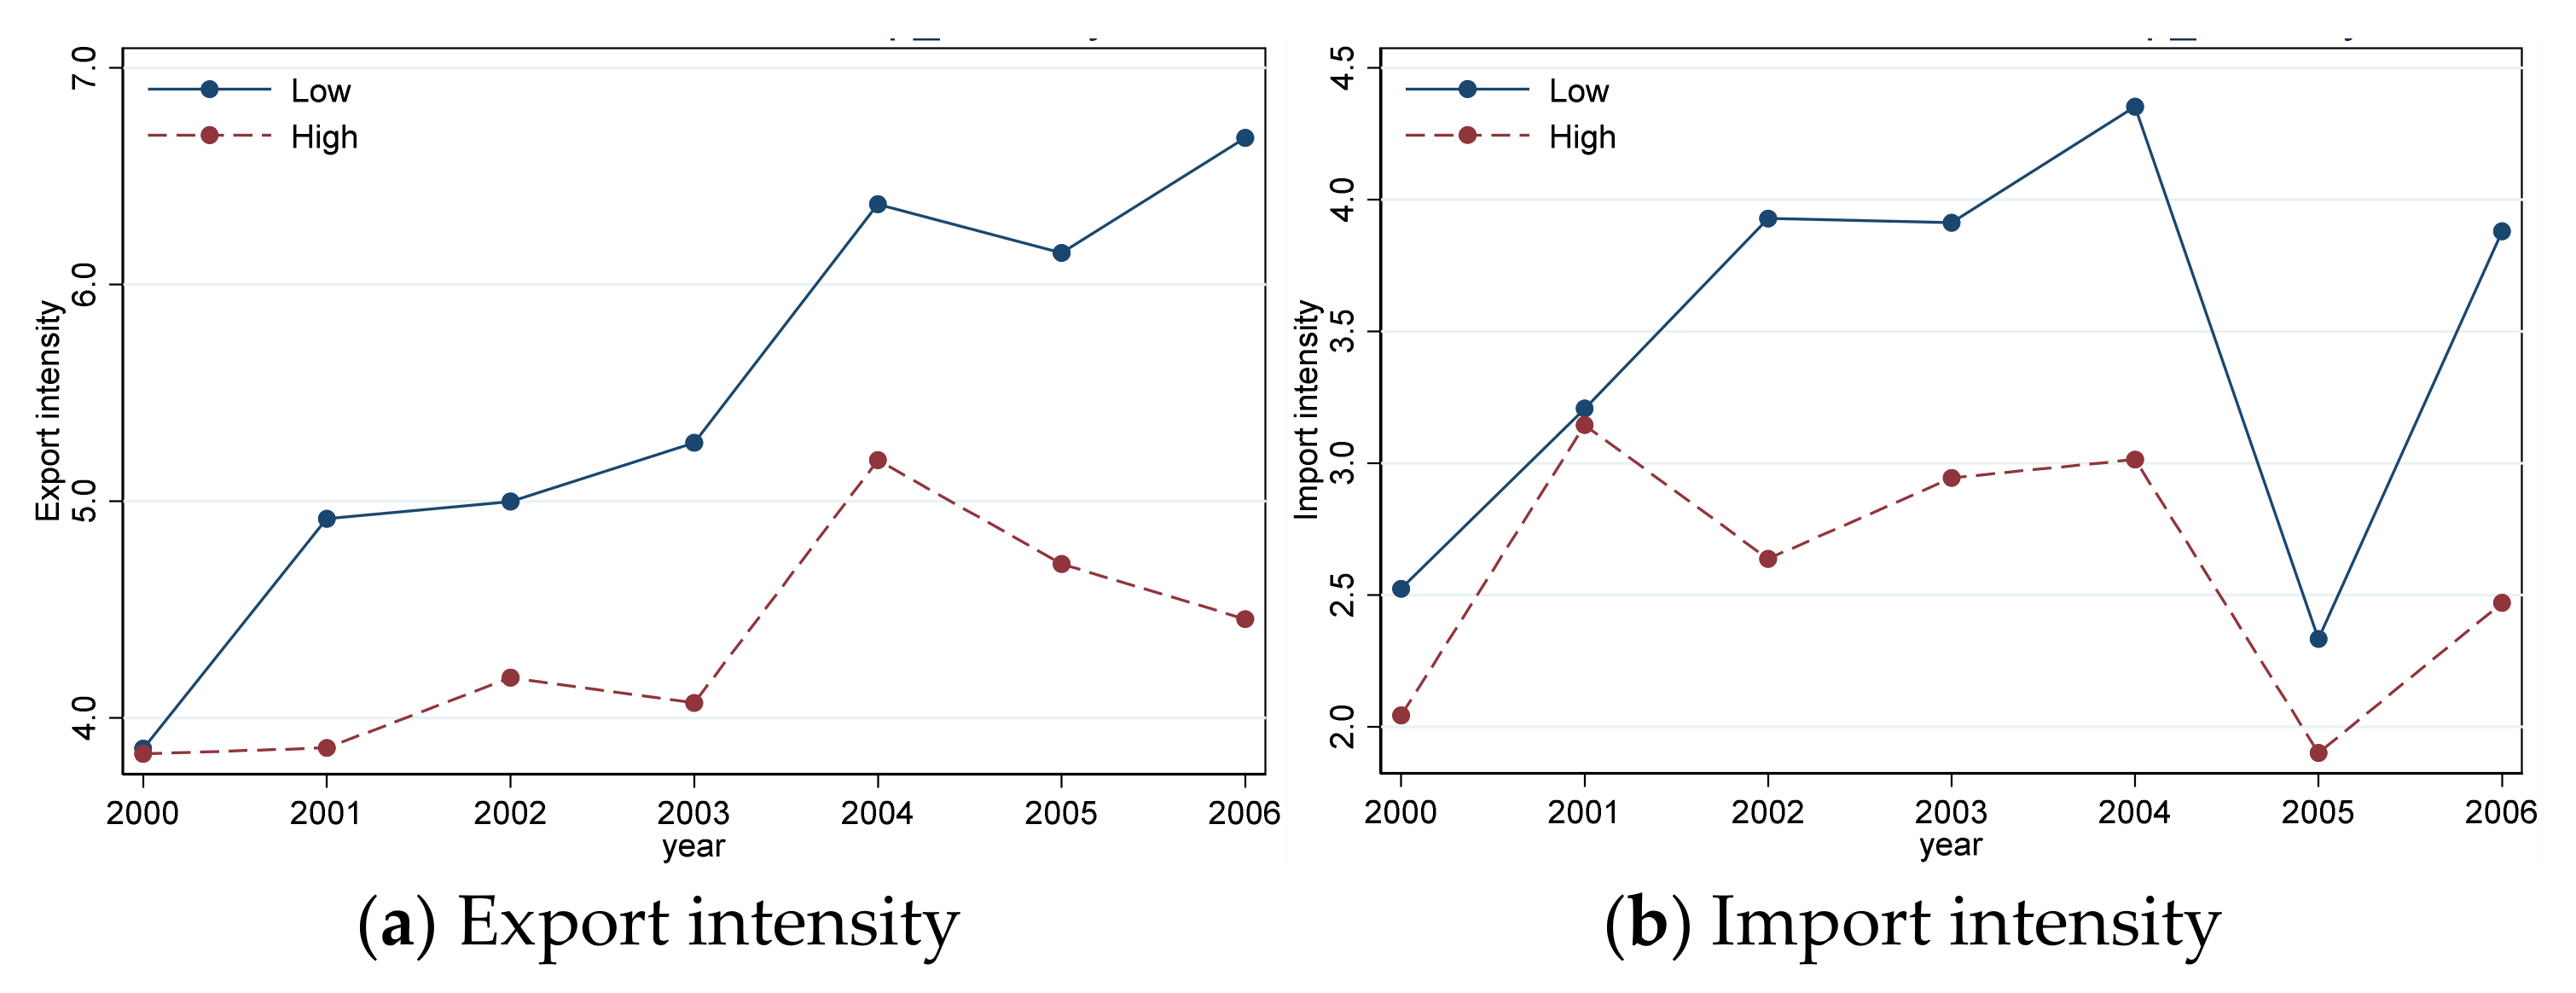
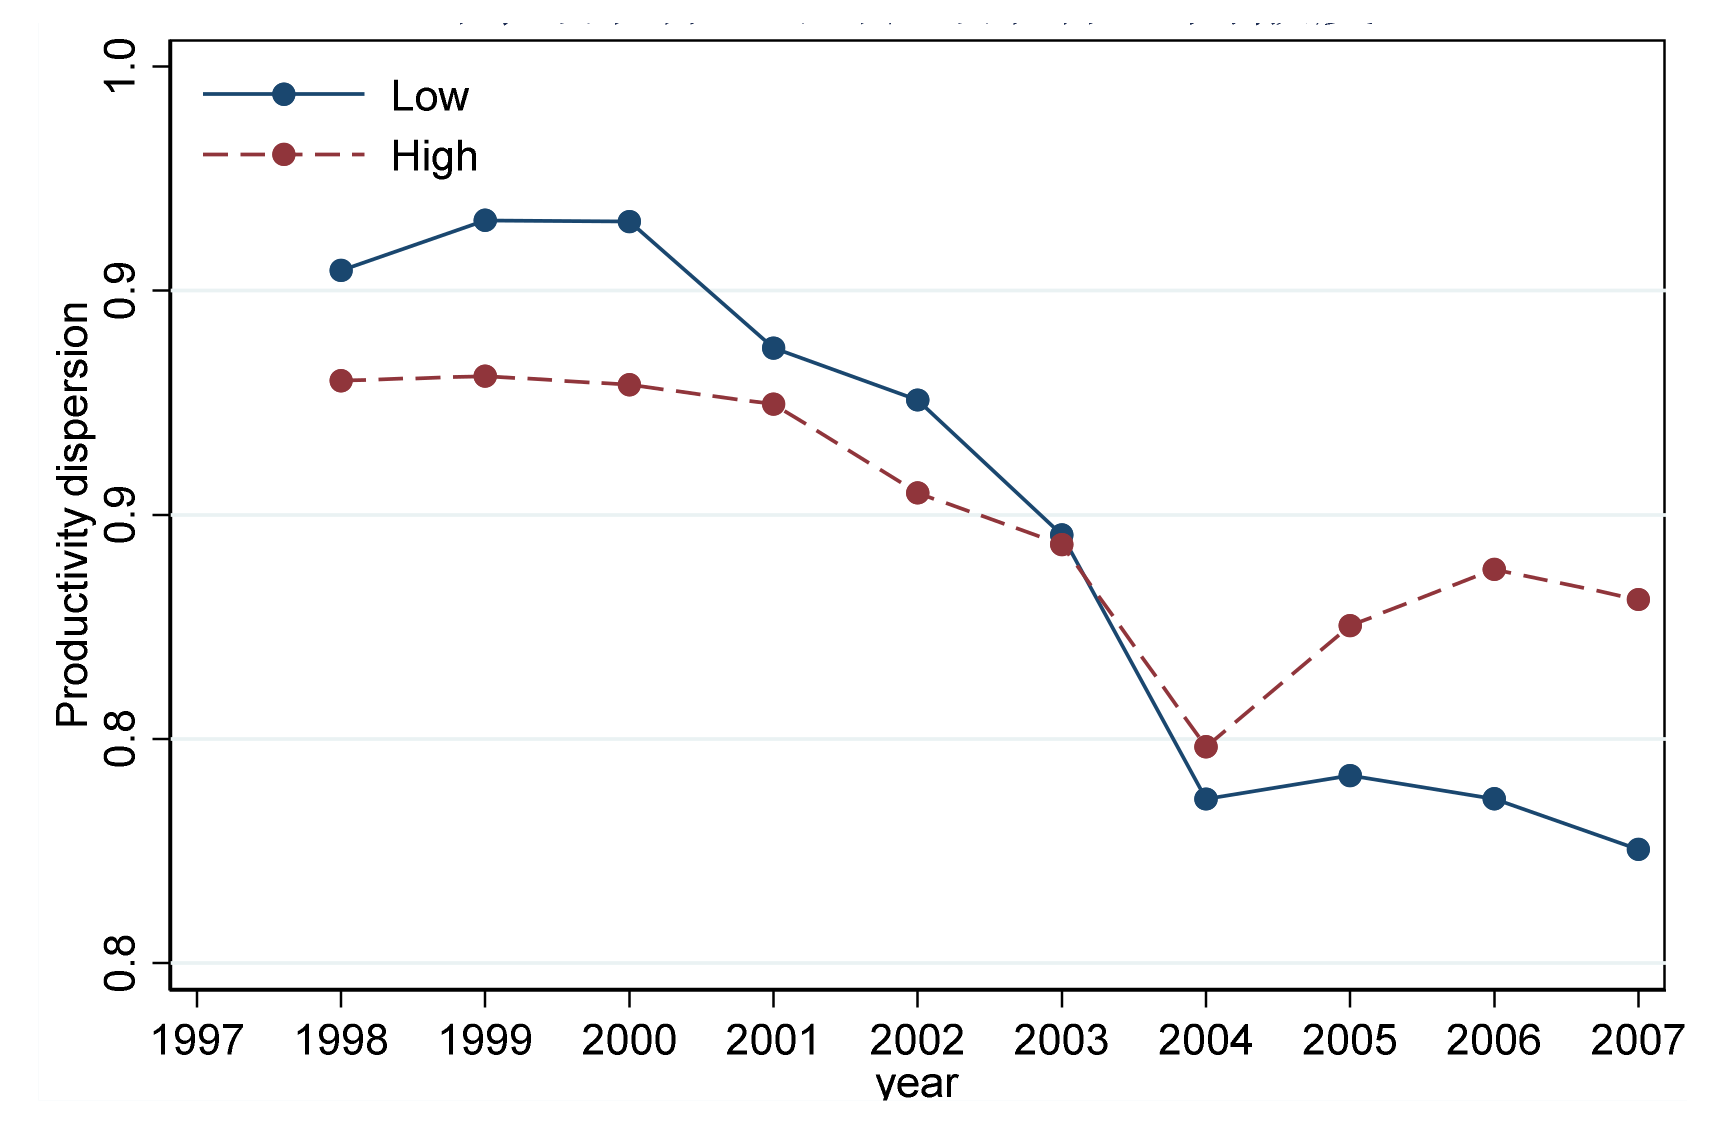
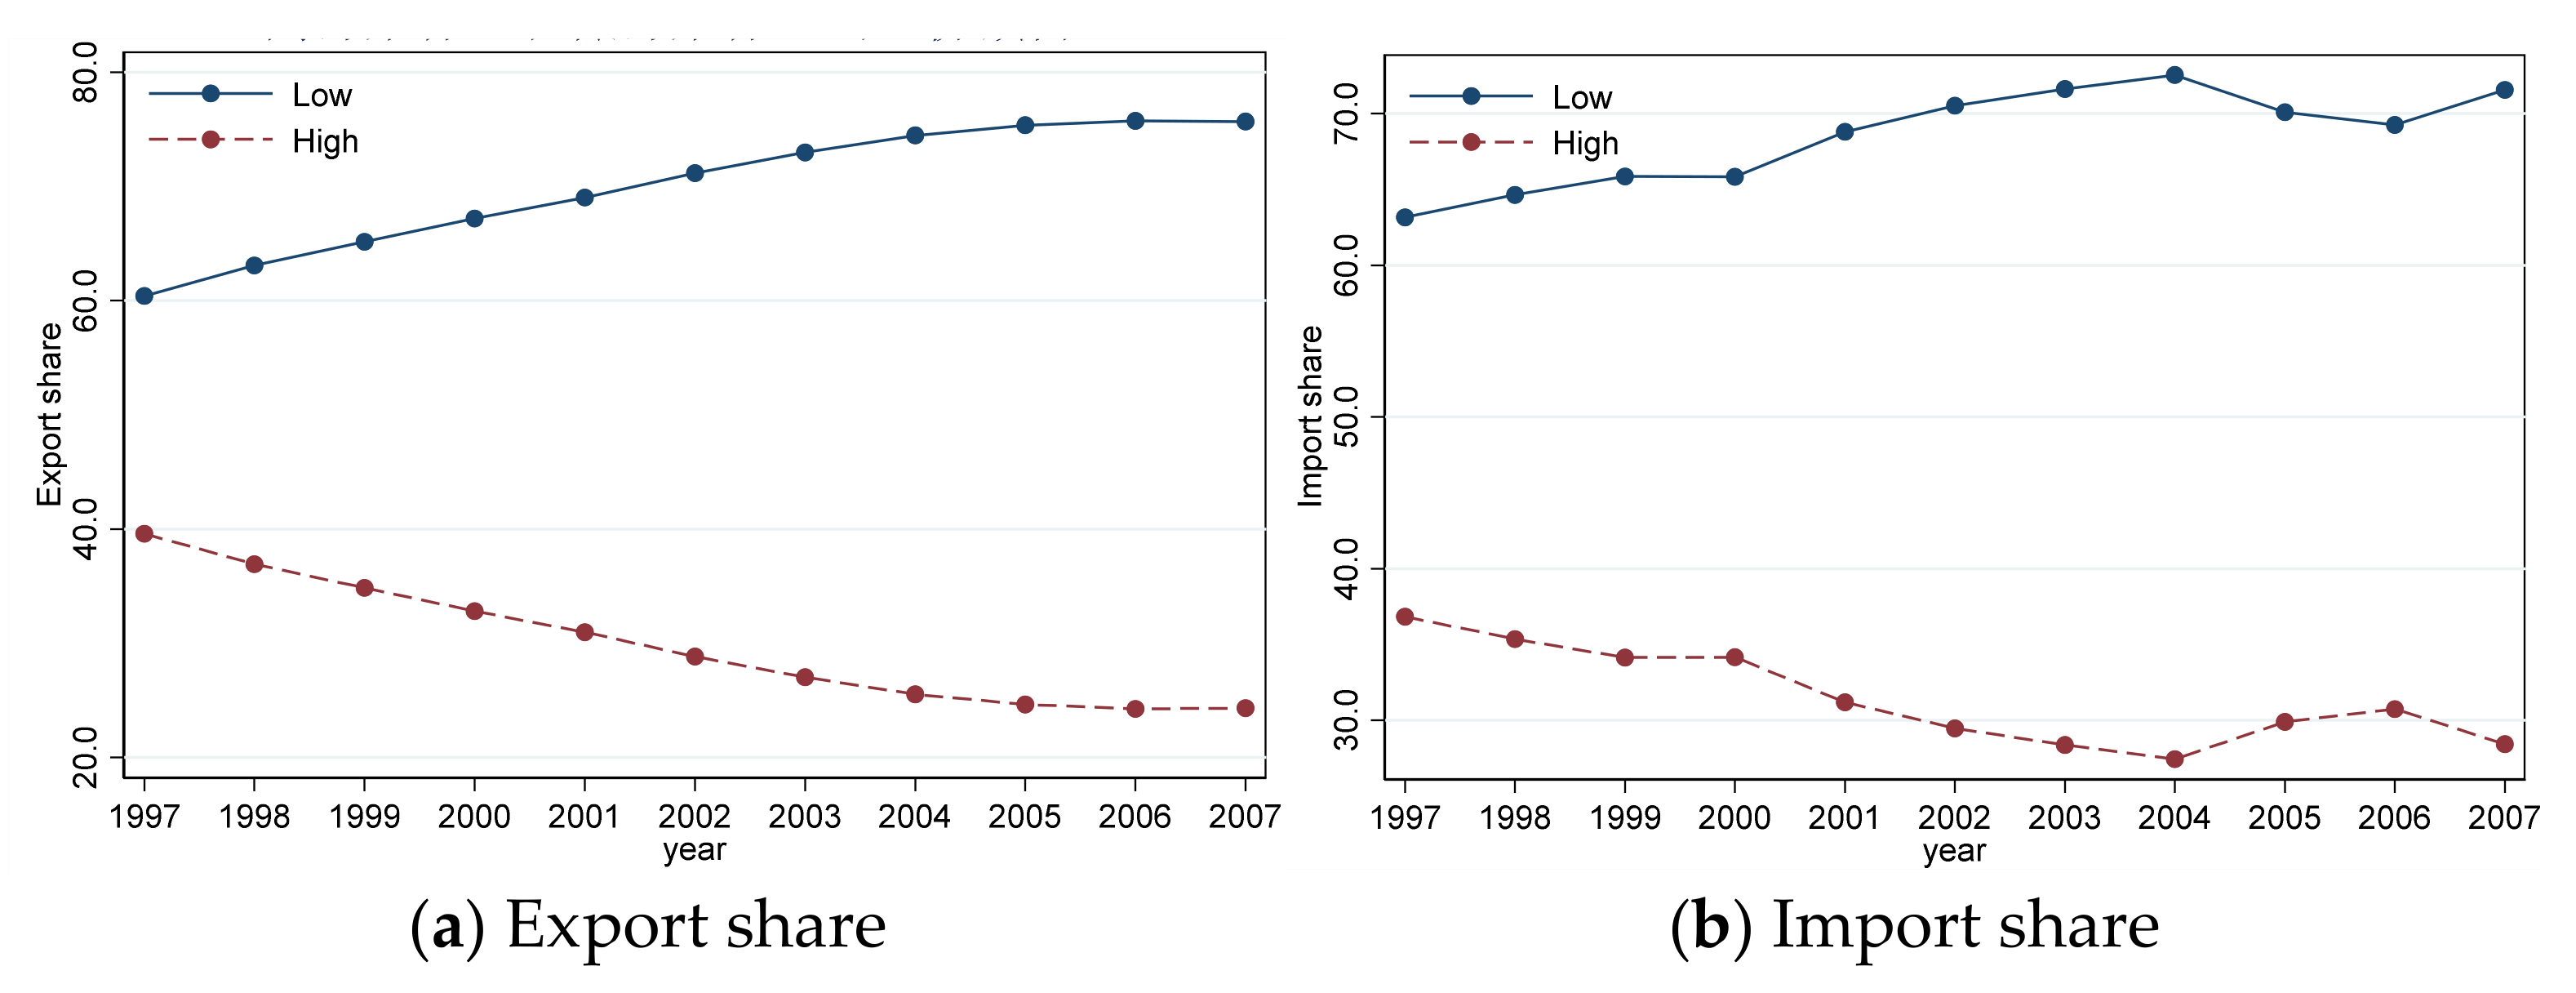
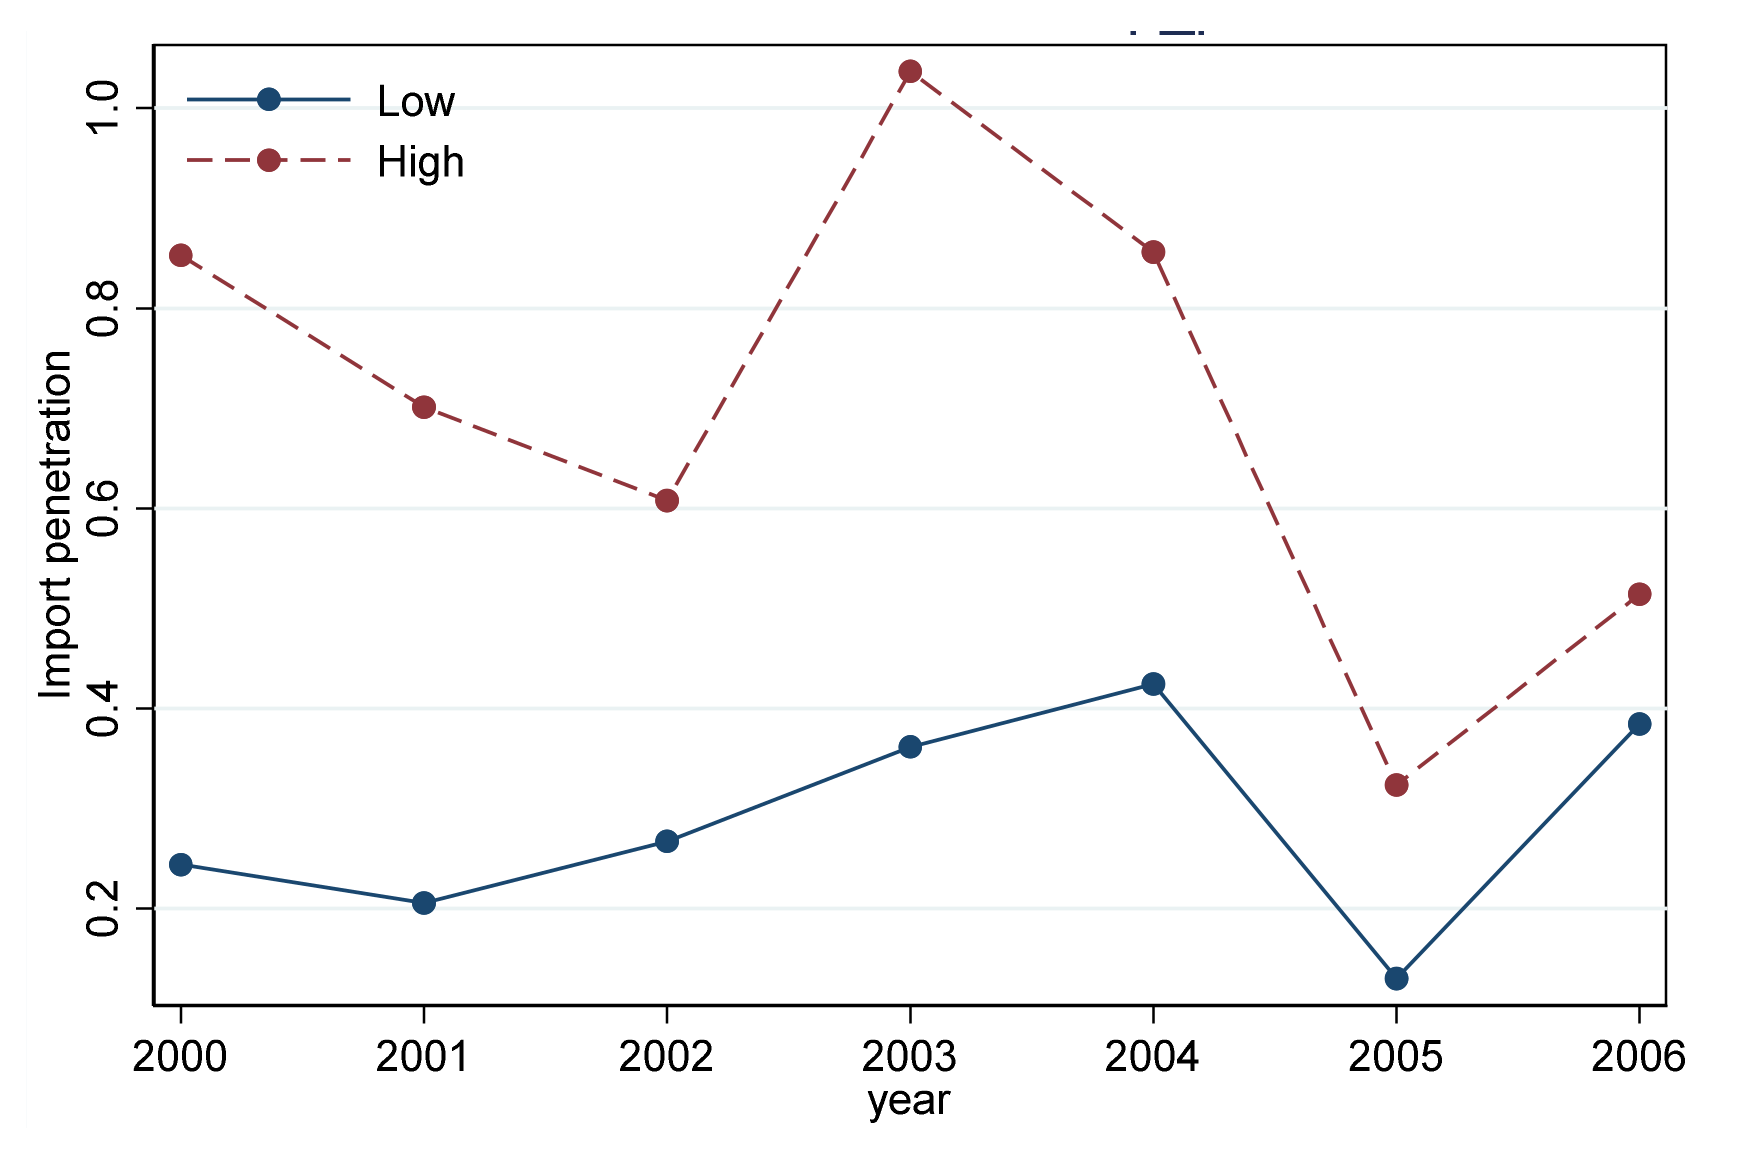
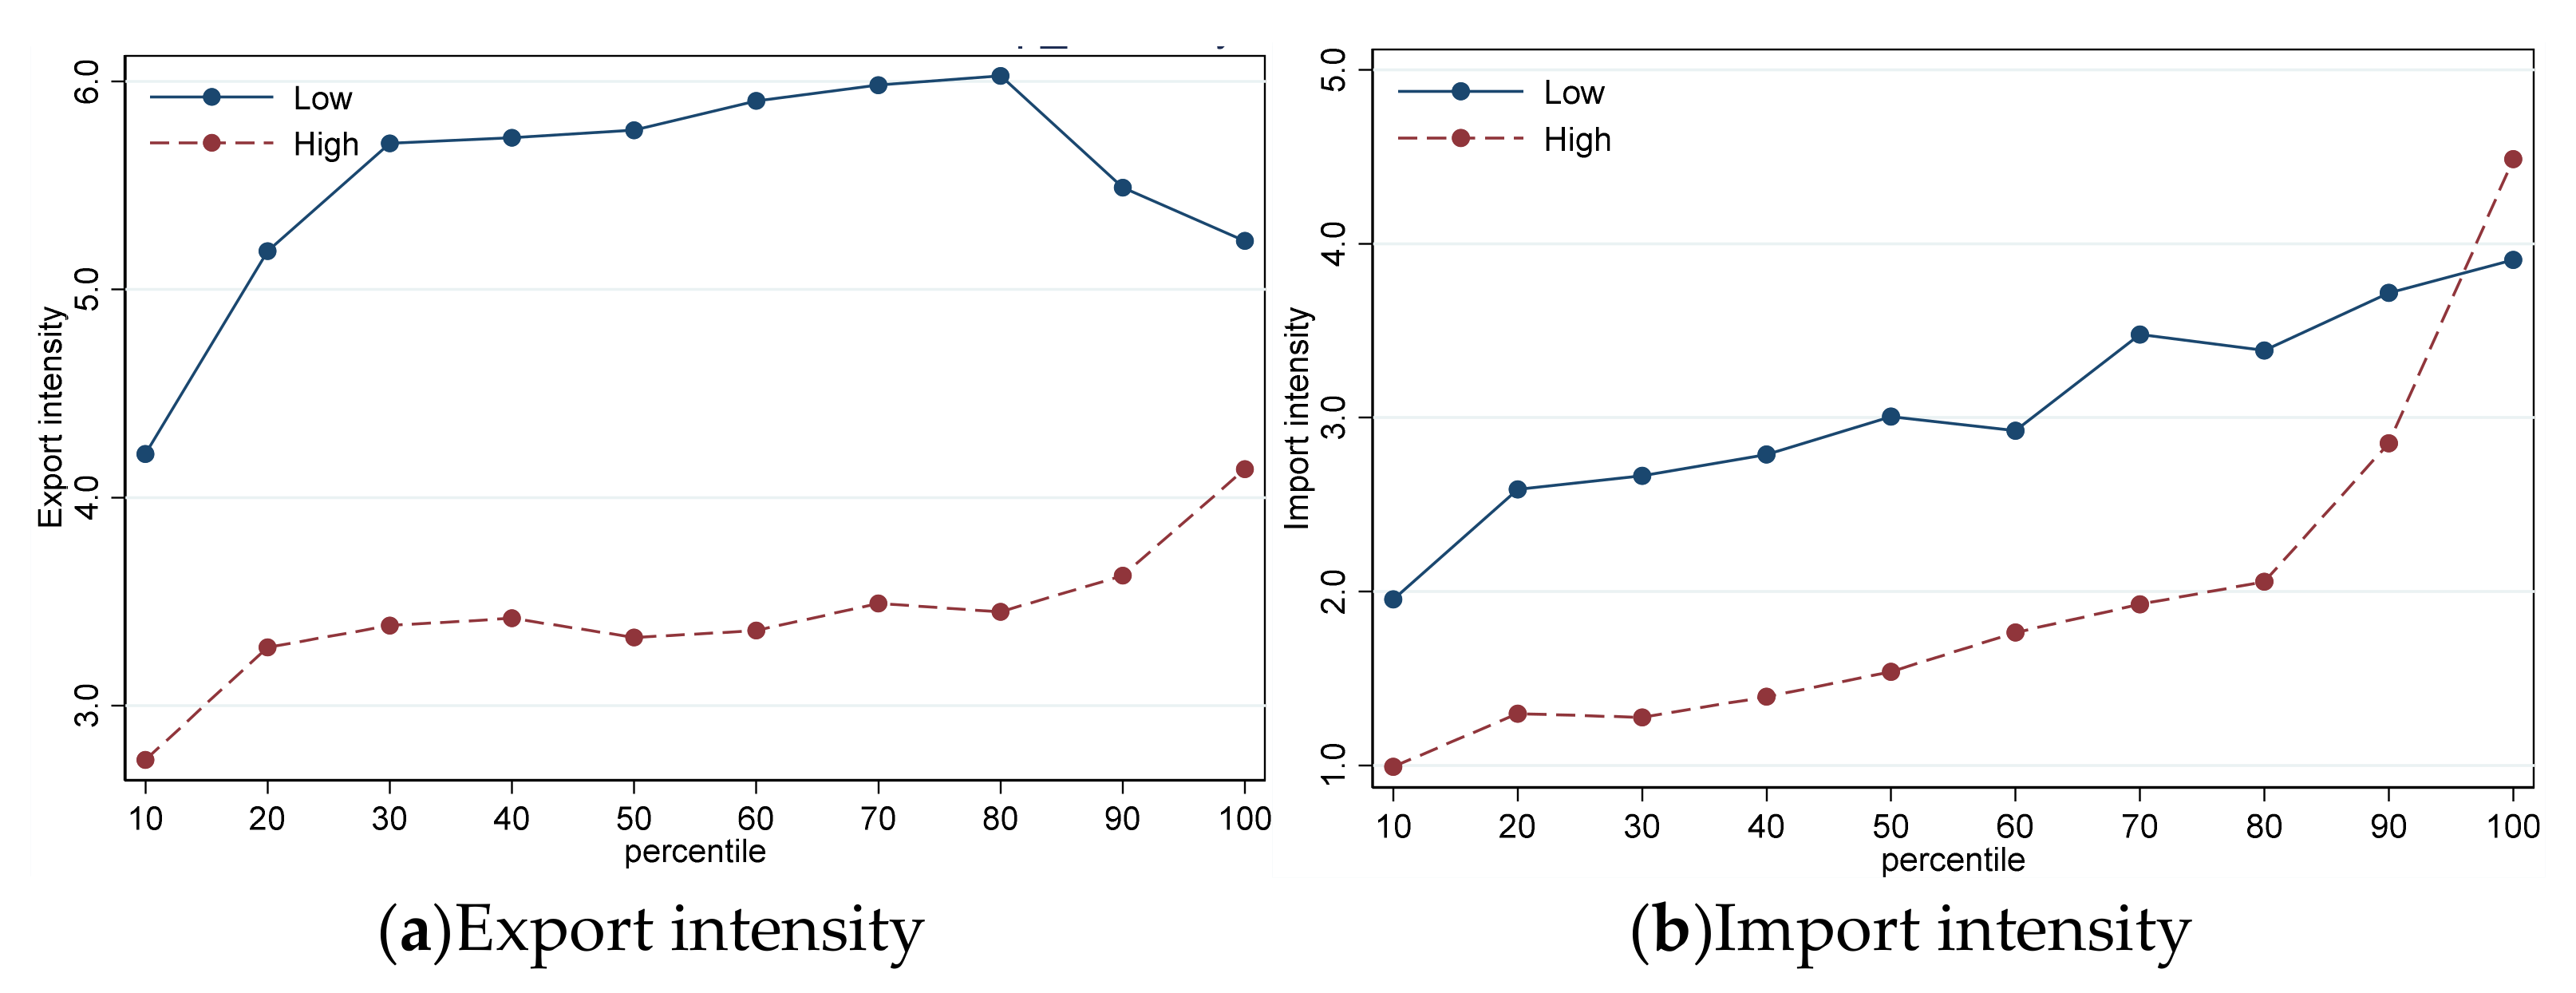
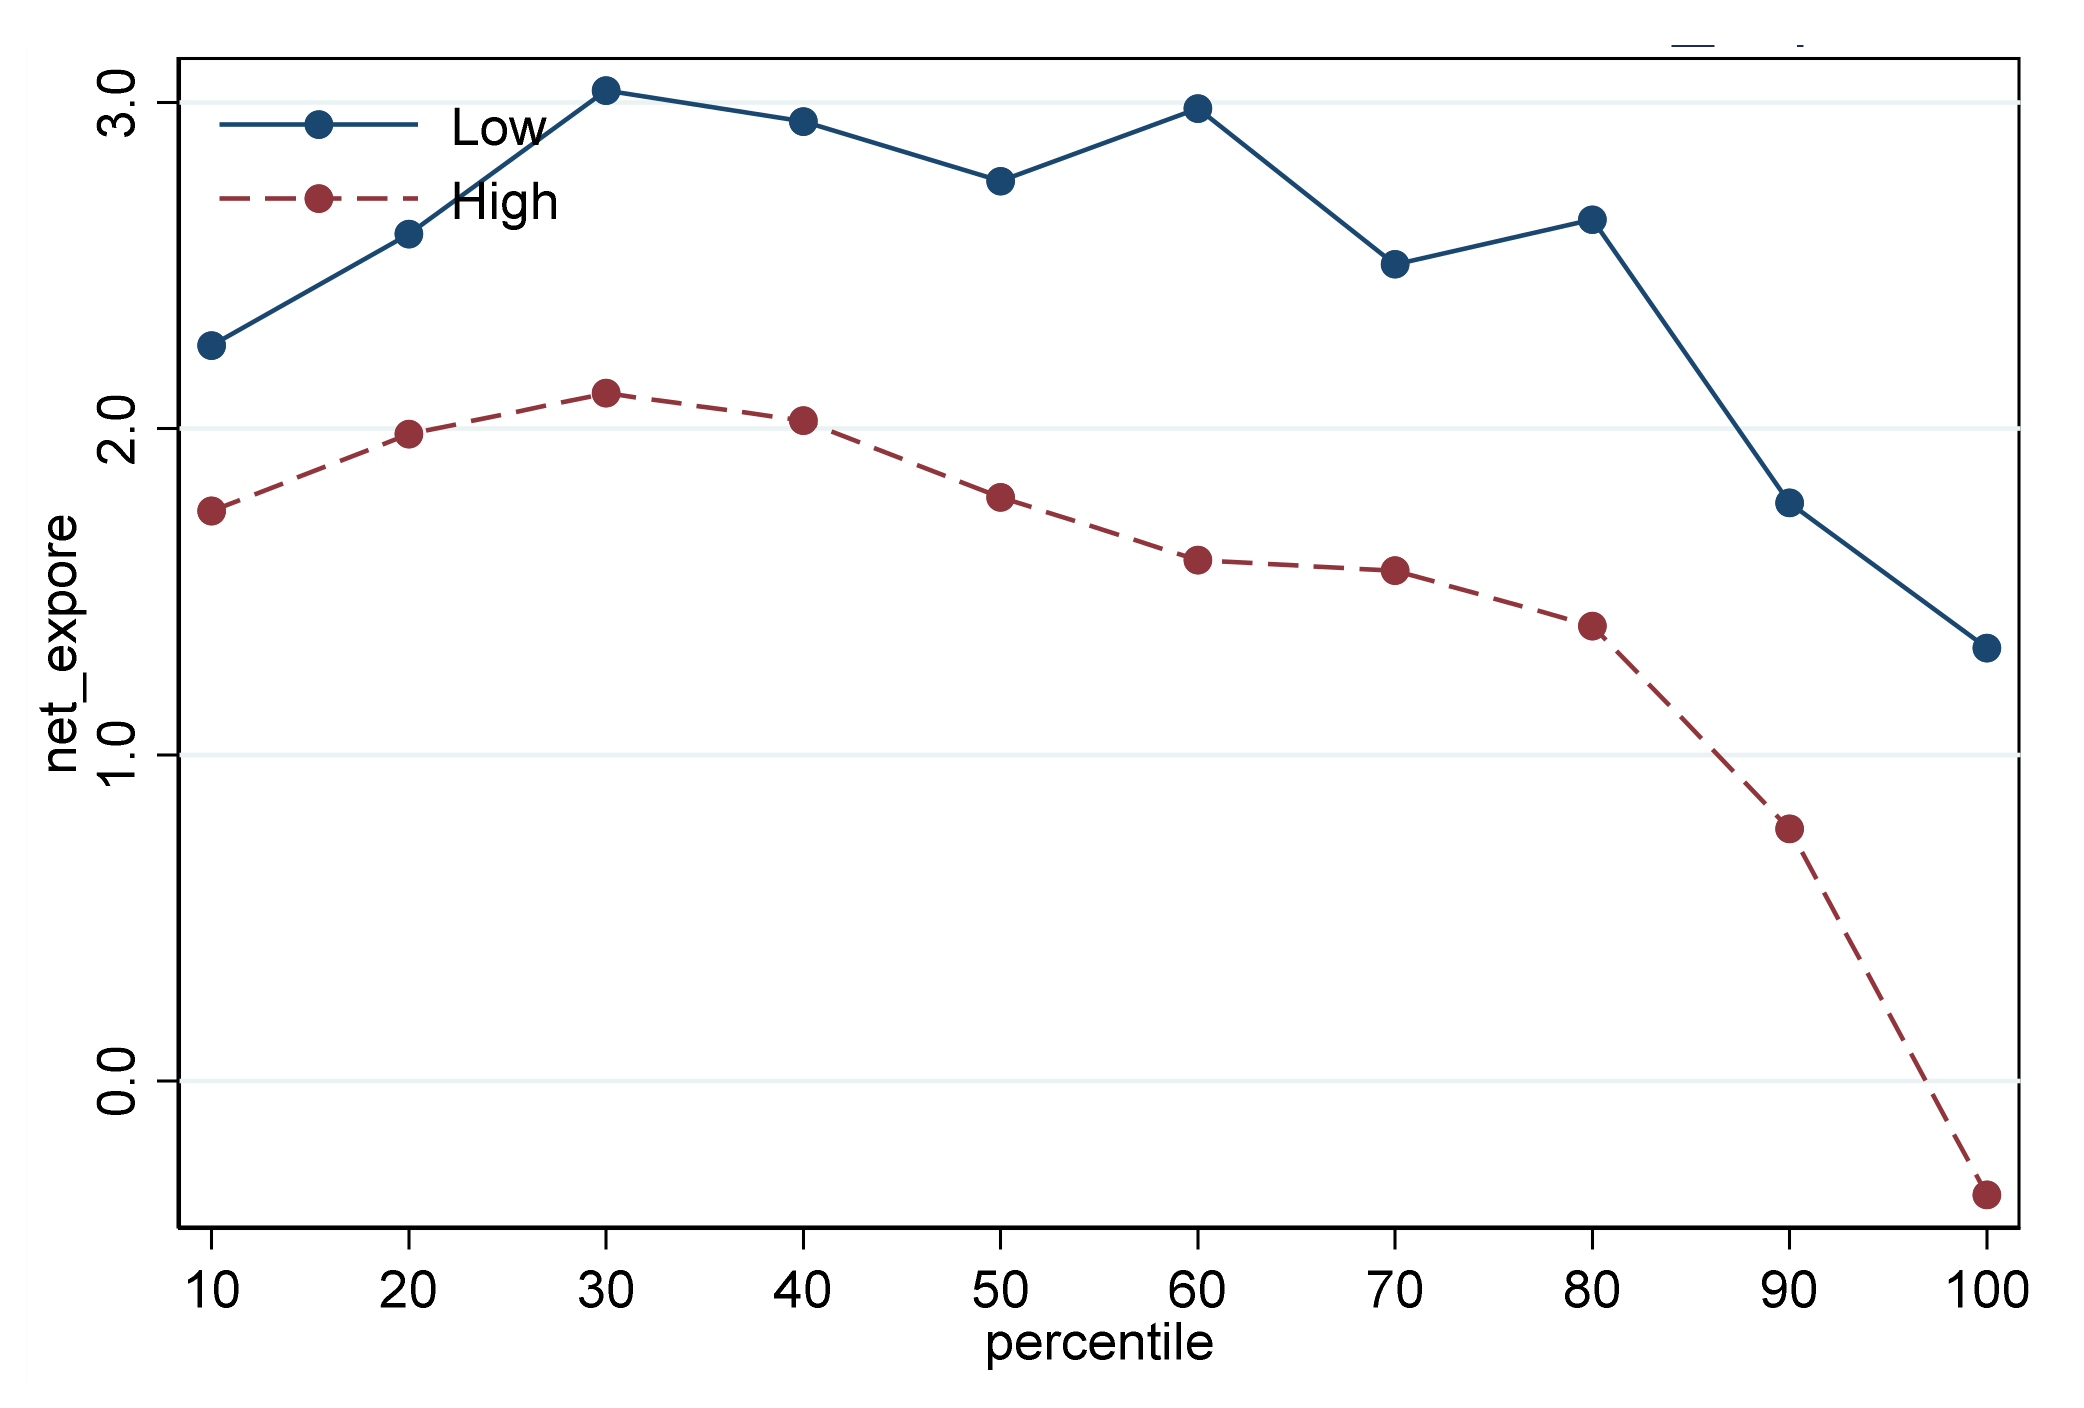
The paper does empirical research, based on the data of manufacturing companies in the industrial company database of the National Bureau of Statistics of China from 1998 to 2007, studies the impact of exchange-rate appreciation on productivity dispersion in industries with different pollution levels, and finds that there is a heterogeneous impact of exchange-rate appreciation on the efficiency of resource allocation within industries with different pollution levels. The regression results show that the higher the environmental pollution level in the industry, the smaller the increase in productivity dispersion as the exchange-rate appreciates. Exchange-rate appreciation makes productivity dispersion increase and resource allocation efficiency decrease in low-pollution industries and productivity dispersion decrease, and resource allocation efficiency increase in high-pollution industries. By analyzing the trade structure of high and low-pollution industries, it is possible to conclude that the export share, import share, export intensity, and import intensity of high-pollution industries are lower than those of low-pollution industries. Therefore, they are less affected by the appreciation of the exchange rate. In addition, the high-pollution industry’s import penetration is higher than the low-pollution industry, which means that the high-pollution industry market could become more competitive. The exchange-rate appreciation makes the final product import prices fall, the high-pollution product market more competitive. Therefore, companies are encouraged and driven to improve the company’s production efficiency through innovation and optimized production methods. In addition, the high-pollution industry has higher foreign direct investment and can better cope with the exchange-rate shock.
In contrast, low-pollution industries respond better to exchange-rate appreciation due to their larger trade share and import/export intensity. Generally, low-pollution industries are high-tech natures, and companies are subject to more significant production constraints. In the case of exchange-rate appreciation, the price of imported intermediate inputs falls; as higher-productivity companies have a more vital ability to import intermediate goods than lower productivity companies, their increase in production efficiency is more significant than that of lower productivity companies. Therefore, the main channel of influence for the exchange-rate appreciation of high-pollution industries is the competition effect in the final product import market, while the main channel for low-pollution companies is the intermediate product import price effect.
Based on the above research results, this paper makes the following recommendations relating to policies: both policymakers and company managers are recommended to pay attention to the impact of exchange-rate appreciation on company productivity and attach importance to the impact of exchange-rate appreciation on industry resource allocation efficiency; for industries with different pollution levels, exchange-rate policy shall fully consider the impact of industry heterogeneity; it is recommended to take opening-up measures further, allow more companies to obtain foreign advanced technology, and reduce the loss of resource allocation efficiency brought by the exchange-rate appreciation to low-pollution industries.

Author Contributions

Conceptualization, C.J.; methodology, F.W.; formal analysis, F.W.; data collection, F.W.; writing, F.W. All authors have read and agreed to the published version of the manuscript.

Funding

This research was funded by the Chinese National Funding of Social Sciences, Grant Number 15ZDC020. The APC was funded by the Chinese National Funding of Social Sciences.

Institutional Review Board Statement

Not applicable.

Informed Consent Statement

Not applicable.

Data Availability Statement

Not applicable.

Conflicts of Interest

The authors declare no conflict of interest.

References

  1. Shapiro, J.S.; Walker, R. Why Is Pollution from US Manufacturing Declining? The Roles of Environmental Regulation, Productivity, and Trade. Am. Econ. Rev. 2018, 108, 3814–3854. [Google Scholar] [CrossRef] [Green Version]
  2. Yang, L. Environmental Issues in an Open Economy: A Survey. Econ. Res. J. 2012, 2, 146–158. [Google Scholar]
  3. Tomlin, B.; Fung, L. Exchange Rate Movements and the Distribution of Productivity. Rev. Int. Econ. 2015, 23, 782–809. [Google Scholar] [CrossRef]
  4. Halpern, L.X.; Szl, X.; Koren, M.X.; Szeidl, A. Imported Inputs and Productivity. Am. Econ. Rev. 2015, 105, 3660–3703. [Google Scholar] [CrossRef] [Green Version]
  5. Balasubramanian, N.; Sivadasan, J. Capital Resalability, Productivity Dispersion, and Market Strucure. Rev. Econ. Stat. 2009, 91, 547–557. [Google Scholar] [CrossRef]
  6. Hsieh, C.; Klenow, P.J. Misallocation and Manufacturing TFP in China and India. Q. J. Econ. 2009, 124, 1403–1448. [Google Scholar] [CrossRef] [Green Version]
  7. Bils, M.; Klenow, P.J.; Ruane, C. Misallocation or Mismeasurement? J. Monet. Econ. 2021, 124, S39–S56. [Google Scholar] [CrossRef]
  8. Foster, L. Measuring Business Innovation Using a Multi-Dimensional Approach. NBER Chapters 2020, 1, 123–165. [Google Scholar]
  9. Bento, P.; Restuccia, D. Misallocation, Establishment Size, and Productivity. Am. Econ. Journal. Macroecon. 2017, 9, 267–303. [Google Scholar] [CrossRef] [Green Version]
  10. Hopenhayn, H.A. Firms, Misallocation, and Aggregate Productivity: A Review. Annu. Rev. Econ. 2014, 6, 735–770. [Google Scholar] [CrossRef]
  11. Syverson, C. Market Structure and Productivity: A Concrete Example. J. Polit. Econ. 2004, 112, 1181–1222. [Google Scholar] [CrossRef] [Green Version]
  12. Syverson, C. Product Substitutability and Productivity Dispersion. Rev. Econ. Stat. 2004, 86, 534–550. [Google Scholar] [CrossRef] [Green Version]
  13. Robison, H.D. Industrial Pollution Abatement: The Impact on Balance of Trade. Can. J. Econ. Rev. Can. D’economique 1988, 21, 187–199. [Google Scholar] [CrossRef]
  14. Lucas, R.E.B.; Wheeler, D.; Hettige, H. Economic development, environmental regulation, and the international migration of toxic industrial pollution: 1960-88. Policy Res. Work. Pap. Ser. 1992, 2007, 13–18. [Google Scholar]
  15. Mani, M.; Wheeler, D. In Search of Pollution Havens? Dirty Industry in the World Economy, 1960 to 1995. J. Environ. Dev. 1998, 7, 215–247. [Google Scholar] [CrossRef]
  16. Quiroga, M. Have Countries with Lax Environmental Regulations a Comparative Advantage in Polluting Industries? Work. Pap. 2009, 1, 1–38. [Google Scholar]
  17. Dengke, C. Trade Barrier R eduction and Environmental Pollution Improvement: New Evidence from Firm-level Pollution Data in China. Econ. Res. J. 2020, 55, 98–114. [Google Scholar]
  18. Xiaoping, L.; Xianxian, L. International Trade, Pollution Industry Transfer and Chinese Industries’ CO2 Emissions. Econ. Res. J. 2009, 45, 15–26. [Google Scholar]
  19. Pingfang, Z.; Zhengyu, Z.; Guolin, J. Empirical Study of the Relationship between FDI and Environmental Regulation: An Intergovernmental Competition Perspective. Econ. Res. J. 2011, 46, 133–145. [Google Scholar]
  20. Porter, M.E.; van der Linde, C. Toward a New Conception of the Environment-Competitiveness Relationship. J. Econ. Perspect. 1995, 9, 97–118. [Google Scholar] [CrossRef] [Green Version]
  21. Ambec, S.; Barla, P. A theoretical foundation of the Porter hypothesis. Econ. Lett. 2002, 75, 355–360. [Google Scholar] [CrossRef]
  22. Ekholm, K.; Moxnes, A.; Ulltveit-Moe, K.H. Manufacturing restructuring and the role of real exchange rate shocks. J. Int. Econ. 2012, 86, 101–117. [Google Scholar] [CrossRef]
  23. Dai, M.; Xu, J. Firm-specific exchange rate shocks and employment adjustment: Evidence from China. J. Int. Econ. 2017, 108, 54–66. [Google Scholar] [CrossRef]
  24. Berman, N.; Martin, P.; Mayer, T. How do Different Exporters React to Exchange Rate Changes? Q. J. Econ. 2012, 127, 437–492. [Google Scholar] [CrossRef]
  25. Li, H.; Ma, H.; Xu, Y. How do exchange rate movements affect Chinese exports?—A firm-level investigation. J. Int. Econ. 2015, 97, 148–161. [Google Scholar] [CrossRef]
  26. Bernard, A.B.; Eaton, J.; Jensen, J.B.; Kortum, S. Plants and Productivity in International Trade. Am. Econ. Rev. 2003, 93, 1268–1290. [Google Scholar] [CrossRef] [Green Version]
  27. Amiti, M.; Konings, J. Trade Liberalization, Intermediate Inputs, and Productivity: Evidence from Indonesia. Am. Econ. Rev. 2007, 97, 1611–1638. [Google Scholar] [CrossRef]
  28. Muendler, M.A. Trade, Technology, and Productivity: A Study of Brazilian Manufacturers, 1986-1998. CESifo Group Munich 2004, 1, 1–53. [Google Scholar] [CrossRef]
  29. Topalova, P.; Khandelwal, A. Trade Liberalization and Firm Productivity: The case of India. Rev. Econ. Stat. 2011, 93, 995–1009. [Google Scholar] [CrossRef]
  30. Brandt, L.; Van Biesebroeck, J.; Wang, L.; Zhang, Y. WTO Accession and Performance of Chinese Manufacturing Firms. Am. Econ. Rev. 2017, 107, 2784–2820. [Google Scholar] [CrossRef] [Green Version]
  31. Arkolakis, C.; Costinot, A.; Donaldson, D.; Rodríguez-Clare, A. The Elusive Pro-Competitive Effects of Trade. Rev. Econ. Stud. 2019, 86, 46–80. [Google Scholar]
  32. Melitz, M.J. The Impact of Trade on Intra-Industry Reallocations and Aggregate Industry Productivity. Econometrica 2003, 71, 1695–1725. [Google Scholar] [CrossRef] [Green Version]
  33. Pavcnik, N. Trade Liberalization, Exit, and Productivity Improvements: Evidence from Chilean Plants. Rev. Econ. Stud. 2002, 69, 245–276. [Google Scholar] [CrossRef] [Green Version]
  34. Jingwen, Y. Exchange Rate Shock and Productivity at Firm Level: Exchange Rate Shock and Productivity at Firm Level: Analysis from the Perspective of Market Competition Mechanism. Stat. Res. 2018, 35, 75–84. [Google Scholar]
  35. Foster, L.; Grim, C.; Haltiwanger, J.C.; Wolf, Z. Innovation, Productivity Dispersion, and Productivity Growth. Natl. Bur. Econ. Res. 2019, 1, 1–42. [Google Scholar]
  36. Brandt, L.; Biesebroeck, J.V.; Zhang, Y. Creative Accounting or Creative Destruction? Firm-level Productivity Growth in Chinese Manufacturing. J. Dev. Econ. 2012, 97, 339–351. [Google Scholar] [CrossRef] [Green Version]
  37. Olley, G.S.; Pakes, A. The Dynamics of Productivity in the Telecommunications Equipment Industry. Econometrica 1996, 64, 1263. [Google Scholar] [CrossRef]
  38. Xi, Y.; Tang, H.; Wei, X. The Impact of Economic Policy Uncertainty Fluctuation on China’s Export Sophistication:An Empirical Study Based on CEPII-BACI Database. Macroeconomics 2019, 49, 1658–1684. [Google Scholar]
  39. Disdier, A.X.; Lia, J.; Fontagn, X.; Lionel, L.; Cadot, O. North-South Standards Harmonization and International Trade. World Bank Econ. Rev. 2015, 29, 327–352. [Google Scholar] [CrossRef]
  40. Wei, S.; Xie, Z.; Zhang, X. Progress and Challenges; Song, L., Garnaut, R., Fang, C., Johnston, L., Eds.; ANU Press: Acton, Australia, 2017; Volume 2, pp. 173–212. [Google Scholar]
  41. Porteous, O. An Estimated Dynamic Model of African Agricultural Storage and Trade. Am. Econ. J. Appl. Econ. 2019, 11, 327–366. [Google Scholar] [CrossRef] [Green Version]
  42. Lei-lei, L.; Dan, S. Local Environmental Legislation and Optimization of Industrial Resources. Allocation Efficiency in China’s Manufacturing Industry. China Ind. Econ. 2018, 7, 136–154. [Google Scholar]
  43. Alfaro, L.; Cuñat, A.; Fadinger, H.; Liu, Y. The Real Exchange Rate, Innovation and Productivity: Heterogeneity, Asymmetries and Hysteresis; National Bureau of Economic Research Working: Cambridge, MA, USA, 2018; pp. 1–72. [Google Scholar]
  44. Corsetti, G.; Dedola, L.; Leduc, S. The international dimension of productivity and demand shocks in the U.S. economy. J. Eur. Econ. Assoc. 2009, 12, 153–176. [Google Scholar] [CrossRef]
Figure 1. Annual average of industry productivity dispersion and real effective exchange rate of RMB.
Sustainability 14 03121 g001
Figure 2. Productivity dispersion in low and high-pollution industries.
Sustainability 14 03121 g002
Figure 3. Export share and import share of low and high-pollution industries in different years.
Sustainability 14 03121 g003
Figure 4. The export intensity and import intensity of low and high-pollution industries in different years.
Sustainability 14 03121 g004
Figure 5. The net exposure of low and high-pollution industries in different years.
Sustainability 14 03121 g005
Figure 6. Export intensity and import intensity in high and low polluting industries at different productivity levels.
Sustainability 14 03121 g006
Figure 7. Net trade exposure of high and low polluting industries at different productivity levels.
Sustainability 14 03121 g007
Figure 8. Import penetration in high and low-pollution industries at different productivity levels.
Sustainability 14 03121 g008
Table 1. Impact of real effective exchange-rate appreciation on industrial productivity dispersion.
Variables(1)(2)(3)(4)(5)
rer0.835 ***0.829 ***0.161 ***0.143 ***0.14 ***
lngdp 0.069 ***0.131 ***0.139 ***
china_gdp −0.825 ***−0.702 ***−0.564 ***
tariff 0.004 ***0.003 ***
any_fdi −0.0010.002
scale −0.039 ***
state_share 0.132 ***
foreign_share −0.042
Notes: *** Significant at the 1 percent level. ** Significant at the 5percent level. * Significant at the 10 percent level.
Table 2. Impact of appreciation on industrial productivity dispersion with different pollution levels.
Variables(1)(2)(3)
rer0.965 ***0.317 ***0.272 ***
rer *pollute−5.034 ***−6.198 ***−4.953 ***
tfp 3.803 ***0.412 ***
lngdp 0.076 ***0.136 ***
china_gdp −0.829 ***−0.599 ***
lntariff 0.004 ***
tariff_output 0.003 ***
any_fdi 0.004
tariff_input 0.004 **
scale −0.042 ***
state 0.134 ***
foreign −0.039
Notes: *** Significant at the 1 percent level. ** Significant at the 5percent level. * Significant at the 10 percent level.
Table 3. Impact of appreciation on industrial productivity dispersion with different pollution levels used as dummy variables.
Variables(1)(2)(3)
rer1.097 ***0.427 ***0.383 ***
rer *pollute−0.579 ***−0.603 ***−0.525 ***
tfp 3.732 ***2.626 ***
lngdp 0.041 ***0.103 ***
china_gdp −0.808 ***−0.586 ***
lntariff −0.010
tariff_output 0.003 ***
any_fdi 0.001
tariff_input 0.004 **
scale −0.046 ***
state 0.133 ***
foreign −0.034
Notes: *** Significant at the 1 percent level. ** Significant at the 5percent level. * Significant at the 10 percent level.
Table 4. Industrial productivity dispersion calculated with total factor productivity.
Variables(1)(2)(3)
rer0.735 ***0.257 ***0.227 ***
rer *pollutdt−4.951 ***−5.76 ***−4.683 ***
tfp −0.171−1.486 ***
lngdp 0.025 ***0.078 ***
china_gdp −0.102 ***0.164 ***
lntariff 0.003 **
tariff_output 0.002 ***
any_fdi 0.009
tariff_input 0.005 *
scale −0.069 ***
state 0.235 ***
foreign −0.01
Notes: *** Significant at the 1 percent level. ** Significant at the 5percent level. * Significant at the 10 percent level.
Table 5. Industrial productivity dispersion calculated with total factor productivity and pollution levels are dummy variables.
Variables(1)(2)(3)
rer0.828 ***0.348 ***0.325 ***
high_pollute#c.rer−0.492 ***−0.538 ***−0.484 ***
tfp −0.234 ***−1.533 ***
lngdp −0.007 ***0.049 ***
china_gdp −0.0830.176
lntariff 0.001 ***
tariff_output 0.002 ***
fdi 0.007
tariff_input 0.005
scale −0.073 ***
state 0.234 *
foreign −0.006
Notes: *** Significant at the 1 percent level. ** Significant at the 5percent level. * Significant at the 10 percent level.
Table 6. Impact of RMB appreciations on firm exit within industries with different pollution levels.
VariablesHighLow
LPMProbitLogitLPMProbitLogit
rer−0.01−0.1−0.190.21 ***1.3 ***2.21 ***
20.percentile#c.rer0−0.12−0.25−0.05−0.45−0.71
30.percentile#c.rer0.01−0.05−0.09−0.12 ***−0.94 ***−1.58 ***
40.percentile#c.rer−0.01−0.21−0.36−0.1 **−0.5 *−0.64
50.percentile#c.rer−0.02−0.27−0.46−0.19 ***−1.02 ***−1.65 ***
60.percentile#c.rer−0.08 **−0.62 ***−1.13 **−0.15 ***−0.95 ***−1.57 ***
70.percentile#c.rer−0.07 *−0.46 **−0.82 *−0.14 ***−0.78 ***−1.2 **
80.percentile#c.rer−0.02−0.14−0.19−0.16 ***−0.82 ***−1.31 **
90.percentile#c.rer−0.12 ***−0.63 ***−1.09 **−0.18 ***−1.01 ***−1.62 ***
100.percentile#c.rer−0.13 ***−0.73 ***−1.27 ***−0.16 ***−0.73 ***−1.13 **
Notes: *** Significant at the 1 percent level. ** Significant at the 5percent level. * Significant at the 10 percent level.
Table 7. Impact of RMB appreciations on firm entry within industries with different pollution levels.
VariablesHighLow
LPMProbitLogitLPMProbitLogit
rer−0.43 ***−1.27 ***−2.06 ***−0.64 ***−2.01 ***−3.33 ***
20.percentile#c.rer0.26 ***0.7 ***1.14 ***−0.02−0.12−0.27
30.percentile#c.rer0.36 ***1.01 ***1.62 ***0.14 ***0.4 ***0.63 **
40.percentile#c.rer0.41 ***1.15 ***1.89 ***0.15 ***0.46 ***0.71 ***
50.percentile#c.rer0.47 ***1.36 ***2.21 ***0.28 ***0.9 ***1.41 ***
60.percentile#c.rer0.54 ***1.58 ***2.59 ***0.41 ***1.3 ***2.09 ***
70.percentile#c.rer0.59 ***1.8 ***2.93 ***0.37 ***1.18 ***1.85 ***
80.percentile#c.rer0.69 ***2.14 ***3.5 ***0.4 ***1.26 ***1.98 ***
90.percentile#c.rer0.66 ***2.03 ***3.32 ***0.52 ***1.66 ***2.68 ***
100.percentile#c.rer0.68 ***2.11 ***3.48 ***0.54 ***1.74 ***2.78 ***
Notes: *** Significant at the 1 percent level. ** Significant at the 5percent level. * Significant at the 10 percent level.
Publisher’s Note: MDPI stays neutral with regard to jurisdictional claims in published maps and institutional affiliations.

