Article

Applicability of Grassland Production Estimation Using Remote Sensing for the Mongolian Plateau by Comparing Typical Regions in China and Mongolia

1
School of Marine Technology and Geomatics, Jiangsu Ocean University, Lianyungang 222005, China
2
State Key Laboratory of Resources and Environmental Information System, Institute of Geographic Sciences and Natural Resources Research, Chinese Academy of Sciences, Beijing 100101, China
3
Jiangsu Center for Collaborative Innovation in Geographical Information Resource Development and Application, Nanjing 210023, China
4
School of Engineering and Applied Sciences, National University of Mongolia, Ulaanbaatar 14201, Mongolia
5
School of Art & Science, National University of Mongolia, Ulaanbaatar 14201, Mongolia
*
Authors to whom correspondence should be addressed.
Sustainability 2022, 14(5), 3122; https://doi.org/10.3390/su14053122
Submission received: 26 January 2022 / Revised: 3 March 2022 / Accepted: 4 March 2022 / Published: 7 March 2022

Abstract

:
Grasslands on the Mongolian Plateau are critical for supporting local sustainable development. Sufficient measured sample information is the basis of remote sensing modeling and estimation of grassland production. Limited by field inventory costs, it is difficult to collect sufficient and widely distributed samples in the Mongolian Plateau, especially in transboundary areas, which affects the results of grassland production estimation. Here, considering that the measured sample points are sparse, this study took Xilingol League of Inner Mongolia Autonomous Region in China and Dornogovi Province in Mongolia as the study areas, introduced multiple interpolation methods for interpolation experiments, established a statistical regression model based on the above measured and interpolated samples combined with the normalized differential vegetation index, and discussed the applicability of grassland production estimation. The comparison results revealed that the point estimation biased sample hospital-based area disease estimation method and radial basis function showed the best interpolation results for grassland production in Xilingol League and Dornogovi Province, respectively. The power function model was suitable for grassland production estimation in both regions. By inversion, we obtained annual grassland production for 2010–2021 and the uneven spatial distribution of grassland production in both regions. In these two regions, the spatial change in grassland production showed a decreasing trend from northeast to southwest, and the interannual change generally showed a dynamic upward trend. The growth rate of grassland output was faster in Xilingol League than in Dornogovi Province with similar physical geography and climate conditions, indicating that the animal husbandry regulation policies play important roles beyond the influence of climate change. The study recommended grassland estimation methods for an area with sparse samples and the results can be used to support decision making for sustainable animal husbandry and grassland succession management.

1. Introduction

Grassland resources are the most widely available natural resources in the Mongolian Plateau and are major supporting pillars for animal husbandry [1,2]. Grassland production, which is an important indicator of changes in grasslands [3,4,5], is the foundation for assessing the ability of grasslands to bear environmental stress and maintain the balance between grass and livestock [6,7]. The Mongolian Plateau is rich in grassland resources and is an important part of the Belt and Road Initiative and the China–Mongolia–Russia Economic Corridor [8]. Estimating grassland production in the Mongolian Plateau facilitates raising awareness of resource and environmental issues in the Mongolian Plateau and the monitoring and management of the dynamic evolution of local grassland resources and land degradation, thereby providing scientific data and support for implementing decisions on sustainable animal husbandry and grassland succession management.
Currently, the sample point data of grassland production mainly uses ground measurements in the field, which are often sparse. Interpolation methods allow a wider spatial distribution of the sample points to be obtained [9]. Commonly used spatial interpolation methods include the ordinary kriging (OK), spline function, inverse distance weighting (IDW), and multiple linear regression methods [10,11,12]. Li [13] used OK to interpolate the normalized difference vegetation index (NDVI) and obtained the vegetation coverage of study areas by inversion. Qiao [14] used multiple data sources and performed geostatistical spatial interpolation using a quadratic spline function on vegetation in Yili grasslands in northern China to obtain aboveground biomass data. Compared with grassland resource surveys, spatial interpolation methods have been widely studied in the regional ecosystem, environment, and public health domains. Wang [15] developed a new technology, biased sample hospital-based area disease estimation (B-SHADE), that used records from sentinel hospitals to estimate regional disease incidence and prevalence; further, it corrected data errors recorded by individual hospitals and generated the best linear unbiased estimation. Wang [16] developed single point areal (SPA) estimation, which used PM2.5 data obtained from a single observation site and PM10 data obtained from 18 different observation sites, and generated the best linear unbiased estimation based on the correlation between PM2.5 and PM10 from different sites; moreover, by inversion, daily average PM2.5 mass concentrations for Beijing were obtained. Karimiana [17] developed a regional scale geographically weighted regression model (GWR) to derive daily seamless surface concentration of PM2.5. Wang [18] applied the point estimation model of BSHADE (P-BSHADE) to interpolate grassland production in a buffer area along a 200 km railway, the Mongolia portion of the China–Mongolia Railway, using several years of NDVI data and some field-measured sample points.
At present, there are few interpolation studies on grass yield and few solutions to the problem of sparse sample points in the vast Mongolian Plateau, including Mongolia and the Inner Mongolia Autonomous Region, China. Considering this, we aim to interpolate grassland production in two regions of the Mongolian Plateau in Mongolia and Inner Mongolia, China, using multiple interpolation methods, use statistical models to combine all points with NDVI to build an optimal estimation model, and perform estimation and inversion to obtain grassland production for the two regions for 2010–2021. Through comparison, we can determine the applicability of grassland production estimation models for the Mongolian Plateau.

2. Materials and Method

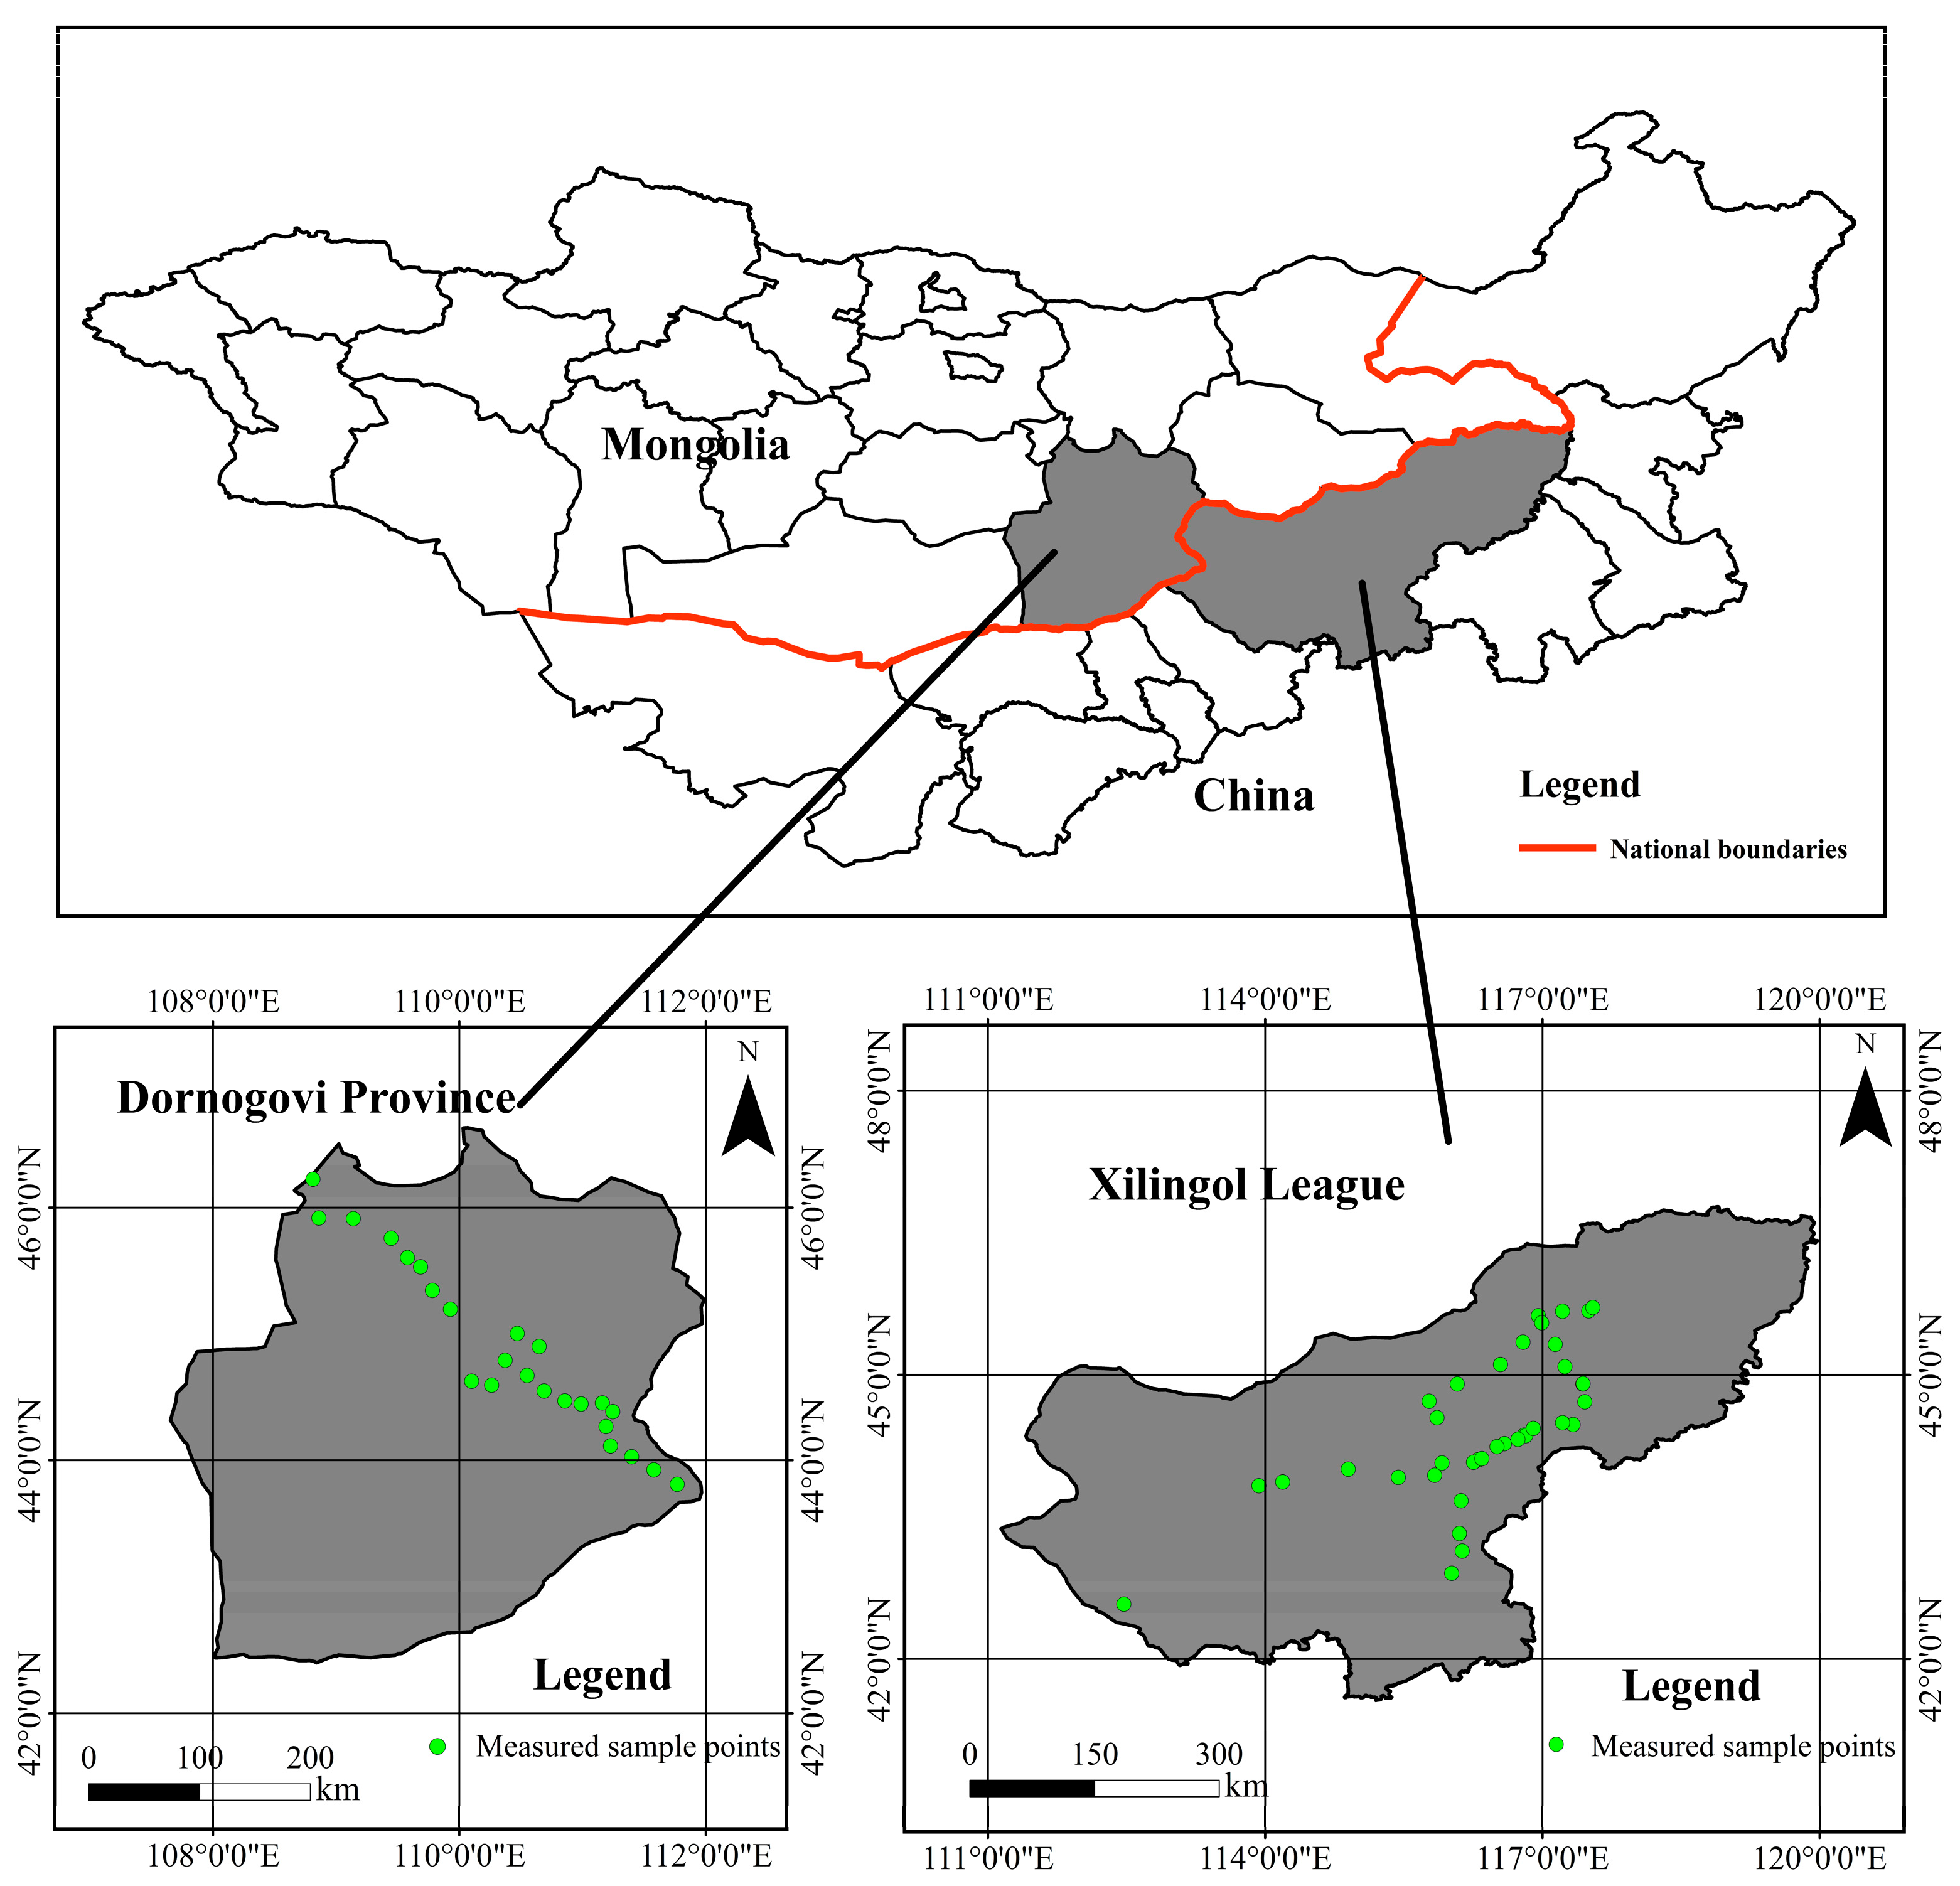
2.1. Study Area Overview

Xilingol League of Inner Mongolia Autonomous Region in China and Dornogovi Province of Mongolia were the selected study areas. The former region is in the central part of the Inner Mongolia Autonomous Region (111°21′–119°78′ E, 41°65′–46°66′ N). It borders Mongolia to the north, Zhangjiakou and Chengde cities of Hebei Province to the south, Ulan Chabu city to the west, and Xing’an League, Chifeng City, and Tongliao City to the east. Grasslands are widely distributed in this region, occupying 95% of the total area. Animal husbandry is the main industry and source of livelihood in this region. The annual temperature range varies considerably, with an annual average temperature of 1–4 °C and an annual precipitation of approximately 150–400 mm, which mainly falls between June and September. From northeast to southwest, the grassland type ranges from meadow grassland to typical grassland and then to desert grassland.
Dornogovi Province, one of the 21 provinces of Mongolia, is in the southern part of Mongolia and covers 100,000 km2. It borders the Inner Mongolia Autonomous Region of China to the south, Kent Province and Central Province to the north, Sukhbaatar Province to the east, and South Gobi Province and Xilingol League of Inner Mongolia Autonomous Region to the west. The region experiences a typical temperate continental climate with large seasonal variations with short and hot summers and long and cold winters and an average annual temperature of approximately 5 °C. The average annual precipitation is approximately 130 mm, which mainly falls from July to August. Similar to Xilingol League, animal husbandry is the main source of livelihood for this region. Grassland accounts for over 93% of the total usable area, with desert grasslands representing the main grassland type.

2.2. Data Source

2.2.1. Remote Sensing Data

MOD13Q1 belongs to the land topic of MODIS products, which is called MODIS/Terra Vegetation Indices 16-Day L3 Global 250 m SIN Grid in full. We selected the MOD13Q1 data product from the United States National Aeronautics and Space Administration (https://earthdata.nasa.gov/ (accessed on 5 October 2021)), with a time series of 2010–2021, temporal resolution of 16 d, spatial resolution of 250 m, and the image time corresponding to the collection time of the measured sample points. The original remote sensing image format was EOS-HDF, and the original coordinate is global sinusoidal projection. In total, 24 scene images were selected. These images were subjected to atmospheric correction, radiometric calibration, geometric correction, and cloud removal processing. The data product was converted into .tiff format using MODIS Reprojection Tools and the map projection format was converted into Universal Transverse Mercator. The vector graphics of Xilingol League and Dornogovi Province were superimposed using ArcGIS to perform image cropping and maximum value synthesis of raster images to weaken the interference of clouds, atmosphere, and solar altitude angle. Invalid values in the data were treated with Setnull.

2.2.2. Measured Sample Points for Grassland Production

The sample points for grassland production were measured between August 2020 and August 2021 in Xilingol League and in July 2019 in Dornogovi Province. Typical grassland sites were selected for sample collection. Global positioning system coordinates were used to randomly select three 1 × 1 m quadrats at a given sample point. In each quadrat, the aboveground plants were mowed, and their average net weights were recorded as the fresh weight at that particular sample point. These ground measured sample point data, including sample identification number, geographical coordinates, and average fresh grass weight of each site, were recorded in Microsoft Excel. Subsequently, the data were imported into ArcGIS, projection coordinates and format were converted, and vector-based sample data were generated. Finally, the sample data were validated, outliers were eliminated, and 38 measured sample points in Xilingol League and 24 measured sample points in Dornogovi Province were obtained (Figure 1). Because of the transportation condition and influence of the COVID-19 pandemic in 2020 and 2021, the samples were only collected in the central regions along the main road with 20–40 km intervals.
The auxiliary data included the following: (1) the administrative divisions in Xilingol League (Resource and Environment Science and Data Center, https://www.resdc.cn/ (accessed on 8 April 2021)), (2) the administrative divisions in Dornogovi Province (Resource Discipline Innovation Platform website, http://www.data.ac.cn/ (accessed on 5 October 2021)), (3) average annual temperature, average annual precipitation, and livestock numbers for Xilingol League (the Statistical Yearbook of Xilingol League 2012–2021), and (4) average annual temperature, average annual precipitation, and livestock numbers for Dornogovi Province (Mongolia’s Statistical Information Service website, http://www.1212.mn (accessed on 22 January 2022 [19])).

2.3. Interpolation Method

A requirement for using the P-BSHADE method is that the calculation parameters should meet the long time series. Therefore, we combined the SPA and P-BSHADE methods and selected NDVI, which is strongly correlated to grassland production and has a long time series, as a middle variable to perform P-BSHADE interpolation experiments.

2.3.1. Objective

We aimed to use the measured sample points as samples to interpolate and obtain the interpolated sample points. The theory and deductions of its formula are as follows:
y ^ 0 = i = 1 n w i y i ,
where w i is the weight of the known sample point i to the interpolated point, y i is the grassland production of the known sample point i , and y ^ 0 is the estimated value of the missing sample point y 0 . Equation (1) has two properties that are unbiased:
E ( y 0 ) = E ( y ^ 0 ) ,
and minimum estimation variance:
m i n w [ σ y ^ 0 2 = E ( y ^ 0 y 0 ) 2 ] ,
where E is statistical expectation. Further, using Equation (1), Equation (2) can be written as:
E y 0 = E i = 1 n w i y i ,

2.3.2. Sample Point Ratio

The ratio between the two sample points is an important parameter for calculating the interpolated points. The P-BSHADE method considers that the sample points are not evenly distributed ( E y 0 E y i ). Accordingly, the relationship between the two sample points can be written as:
b i E y 0 = E y i ,
where b i is the NDVI ratio between the two sample points. Using Equations (4) and (5) can be written as:
i = 1 n w i b i = 1 ,
This equation is generally valid under non-homogeneous conditions. Therefore, to determine y ^ 0 , the calculation coefficient w i   ( i = 1 , 2 , , n ) should be determined initially.

2.3.3. Estimation Weighting

Based on the above considerations, the key to this estimation problem is obtaining a weighting w i ( i = 1 , 2 , , n ) in Equation (6) that satisfies the unbiased condition in Equation (2) and the minimum variant condition in Equation (3). The second condition implies that weighting can be calculated by minimizing the estimation variant in Equation (1), which is as follows:
σ y ^ 0 2 = E ( y ^ 0 y 0 ) 2 = C ( y ^ 0 y ^ 0 ) + C ( y 0 y 0 ) 2 C ( y ^ 0 y 0 ) ,
where C is the statistical covariance between the NDVI values of the two sample points.
To perform interpolation experiments, we selected the interpolated points with the highest NDVI correlation, positive weighting (sample points with negative weighting were eliminated), and lowest estimation error variance.
Based on the minimum σ y ^ 0 2 of weighting w i ( i = 1 , 2 , , n ) and considering it to be unbiased, using Equation (6), we can obtain the following:
[ C ( y 1 y 1 ) C ( y 1 y n ) b 1 C ( y n y 1 ) C ( y n y n ) b n b 1 b n 0 ] [ w 1 w n μ ] = [ C ( y 1 y 0 ) C ( y n y 0 ) 1 ] ,
where μ is the Lagrange constant. Further, the minimum estimation variant can be written as:
σ y ^ 0 2 = σ y 0 2 + i = 1 n j = 1 n w i w j C ( y i y j ) 2 i = 1 n w i C ( y i y 0 ) + 2 μ ( i = 1 n w i b i 1 ) ,
This study also considered the following common interpolation methods during the P-BSHADE interpolation experiment on grassland production.
Kriging is a spatial and local interpolation method based on the statistical variogram theory and structural analysis. Based on the spatial autocorrelation of regionalized variables, an unbiased optimal estimation can be performed on interpolated points in a limited region [20]. This study used the OK method, which is a commonly used robust Kriging method.
IDW is a simple and convenient spatial interpolation method [20]. It principally uses the distance between a sample point and an interpolated point as weighting to calculate a weighted average. The closer the interpolated point is to the sample point, the higher the weighting.
The radial basis function (RBF) method uses a base function to calculate a set of weighting coefficients for interpolated points to achieve smooth interpolation [21]. This method is similar to the variogram model in the Kriging method, where the smoothness of the interpolation surface and the interpolation accuracy are controlled by adjusting the smooth factor of the base function.

3. Results

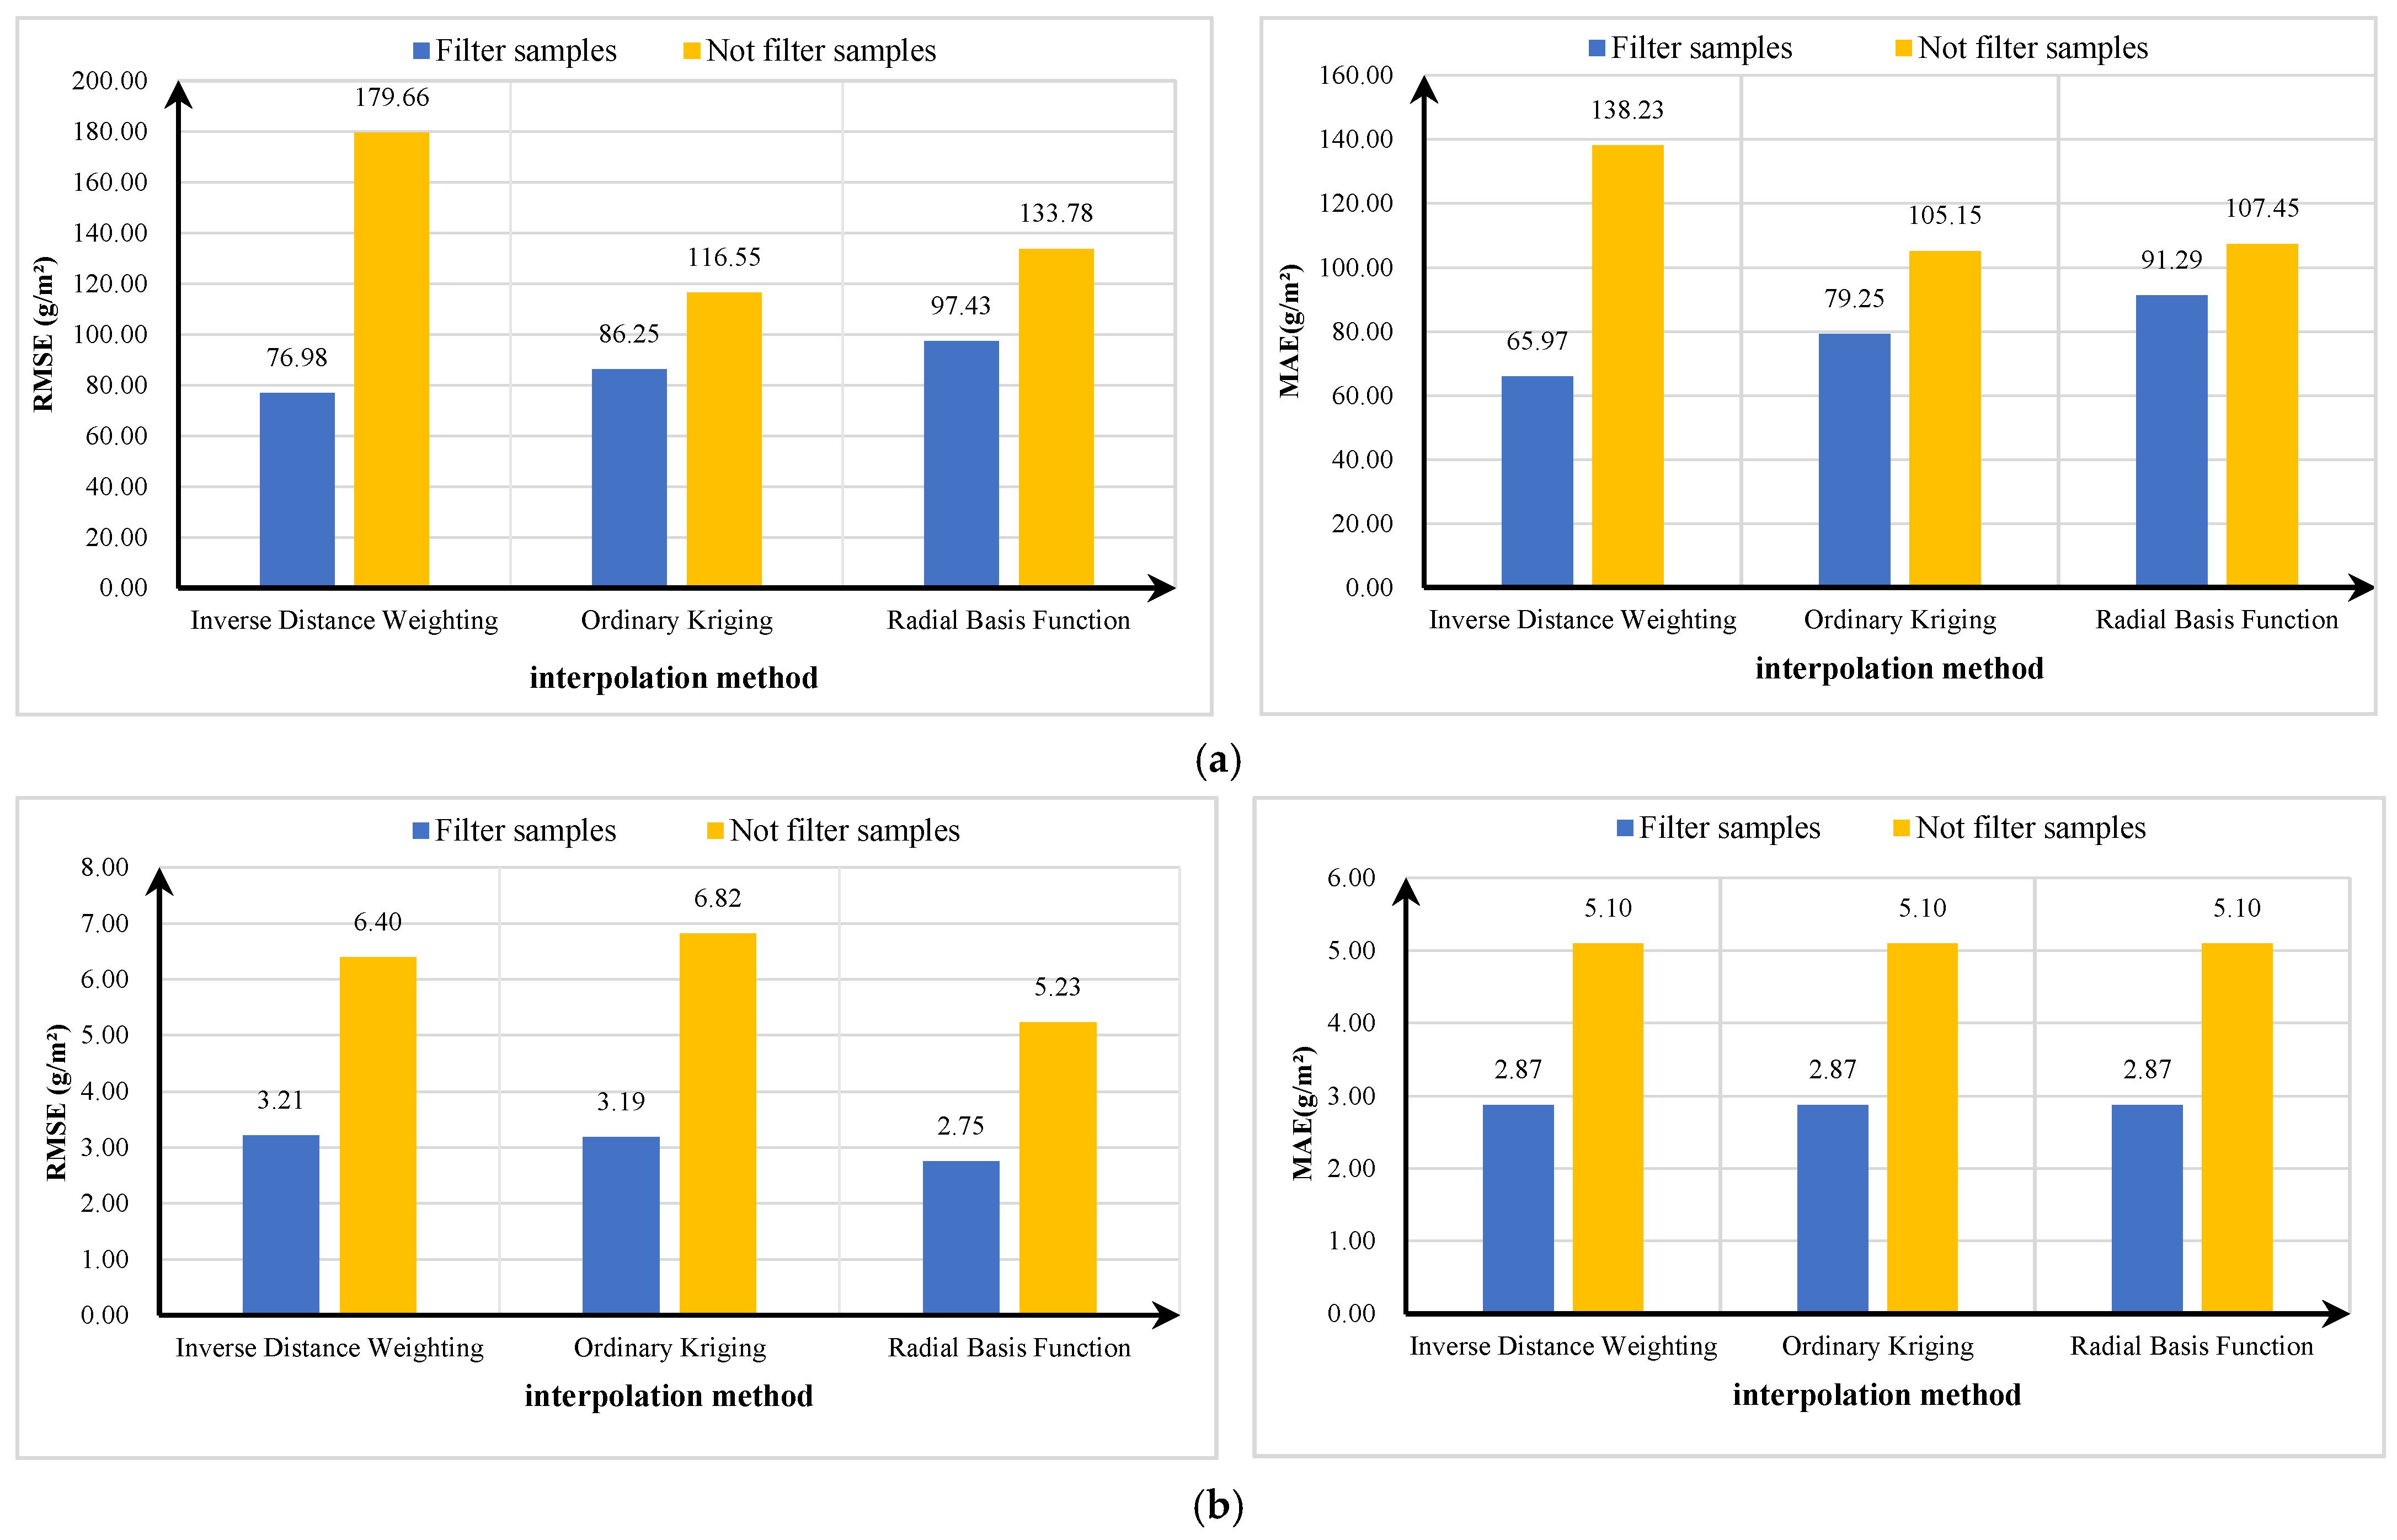
3.1. Interpolation Accuracy

To validate the feasibility of using the P-BSHADE method, this study calculated the correlation and estimation error variance among the measured sample points and then selected the points with the highest correlation and lowest estimation error variance. In addition, to validate the interpolation accuracy, we randomly used the measured sample points (20%). For OK, RBF, and IDW, we used the same samples as selected previously to perform interpolation experiments and accuracy validation.
After comparing the results from the interpolation methods, we discussed the method that was the best for producing sample points for grassland production. The interpolation accuracy was validated using root mean square error (RMSE) and mean absolute error (MAE), which can be calculated as follows:
RMSE = i = 1 N ( y i ^ y i ) 2 N ,
MAE = 1 N × i = 1 N | y i ^ y i | ,
where N is the number of validation points, y i is the measured value (g), and y i ^ is the estimated value (g).
The interpolation accuracies of the P-BSHADE, IDW, OK, and RBF methods in Xilingol League and Dornogovi Province are shown in Table 1.
Table 1 shows that P-BSHADE has RMSE and MAE values of 47.32 and 43.10 g·m−2, respectively, for the Xilingol League, giving it the highest overall accuracy in the interpolation results of grassland production in this region. Further, RBF for Dornogovi Province showed RMSE and MAE values of 2.75 and 2.87 g·m−2, respectively. Overall, the RBF method showed the best interpolation results for grassland production in Dornogovi Province.
The accuracy of interpolation results is affected by the redundancy and refinement of samples [22]. The above experiments used samples selected by the P-BSHADE method for interpolation. During the OK, RBF, or IDW interpolation experiments, 20% of measurement sample points were randomly selected as samples. The interpolation accuracy results are shown in Figure 2.
Thus, in Xilingol League and Dornogovi Province, the interpolation accuracies using the OK, RBF, or IDW methods with samples selected by P-BSHADE were higher than those without P-BSHADE. Therefore, the samples selected by P-BSHADE were used for the interpolation experiments on grassland production in this study.

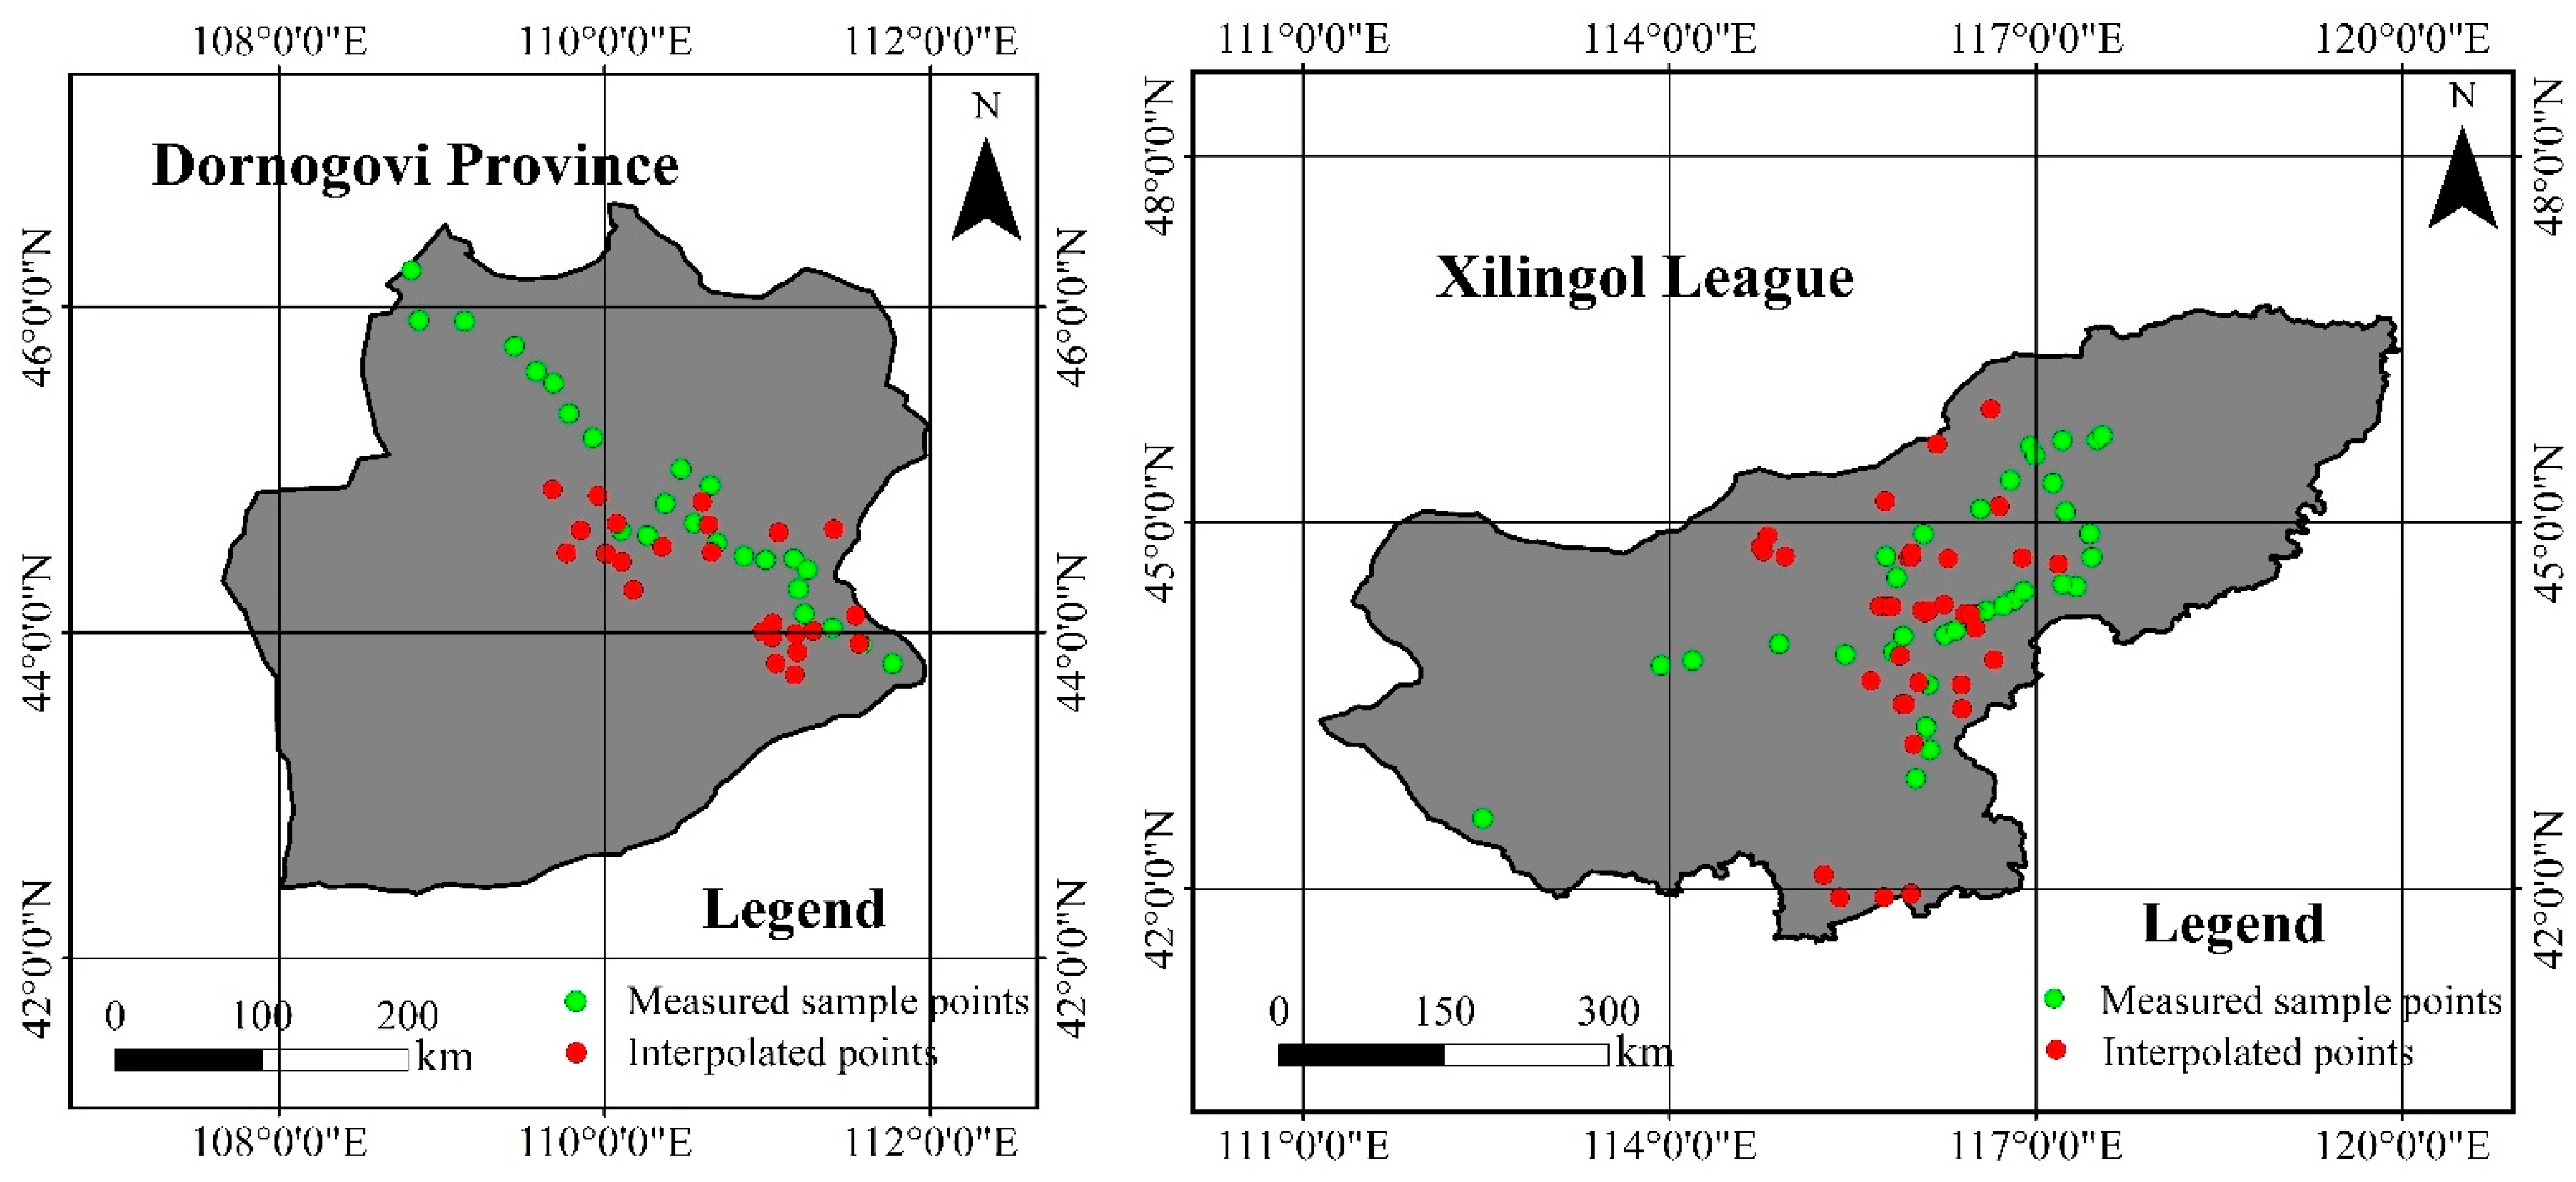
3.2. Results of the Interpolated Sample Points

The P-BSHADE method was used to select the interpolated points surrounding the samples in Xilingol League and Dornogovi Province, which had the highest NDVI correlation, positive weighting (sample points with negative weighting were eliminated), and least estimation error variance, to perform interpolation experiments. In total, 38 interpolated points were obtained from Xilingol League using P-BSHADE method. In Dornogovi Province, 24 interpolated points were randomly obtained surrounding the samples using the RBF method. The distributions of the interpolated points are shown in Figure 3.

3.3. Grassland Production Estimation Model

3.3.1. Model Building

The statistical regression analysis was conducted to build the estimation model, and grassland production in the study areas was calculated by inversion. This study selected NDVI, which showed a strong correlation with the sample points of grassland production, to perform correlation analysis with all sample points of grassland production. Consequently, a strong correlation was observed between the sample points of grassland production and NDVI (Person > 0.6).
After performing the interpolation experiments using P-BSHADE, 76 and 48 sample points were determined for grassland production in Xilingol League and Dornogovi Province, respectively. Subsequently, we superimposed the sample points of grassland production with remote sensing data and extracted the NDVI pixel value for the corresponding period. Later, we randomly selected 80% of the sample points (all interpolated points and some measured sample points) to build linear, exponential, and power function models of NDVI, while the remaining 20% of sample points were used to check the model accuracy. We used the coefficient of determination (R2) in the regression equation, RMSE, and average relative error (REE) to evaluate the accuracy of each model, and selected the best model to estimate the grassland production for two regions. REE was calculated as follows:
R E E = i = 1 N ( Y i Y i ) 2 N Y i ¯ × 100 % ,
where N is the number of points for validation, Y i is the measured grassland production for the sample point i (g/m2), Y i is the estimated grassland production for the sample point i (g/m2), and Y i ¯ is the average value of Y i (g/m2).

3.3.2. Model Validation

The results showed that in Xilingol League (Table 2), the R2 of the power function model based on NDVI was 0.72, accuracy was 72.83%, and RMSE was 85.82 g·m−2. After comparing these results with those of the other models, power function was selected as the applied grassland production estimation model for Xilingol League.
In Dornogovi Province (Table 3), the R2 value of the power function model based on NDVI was 0.63, accuracy was 74.83%, and RMSE was 3.55 g·m−2. Thus, this model was also chosen as the grassland production estimation model for Dornogovi Province.

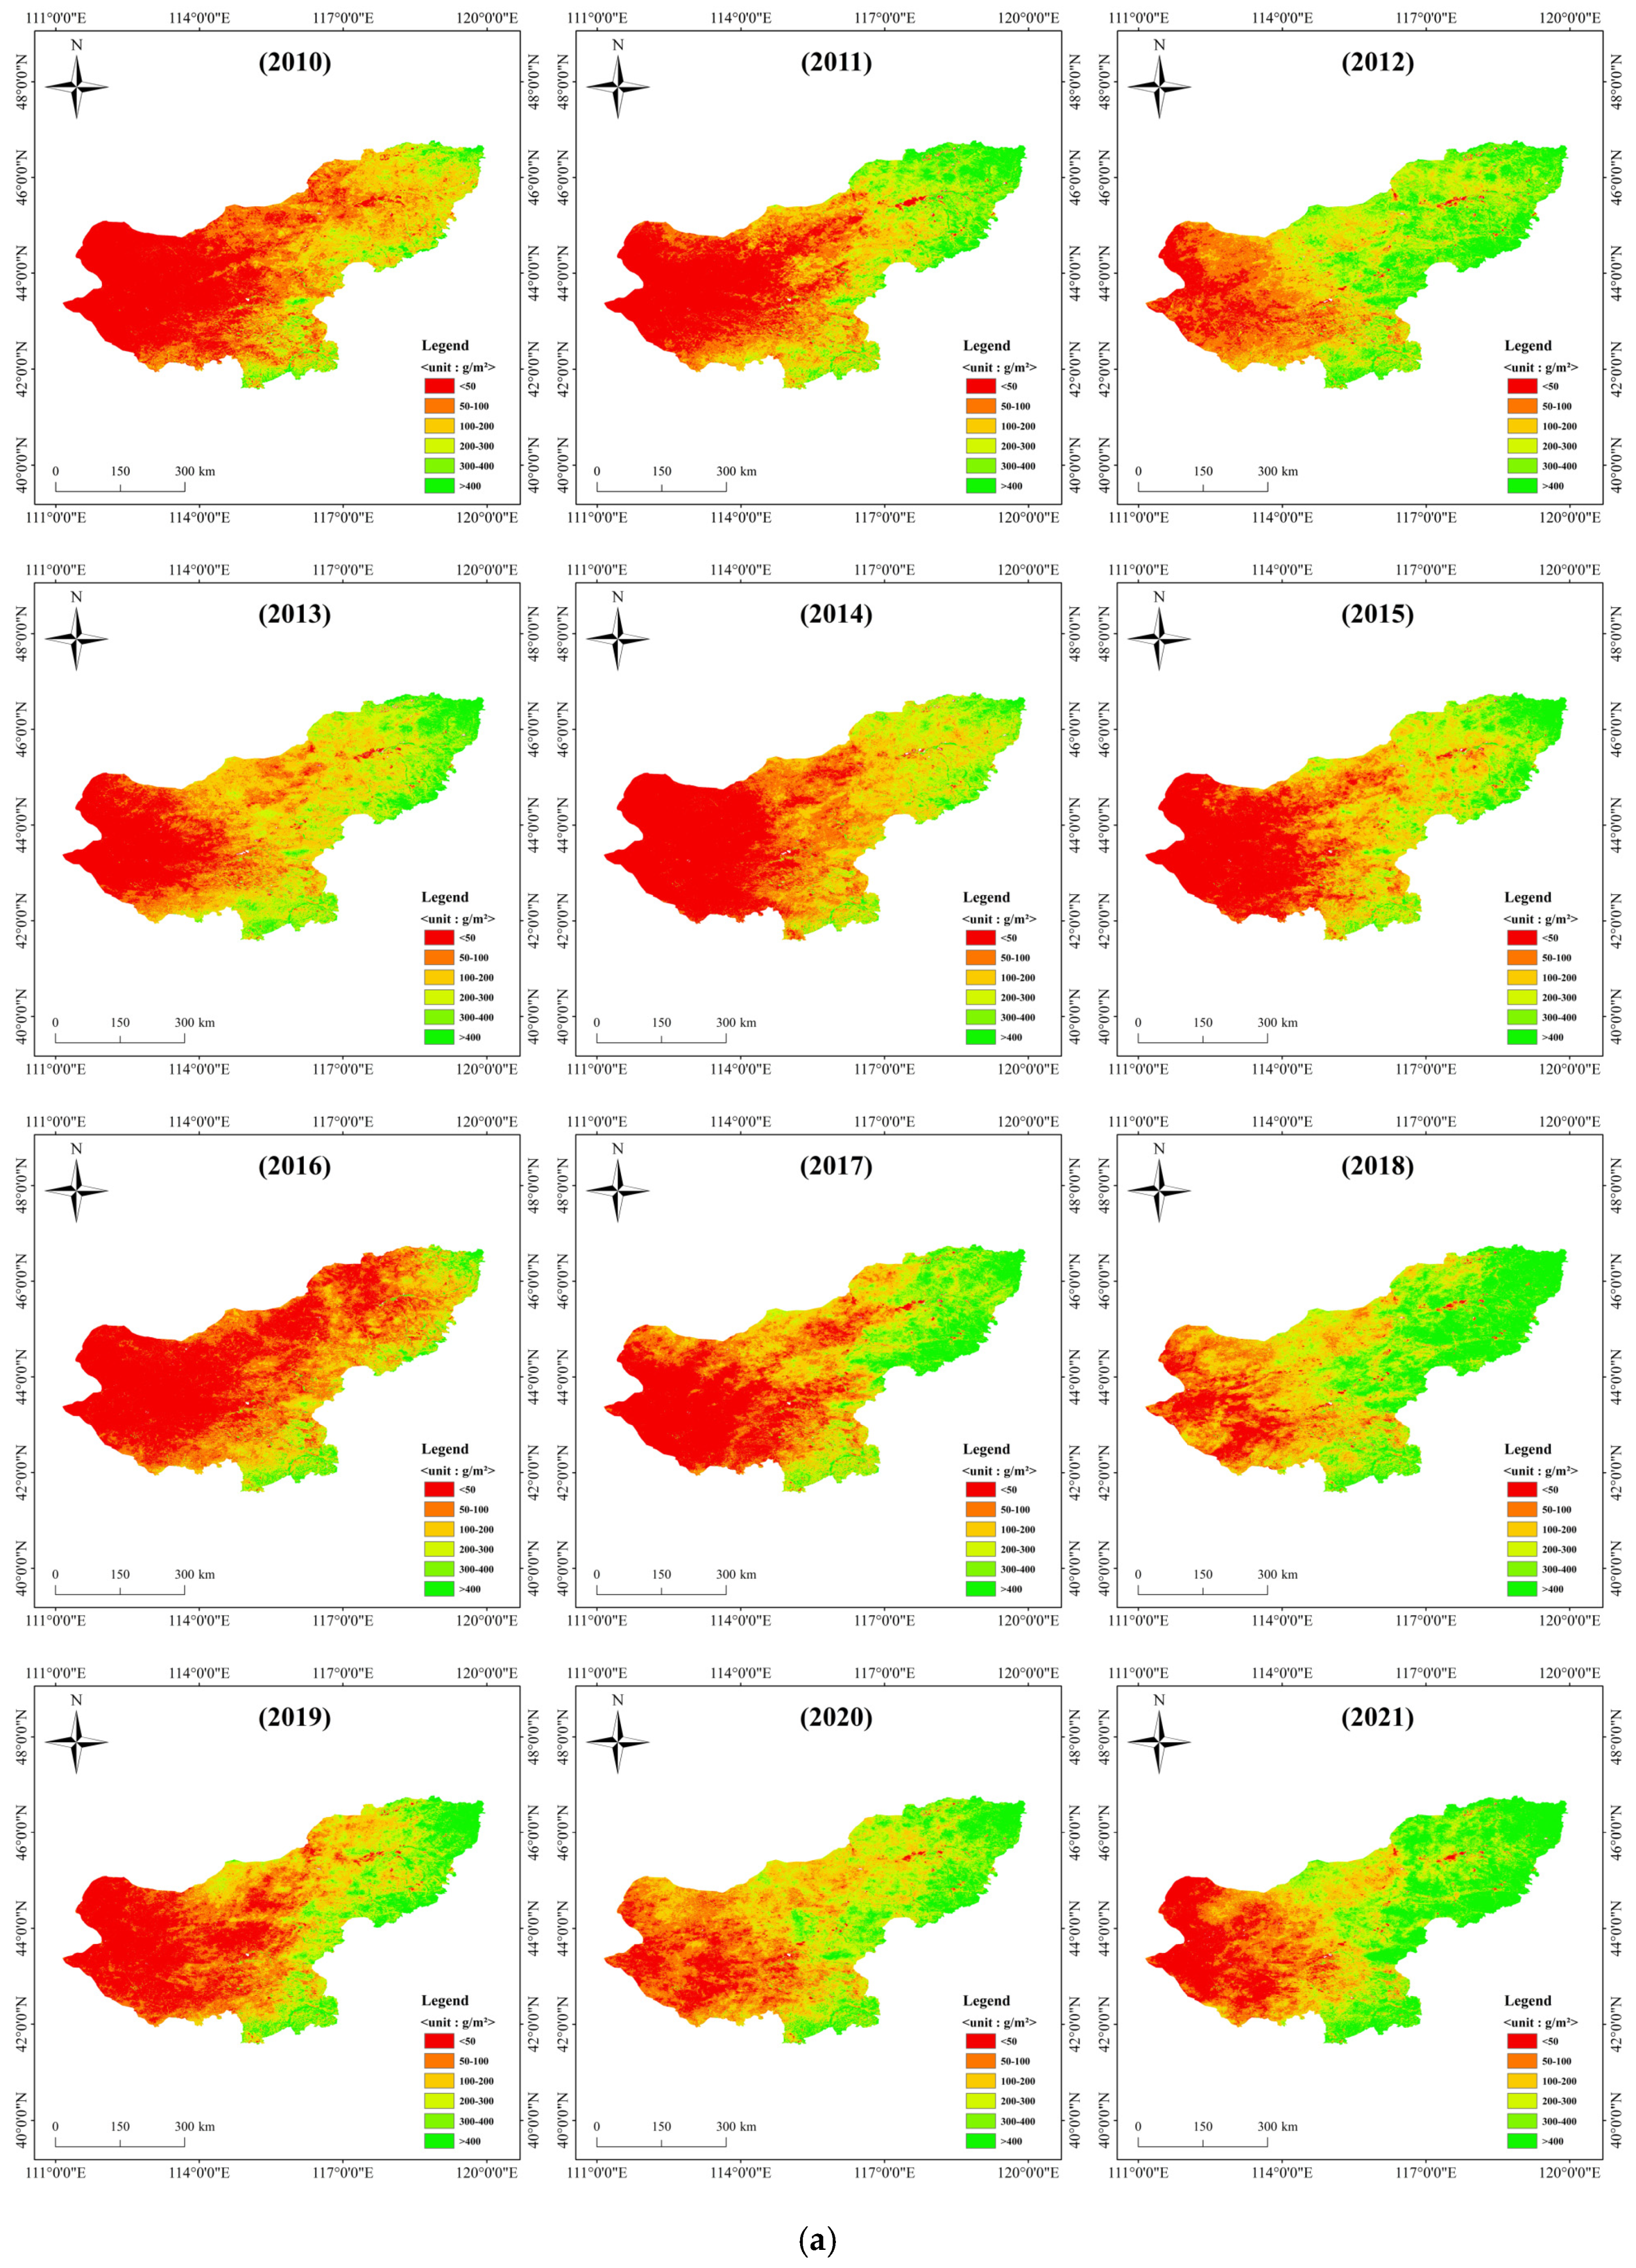
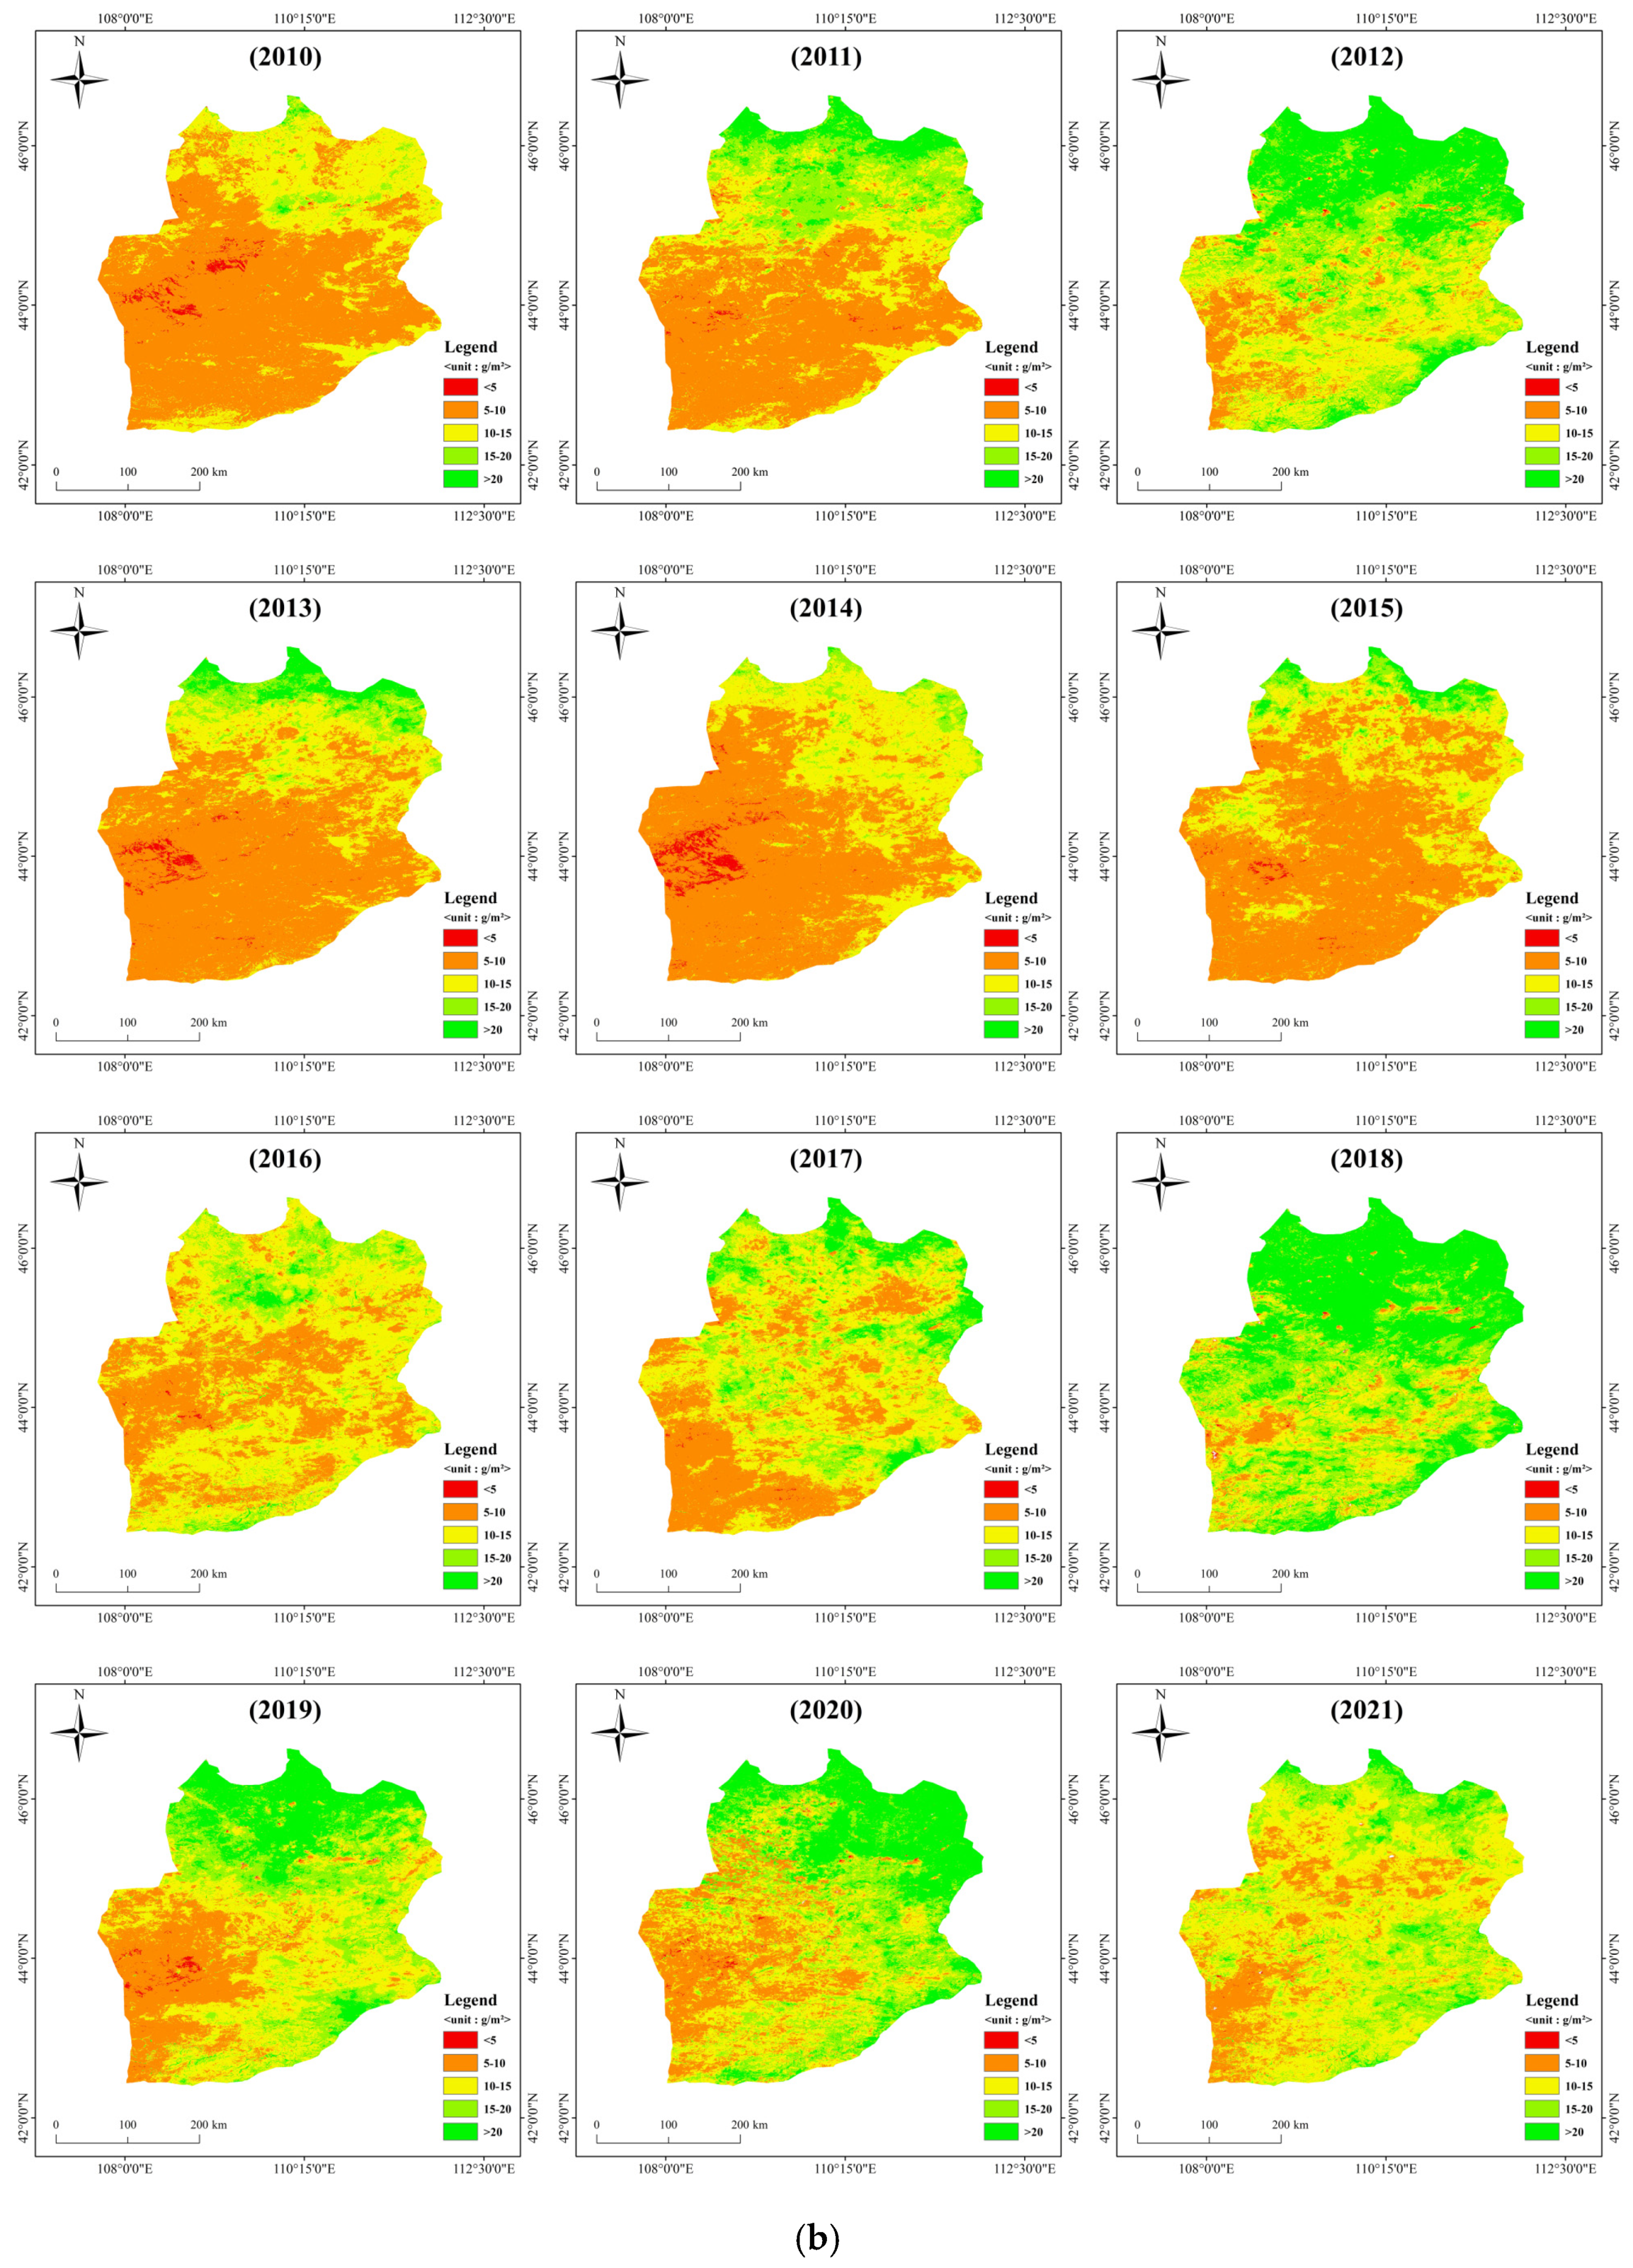
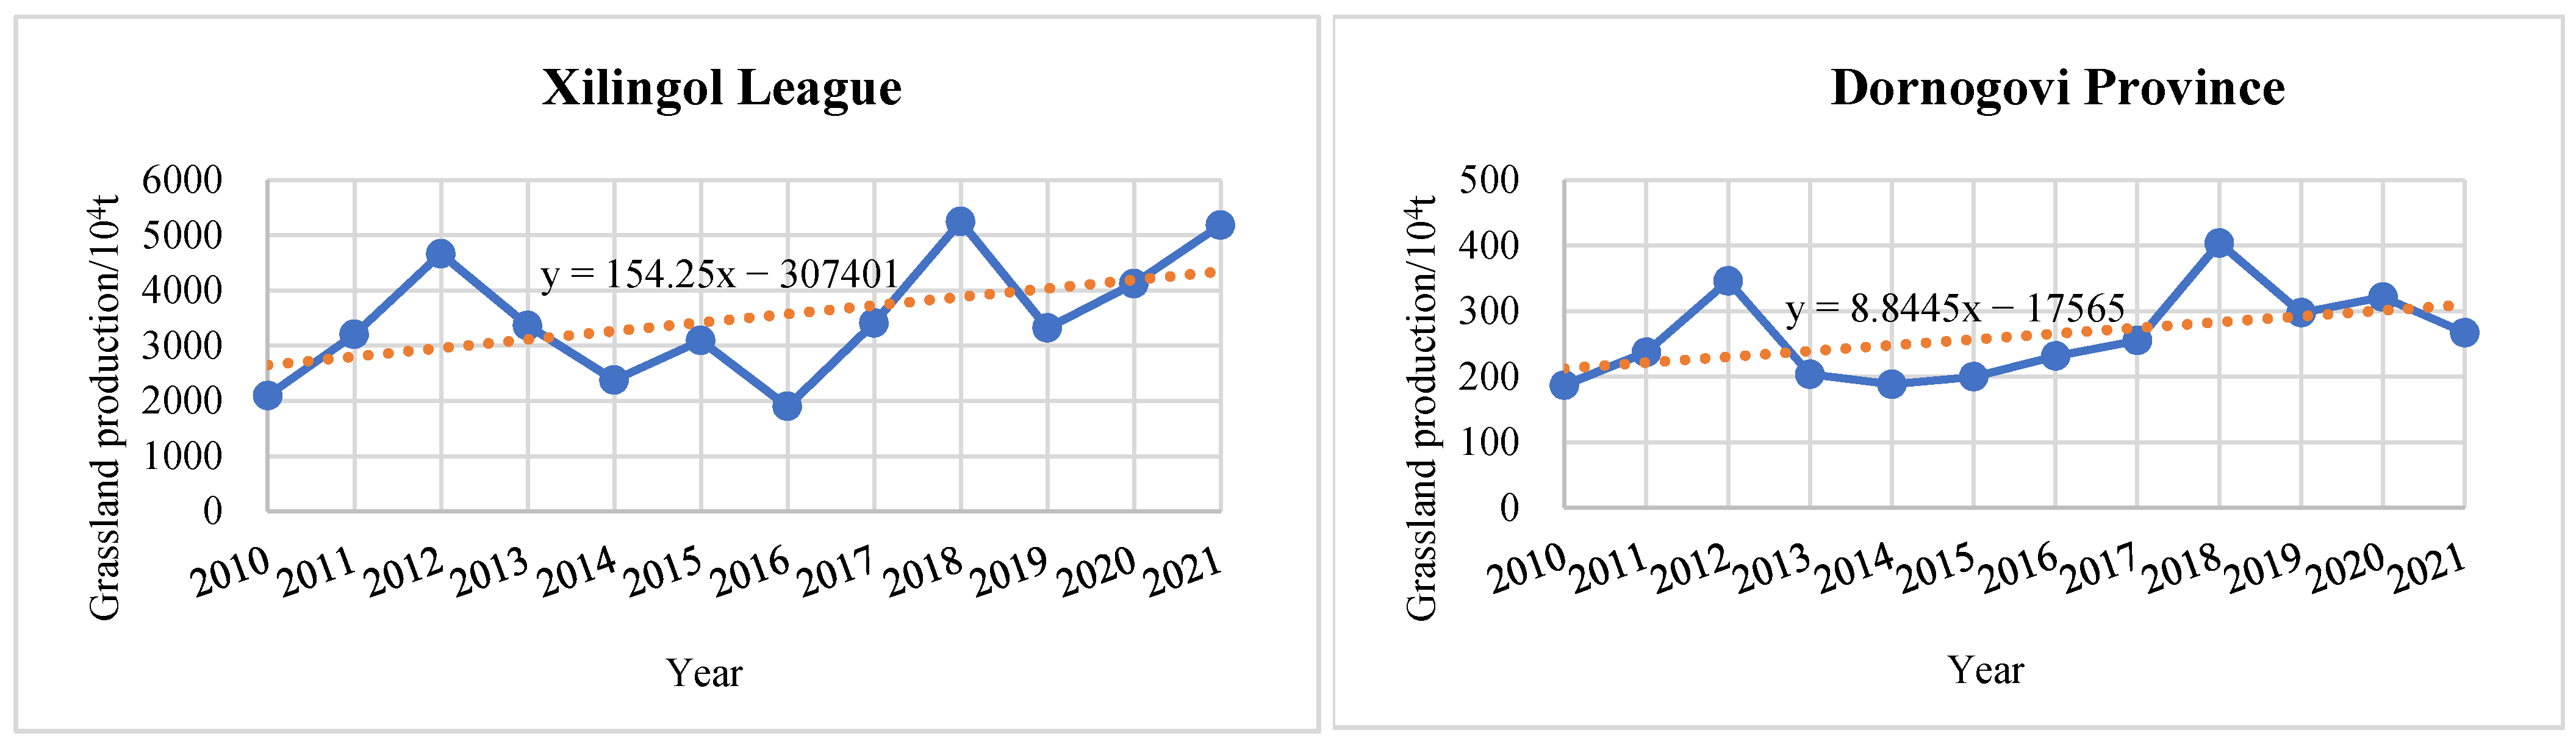
3.3.3. Estimation Results

Using the best estimation model in Xilingol League and Dornogovi Province, we determined the annual grassland production for 2010–2021, with a spatial resolution of 250 m. The estimation results for each year are shown in Figure 4. The grassland production distribution in Xilingol League and Dornogovi Province for 2010–2021 showed spatial variations, with gradual decreasing trends from northeast to southwest in both regions, which was similar to the zonal distribution pattern based on the vegetation types of grasslands.
In Xilingol League, grassland production at Erlianhot City, Sunite Right Banner, and Sunite Left Banner, which were in the southwest of the region, was low, whereas that at East Ujimqin Banner to the northeast of the region, where grasslands showed good growth, was high. In Dornogovi Province, grassland production in Mandakh, Hadanbulak, and Chebsgaule Counties in the southwest of the region was low, whereas that in Delegrech and Yicht Counties in the northeast of the region, where grasslands showed good growth, was high.
The interannual variation characteristics of annual grassland production in the study area from 2010 to 2021 were shown in Figure 5. The total grassland production in Xilingol League and Dornogovi Province showed an overall dynamic upward trend. The upward trend of grassland production in Xilingol League was relatively strong, with a trend line formula of y = 154.25x − 307,401, compared to y = 8.84x − 17,565 for Dornogovi Province, showing a relatively mild upward trend.
In Xilingol League, the annual grassland production ranged from 1900 × 104 to 5200 × 104 t from 2010 to 2021 and the total output fluctuated greatly. In Dornogovi Province, the annual grass production ranged from 180 × 104 to 410 × 104 t, which reflected that the fluctuation of total output was relatively moderate. There was a large difference in the total yield between the two regions. The annual grassland production of Xilingol League and Dornogovi Province both peaked in 2018, at 5247.53 × 104 and 403.79 × 10⁴ t, respectively.

4. Discussion

4.1. Applicability of Sample Interpolation Method

In Xilingol League, the sample interpolation accuracy of P-BSHADE was much higher than that of the OK, IDW, and RBF methods. P-BSHADE used NDVI, which was strongly correlated to grassland production, as a middle variable and was more suitable for interpolation experiments in areas with strong and continuous NDVI signals. P-BSHADE also worked well for Dornogovi Province of Mongolia but was not the best. In Dornogovi Province, due to the sparse grassland [23] and the small value of the grassland production samples, the interpolation precisions obtained by RBF, P-BSHADE, OK, and IDW methods showed little difference. However, among them, RBF had the highest interpolation accuracy, slightly superior to P-BSHADE. This indicated P-BSHADE was more suitable for areas with strong NDVI signal and rich grassland cover, whereas other interpolating methods can be more effective than P-BSHADE for areas with low grass cover and weak NDVI values.
P-BSHADE had theoretical advantages over other methods. It had a more realistic assumption, considering that sample points were distributed both uniformly and non-uniformly (non-uniformity was represented by the ratio between two sample points). For P-BSHADE, the use of NDVI, which was strongly correlated to grassland production and had a long time series, as a middle variable to obtain the sample and interpolated points enriched the interpolation process. Then, by using the initial new sample points selected by the P-BSHADE method to perform the interpolation experiments, the accuracies of the OK, IDW, and RBF methods all increased. Therefore, it is recommended that P-BSHADE was used to run the first round interpolating samples, especially in continental grassland cover regions.
When using P-BSHADE, the calculation parameters needed to meet the long time series. Chen [24] presented a novel three-dimensional (3D) EF model with energy and net primary productivity (3DEF-ENPP). The model used commonly available statistical yearbook data and NPP data as stable energy parameters, which was similar to the P-BSHADE method. In the future, we will apply 3DEF-ENPP to carry out grass yield sample point interpolation experiment to verify its feasibility.

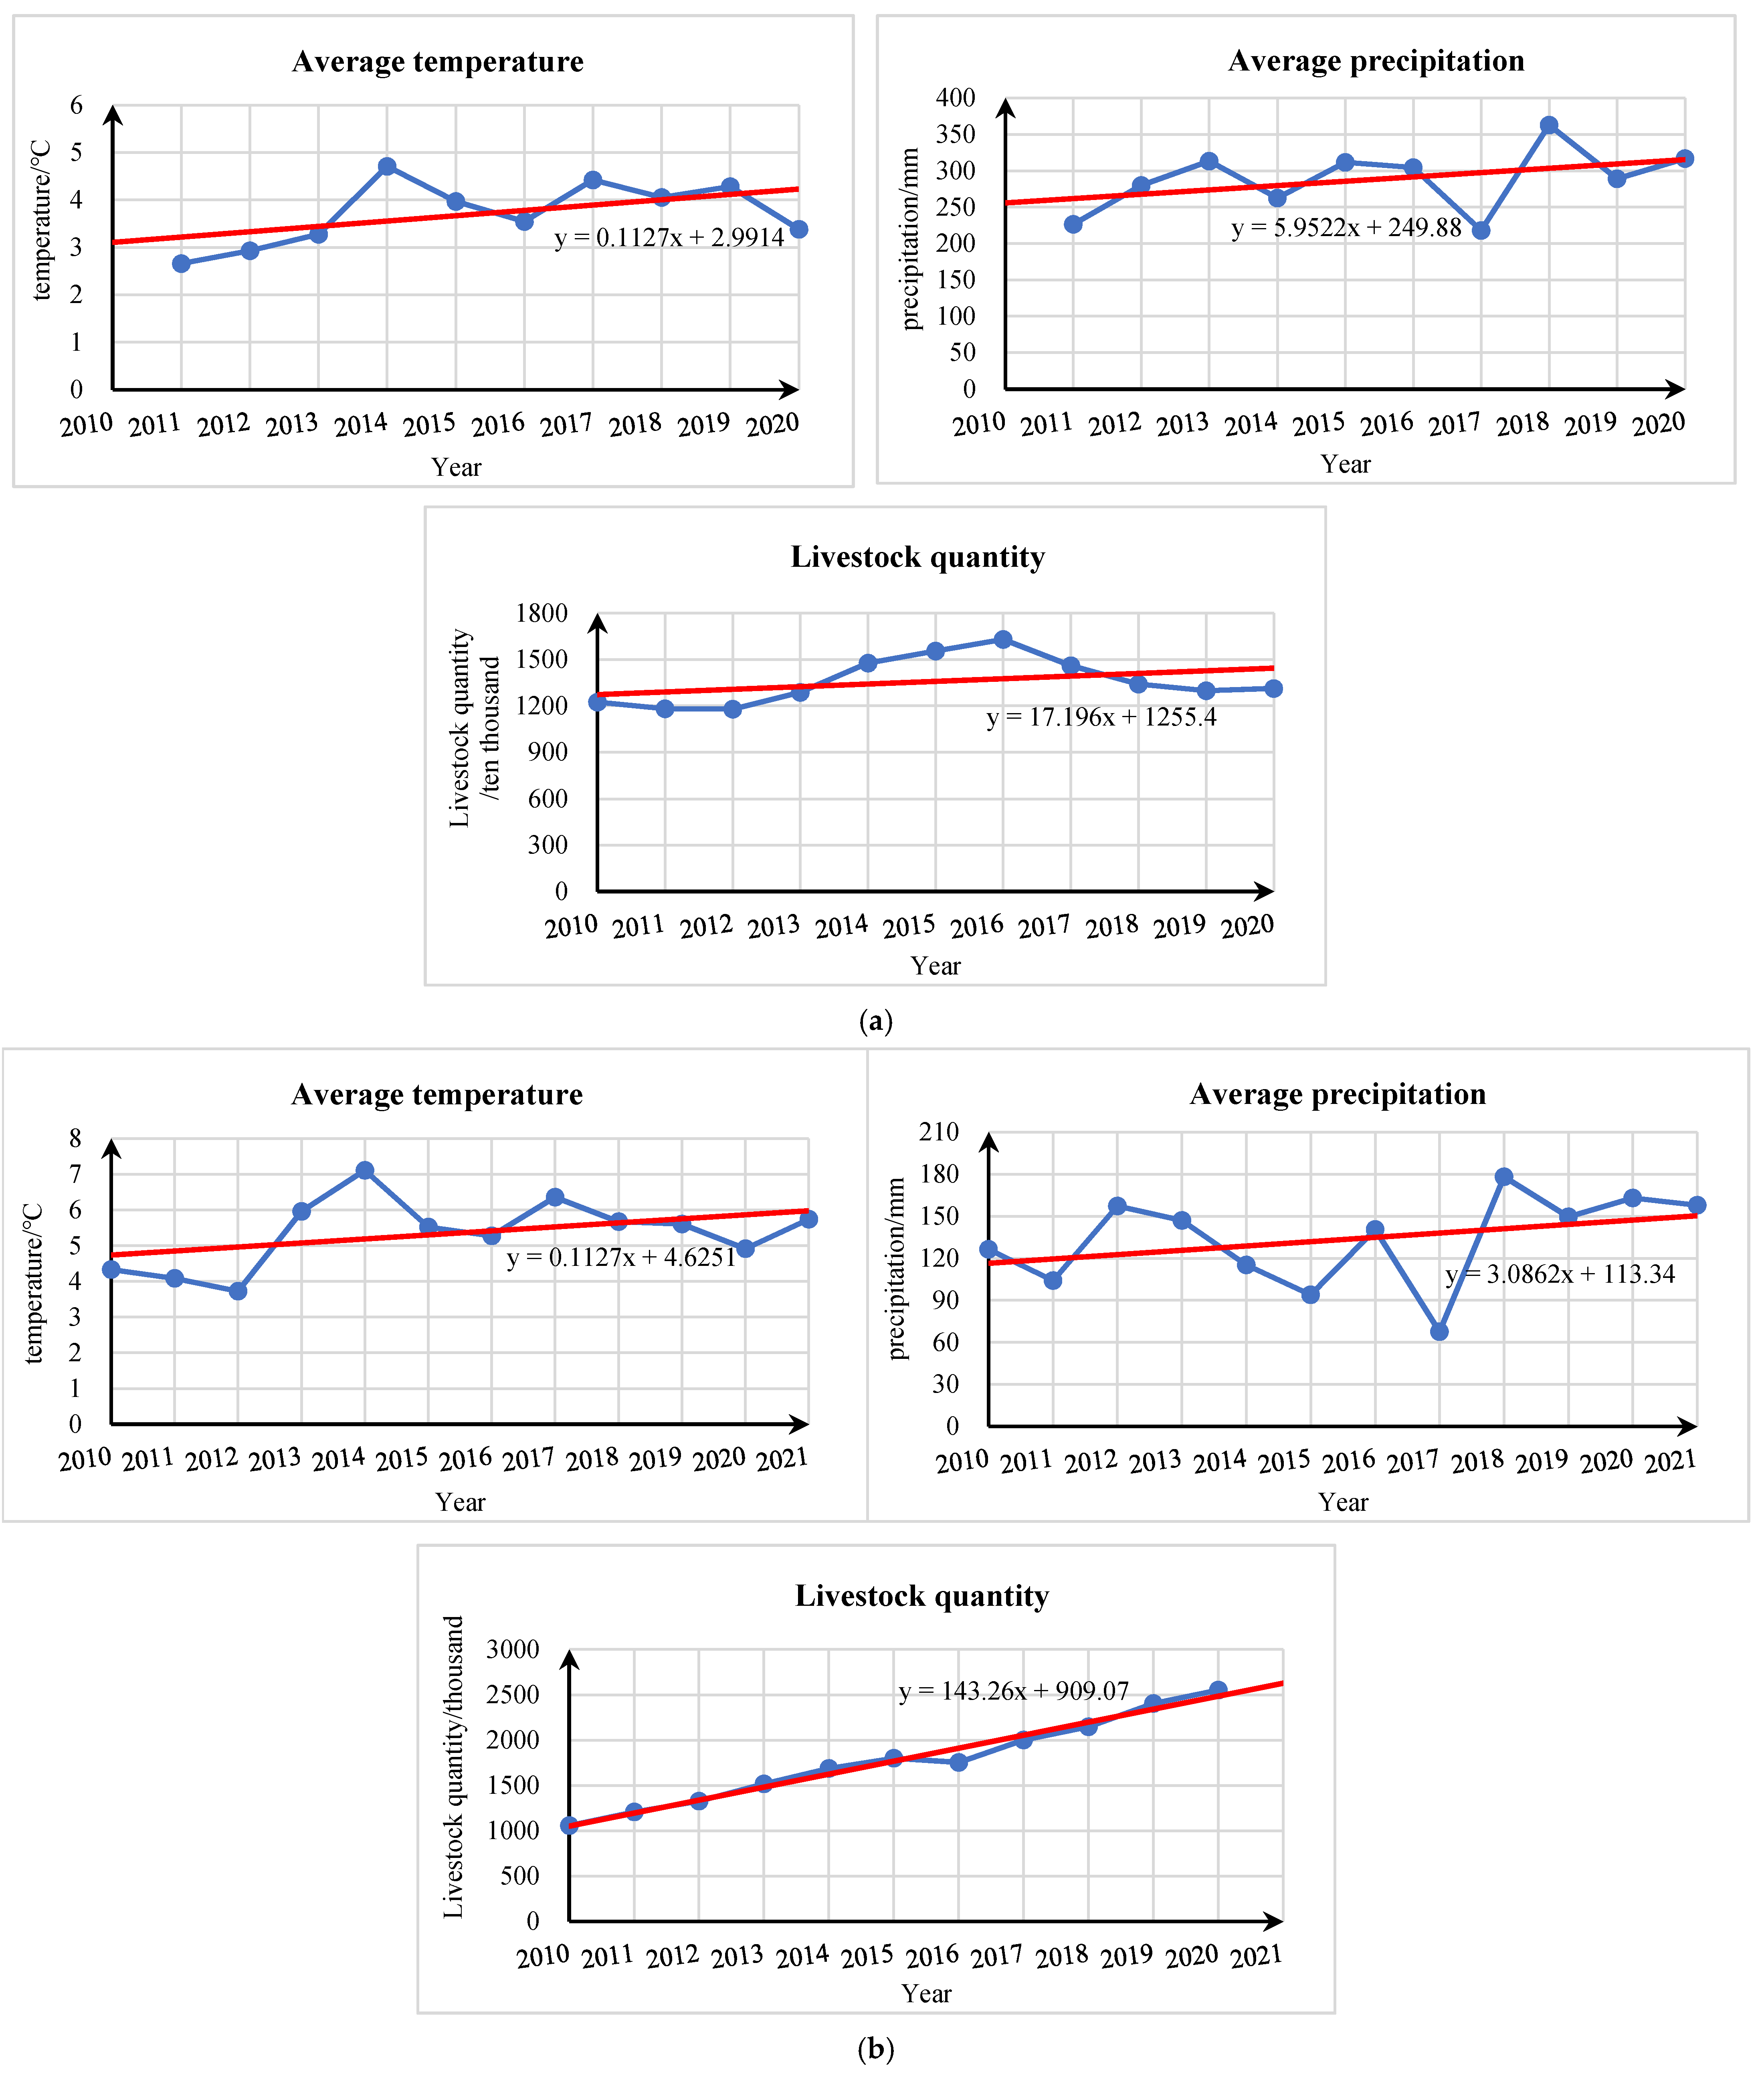
4.2. Grassland Production Temporal-Spatial Distribution and Driving Forces

Temperature and precipitation are climatic factors with obvious horizontal distribution characteristics and are important factors that affect changes in grassland production [25]. According to the metrological data supported by Statistical Yearbook of Xilingol League and the Mongolian Statistical Information Service, the temperature in Xilingol League and Dornogovi Province showed a slow upward trend from 2010 to 2021, in line with global warming trends (Figure 6). In 2014, the temperature in both areas peaked, which may have intensified water evapotranspiration from grassland soil, regional drought, and grassland degradation [26]. This was consistent with an obvious trend of grassland reduction in the two study areas in 2014.
The annual precipitation of Xilingol League was approximately 200–370 mm from 2010 to 2021, compared to 60–180 mm for Dornogovi Province (Figure 6). The increase in precipitation allows forage to use more water resources, which is conducive to growth and thus to improving grassland production. From 2012 to 2015 and 2018 to 2020, the trends in the variation of precipitation and grassland production in Xilingol League were similar, and those in Dornogovi Province from 2011–2014 to 2017–2021 were similar. Precipitation in Xilingol League reached its highest value in recent years, 363 mm, in 2018, while precipitation in Dornogovi Province reached high values of 157 and 178 mm in 2012 and 2018, respectively. The two regions reached their peak grassland production across the study period in 2018. As Xilingol League is to the southeast of Dornogovi Province, it is more vulnerable to the influence of the East Asian monsoon. Therefore, its precipitation is higher than the precipitation in Dornogovi Province and its grassland production and output values are much higher. Considering these climatic impacts, climate change driving factors are closely related to grassland production. Therefore, we will consider adding these parameters in the next step study to enhance the accuracy of the model.
Among social factors, animal husbandry is a pillar industry in both Xilingol League and Dornogovi Province. In Xilingol League, livestock numbers increased from 11.81 to 16.39 million from 2011 to 2016, the greatest number of livestock in the study period. Due to the high livestock numbers and subsequent increase in demand for grazing, the grassland system came under excessive pressure. Therefore, grassland production in Xilingol League decreased significantly in 2016, reaching its lowest value in the study period. To reduce pressure on the grassland, the state enacted various grassland protection policies to limit stocking capacity. Therefore, livestock numbers showed a decreasing trend after 2016; this gradually alleviated the pressure on the grassland ecosystem and allowed grassland production to recover slowly. Livestock numbers were far lower in Dornogovi Province than in Xilingol League, varying from 1000 to 2500 thousand, due to the limitations imposed by natural factors. However, driven by economic interests and a lack of constraints on regional animal husbandry regulation policies, the growth rate of livestock (mainly Gobi cashmere goats) in the region has shown no signs of slowing or stabilizing. This disorderly growth will gradually affect the sustainable development of grassland production. As can be seen from Figure 6, although precipitation in Dornogovi Province has increased since 2019, grassland production has shown a fluctuating declining trend over the same period. This is significantly different from the sustainable recovery of grassland production observed in Xilingol League in the same period when livestock numbers stabilized. This is despite the similar physical geographic conditions and identical climate change influence. The comparison indicates that strengthening controls on livestock quantity and reducing overgrazing in the Mongolian Plateau are key to sustainable development in this region and are more impactful than climate change.

5. Conclusions

With the goal of estimating the demand for grassland production in a large area of the Mongolian Plateau with limited sampling points, this study selected Xilingol League, China, and Dornogovi Province, Mongolia, as typical areas to conduct a comparative study on the applicability of grassland production estimation methods in different regions. For the parameters with long time series stability, P-BSHADE can be used to screen sample points and interpolation points to improve the interpolation accuracy. The sample point interpolation effect based on P-BSHADE was appropriate in Xilingol League, especially for rich grassland regions, because of the strong and continuous NDVI signals. In contrast, in poor grassland regions with weak NDVI values, other interpolation methods may show better performance, such as RBF for Dornogovi Province. Sample points and NDVI vegetation indices were used to build statistical regression models. The power function model was the most suitable for Xilingol League and Dornogovi Province and was thus used to obtain annual grassland production levels for both Xilingol League and Dornogovi Province for 2010–2021. During this period, the annual grassland output value decreased gradually from northeast to southwest in both regions. The growth rate of grassland output was faster in Xilingol League than that in Dornogovi Province, indicating that animal husbandry regulation policies play important roles and had a greater influence than climate change in areas with similar physical geographic and climate change conditions. In general, the estimated grassland production data obtained in this study reflected the relationships and laws relating to regional natural and social factors in Xilingol League and Dornogovi Province. The developed method of estimating grassland production is applicable in typical areas of the Mongolian Plateau, and this study can serve as a reference for estimating overall grassland production.

Author Contributions

Methodology, manuscript design, J.W. and H.X.; writing—review and editing, J.W.; investigation, D.D. and Q.L.; original draft, data curation, experimentation, and analyses, Q.L.; funding acquisition, J.W. and A.O. All authors have read and agreed to the published version of the manuscript.

Funding

This research was funded by the National Natural Science Foundation of China (Grant No. 41971385 and 32161143025), the Strategic Priority Research Program (Class A) of the Chinese Academy of Sciences (Grant No.: XDA2003020302), and the National University of Mongolia (Grant No: P2020-3779).

Institutional Review Board Statement

Not applicable.

Informed Consent Statement

Not applicable.

Data Availability Statement

Not applicable.

Conflicts of Interest

The authors declare no conflict of interest.

References

  1. Zhang, Y.Z.; Wang, Z.Q.; Yang, Y.; Li, J.L.; Zhang, Y.; Zhang, C.B. Research on the Quantitative Evaluation of Grassland Degradation and Spatial and Temporal Distribution on the Mongolia Plateau. Pratacult. Sci. 2018, 35, 233–243. [Google Scholar]
  2. Dai, L.; Zhang, L.; Wang, K.; Wang, R.L. Vegetation Changing Trend and Its Affecting Factors in Mongolian Plateau. Bull. Soil Water Conserv. 2014, 34, 218–225. [Google Scholar]
  3. Huang, X.; Liu, J.H.; Shen, K.J.; Liu, Y.M.; Wang, L. Grassland Yield Change in Qinghai Province Based on MODIS Data, ARID LAND. Geography 2020, 43, 715–725. [Google Scholar]
  4. Xu, B.; Yang, X.; Tao, W.; Qin, Z.; Liu, H.; Miao, J. Remote Sensing Monitoring Upon the Grass Production in China. Acta Ecol. Sin. 2007, 27, 405–413. [Google Scholar] [CrossRef]
  5. Wang, S.L.; Wang, R.X.; Jing, W.M.; Zhao, W.J.; Niu, Y.; Zhu, H. Biomass of Grassland and Response to Soil Moisture on Arid Mountain Land in the Qilian Mountains. Arid Land Geogr. 2017, 40, 772–779. [Google Scholar] [CrossRef]
  6. Wang, Q.; Wu, C.; Cheng, K.; Zhang, X.; Zhang, L.; Ding, J. Estimating Grassland Yield and Carrying Capacity in Qinghai Lake Basin Based on MODIS NPP Data. Ecol. Sci. 2019, 38, 178–185. [Google Scholar]
  7. Dong, R.L.; Jia, W.; Yu, G.H. Research Progress on Prediction Models of Grass Yield and Livestock Carrying Capacity of Grassland. Acta Agrestia Sin. 2018, 26, 1043–1051. [Google Scholar]
  8. Li, P.; Zang, Y.; Chan, F.K.S.; Wang, J. Desertification and Its Control Along the Route of China’s “Belt and Road Initiative”: A Critical Review. Authorea 2020. [Google Scholar] [CrossRef]
  9. Yi, G.; Zhang, T.; He, Y.; Ye, H.; Li, J.; Bie, X.; Liu, D. Applicability Analysis of Four Spatial Interpolation Methods for Air Temperature. J. Chengdu Univ. Technol. 2020, 47, 115–128. [Google Scholar]
  10. Wang, S.; Liu, Y.; Zhu, C.; Jiang, H. Contrast on Different Spatial Interpolation Methods of Daily Surface Temperature Data in Terrain Complex Area, Qinghai Province. Plateau Meteorol. 2011, 30, 1640–1646. [Google Scholar]
  11. Jiang, X.J.; Liu, X.J.; Huang, F.; Jiang, H.Y.; Cao, W.X.; Zhu, Y. Comparison of Spatial Interpolation Methods for Daily Meteorological Elements. Yingyong Shengtai Xuebao 2010, 21, 624–630. [Google Scholar] [PubMed]
  12. You, S.C.; Li, J. Study on Error and Its Pervasion of Temperature Estimation. J. Nat. Resour. 2005, 1, 140–144. [Google Scholar]
  13. Li, P.F.; Li, M. Study on Vegetation Fraction Based on Kriging Interpolation Method—A Case Study of Zhaling Lake, Eling Lake. J. Anhui Agric. Sci. 2015, 43, 321–324. [Google Scholar]
  14. Qiao, Y.X.; Zhu, H.Z.; Shao, X.M.; Zhong, H.P.; Zhou, L.L.; Wu, Z.W. Automatic Classification of Grassland Type in Xinjiang Ili Based on Spatial Interpolation of Remote Sensing and Other Data. Acta Pratacult. Sin. 2017, 26, 30–45. [Google Scholar]
  15. Wang, J.F.; Reis, B.Y.; Hu, M.G.; Christakos, G.; Yang, W.Z.; Sun, Q.; Li, Z.J.; Li, X.Z.; Lai, S.J.; Chen, H.Y.; et al. Area Disease Estimation Based on Sentinel Hospital Records. PLoS ONE 2011, 6, e23428. [Google Scholar] [CrossRef] [Green Version]
  16. Wang, J.F.; Hu, M.G.; Xu, C.D.; Christakos, G.; Zhao, Y. Estimation of Citywide Air Pollution in Beijing. PLoS ONE 2013, 8, e53400. [Google Scholar] [CrossRef] [Green Version]
  17. Karimian, H.; Li, Q.; Li, C.C.; Fan, J.; Jin, L.; Gong, C.; Mo, Y.; Hou, J.; Ahmad, A. Daily Estimation of Fine Particulate Matter Mass Concentration through Satellite Based Aerosol Optical Depth. ISPRS Ann. Photogramm. Remote Sens. Spatial Inf. Sci. 2017, W2, 175–181. [Google Scholar] [CrossRef] [Green Version]
  18. Wang, Y.J.; WANG, J.L.; Wei, H.S.; Ochir, A.; Davaasuren, D.; Chonokhuu, S. Study on Estimation Method of Mongolia Grassland Production Based on Sparse Samples. J. Geo-Inf. Sci. 2020, 22, 1814–1822. [Google Scholar]
  19. Mongolian Statistical Information Service. Available online: www.1212.mn (accessed on 22 January 2022).
  20. Wang, J.; Liao, Y.; Liu, X. Spatial Data Analysis Tutorial; Science Press: Beijing, China, 2010. [Google Scholar]
  21. Li, X.; Zhang, Y.; Yang, S.; Yuan, F.; Zhou, T. Comparison of Typical Interpolation Methods for Pollution Evaluation of Soil Heavy Metals in Yicheng District, Hefei. J. Jilin Univ. (Earth Sci. Ed.). 2011, 41, 222–227. [Google Scholar]
  22. Tang, G.B. Study on Data Refinement Method of Soil Heavy Metals in Agricultural Land; Xi’an University of Science and Technology: Xi’an, China, 2021. [Google Scholar]
  23. Tamir, P. Study on the Response of Grassland Vegetation on Climate Change in the Eastern Mongolian Plateau; Inner Mongolia Agricultural University: Hohhot, China, 2017. [Google Scholar]
  24. Chen, G.; Li, Q.; Peng, F.; Karamian, H.; Tang, B. Henan Ecological Security Evaluation Using Improved 3D Ecological Footprint Model Based on Emergy and Net Primary Productivity. Sustainability 2019, 11, 1353. [Google Scholar] [CrossRef] [Green Version]
  25. Zhang, W.H.; Jia, Z.B.; Zhuo, Y.L.; Jiang, X.Y. Space Dynamic Change of Pasture Amount and Influence Factors Analysis in Xilin Gol Grassland. Earth Environ. 2016, 7, 163–172. [Google Scholar]
  26. Lu, M.Y. The Study on Influencing Factors of Xilin Gol Grassland Degradation and Sustainable Use Countermeasure Research; Inner Mongolia Agricultural University: Hohhot, China, 2012. [Google Scholar]
Figure 1. Distribution of the measured sample points in the study areas.
Sustainability 14 03122 g001
Figure 2. Comparison of the interpolation results with sample points selected/not-selected by the P-BSHADE method. (a) Xilingol League and (b) Dornogovi Province.
Sustainability 14 03122 g002
Figure 3. Distributions of the interpolated points for the two study areas.
Sustainability 14 03122 g003
Figure 4. Spatial distribution of grassland production in Xilingol League (a) and Dornogovi Province (b) for 2010–2021 (g/m2).
Sustainability 14 03122 g004aSustainability 14 03122 g004b
Figure 5. Annual changes in grassland production in different regions of the Mongolian Plateau from 2010 to 2021.
Sustainability 14 03122 g005
Figure 6. Driving factors of grassland production in (a) Xilingol League and (b) Dornogovi Province.
Sustainability 14 03122 g006
Table 1. Results of different interpolation methods for the two study areas.
Interpolation MethodRMSE in Xilingol League
(g/m2)
MAE in Xilingol League (g/m2)RMSE in Dornogovi Province
(g/m2)
MAE in Dornogovi Province (g/m2)
P-BSHADE47.3243.104.663.87
Inverse Distance Weighting76.9865.973.212.87
Ordinary Kriging86.2579.253.192.87
Radial Basis Function97.4391.292.752.87
Table 2. Accuracy of different grassland production estimation models using remote sensing in Xilingol League.
ParametersModel TypeInversion ModelSig.R2RMSE
(g/m2)
Accuracy (%)
NDVILinear modely = 0.088x − 117.0880.0000.5187.1273.24%
Power function modely = 0.000002 (x2.184)0.0000.7285.8272.83%
Exponential modely = 26.968 × EXP (0.000441x)0.0000.6395.7770.14%
Table 3. Accuracy of different grassland production estimation models using remote sensing in Dornogovi Province.
ParametersModel TypeInversion ModelSig.R2RMSE
(g/m2)
Accuracy (%)
NDVILinear modely = 0.009x − 1.8620.0000.583.6274.34%
Power function modely = 0.004 (x1.079)0.0000.633.5574.83%
Exponential modely = 6.081 × EXP (0.00046x)0.0000.613.7873.22%
Publisher’s Note: MDPI stays neutral with regard to jurisdictional claims in published maps and institutional affiliations.

