Article

Solution and Stability Analysis of Sliding Surface of Tailings Pond under Rainstorm

1
School of Mines, Liaoning Technical University, Fuxin 123000, China
2
School of Mechanics and Engineering, Liaoning Technical University, Fuxin 123000, China
3
School of Civil Engineering, Liaoning Technical University, Fuxin 123000, China
4
Jindong Sauce Wine Brewing Co., Ltd., Zunyi 563000, China
*
Authors to whom correspondence should be addressed.
Sustainability 2022, 14(5), 3081; https://doi.org/10.3390/su14053081
Submission received: 28 January 2022 / Revised: 28 February 2022 / Accepted: 4 March 2022 / Published: 7 March 2022

Abstract

:
In the case of rainstorm, instability accidents in tailings ponds occur frequently, but there is no reliable calculation method for the stability calculation of tailings ponds. At the same time, there are problems of fuzzy hydrological boundaries and randomness of geotechnical parameters in the stability analysis of tailings ponds, which greatly weakens the credibility of the stability calculation. Therefore, this paper studies the stability of tailings ponds by using the principle of hydrogeology, the theory of elastic-plastic mechanics, the idea of limit equilibrium, and the probability analysis model. The boundary conditions of rainfall slope of tailings ponds are determined based on hydrogeological rainstorm analysis and trapezoidal generalization method. The potential sliding surface of tailings pond slope is solved by using the limit strain criterion. Through the random sampling method of Monte Carlo parameters to deal with the randomness of slope geotechnical parameters, the limit strain Monte Carlo reliability analysis method is established. Finally, through the calculation of practical cases, the stability results of tailings ponds under rainstorm are analyzed. The research results provide ideas for the quantitative analysis of tailings pond stability and have important significance for engineering guidelines.

1. Introduction

A tailings pond is the main place for stacking tailings sand. In recent years, tailings pond accidents have occurred frequently. Dam break accidents of tailings pond have the potential for great harm, heavy casualties, and negative impact, which seriously threatens the personal safety of residents downstream of the tailings pond. According to the report results of 46 tailings dam breaks from 2011 to 2022 published on the WISE Uranium website, 10 of them were directly related to rainfall, accounting for 21% [1]. Rainstorms change the permeability of tailings ponds, improve the saturation line of tailings ponds, and pose a great threat to the safety of tailings ponds [2]. Therefore, it is of great significance to study the stability of tailings ponds in rainstorm areas.
The stability analysis of tailings pond has always been an important issue in the research of geotechnical slope engineering [3]. Many scholars at home and abroad have conducted a great deal of research on dam break accidents of tailings ponds caused by rainfall [4,5]. Rotta [6] studied the dam break event of a tailings pond in Brazil in 2019 and believed that continuous rainstorm greatly reduced the stability of the tailings pond. Glotov [7] summarized the causes of dam break in tailings ponds and concluded that the hydrological environment has an important impact on the stability of tailings ponds. The number of accidents related to rainfall accounts for a large proportion of all tailings pond accidents [8,9]. In terms of experiments, Gui [10] studied the stress deformation characteristics and nonlinear characteristics of tailings sand under the condition of rainfall infiltration, which provided theoretical support for the study of tailings pond stability [11,12,13]. Do [14] carried out experimental research on the slope change of tailings ponds caused by rainfall, obtained the change form of the water level line of tailings ponds before and after rainfall, and analyzed the erosion effect of rainfall on the strength of the geotechnical materials of tailings ponds [15,16,17,18]. Based on the numerical simulation results [19,20,21], Naeini [22] conducted research on early warning and safety evaluation of tailings ponds. Hu [23] studied the dam break process of tailings ponds under rainfall conditions by means of simulation experiment. Wang [24] used simulation software to analyze the long-term stability of tailings ponds, and put forward the basis of dam break of tailings pond under the condition of rainfall [25]. In terms of stability analysis, Sun [26] analyzed the stability of tailings ponds under the coupling action of seepage and stress, and checked the seepage stability with the height of phreatic line as the judgment basis of seepage stability [27,28,29]. Maldonado [30] expressed the uncertainty of tailings parameters in the form of probability, and studied the reliability of tailings ponds. By comparing the analysis results with the monitoring data, it is found that they are unified [31,32,33,34].
After analyzing a large number of documents, it is found that great progress has been made in the research of tailings pond stability, whether in experimental research, numerical simulation, or stability evaluation [35,36]. However, for the stability research under rainstorm, the problems of fuzzy rainfall hydrological boundaries and randomness of potential sliding surface and geotechnical parameters still exist, which makes the stability checking calculation results of tailings pond under rainstorm unreliable [37,38,39]. Thus, the main objectives of this study were to solve the rainfall boundary conditions and potential sliding surface position of tailings pond stability calculation under rainstorm, and put forward the limit equilibrium Monte Carlo stability analysis method to determine the slope stability of tailings ponds under rainstorm conditions.

2. Limit Strain Monte Carlo Stability Analysis Method for Rainfall Slope of Tailings Pond

According to the engineering characteristics of the small watershed of the tailings pond, the rainstorm formula method is selected to design the flood, the typical rainfall history curve and the same frequency scaling method are used to determine the rainfall time history distribution, and the trapezoidal generalization of the section of the tailings pond is proposed to solve the water level in the rainfall process, which is used as the water level boundary condition of the rainfall model of the tailings pond.

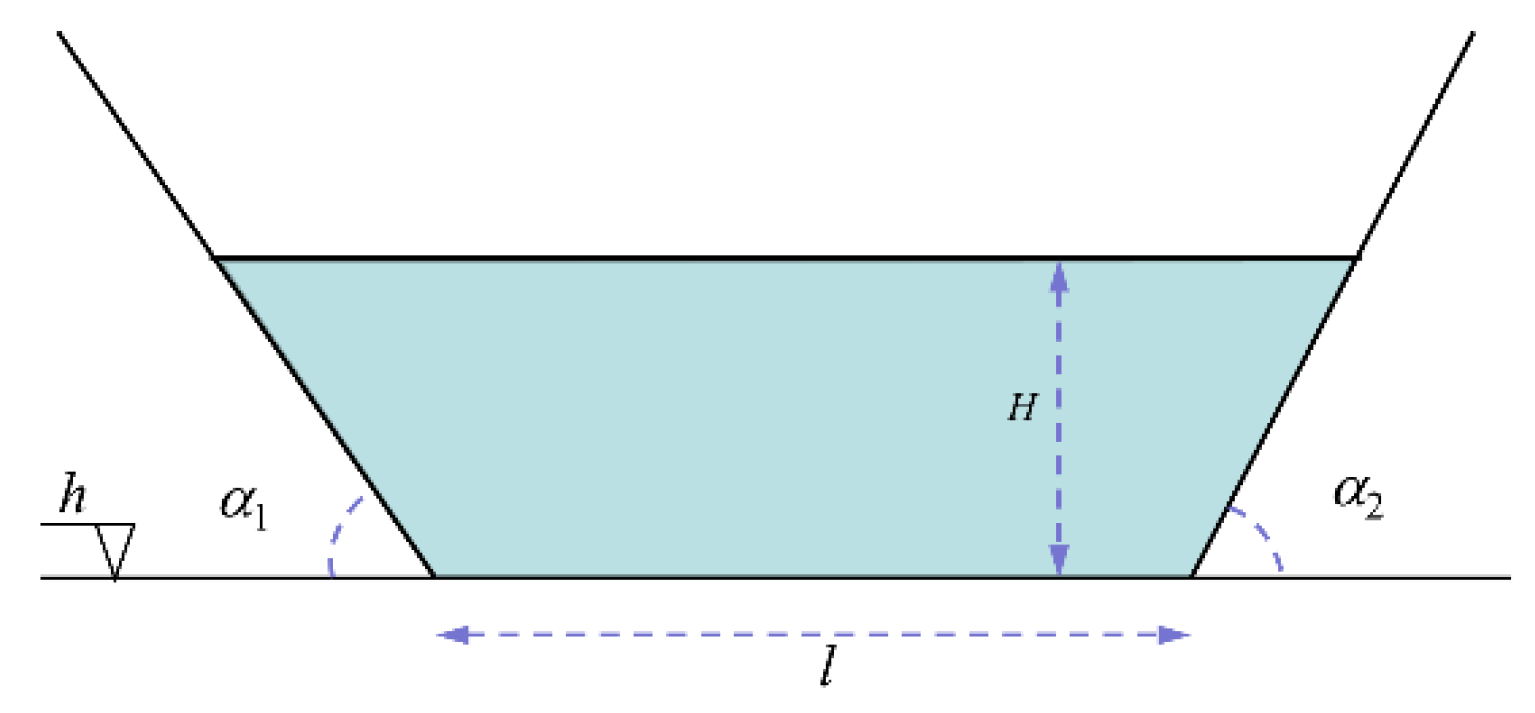
2.1. Boundary Parameters of Rainfall Model for Tailings Pond

(1) Calculation of rainstorm in tailings pond area
In order to determine the boundary conditions of tailings ponds under rainstorm, combined with local hydrogeological data, the parameters such as rainfall and rainfall intensity in the tailings pond area are calculated. Firstly, according to the engineering characteristics of a small watershed of a tailings pond, the regional rainfall parameters are solved by using the rainstorm intensity calculation formula:
Average rainstorm intensity with duration t corresponding to probability:
α t , p = S p t n
Corresponding probability of rainstorm with duration of t:
x t , p = S p t 1 n
where t—rainfall time; Sp—corresponding probability 1-h rainstorm average rainfall intensity; n—rainstorm decline coefficient.
The rainstorm time history distribution in the tailings pond area adopts the typical rainstorm same frequency control scaling method. It is assumed that the rainstorm history of the design tailings pond is divided into equal periods. If it is divided into periods of k, the rainstorm volume calculation formula of the m period is as follows:
x m ( m 1 ) = x m p x ( m 1 ) p
where: xmp—design rainstorm volume in period m; x(m−1)p—design rainstorm volume in period m − 1.
Then the calculation formula of rainstorm volume amplification ratio in the m period is as follows:
k m = x m p x ( m 1 ) p x m d x ( m 1 ) d
where xmd—typical rainstorm in period m; x(m−1)d—typical rainstorm volume in period m − 1.
According to the calculation, the typical rainstorm process frequency distribution diagrams of 1 h, 2 h, 3 h, and 24 h can be obtained, as shown in Figure 1.
The rainstorm goes through the interception of surface plants, soil infiltration, and overland flow on the slope, and finally forms a catchment and flows into the tailings pond, which will produce rainfall loss in each stage. In order to simplify the calculation, the rainfall loss is replaced by the average loss intensity μ to obtain the reasoning formula of rainstorm peak flow in the tailings pond:
Q m = 0.278 ( α μ ) F
where α—average rainfall intensity; F—drainage area; and μ—average loss intensity, which represents the sum of interception, infiltration, and other losses of rainfall.
(2) Calculation of storm water level of generalized model of tailings pond
The water level change of tailings ponds during rainstorm can be calculated according to the rainfall and watershed section. Due to the differences between various sections of the tailings pond, the section of tailings pond along the axis of the tailings pond is generalized as trapezoid, and the generalized trapezoid is used to calculate the water level. The shape information of n sections of tailings pond is collected, including bottom elevation h, bottom length l, and two waist inclination angles α1 and α2 of the trapezoidal section. The section can be generalized according to the collected data. The bottom elevation h is taken as an example to illustrate the detailed process of generalization. Assuming that the collected n elevation data are h1, h2, h3, ..., hm, and the number of occurrences of the same elevation hi is fj, the calculation formula of the weighted average is:
h = h i f j n
According to the h, l, α1, and α2 obtained by the weighted average method, the generalized model diagram of the tailings pond section can be drawn, as shown in Figure 2.
Taking the thickness of the generalized section as 1, the volume of the generalized section per unit thickness is V when the water depth is H. After taking out the water flow Qmi of the section, taking the thickness of the section as 1, and taking the calculation time as 1, then the volume and quantity of the section is equal to the value of Qmi.
Q m i = V = ( 2 l + H ( cos α 1 + cos α 2 ) ) 2 × H × 1
When the rainstorm flow Qm is known, the water level line position of the tailings pond can be calculated inversely according to the above formula. Furthermore, combined with the time parameters of rainfall process, the hydrological boundary conditions of tailings pond under rainstorm conditions can be determined by FLAC simulation software. This provides a basis for the stability analysis of tailings ponds under rainstorm.

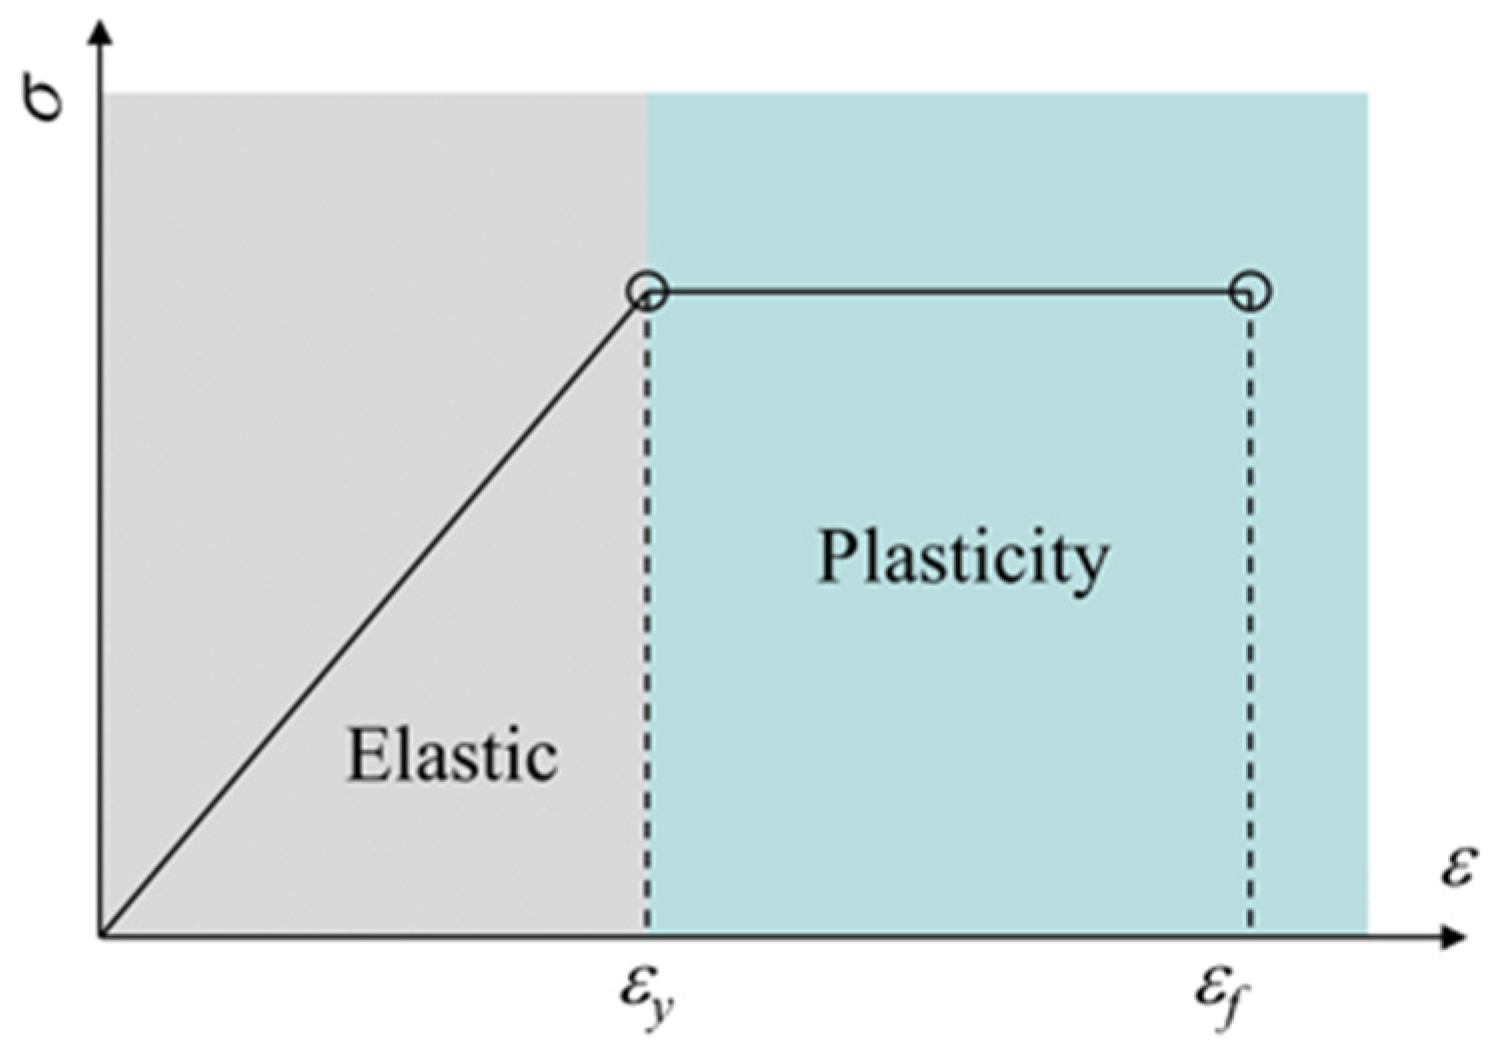
2.2. Solution of Potential Sliding Surface of Tailings Pond Slope by Limit Strain Method

(1) Limit strain criterion
The ultimate strain criterion is used to solve the potential sliding surface of tailings pond slope. Firstly, the concept and solution method of ultimate strain are described. It is assumed that the geotechnical material of the tailings pond slope is an ideal elastic-plastic model. When the external load continues to increase, the geotechnical material will first enter the elastic state, and with the continuous increase of the load, local yield will occur and enter the plastic state. The elastic state and yield state can be determined according to the yield criterion, but as for the geotechnical material, it still has a certain bearing capacity when it reaches the ultimate strain state after yield, and a certain stage of plastic development is required to cause damage, as shown in Figure 3.
In the stability analysis of tailings reservoir slope, the ultimate strain failure criterion can be expressed as: when the geotechnical material of tailings reservoir slope enters the plastic state and reaches the ultimate strain, the slope begins to undergo local point failure. When each local failure point of the tailings reservoir slope connects to form a penetrating limit strain failure area, the tailings reservoir slope will be destroyed as a whole along the sliding surface.
The limit strain is expressed as shear strain due to shear failure of soil mass on the tailings reservoir slope. In different numerical calculation software, shear strain has its own definitions. For example, in FLAC, J 2 is used to represent shear strain [14], where the expression of limit strain is:
J 2 f = ε 1 ε 3 3
In the elastic-plastic state, the values of ε1 and ε3 are difficult to solve directly. Therefore, parameters χ1 and χ3 are introduced based on the elastic strain state, which make it possible to:
χ 1 = ε 1 ε 1 y χ 3 = ε 3 ε 3 y
where ε1y—first elastic limit principal strain of unit and ε3y—third elastic limit principal strain of unit. They can all be solved according to the general Hooke’s law.
Elastic-plastic limit strain discrimination formula 10 is obtained after substitution. Based on the numerical simulation software method, the position and shape of potential sliding surface of tailings reservoir can be determined.
J 2 f = χ 1 ε 1 y χ 3 ε 3 y 3
(2) Numerical solution of potential sliding surface of tailings reservoir slope
In the general slope stability checking calculation of the tailings pond, the sliding surface can be set as two modes: random search or pre designation. The calculation results of slope stability are very different when the sliding surface is selected differently. It is an effective method to determine the stability of tailings pond slope by determining the sliding surface through numerical simulation software and calculating the safety factor of tailings pond slope. The above-mentioned limit strain method is based on the criteria derived from the characteristics of geotechnical materials and the ideal elastic-plastic model. Combined with the numerical calculation method, it can effectively solve the sliding surface of the tailings pond slope. By extracting the regional coordinates where the limit strain in the tailings pond numerical model reaches the critical threshold, and then inputting it into the slope limit equilibrium calculation program to specify the potential sliding surface, the internal relationship between the potential sliding surface of limit strain and the potential sliding surface of fixed value method can be realized. Figure 4 shows the process of solving the potential sliding surface by the limit strain method.
The analysis shows that the stability analysis of the tailings pond slope is a method of stability analysis based on the results of numerical simulation. The calculation of ultimate strain potential sliding surface belongs to numerical calculation results, and the stability checking calculation of tailings pond slope belongs to stability analysis. The two independent systems are connected through the potential sliding surface as a link. Therefore, the calculation and coordinate acquisition of potential sliding surface is an important link in the stability analysis of tailings pond slope. The limit sliding surface of tailings pond slope can be calculated by the function written in the built-in language of FLAC simulation software. Then, in the calculation of slope stability of tailings ponds under rainstorm conditions, the coordinate position of limit sliding surface will be extracted as potential sliding surface.

2.3. Monte Carlo Stochastic Expression and Reliability Solution of Geotechnical Parameters

Due to the randomness and uncertainty of geotechnical parameters, the parameter assignment in the actual calculation of tailings pond slope stability is a man-made determined value, which leads to a certain error in parameter selection. In order to eliminate the influence of subjective factors of geotechnical parameters, Monte Carlo parameter random sampling method is introduced to calculate the probability and statistics of parameters. When the number of random variables is enough, the accuracy of the calculation results of tailings pond slope stability can be guaranteed.
Monte Carlo parameter random sampling is a method to solve statistical problems based on computer technology. It uses a random sampling method to evaluate the occurrence probability of risk factors, which is suitable for calculating complex and uncertain problems. Aiming for the stability of the tailings pond slope, firstly, the limit state function of the tailings pond slope safety factor is established:
F = f (X1, X2, …, Xm) = 0
where X1, X2, ···, Xm is m independent random variables with certain distribution law, representing random variables related to geotechnical parameters of tailings pond slope, such as bulk density, internal friction angle, cohesion, pore water pressure, etc. According to statistics, most of these random variables obey normal distribution or lognormal distribution [17].
Randomly select n identically distributed variables x1, x2, ···, xn from the geotechnical parameter sample Xi, and substitute each variable into formula 11 to obtain a random safety factor Fi. After N repeated calculations to meet the expected accuracy requirements, the random numbers F1, F2, ···, Fn of N mutually independent safety factors can be obtained. Since the ultimate instability state of tailings pond slope is F = 0, if there are M random numbers of safety factor F ≤ 0 in N sampling calculations, the failure probability Pf of tailings pond slope is:
Pf = P (F ≤ 0) = M/N
When M is large enough, the distribution function of slope safety factor of the tailings pond can be accurately obtained from the statistical samples F1, F2, ..., Fn of geotechnical parameters, and the mean value Fμ of slope safety factor is:
F μ = 1 n i = 1 n F i
The corresponding standard deviation Fσ is:
F σ = [ 1 n 1 i = 1 n ( F i F μ ) 2 ] 1 2
Therefore, the slope reliability Fβ of tailings ponds can be determined by the following formula.
F β = F μ 1 F σ
Monte Carlo parameter random sampling method is a computer random sampling method. Therefore, in the limit equilibrium analysis method, the selection of geotechnical parameters is completed by a computer; that is, the random sampling, automatic input, automatic solution, automatic solution, and automatic statistical results of geotechnical parameters can be carried out by a computer.
The specific steps are as follows: Firstly, according to the field test and indoor test results, the geotechnical parameters are randomly sampled based on the Monte Carlo random parameter calculation code compiled by MATLAB software. The calculated parameters will be input into FLAC simulation software as variables to solve the potential sliding surface. Secondly, the random sampling of geotechnical parameters is carried out again to calculate the reliability, and the calculation is stopped until the sampling times reach the set calculation times. Finally, the safety instability times of tailings pond slope will be counted, and the stability of tailings pond slope will be analyzed through the results of reliability Fβ and failure probability Pf.

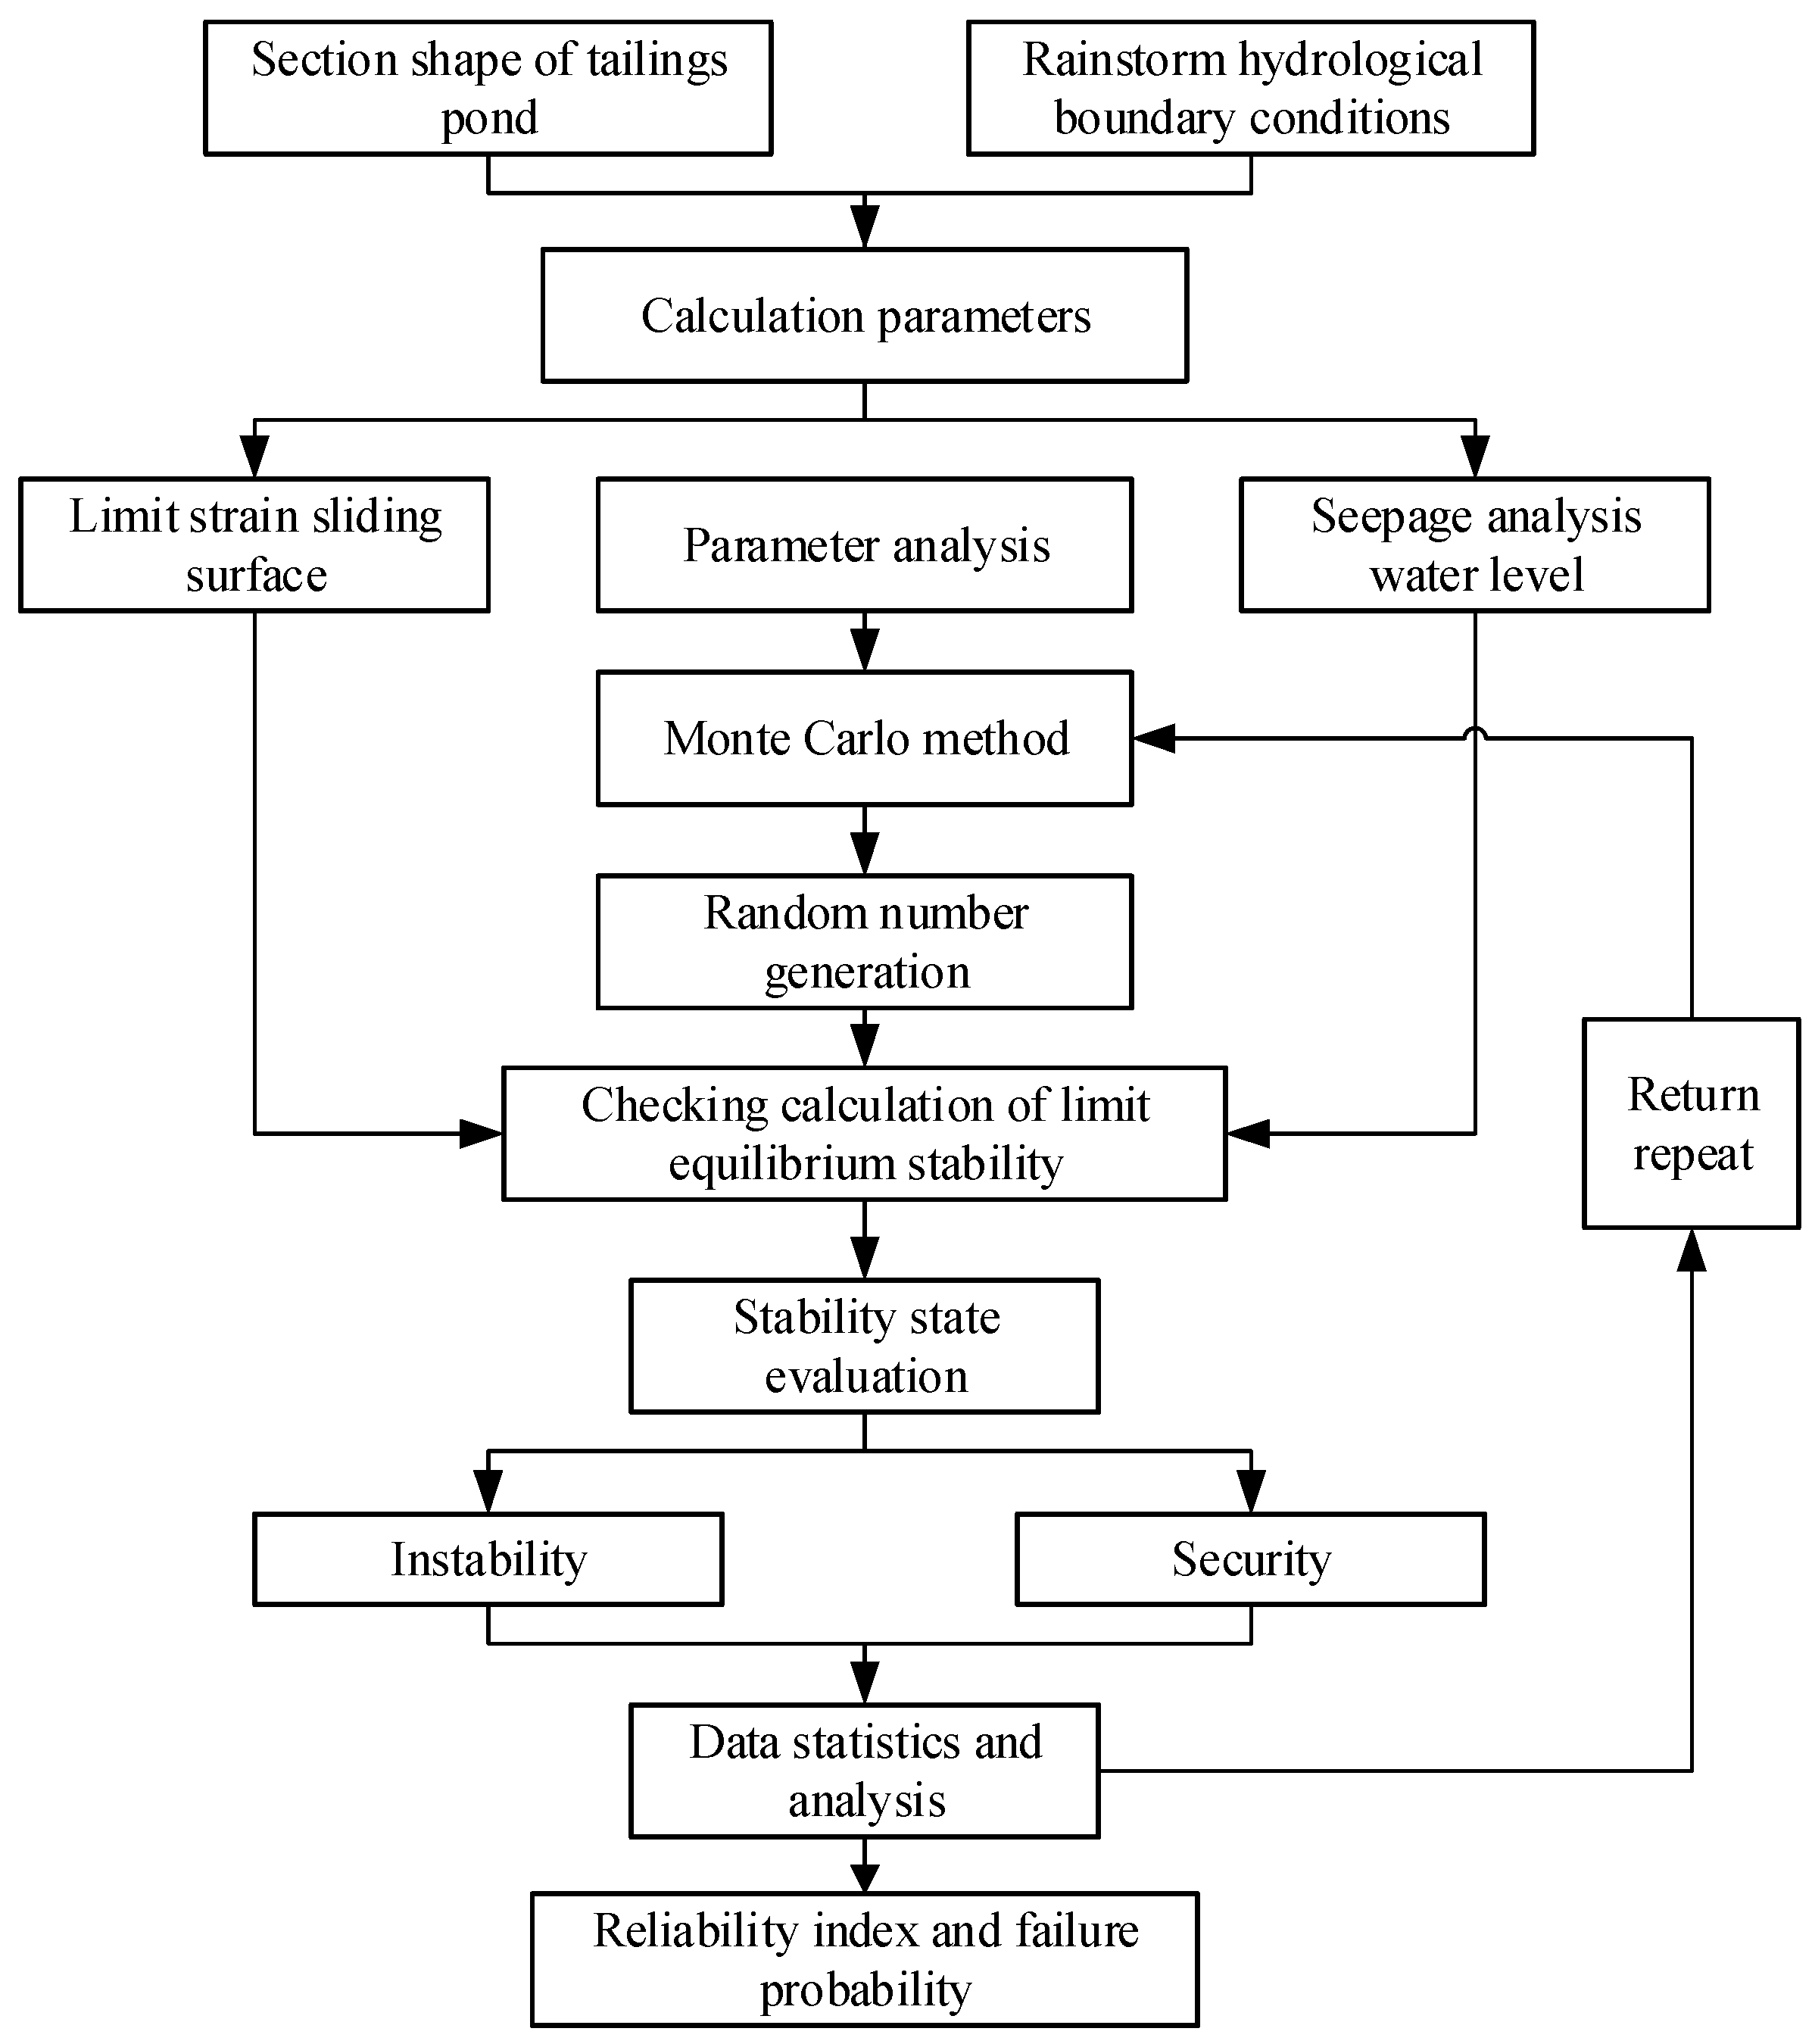
2.4. Ultimate Strain Monte Carlo Reliability Analysis Method

The ultimate strain Monte Carlo reliability analysis method combines the solution of the ultimate strain sliding surface with the random sampling method of Monte Carlo parameters. In order to analyze the stability of the tailings pond slope under rainstorm, the rainfall hydrological boundary is introduced into the tailings pond calculation model. The specific process is shown in Figure 5.
Figure 5 is the flow chart of limit strain Monte Carlo reliability analysis. According to the analysis, the stability analysis of the tailings pond slope under rainstorm can be summarized into the following five steps:
① Solution of potential sliding surface and water level line of tailings pond slope.
② Processing of geotechnical parameters and extraction of coordinate data of sliding surface and water level line.
③ Establishment of reliability analysis model of tailings pond slope.
④ Random repeated sampling and reliability solution of geotechnical parameters.
⑤ Statistics of calculation results and stability analysis of the tailings pond slope.

3. Field Case Analysis

The stability calculation of a tailings pond project under rainstorm conditions is selected; the water level line, potential sliding surface, and reliability index of the tailings pond during rainstorm are analyzed; and the stability of the tailings pond under rainstorm conditions is determined, so as to provide theoretical support and prediction warning for the safe operation of the tailings pond.

3.1. Rainfall Slope Model and Parameter Setting of Tailings Pond

3.1.1. Model Establishment

The three-dimensional geological numerical calculation model is established according to the site topography. The parameters are selected according to the site survey results and the original design parameters. The Mohr Coulomb constitutive model is adopted. The boundary is divided into displacement boundary, rainfall boundary, and stress boundary. The calculation model used is divided into two models: finite difference model and reliability calculation model. The finite difference numerical model is a three-dimensional geological model, and the reliability calculation model adopts the most dangerous section of the results of the three-dimensional geological calculation model.
① Finite difference geological model
The numerical calculation model consists of three parts: initial dam, tailings sand, and bedrock. The model size is selected according to the actual measurement size. The established model contains 227,580 units in total (Figure 6a).
② Reliability calculation model
The reliability calculation object is the two-dimensional section of the results of the three-dimensional geological model; that is, the plane strain model is used for calculation. In the numerical model, the section of the dam center line of the tailings pond is taken as the calculation section (Figure 6b).

3.1.2. Model Parameters and Rainfall Boundary Conditions

① Model parameters and boundary conditions
The horizontal displacement of four planes of bedrock in the numerical model is constrained, the total displacement of the bottom of bedrock is constrained, and the top surface is a free boundary. The ideal elastic-plastic model is adopted in the numerical calculation model, and the shear modulus and bulk modulus are converted by elastic modulus. The cohesion and friction angle of the calculation model are set in zones above and below the water level line, and the parameters are selected as the mean value of the experimental measurement. The calculation model does not need to set the randomness of parameters. The model parameters are shown in Table 1.
In the numerical model, seepage calculation is the key to the rainfall boundary of tailings pond. The measured permeability coefficient of the initial dam of tailings pond is 4.45 × 10⁻⁵ m/s, but actually a water barrier will be set in the initial dam. Therefore, the permeability coefficient of the initial dam is taken as four orders of magnitude smaller, so the permeability coefficient of the initial dam is taken as 4.45 × 10⁻⁹ m/s, the permeability coefficient of tailings sand is 1.82 × 10⁻⁵ m/s, and the permeability coefficient of bedrock is 1 × 10⁻⁸ m/s. In order to facilitate calculation, the porosity of the sub dam and tailings sand is uniformly taken as 0.5, and the porosity of bedrock is taken as 0.45.
The probability density function expressed by mean and standard deviation is used to reflect the randomness of tailings parameters. Calculate the sliding surface and select the potential sliding surface in the numerical simulation. The water level line is the interface where the pore water pressure is 0 in the numerical calculation results.
② Rainfall parameters and boundary conditions
According to the analysis method of rainfall model, the rainstorm parameters and boundary conditions required by tailings pond slope model can be calculated.
(1) Rainstorm parameters
According to the hydrogeological manual of the study area, the hydrological parameters of the tailings pond area are as follows: the drainage area is 7.4 km2, the length of the main ditch is 1.1 km, the average slope is 11.66°, the variation coefficient Cv = 0.575, and the skewness coefficient Cs = 3.5Cv. The rainstorm calculation formula is:
q = 986 ( 1 + 0.932 lg P ) ( t + 5.725 ) 0.595
where: P—design return period (y); q—rainstorm intensity (L·s−1·hm−2); and t—rainfall duration (min).
According to the above calculation formula, the design rainstorm value in the study area can be calculated. Short rainfall duration is defined as 1 h, 2 h, and 3 h, and the long rainfall duration is taken as 24 h. The results of rainstorm volume are calculated according to the formula (Table 2).
(2) Rainstorm boundary conditions
Considering the calculation time and rainstorm amount of the model, the rainstorm rainfall with a calculation cycle of 100 years and a return period of 3 h (180 min) is selected for calculation. The rainfall distribution results of the 3 h rainfall process in the study area can be obtained by bringing the 3 h rainstorm amount into the typical rainfall time history distribution proportion (Table 3). In the numerical calculation model, the application position of water pressure generated by rainstorm is determined according to the water level height in the table.
The numerical simulation selects the rainstorm with a return period of 100 years and 3 h as the calculation standard. The solution results are saved every 30 min, and then the reliability analysis is carried out.

3.2. Stability Analysis of Tailings Pond under Rainstorm

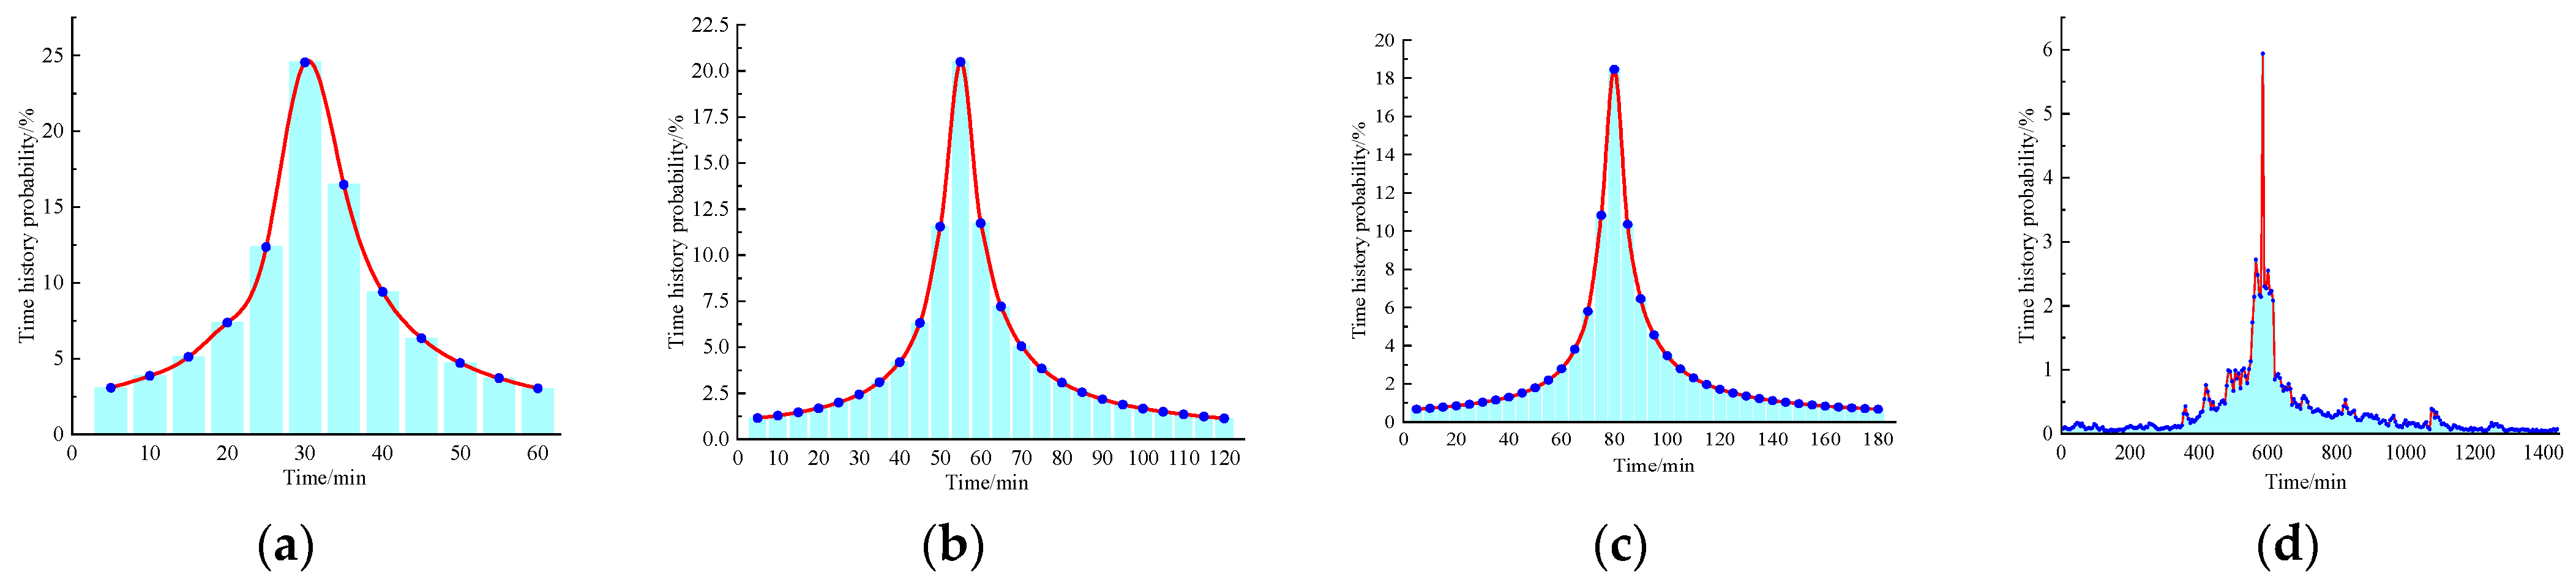
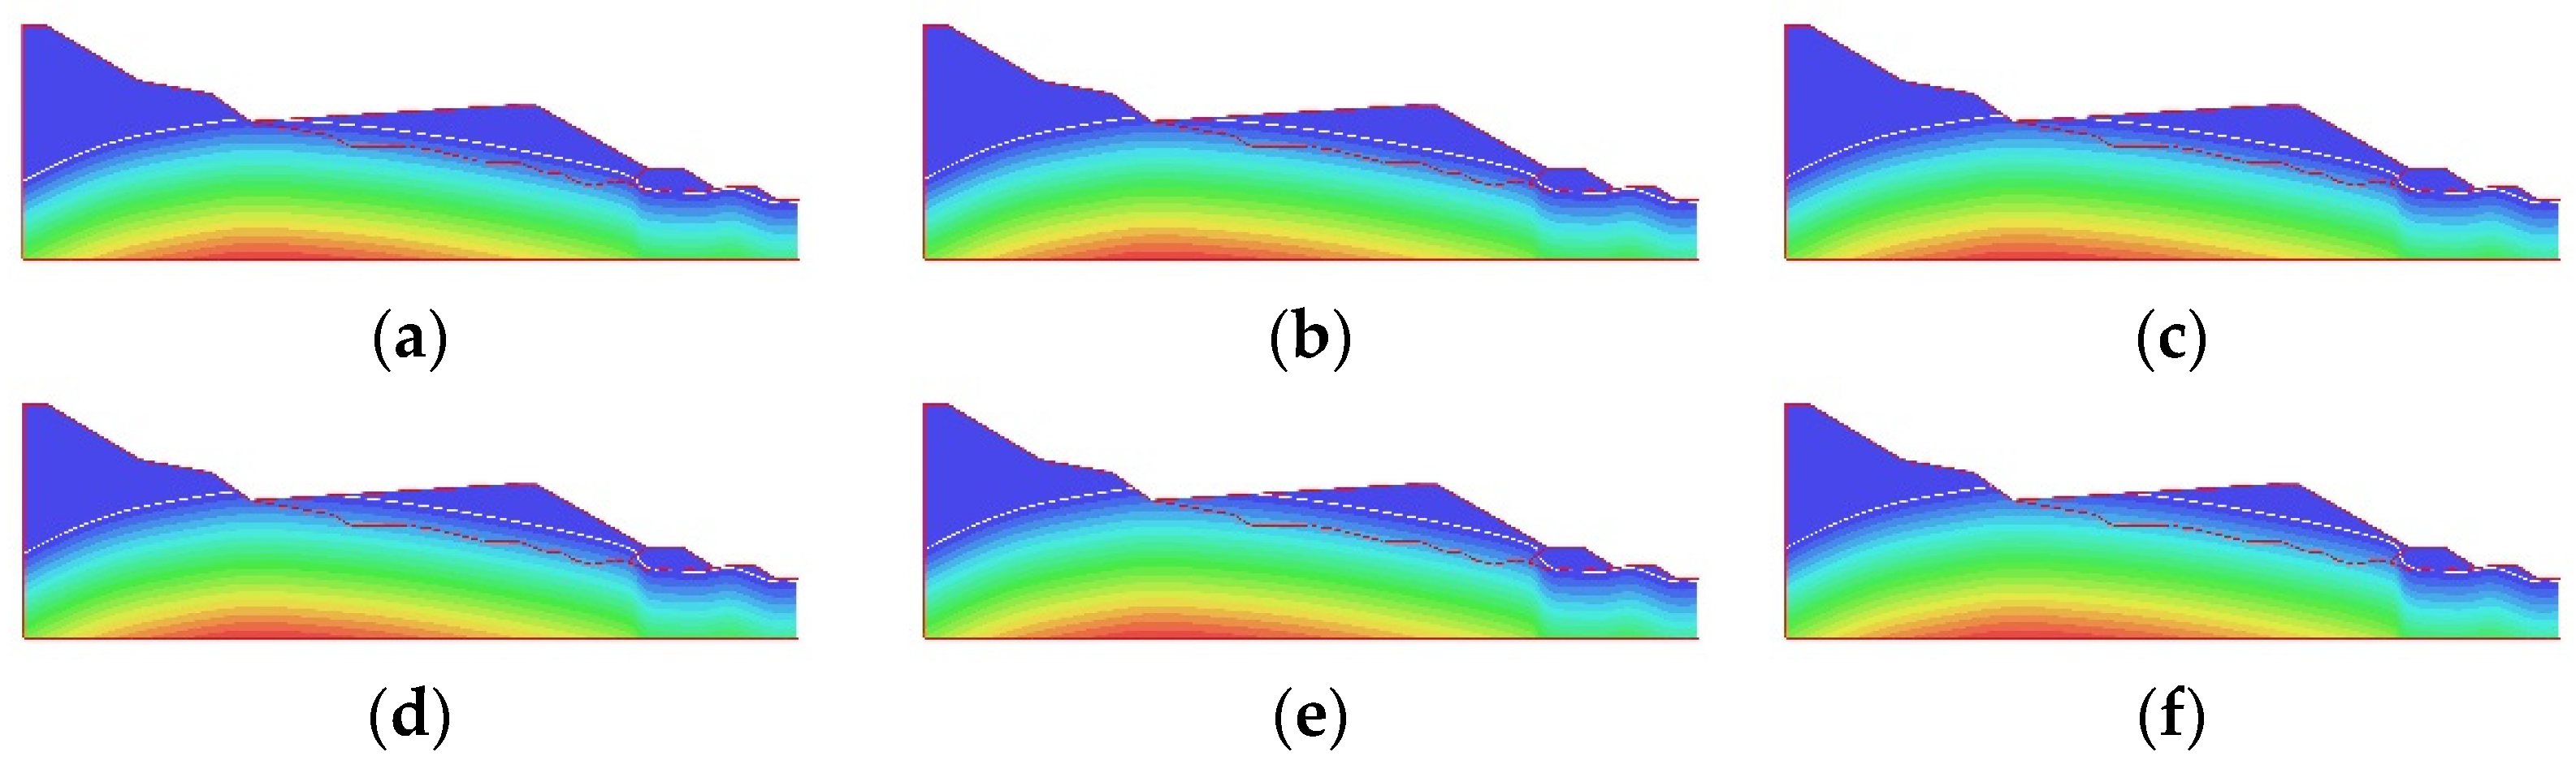
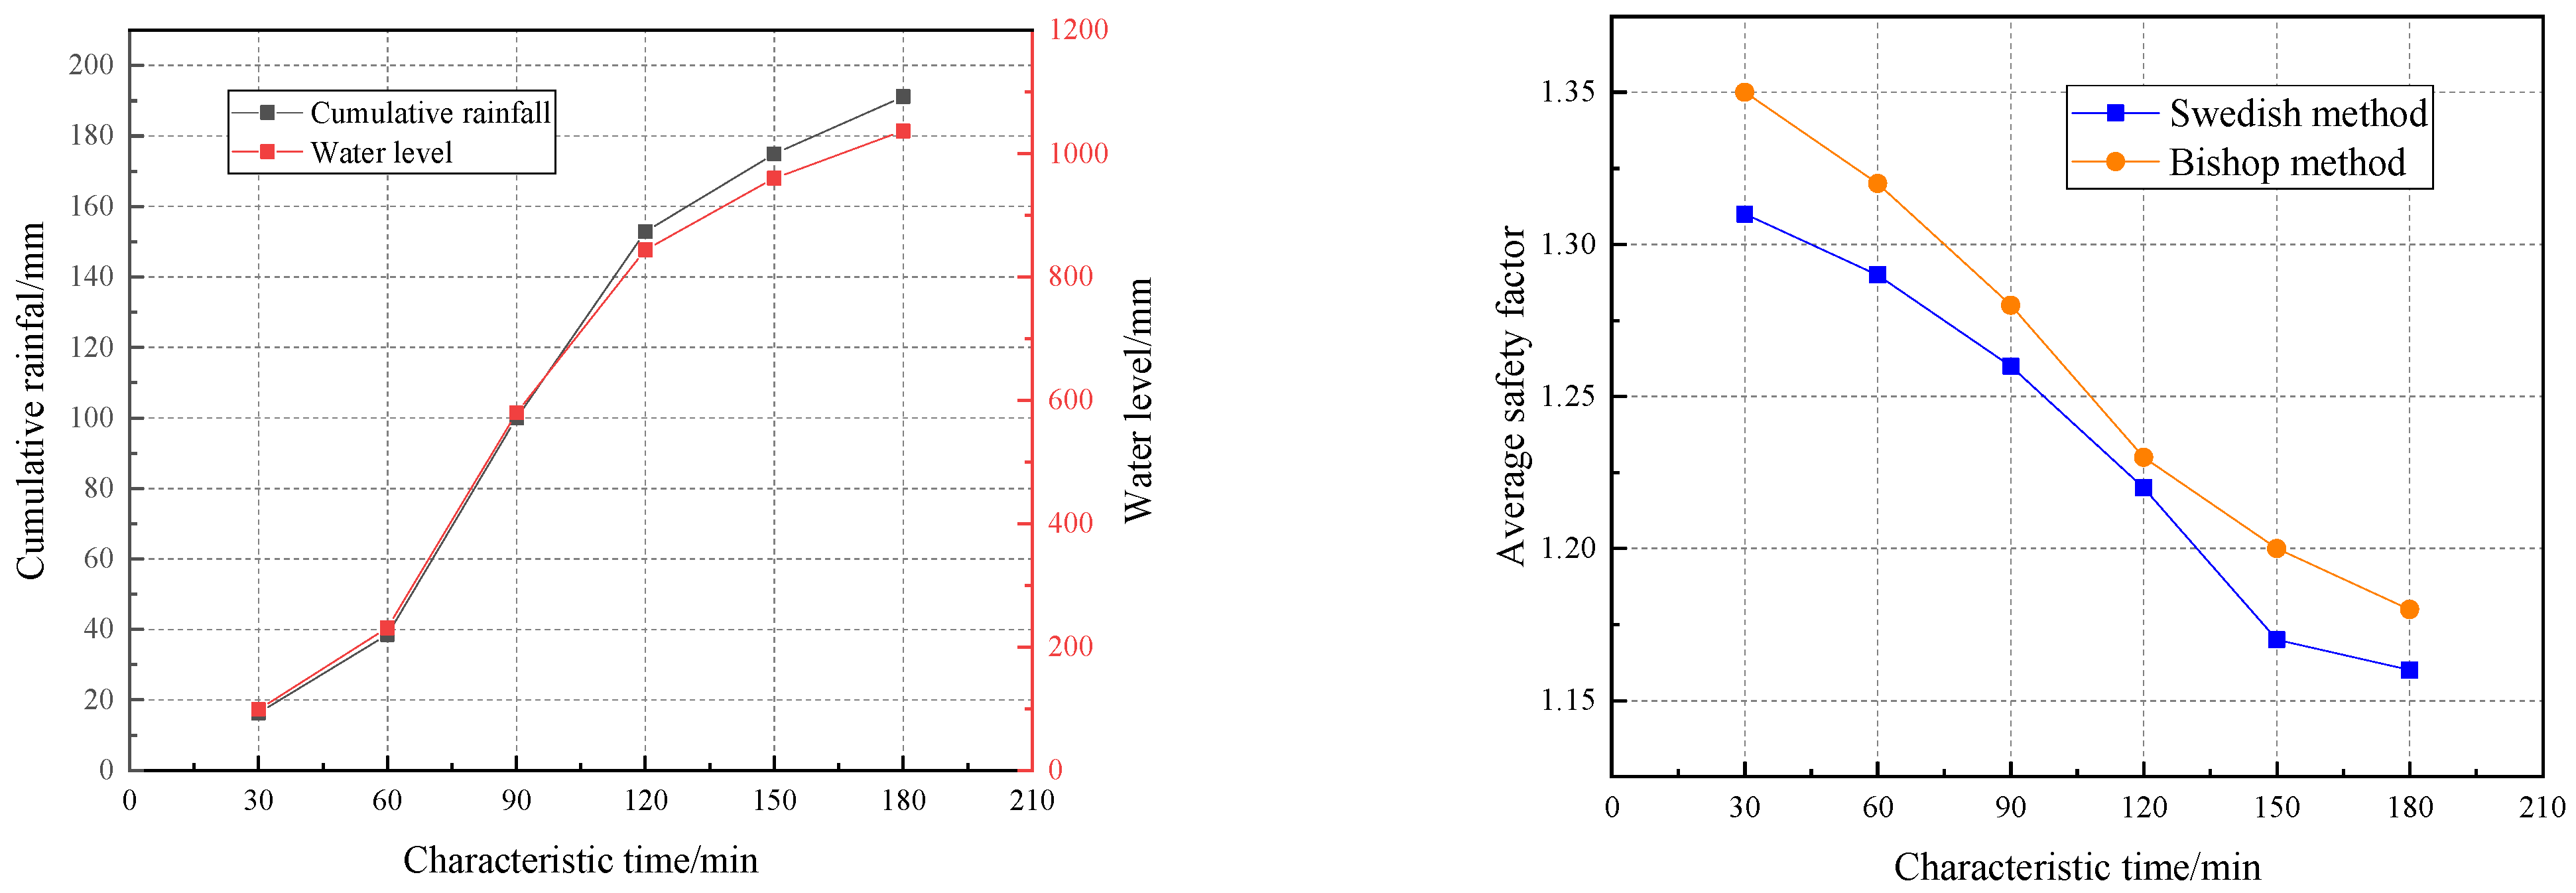
3.2.1. Water Level Line Calculation

According to the stability analysis process of tailings pond, the water level line of tailings pond is calculated first. In the numerical calculation software, the seepage calculation results of the calculation section are obtained in the form of slices. In order to clearly express the change law of water level line in the process of rainfall, the position coordinates of water level line are displayed and extracted through the built-in programming language of the software. Figure 7 shows the calculation results of water level line, in which the white curve is the position of water level line.
According to the calculation results in Figure 7, the water level line in the tailings pond shows an upward trend with time, and the water level line in the bedrock also shows an upward trend with time. It is found that the change of water level line in the dam and bedrock lags behind the change of boundary water level line. The change of water level line at tailings dam is more severe than that of bedrock, and the relationship between the height of water level line and seepage parameters is obvious. The water level lines of all calculation time nodes are smooth curves, and the seepage process develops from the hydrological boundary to both ends. At the left end of the hydrological boundary, the water level line is a convex and smooth curve, and this water level line decreases slowly from the hydrological boundary line to the left. At the right end of the hydrological boundary, the shape of the water level line is similar to the undulating state of the topographic line. The water level line is first a convex and smooth curve, becomes a concave curve at the initial dam, and turns into a convex and smooth curve after the initial dam goes to the right.

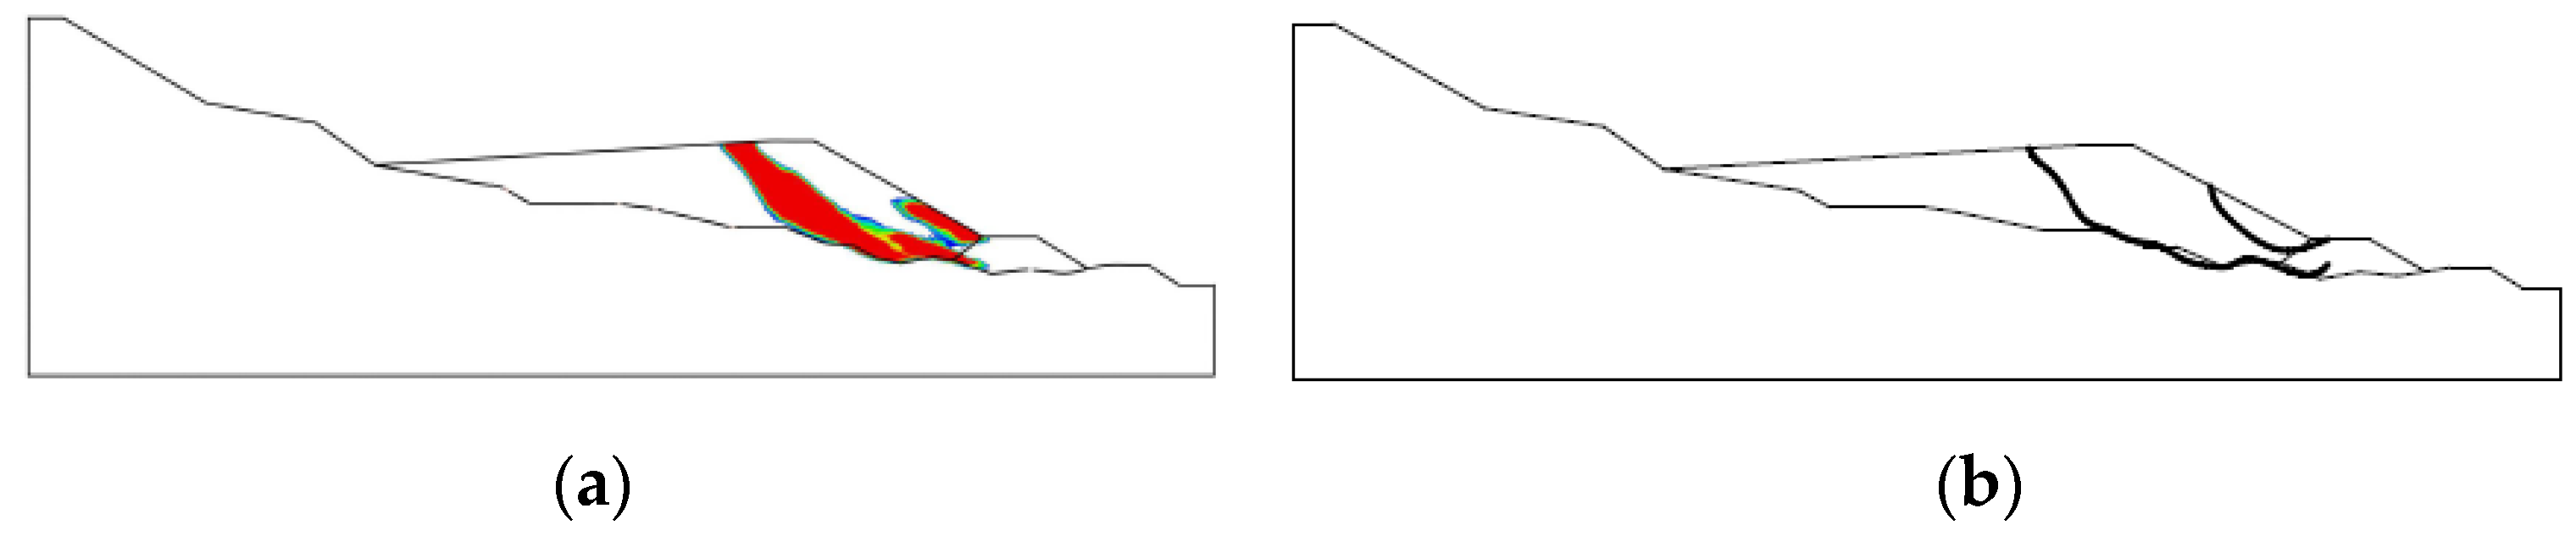
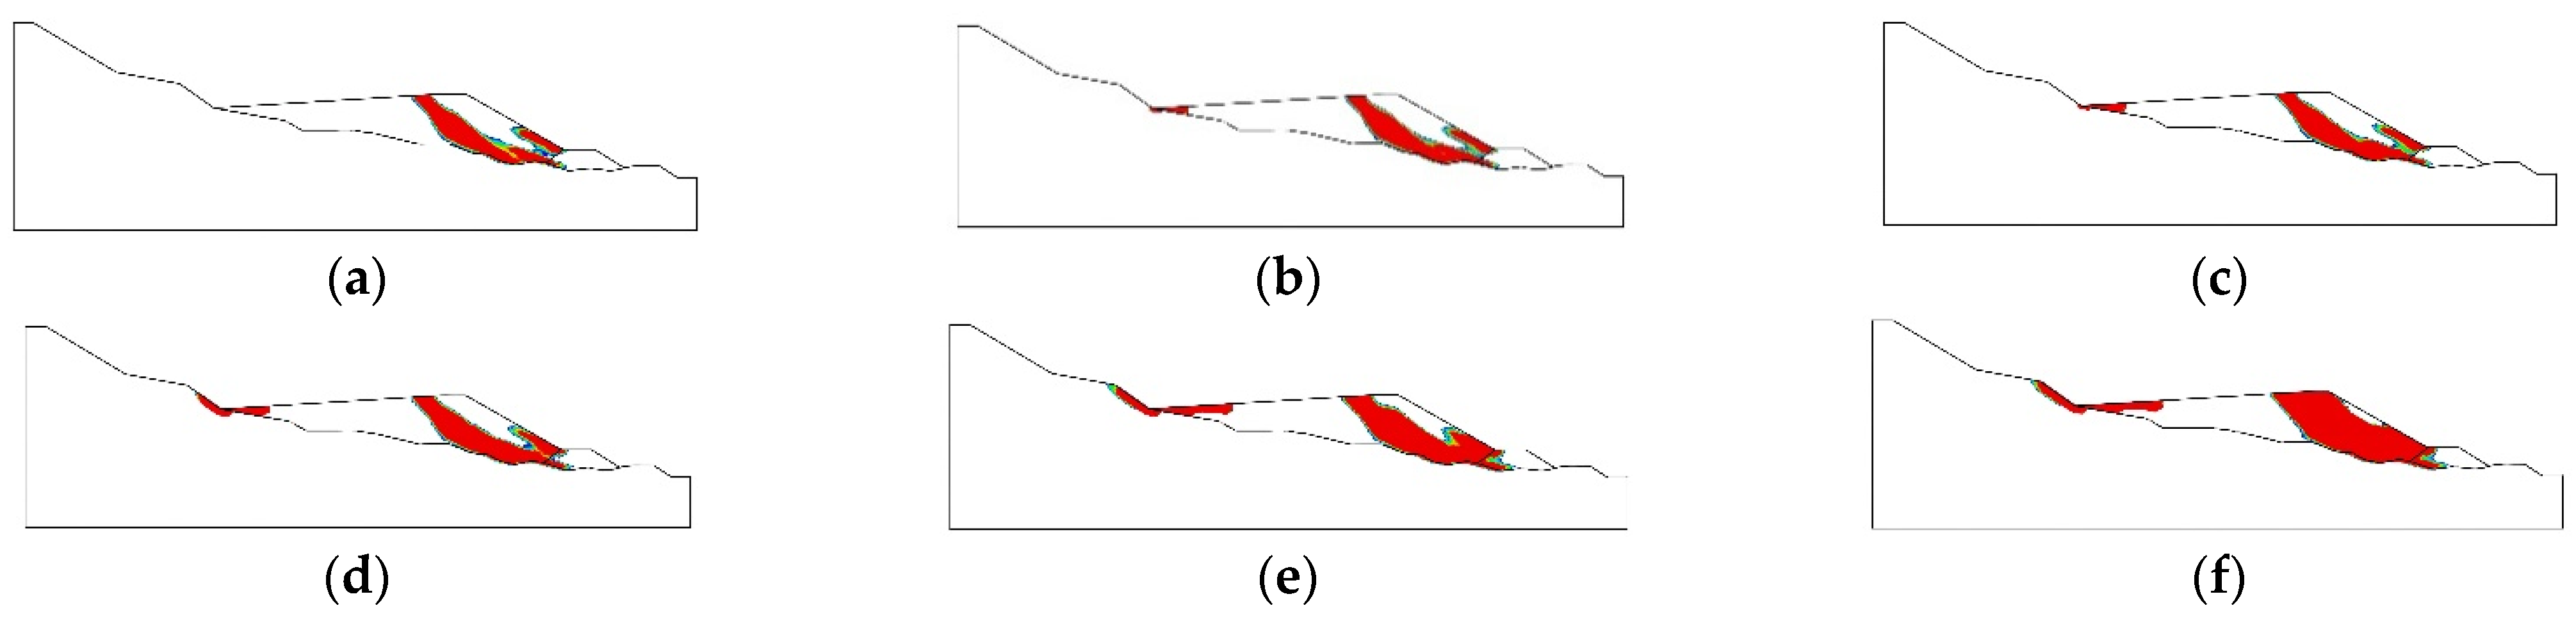
3.2.2. Potential Sliding Surface Solution

Close the seepage module of the water level line calculation model of each characteristic time node and calculate the instability of the sliding surface. Similarly, the calculation results of the sliding surface of the characteristic calculation section are displayed and analyzed in the form of slices. In the calculation results, the black curve is used to represent the grouping boundary of the model, and the color part is the shape of the sliding surface. In the calculation results of the sliding surface, the light color indicates that the area is being damaged, the dark color indicates that the area has been damaged, and the white area has not been damaged (Figure 8).
According to the results shown in Figure 8, the calculation results of the potential sliding surface of the tailings pond slope are not the standard circular arc sliding surface, and the shape of the sliding surface in the part where the tailings pond is in contact with the bedrock is close to the shape of the bedrock. At the back end of the initial dam, the sliding surface extends into the initial dam. Similarly, this part of the sliding surface changes close to the topographic line of the bedrock. The sliding surface extends to the dam crest after being separated from the bedrock, and the shape of this part of the potential sliding surface is nearly linear. On the whole, the potential sliding surface of tailings pond obtained from the solution is similar to circular arc sliding. From the beginning of rainfall to 90 min (Figure 8a–c), the potential sliding surface of tailings pond is two parts, while after the characteristic time is 120 min (Figure 8d), the potential sliding surface evolves from two to one and integrates into one. With the continuous evolution of rainfall process, affected by the expansion of water level line and the gradual increase of tailing sand parameter softening area, the failure area of tailing pond slope is also expanding, but the position change of potential sliding surface is small.
In addition, there is also a sliding surface at the tail of the tailings pond. Even if sliding occurs, it has little impact on the overall stability of the tailings pond, which can be ignored here.

3.2.3. Reliability Calculation

The reliability is calculated according to the solution results of water level line and potential sliding surface. The lower edge of the whole potential sliding area is selected as the sliding surface, and the geotechnical parameters of the tailings pond slope are randomly sampled by Monte Carlo method. The sampling times are 8000 times. After sorting, the weighted average safety factor Fμ, reliability index Fβ, and failure probability Pf of 6 characteristic time nodes can be obtained.
According to the requirements of the stability checking code of tailings pond, Sweden method and Bishop method are selected to analyze the stability of tailings pond. Table 4 shows the reliability calculation results of tailings pond.
Through the analysis of Table 4, it is concluded that the results calculated by the Bishop calculation method are more conservative than those calculated by the Sweden method. When the characteristic time is 180 min, the average safety factor of the Sweden method is 1.16, and the average safety factor of the Bishop method is 1.18. The calculated values are greater than the minimum requirement value of 1.15 under rainstorm conditions. However, the risk of instability and failure of tailings pond slope in continuous rainstorm is still high [26]. From the whole rainfall process, the failure probability of tailings pond under short-term rainstorm of 30 min is 0.82% and 0.64% respectively, while the failure probability under rainstorm of 180 min increases by 1.71% and 1.37%. The significant increase of failure probability indicates that rainstorm has a great impact on the stability of tailings pond. Under the condition of heavy rainfall, targeted measures need to be taken to improve the stability of tailings ponds.
In order to visually display the change law of the calculation results of characteristic time nodes, the tabular data are drawn as shown in Figure 9. With the increase of rainstorm time, the reliability index of tailings pond gradually decreases. After 60 min of rainstorm, the safety factor decreases sharply, and after 150 min of rainstorm, the safety factor decreases slowly and tends to be stable, while the safety factor changes little at the beginning and end of the rainstorm.
Generally speaking, the changes of the average safety factor and failure probability of tailings ponds in the rainfall process are nonlinear, but they all show the trend of slow change in the initial stage and later stage and sharp change in the medium term, which is consistent with the change trend of cumulative rainfall and water level line. The reliability index and the commonly used safety factor are unified in judging the stability of tailings pond, and their drastic changes are concentrated in the middle of rainfall. Therefore, the middle of rainfall is the key node affecting the stability design of tailings ponds.

4. Discussion

In fact, the ultimate strain Monte Carlo reliability analysis method proposed in this paper is an extension of the traditional slope stability calculation method. Through the results of the case, we can find that the changes of the average safety factor and failure probability of tailings ponds in the rainfall process are nonlinear, but they all show the trend of slow change in the initial and later stages and sharp change in the medium term, which is unified with the change trend of cumulative rainfall and water level. At the same time, the reliability index and the commonly used safety factor are unified in judging the stability of tailings ponds, and their drastic changes are concentrated in the middle of rainfall. Therefore, the middle of rainfall is the key node affecting the stability design of tailings pond. Although the calculated results have been effectively verified, the research object of this paper is only a tailings pond slope with good safety, and there is no case analysis of tailings pond slope instability caused by rainfall. Therefore, more case analysis is needed in the follow-up research to support the rainfall slope stability analysis method proposed in this paper.

5. Conclusions

This paper studies the stability of a tailings pond by using the principle of hydrogeology, the theory of elastic-plastic mechanics, the idea of limit equilibrium, and probability analysis model, and puts forward the limit strain Monte Carlo reliability analysis method. At the same time, the stability of tailings ponds under rainstorm is analyzed through field cases. The main conclusions are as follows:
  • The conclusion of the limit strain Monte Carlo reliability analysis method of tailings pond are: Based on the analysis of hydrogeological rainstorm, the calculation method of trapezoidal generalized section water level in the flood process of tailings pond is proposed, and the rainfall boundary for the stability calculation of tailings pond in rainstorm area is obtained. Taking the limit strain as the criterion, the solution method of potential sliding surface of tailings pond is put forward, which is verified and analyzed by different criteria and experiments. Monte Carlo parameter randomness sampling method is used to deal with the randomness of geotechnical parameters.
  • Through the analysis of the numerical simulation results in the case, it is found that the water level line in the tailings pond shows an upward trend with time, and the water level line in the bedrock also shows an increasing trend with time. The shape of the sliding surface of the part of the tailings pond in contact with the bedrock is close to that of the bedrock. With the continuous evolution of rainfall process, affected by the expansion of water level line and the gradual increase of tailing sand parameter softening area, the failure area of tailing pond slope is also expanding, but the position change of potential sliding surface is small.
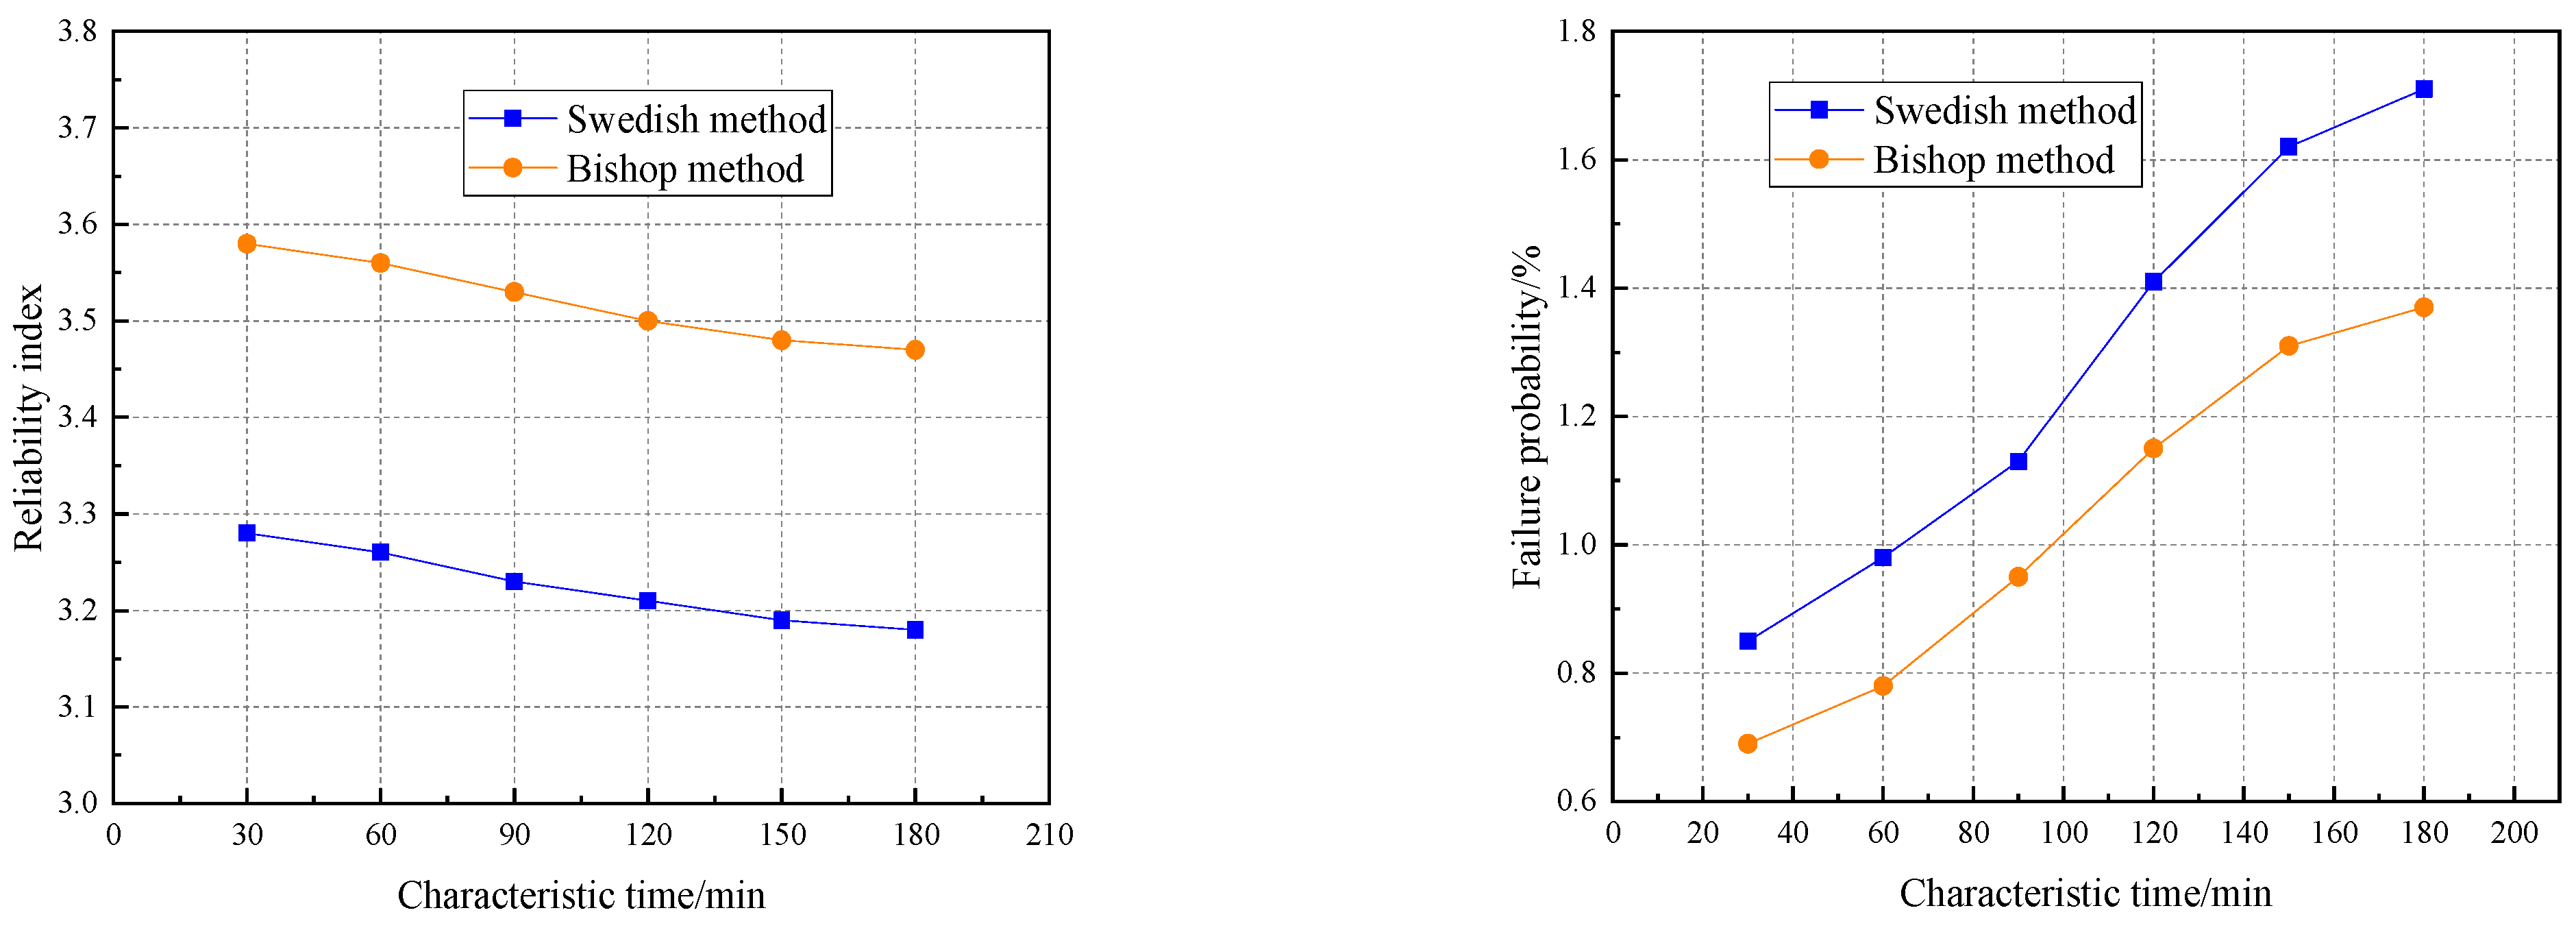
  • The stability of the tailings pond under the 180 min rainstorm with a return period of 100 years is analyzed, and the solution shows that the average safety factor of the tailings pond in the calculation example is 1.16 and 1.18, which meets the requirements of the rainstorm working condition specification. The failure probability of the whole rainfall process increases from 0.82% and 0.64% to 1.71% and 1.37%, and the failure probability of rainfall completion is more than doubled. The reliability index and the commonly used safety factor are unified in judging the stability of the tailings pond, and their drastic changes are concentrated in the middle of rainfall. Therefore, the middle of rainfall is the key node affecting the stability design of tailings ponds.

Author Contributions

Conceptualization, B.L.; methodology, J.J.; formal analysis, B.G.; data curation, Z.Y.; writing—original draft preparation, P.W. and K.Z. All authors have read and agreed to the published version of the manuscript.

Funding

This research was funded by the National Natural Science Foundation of China (52074143, 51974145, 51774165), and the National Key Research and Development Program of China (2018YFC0604705).

Institutional Review Board Statement

Not applicable.

Informed Consent Statement

Informed consent was obtained from all subjects involved in the study.

Data Availability Statement

The data presented in this study are available in the article itself.

Conflicts of Interest

The authors declare no conflict of interest.

References

  1. World Information Service on Energy. Available online: https://www.wise-uranium.org/mdaf.html (accessed on 24 February 2022).
  2. Santamarina, J.C.; Torres-Cruz, L.A.; Bachus, R.C. Why coal ash and tailings dam disasters occur. Science 2019, 364, 526–528. [Google Scholar] [CrossRef] [PubMed]
  3. Lyu, Z.J.; Chai, J.R.; Xu, Z.G.; Qin, Y.; Cao, J. A comprehensive review on reasons for tailings dam failures based on case history. Adv. Civ. Eng. 2019, 9, 1–18. [Google Scholar] [CrossRef]
  4. Dai, H.; Qin, W.X.; Zhang, Y.A. Law of the Valley type tailings dam saturation line evolution under intensive rainfall. Metal Mine 2013, 445, 149–152. [Google Scholar]
  5. Dong, L.J.; Deng, S.J.; Wang, F.Y. Some developments and new insights for environmental sustainability and disaster control of tailings dam. J. Clean. Prod. 2020, 269, 122270. [Google Scholar] [CrossRef]
  6. Rotta, L.H.S.; Alcantara, E.; Park, E.; Negri, R.G. The 2019 Brumadinho tailings dam collapse: Possible cause and impacts of the worst human and environmental disaster in Brazil. Int. J. Appl. Earth Obs. Geoinf. 2020, 90, 102119. [Google Scholar] [CrossRef]
  7. Glotov, V.E.; Chlachula, J.; Glotova, L.P.; Little, E. Causes and environmental impact of the gold-tailings dam failure at Karamken, the Russian Far East. Eng. Geol. 2018, 245, 236–247. [Google Scholar] [CrossRef]
  8. Coulibaly, Y.; Belem, T.; Cheng, L.Z. Numerical analysis and geophysical monitoring for stability assessment of the Northwest tailings dam at Westwood Mine. Int. J. Min. Sci. Technol. 2017, 27, 701–710. [Google Scholar] [CrossRef]
  9. John, H.S. Estimating Slope Stability Reduction due to Rain Infiltration Mounding. J. Geotech. Geoenviron. Eng. 2006, 132, 1219–1228. [Google Scholar]
  10. Gui, R.; He, G.C. The Effects of Internal Erosion on the Physical and Mechanical Properties of Tailings under Heavy Rainfall Infiltration. Appl. Sci. 2021, 11, 9496. [Google Scholar] [CrossRef]
  11. Sun, Y.; Gu, X.W.; Xu, X.C. Experimental Study on Hydraulic Erosion Characteristics of Ecological Slope of Tailings Reservoir under Rainfall. KSCE J. Civ. Eng. 2021, 25, 2426–2436. [Google Scholar] [CrossRef]
  12. Wei, Z.A.; Yang, Y.H.; Zhao, H.J.; Chen, Y.L. Stability of tailings dam of Xiaodae tailings pond. J. North. Univ. 2016, 37, 589. [Google Scholar]
  13. Sitharam, T.G.; Hegde, A. Stability analysis of rock-fill tailing dam: An Indian case study. Int. J. Geotech. Eng. 2017, 11, 332–342. [Google Scholar] [CrossRef]
  14. Do, T.M.; Laue, J.; Mattsson, H.; Jia, Q. Numerical Analysis of an Upstream Tailings Dam Subjected to Pond Filling Rates. Appl. Sci. 2021, 11, 6044. [Google Scholar] [CrossRef]
  15. Hu, W.; Xin, C.L.; Li, Y.; Zheng, Y.S.; Asch, T.W.J.; McSaveney, M. Instrumented flume tests on the failure and fluidization of tailings dams induced by rainfall infiltration. Eng. Geol. 2021, 294, 106401. [Google Scholar] [CrossRef]
  16. Kong, X.Y.; Wang, G.J. Experiment Research on the Reinforced Triaxial Compression of Tailings Material and Infiltration Rainfall of Tailings Dam. J. Comput. Theor. Nanosci. 2016, 13, 6419–6423. [Google Scholar]
  17. Wang, G.J.; Yang, S.; Kong, X.Y.; Tang, Y.J. Study on the process and mechanism of indoor overtopping dam-failure of tailings dam model experiment under the rainfall. Meas. Control. 2016, 77, 86–97. [Google Scholar]
  18. Hanson, G.J.; Cook, K.R.; Hunt, S.L. Physical modeling of overtopping erosion and breach formation of cohesive embankments. Trans. ASAE 2005, 48, 1783–1794. [Google Scholar] [CrossRef]
  19. Zhang, C.; Chai, J.; Cao, J.; Xu, Z.G.; Qin, Y.; Lv, Z.J. Numerical Simulation of Seepage and Stability of Tailings Dams: A Case Study in Lixi, China. Water 2020, 12, 742. [Google Scholar] [CrossRef] [Green Version]
  20. Bu, L.; Zhou, H.M.; Li, C.H. Three-dimensional stability analysis of fine grained tailings dam with complex terrain by means of up-stream method. Electron. J. Geotech. Eng. 2016, 21, 3905–3920. [Google Scholar]
  21. Supandi. The Influence of Water Balance for Slope Stability on the High Mine Waste dump. Geotech. Geol. Eng. 2021, 39, 5253–5266. [Google Scholar] [CrossRef]
  22. Naeini, M.; Akhtarpour, A. Numerical analysis of seismic stability of a high centerline tailings dam. Soil Dyn. Earthq. Eng. 2018, 107, 179–194. [Google Scholar] [CrossRef]
  23. Hu, S.H.; Chen, Y.F.; Liu, W.; Zhou, S.; Hu, R. Effect of seepage control on stability of a tailings dam during its staged construction with a stepwise-coupled hydro-mechanical model. Int. J. Min. Reclam. Environ. 2015, 29, 125–140. [Google Scholar] [CrossRef]
  24. Wang, G.J.; Kang, J.W.; Du, C.; Tang, Y.J. Study on tailings dam over-topping failure model test and break mechanism under the rainfall condition. Teh. Vjesn. 2017, 24, 1897–1904. [Google Scholar]
  25. Wang, G.J.; Tian, S.; Hu, B.; Kong, X.Y.; Chen, J. An experimental study on tailings deposition characteristics and variation of tailings dam saturation line. Geomech. Eng. 2020, 23, 85–92. [Google Scholar]
  26. Sun, G.H.; Yang, Y.T.; Cheng, S.G.; Zheng, H. Phreatic line calculation and stability analysis of slopes under the combined effect of reservoir water level fluctuations and rainfall. Can. Geotech. J. 2017, 54, 631–645. [Google Scholar] [CrossRef] [Green Version]
  27. Zhang, C.; Liu, H.M.; Yang, C.H.; Wu, S.W. Mechanical characteristics of non-saturated tailings and dam stability. Int. J. Min. Reclam. Environ. 2017, 31, 530–543. [Google Scholar] [CrossRef]
  28. Jin, J.X.; Qin, Z.F.; Lv, X.L.; Liu, T.; Zhang, G.S.; Shi, J.Y. Rheology control of self-consolidating cement-tailings grout for the feasible use in coal gangue-filled backfill. Constr. Build. Mater. 2022, 316, 125836. [Google Scholar] [CrossRef]
  29. Zhang, D.; Jian, W.B.; Ye, Q.; Lin, W. Tailings slope time-varying analysis model and its application. Rock. Soil. Mech. 2014, 35, 835–840. [Google Scholar]
  30. Maldonado, F.M. Shear strength variation of tailings material due to meteorological causes and its influence on the physical stability of tailings dam No. 3 Mahr Túnel. Ind. Data 2019, 22, 50–60. [Google Scholar]
  31. Wang, X.G.; Zhan, H.B.; Wang, J.D.; Li, P. The stability of tailings dams under dry-wet cycles: A case study in Luonan, China. Water 2018, 10, 1048. [Google Scholar] [CrossRef] [Green Version]
  32. Xu, B.; Wang, Y. Stability analysis of the Lingshan gold mine tailings dam under conditions of a raised dam height. B Eng. Geol. Environ. 2015, 74, 151–161. [Google Scholar] [CrossRef]
  33. Gens, A.; Alonso, E.E. Aznalcollar dam failure part 2: Stability conditions and failure mechanism. Geotechnique 2006, 56, 185–201. [Google Scholar] [CrossRef] [Green Version]
  34. Salgueiro, A.R.; Pereira, H.G.; Rico, M.T. Application of correspondence analysis in the assessment of mine tailings dam breakage risk in the Mediterranean region. Risk. Anal. 2008, 28, 13–23. [Google Scholar] [CrossRef] [PubMed] [Green Version]
  35. Clarkson, L.; Williams, D. An Overview of Conventional Tailings Dam Geotechnical Failure Mechanisms. Min. Metall. Explor. 2021, 38, 1305–1328. [Google Scholar] [CrossRef]
  36. Hancock, G.R. A method for assessing the long-term integrity of tailings dams. Sci. Total Environ. 2021, 779, 146083. [Google Scholar] [CrossRef] [PubMed]
  37. Dong, L.J.; Sun, D.Y.; Li, X.B. Theoretical and case studies of interval nonprobabilistic reliability for tailing dam stability. Geofluids 2017, 2017, 8745894. [Google Scholar] [CrossRef] [Green Version]
  38. Liang, Z.Y.; Liang, L.; Cai, Y.Z.; Bertoni, A. The influence factors of the stability of tailings dam based on multi-source information fusion method. J. Intell. Fuzzy Syst. 2019, 37, 3365–3372. [Google Scholar] [CrossRef]
  39. Maria, T.Z.; Luciano, A.O.; Roberto, R. The role of capillary water in the stability of tailing dams. Eng. Geol. 2009, 105, 108–118. [Google Scholar]
Figure 1. Frequency distribution of typical rainstorm process in an area. (a) Rainstorm 1 h; (b) Rainstorm 2 h; (c) Rainstorm 3 h; (d) Rainstorm 24 h.
Sustainability 14 03081 g001
Figure 2. Generalized model diagram of tailings pond section.
Sustainability 14 03081 g002
Figure 3. Ideal elastoplastic stress-strain curve.
Sustainability 14 03081 g003
Figure 4. Process of solving potential sliding surface by limit strain method. (a) Limit strain calculation results; (b) Potential sliding surface.
Sustainability 14 03081 g004
Figure 5. Flow chart of limit strain Monte Carlo reliability analysis.
Sustainability 14 03081 g005
Figure 6. Numerical model diagram. (a) Numerical model diagram; (b) Reliability calculation model diagram.
Sustainability 14 03081 g006
Figure 7. Calculation results of water level line. (a) 30 min; (b) 60 min; (c) 90 min; (d) 120 min; (e) 150 min; (f) 180 min.
Sustainability 14 03081 g007
Figure 8. Calculation results of sliding surface. (a) 30 min; (b) 60 min; (c) 90 min; (d) 120 min; (e) 150 min; (f) 180 min.
Sustainability 14 03081 g008
Figure 9. Calculation results of reliability of tailings pond.
Sustainability 14 03081 g009aSustainability 14 03081 g009b
Table 1. Calculation parameters.
MaterialBulk DensityEffective Stress Shear IndexModulus of Elasticity E
Natural Bulk Density γ/kN·m−3Floating Bulk Density γ’/kN·m−3C/kPaφ
Average ValueStandard DeviationAverage ValueStandard DeviationMPa
Average ValueAverage ValueAverage ValueAverage ValueWaterUnderwaterWaterUnderwaterWaterUnderwaterWaterUnderwater
Initial dam18.00.210.00.20.00.0--28.027.03.43.4120
Tailing fine Sand17.51.29.61.30.00.0--26.524.63.84.045.8
Tail silt16.90.59.20.621.415.74.44.524.622.13.43.7-
Sub dam20.50.212.30.212.15.61.81.929.026.02.02.2-
Bedrock24.0-24.0-30.0280--38.035.0--160
Table 2. Rainstorm volume results.
DurationRainfall/mm
2 Years3 Years5 Years10 Years20 Years30 Years50 Years100 Years
1 h43.851.360.371.783.188.896.1106.3
2 h57.869.283.4101.4118.7127.4138.8154.6
3 h67.081.599.8123.0145.0156.2170.8191.2
24 h99.1116.3135.0157.9179.0190.7205.1224.1
Table 3. Distribution of 3 h rainfall in the study area.
Calculation Results
Characteristic time node/min306090120150180
Time history allocation proportion/%1.572.3212.862.521.641.29
Real time rainfall/mm3.004.4324.594.823.142.47
Cumulative rainfall/mm16.2538.5299.94152.84174.89191.20
Waterline height/mm99.15231.15579.64843.69960.051036.32
Table 4. Calculation results of reliability of tailings pond.
Characteristic Time/minCumulative Rainfall/mmWater Level/mmAverage Safety Factor FμReliability Index FβFailure Probability Pf/%
Swedish MethodBishop MethodSwedish MethodBishop MethodSwedish MethodBishop Method
3016.2599.151.311.353.283.580.850.69
6038.52231.151.291.323.263.560.980.78
9099.94579.641.261.283.233.531.130.95
120152.84843.691.221.233.213.501.411.15
150174.89960.051.171.203.193.481.621.31
180191.201036.321.161.183.183.471.711.37
Publisher’s Note: MDPI stays neutral with regard to jurisdictional claims in published maps and institutional affiliations.

