1. Introduction
The major operations performed in the process of underground mining are the destruction of the rock mass, its loading, and transportation through the system of mine workings to the surface. These operations lead to the formation of both rather large fragments of rocks (including oversized fragments) and a large amount of dusty fraction. The latter is easily transported by air flow through the mine workings and can lead to unacceptably high dust content in the atmosphere of these workings during mining operations.
In sufficient concentrations, dust in the atmosphere of mine workings is an unfavorable factor in mining operations and can represent a serious hazard. For example, coal dust is explosive [
1,
2]. Over time, the daily prolonged stays of miners in the working areas of coal mines with a high dust content leads to the development of such occupational diseases as chronic bronchitis, pneumoconiosis, and silicosis [
3,
4]. Similar problems related to the impact of dust on the health of miners exist in potash mines [
5]. Miners who regularly spend time in the dusty working areas of potash mines eventually develop such specific diseases as subatrophic rhinitis, pharyngitis, ulceration of the nasal mucosa, phlegmon, chronic bronchitis, et cetera.
In this article, we will focus on the dustiness of potash mines. It is known from experimental studies that the concentration of dust in dead-end drifts in potash mines can exceed 2000 mg/m
3 [
6,
7]. At the same time, according to safety rules in Russia and the CIS countries, the maximum permissible concentration of salt dust is only 5 mg/m
3. As such, it is important to control the dust content of the atmosphere of potash mines, along with other properties of the air in mine workings (gas concentrations, temperature, and relative humidity) [
8,
9].
There are many studies in the existing literature related to dust control; however, most focus on coal mines. Regarding coal mines, there have been purely experimental studies [
10,
11] and theoretical calculations [
2,
12,
13], as well as complex experimental and theoretical studies, including the calibration of CFD models for the transfer of harmful impurities according to experimental data [
9,
14]. In [
15], new methods and approaches were developed for experimental monitoring of coal dust concentrations. In [
9], the optimal air velocity for ventilation of a dead-end face was investigated in terms of minimizing the concentration of coal dust. In [
14,
16] the authors considered the use of irrigation to minimize the concentration of coal dust.
At the same time, studies of the dust content of the atmosphere of potash mines are nearly absent from the literature. This is logical given that potash dust is generally less dangerous than coal dust, and the number of potash mines is significantly lower than the number of coal mines. However, the problem of dust content in potash mines is quite acute [
5], and its solution cannot be carried out by transferring known methods from the coal industry. Traditional methods of dust suppression in coal mines, based on the use of water, are not applicable to the conditions present in potash mines. This is due to the lack of sufficient underground water: potash mines traditionally do not have underground plumbing systems. In the presence of hygroscopic salt rocks, waterlogging of rocks is unacceptable, as it leads to caking of salt particles and formation of an aggressive environment, which is dangerous and causes rapid corrosive wear on equipment. For this reason, it is necessary to explore other methods and approaches to dedusting the working areas of potash mines.
Salt dust has the following fundamental differences from coal dust: it is non-explosive and soluble in water [
17]. The average particle size of potash dust at the mines of the Verkhnekamskoe and Starobinskoe salt deposits is 5–10 µm [
5], while the average particle size of coal dust usually varies in the range of 50–150 µm [
18,
19]. This implies that the lifting of potash dust particles from the surfaces of mine workings and mining equipment by air flow begins earlier than for coal dust. For potash dust, the critical velocity is about 0.8–1 m/s [
20], and for coal dust it is about 2 m/s [
21]. This indicates that even ventilation solutions for dedusting coal mines cannot simply be transferred to potash mines.
This article examines the features of ventilation of dead-end drifts in potash mines with operating combines. Various auxiliary ventilation systems and air flow rates are considered. The article continues the previous studies of the authors [
22,
23]. In the first study [
22], an approach was proposed that consists in dividing the air space of a dead-end drift into microzones and analyzing the airflows between this microzones. At the same time, it was proposed that the quality of the air in the “breathing zone” of miners be assessed by the quality of the air in the corresponding microzone, and not in the entire mine working. The possibility of using this approach is associated, first, with the distinctive property of potash dust, its lack of flammability. In [
23], this approach was further developed. As a result of the analysis of mass transfer mechanisms in dead-end drift, it was shown that only when the convective mass transfer prevails over the diffusive one does it become possible to apply the microzoning approach. It is also shown that the convective mass transfer of air dominates only for the exhaust ventilation systems, while for forced ventilation systems, diffusive mass transfer prevails.
As in [
20,
23], our research methodology is based on multi-parameter numerical simulations of the flow of a dust–air mixture in a dead-end drift. However, in this article, greater attention is paid to the selection of adequate approaches to modeling dust aerosols, boundary conditions, parameterization, and validation of the model according to field experiments in potash mines.
While on the topic of methodology of numerical simulation, it is also important to note the existing methods and approaches to modeling the dynamics of dust aerosols in mines in general. Depending on the physical parameters of the medium (dispersion, concentration, and chemical activity), flow regimes, and geometry, dust aerosols are modeled as homogeneous multicomponent media [
18,
20,
24] or as heterogeneous multiphase media [
9]. Within the latter framework, two approaches are distinguished: the Lagrange–Euler approach, wherein the dynamics of the dispersed phase (dust) are modeled by calculating the trajectories of individual particles [
2,
9,
25] and the Euler–Euler approach, wherein the carrier phase (air) and the dispersed phase (gas) form two connected interpenetrating continua. In this case, separate transfer equations are considered for the dispersed phase [
26]. Within the framework of the heterogeneous multiphase media model, the carrier and dispersed phases can have different velocities at each point of the continuum, while within the framework of the homogeneous multicomponent medium approach, the velocity field for all phases is common.
The more complex and complete Lagrange–Euler approach is applicable to essentially non-equilibrium flows (large inertial particles and rarefied dispersed media). It should be noted that this approach requires a large quantity of input data (the laws and parameters of the interactions between particles, as well as the particulate interaction with the air flow and the walls of mine workings) and is resource-intensive. The Euler–Euler approach is valid under conditions close to equilibrium (small, low-inertia particles, and concentrated dispersed media). The model of a homogeneous multicomponent medium is simplest and is used either when the components are mixed at the molecular level, or in a situation of a sufficiently low concentration of the dispersed phase (less than 0.1%) and small constituent particles (less than 10 μm). In the literature, the homogeneous medium model was used to study the distribution of gas impurities (methane) [
27], to study the dynamics of the plume of diesel fuel particles created by a truck and loader [
28], and to describe the dynamics of salt aerosols in the atmosphere [
24,
29].
Since the dust–air mixture by its nature is a two-phase medium (aerosol), in which the salt dust is present in the form of solid particles of small size and low volumetric concentration, it is most reasonable to use a simple model of a homogeneous multicomponent medium for numerical simulation. An additional motivation for choosing the simple modeling approach is that the parametrization of dust–air mixture models according to practical data is invariably difficult due to the small size of the datasets, their possible errors, and input data variability when considering different mine workings. At the same time, evaluation of the possibility of using simple models to describe the dynamics of a dust–air mixture should be made based on experimental studies of salt dust in relation to the object studied in this article, the atmosphere of a dead-end drift with an operating combine. Therefore, the plan of this study assumed, first, experimental measurements of air velocities and dust concentrations in a dead-end face, and second, the formulation of a mathematical model and its validation using numerical simulation data.
2. Experimental Studies of Dust Distribution in a Potash Mine
The measurements were carried out in the dead-end drift of the potash mine in the Verkhnekamskoye potassium-magnesium salt deposit (Russia, Perm Krai). The drift passes through the AB layer, which consists of two sublayers-in the lower part, sublayer A, represented by banded sylvinite, and in the upper part, sublayer B, represented by either carnallite or variegated sylvinite [
30]. The length of the dead-end drift at the initial time (beginning of measurement procedure) was 150 m, and at the final time it was 157 m. The cross-sectional area of the drift was 15.6 m
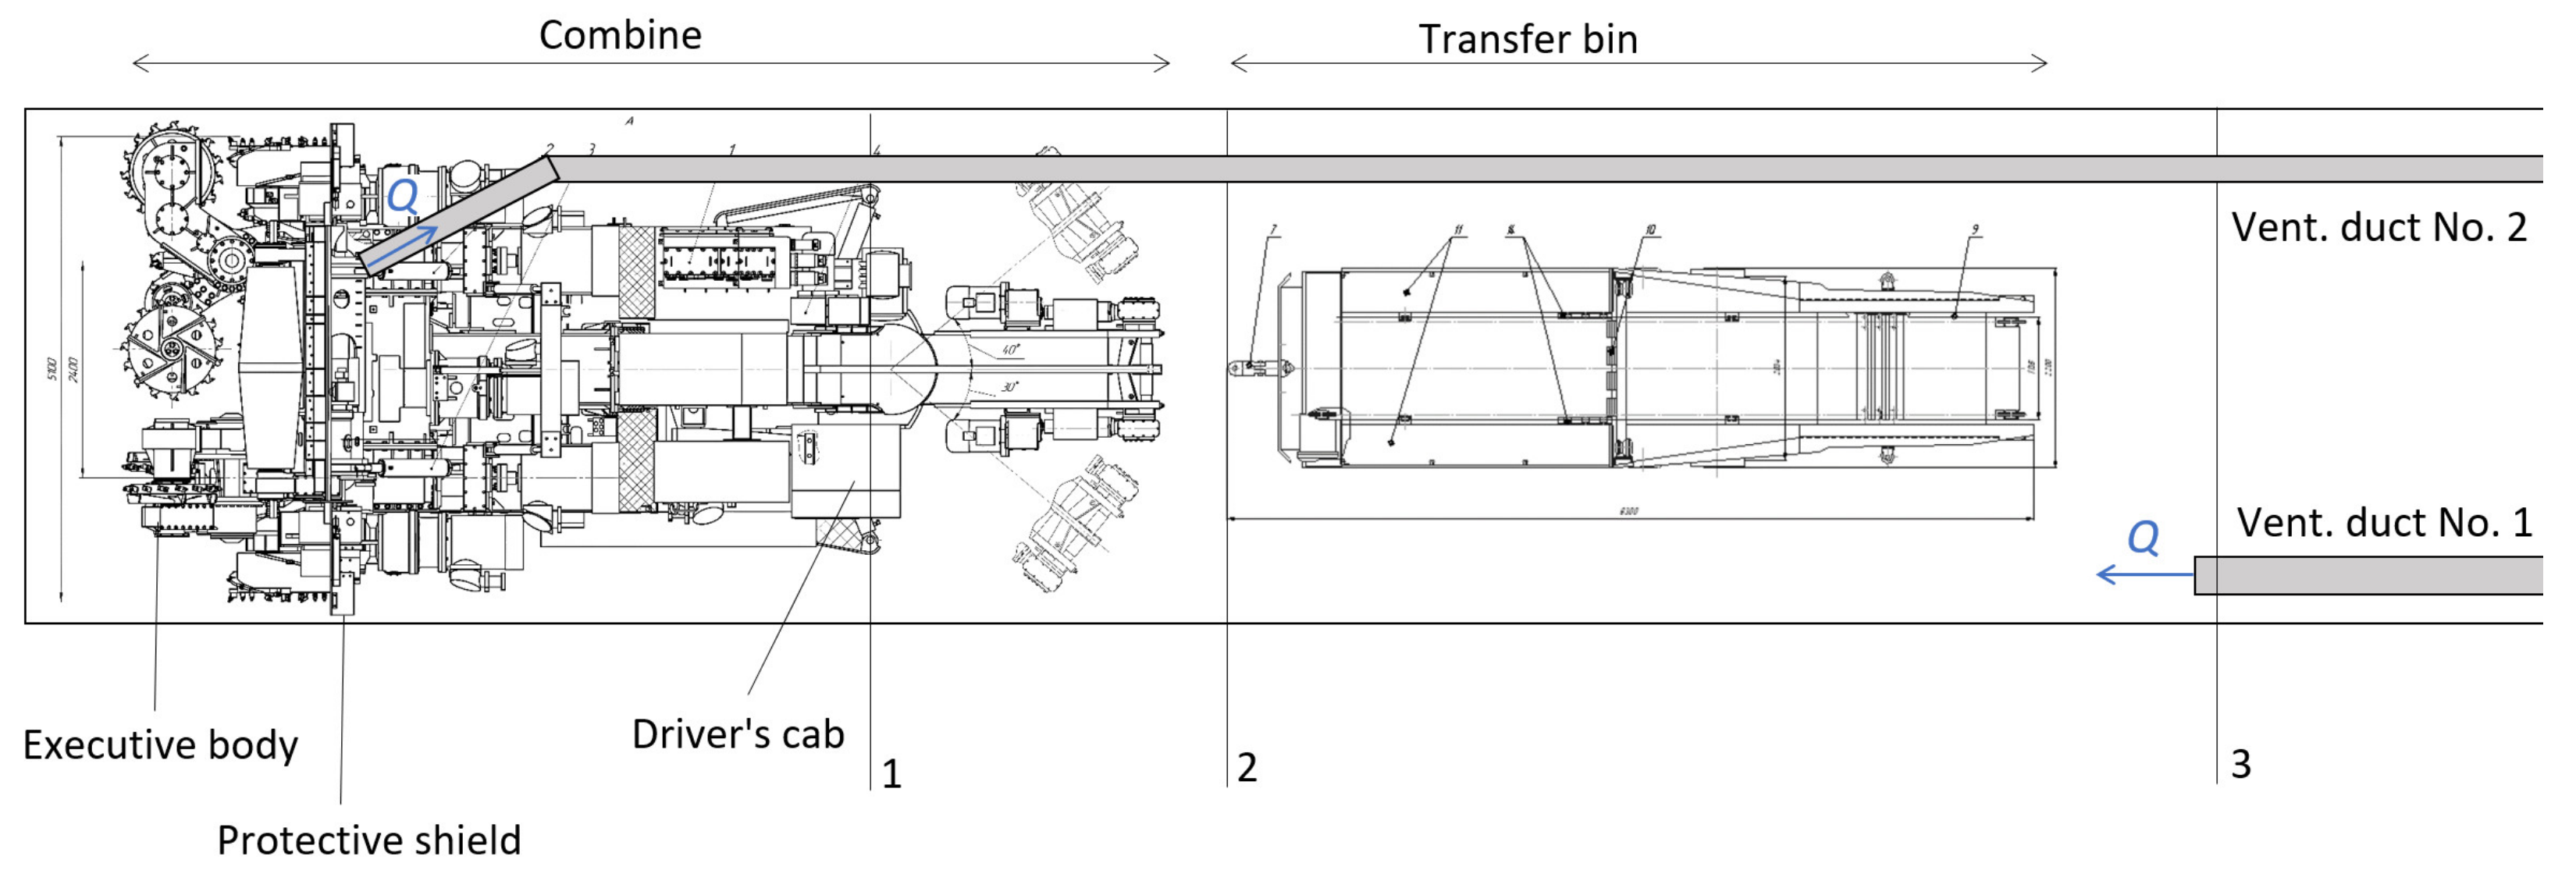
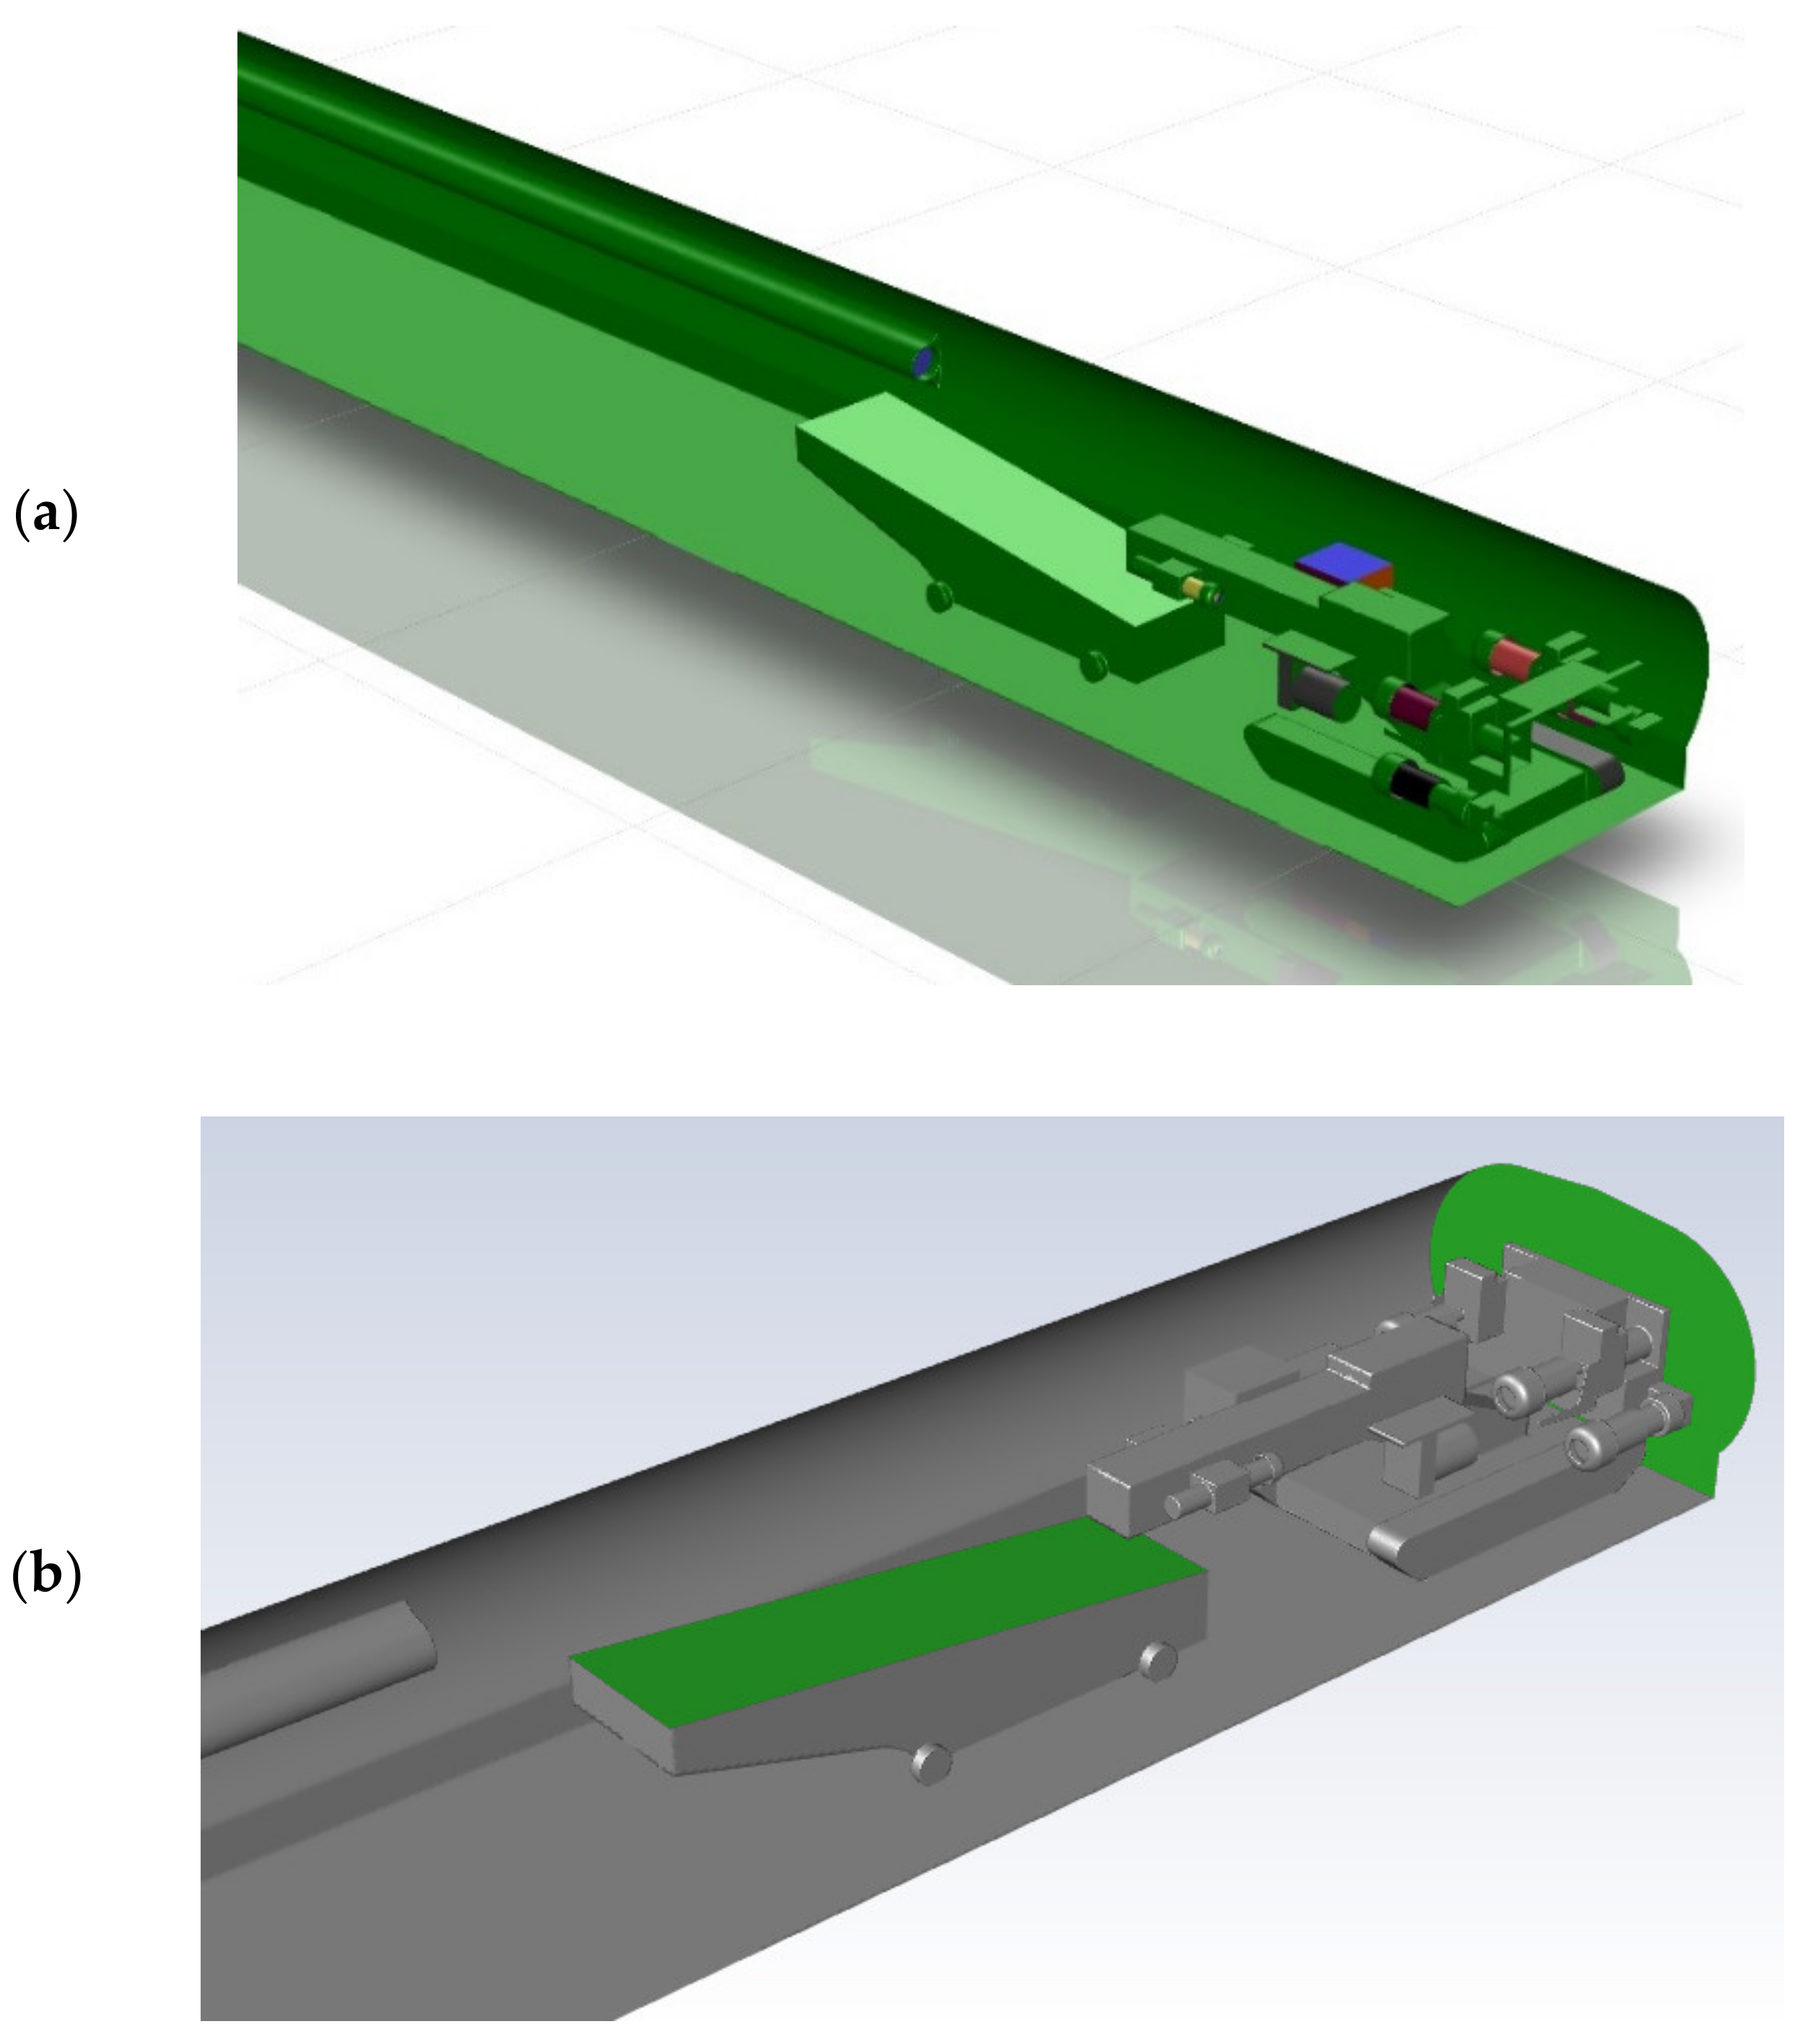
2. Near the dead-end face, there was a Ural 20-R combine with a planetary executive body. A transfer bin was placed behind the combine (see
Figure 1) and used for the accumulation of rock mass mined by the combine, and its subsequent reloading into a self-propelled car. The cross-section area of the drift was determined by the geometric features of the planetary executive body of the combine and is shown in
Figure 2.
The main source of dust is an operating executive body that destroys the rock mass. The combine is equipped with a protective shield that prevents most of the dust from the executive body from entering the atmosphere of the drift. The protective shield is installed in the gaps between the combine and the drift walls along the perimeter of the drift. At the same time, some dust still penetrates the air space of the working through the cracks in the shield and the leaks between the shield and the wall of the dead-end drift. Another source of dust is the transfer bin, on which the mined ore is poured from the combine boom. These represent the primary two sources of dust.
Ventilation of the drift can be carried out using a forced ventilation system, an exhaust system, or their combination. In the case of a forced system, the stream of fresh air is supplied through the ventilation duct No. 1 (see
Figure 1) and flows round the combine (up to the protective shield). The polluted air is removed through the drift. In the case of an exhaust ventilation system, fresh air is supplied to the combine through the drift, and the polluted air is removed through the ventilation duct No. 2. The combined system involves the use of both ventilation ducts and, in essence, is an intermediate option between the forced and exhaust systems.
The forced ventilation system is the most used system in the ventilation of dead-end faces. Most often, only the use of forced ventilation is permitted in mines. However, in addition to this system, in this study, we also considered the exhaust system. This is because one of the practical issues of this study is to analyze the effectiveness of this ventilation system, in which convective mass transfer prevails over diffusion mixing and, in our opinion, it becomes possible to control the dust content of individual microzones.
Experimental studies were carried out for three cases of the ventilation of a dead-end face.
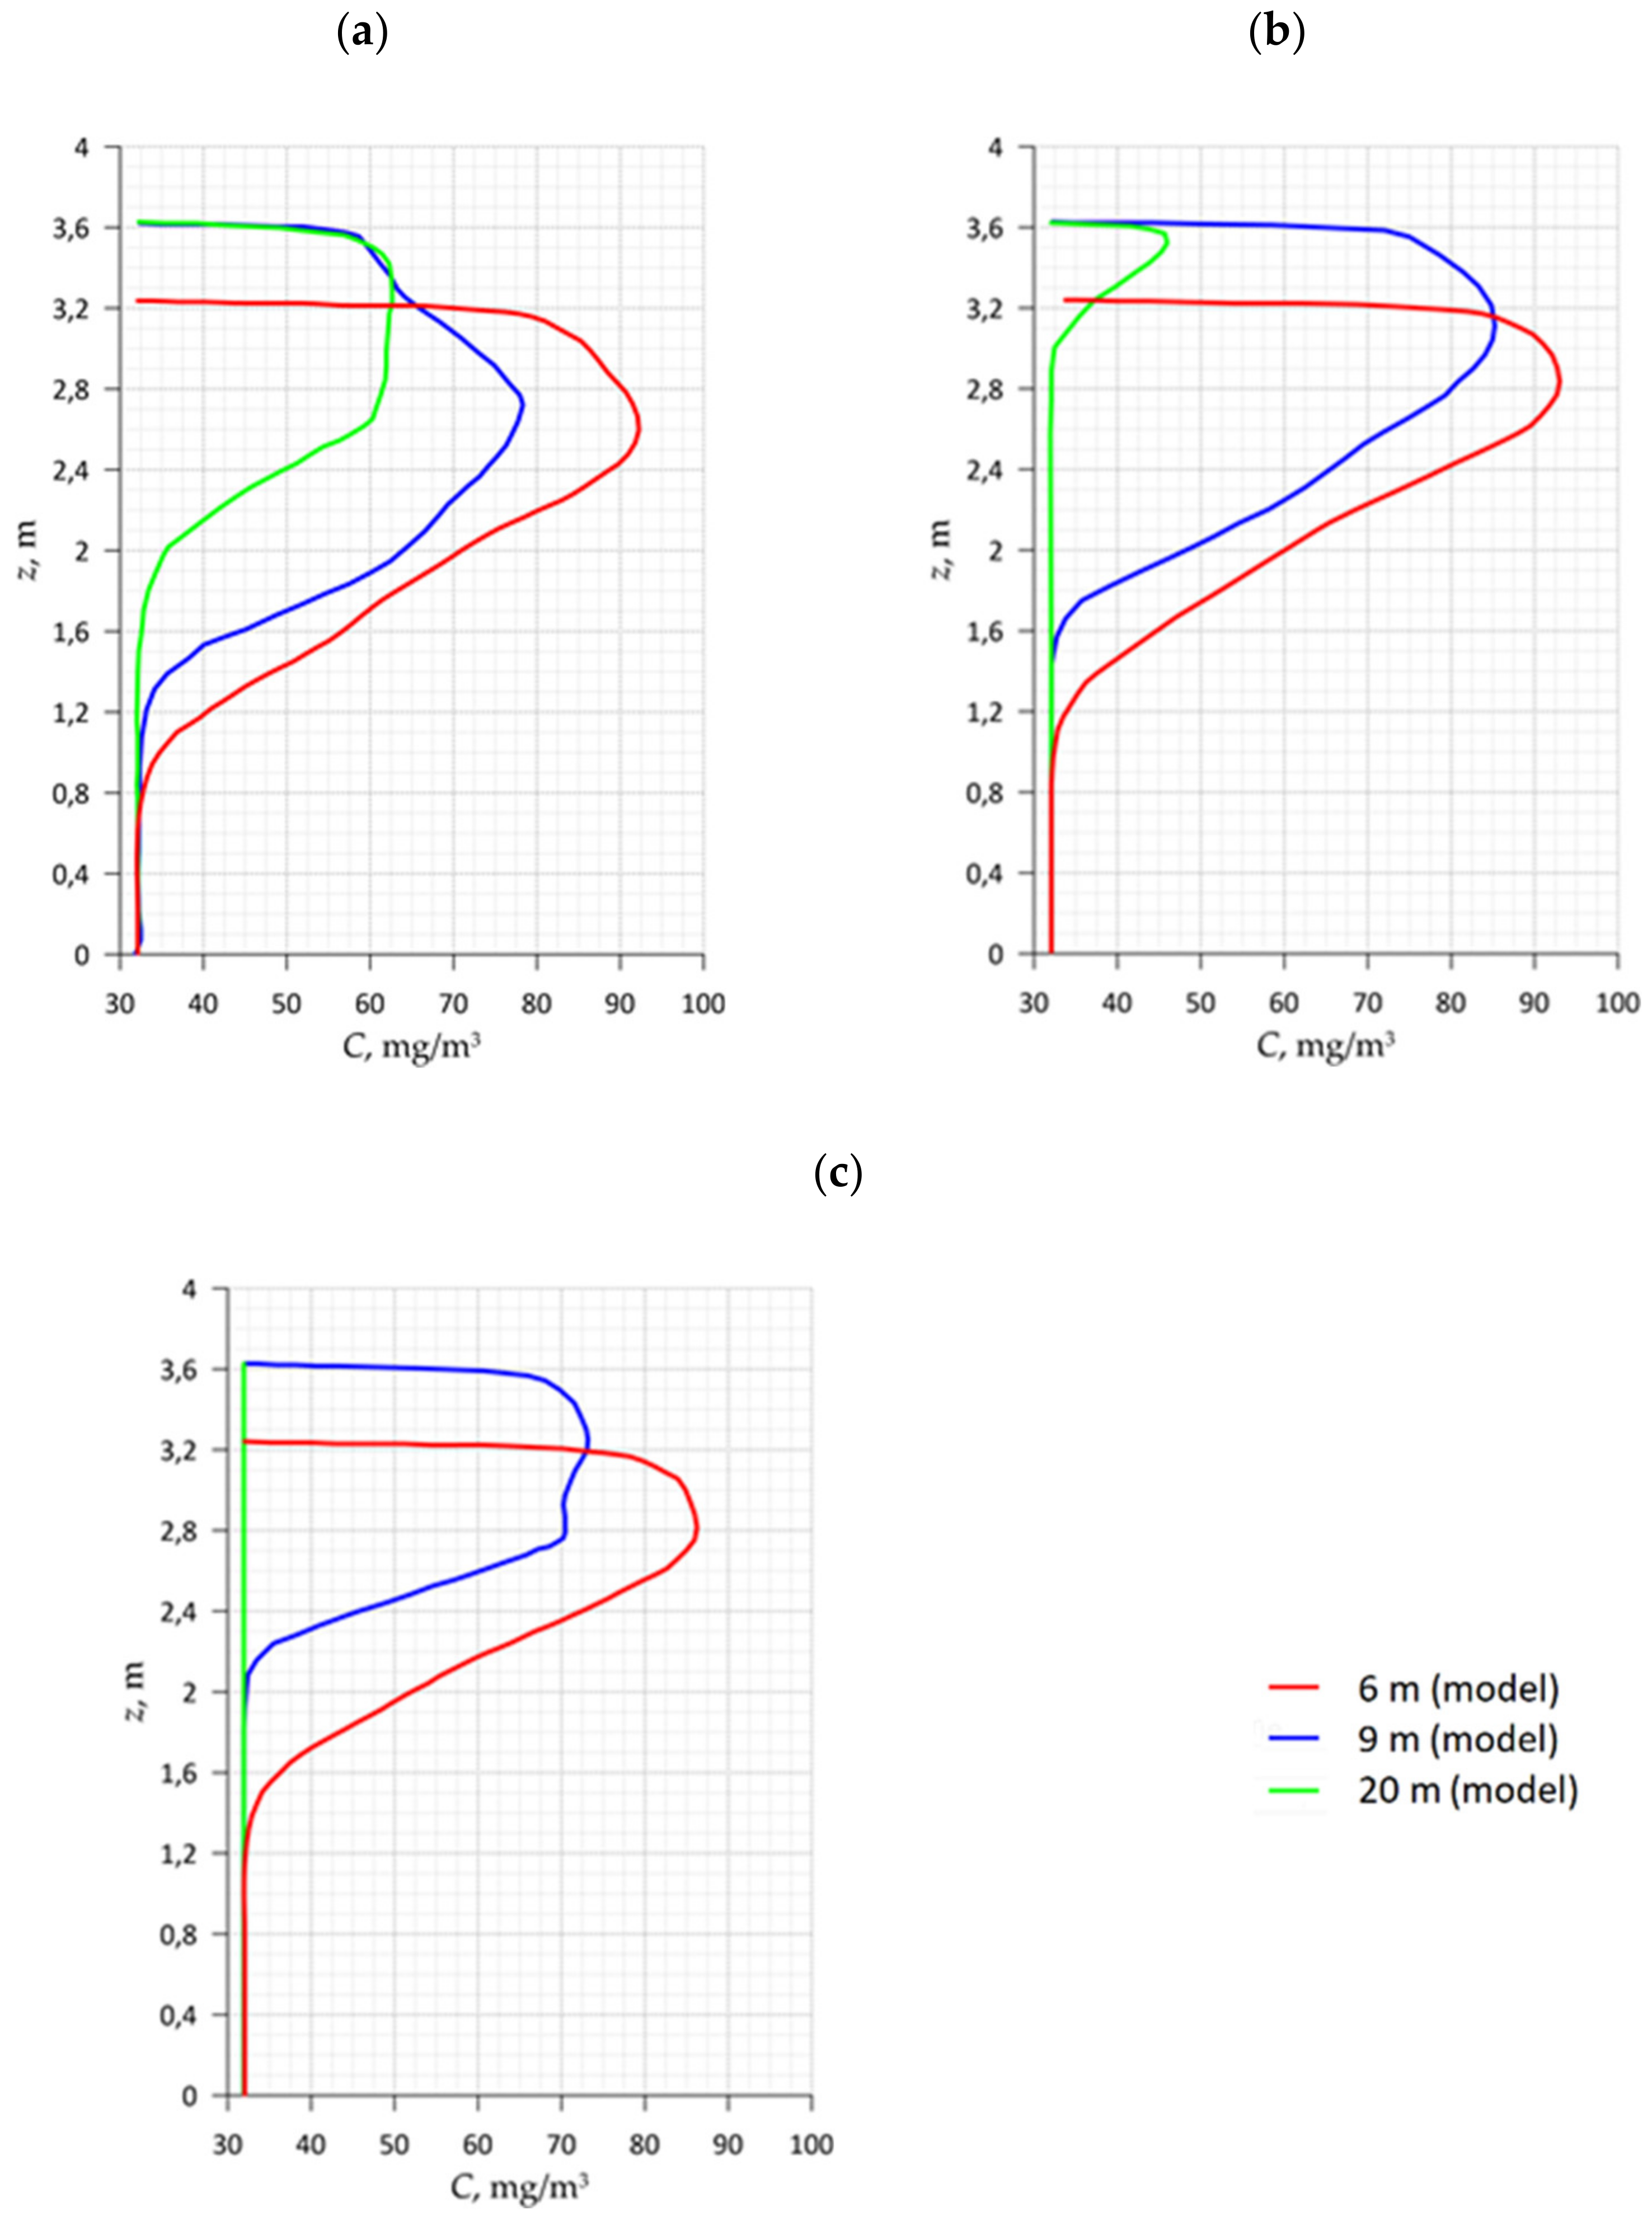
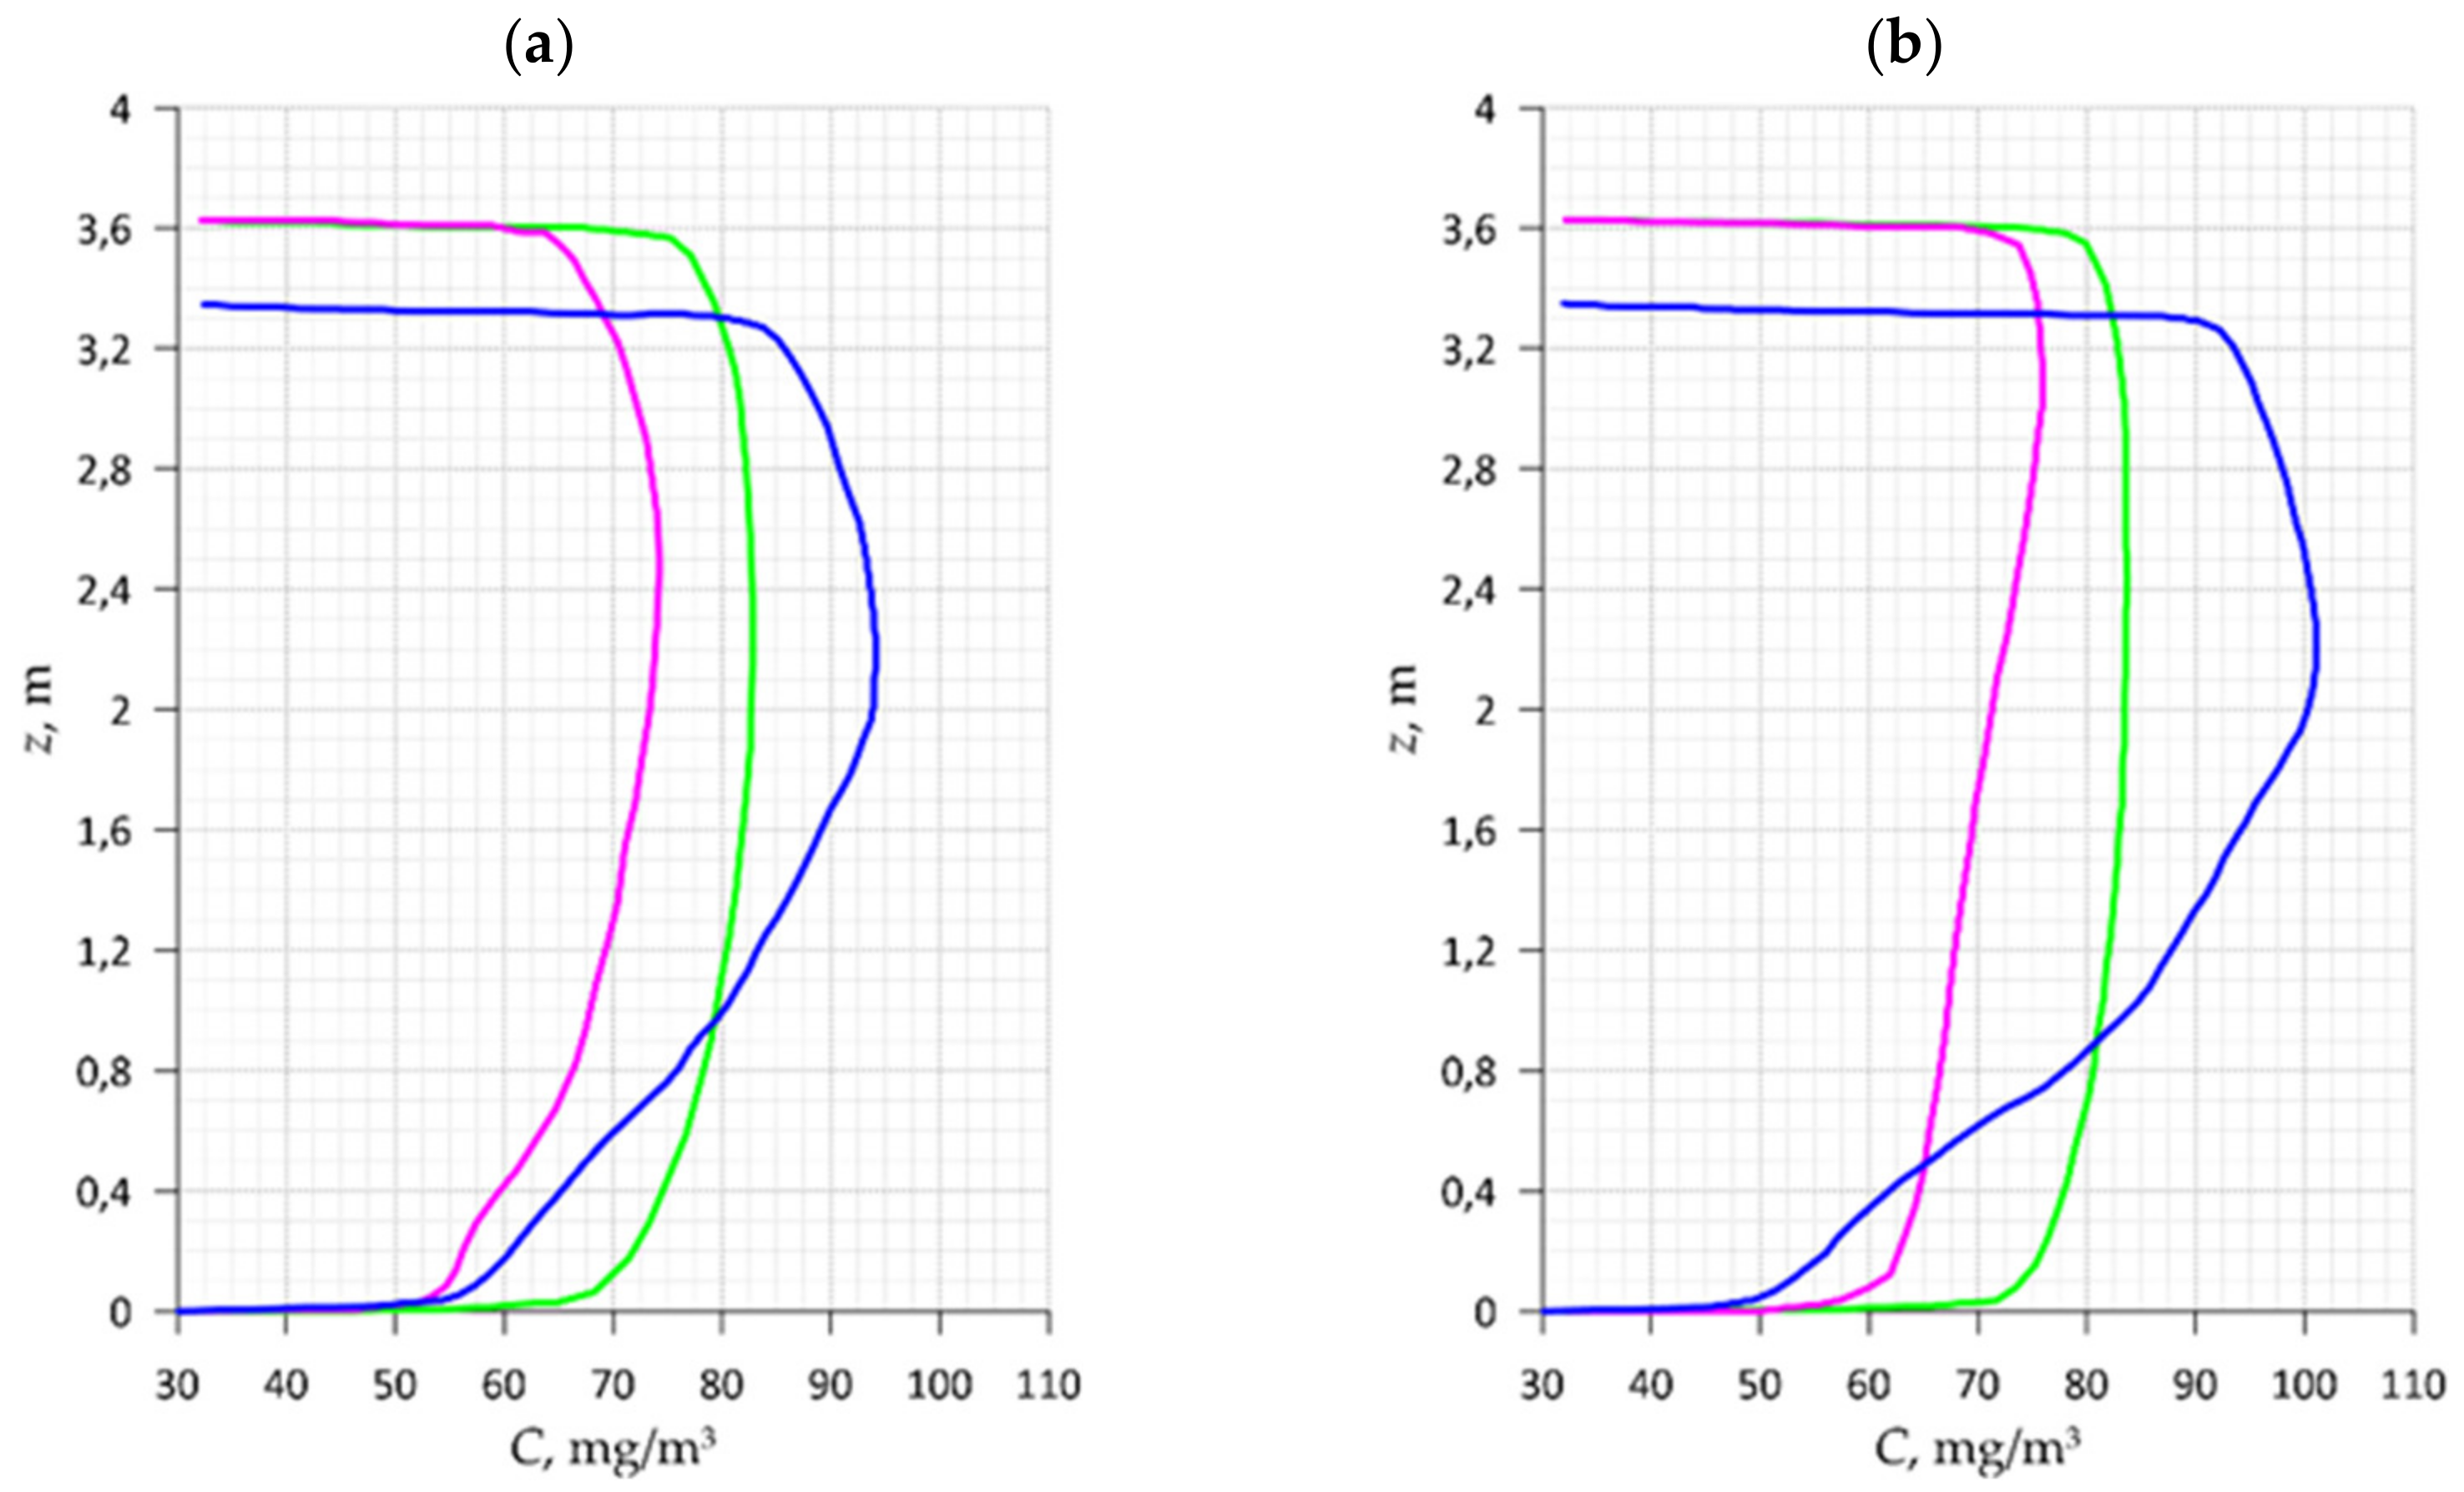
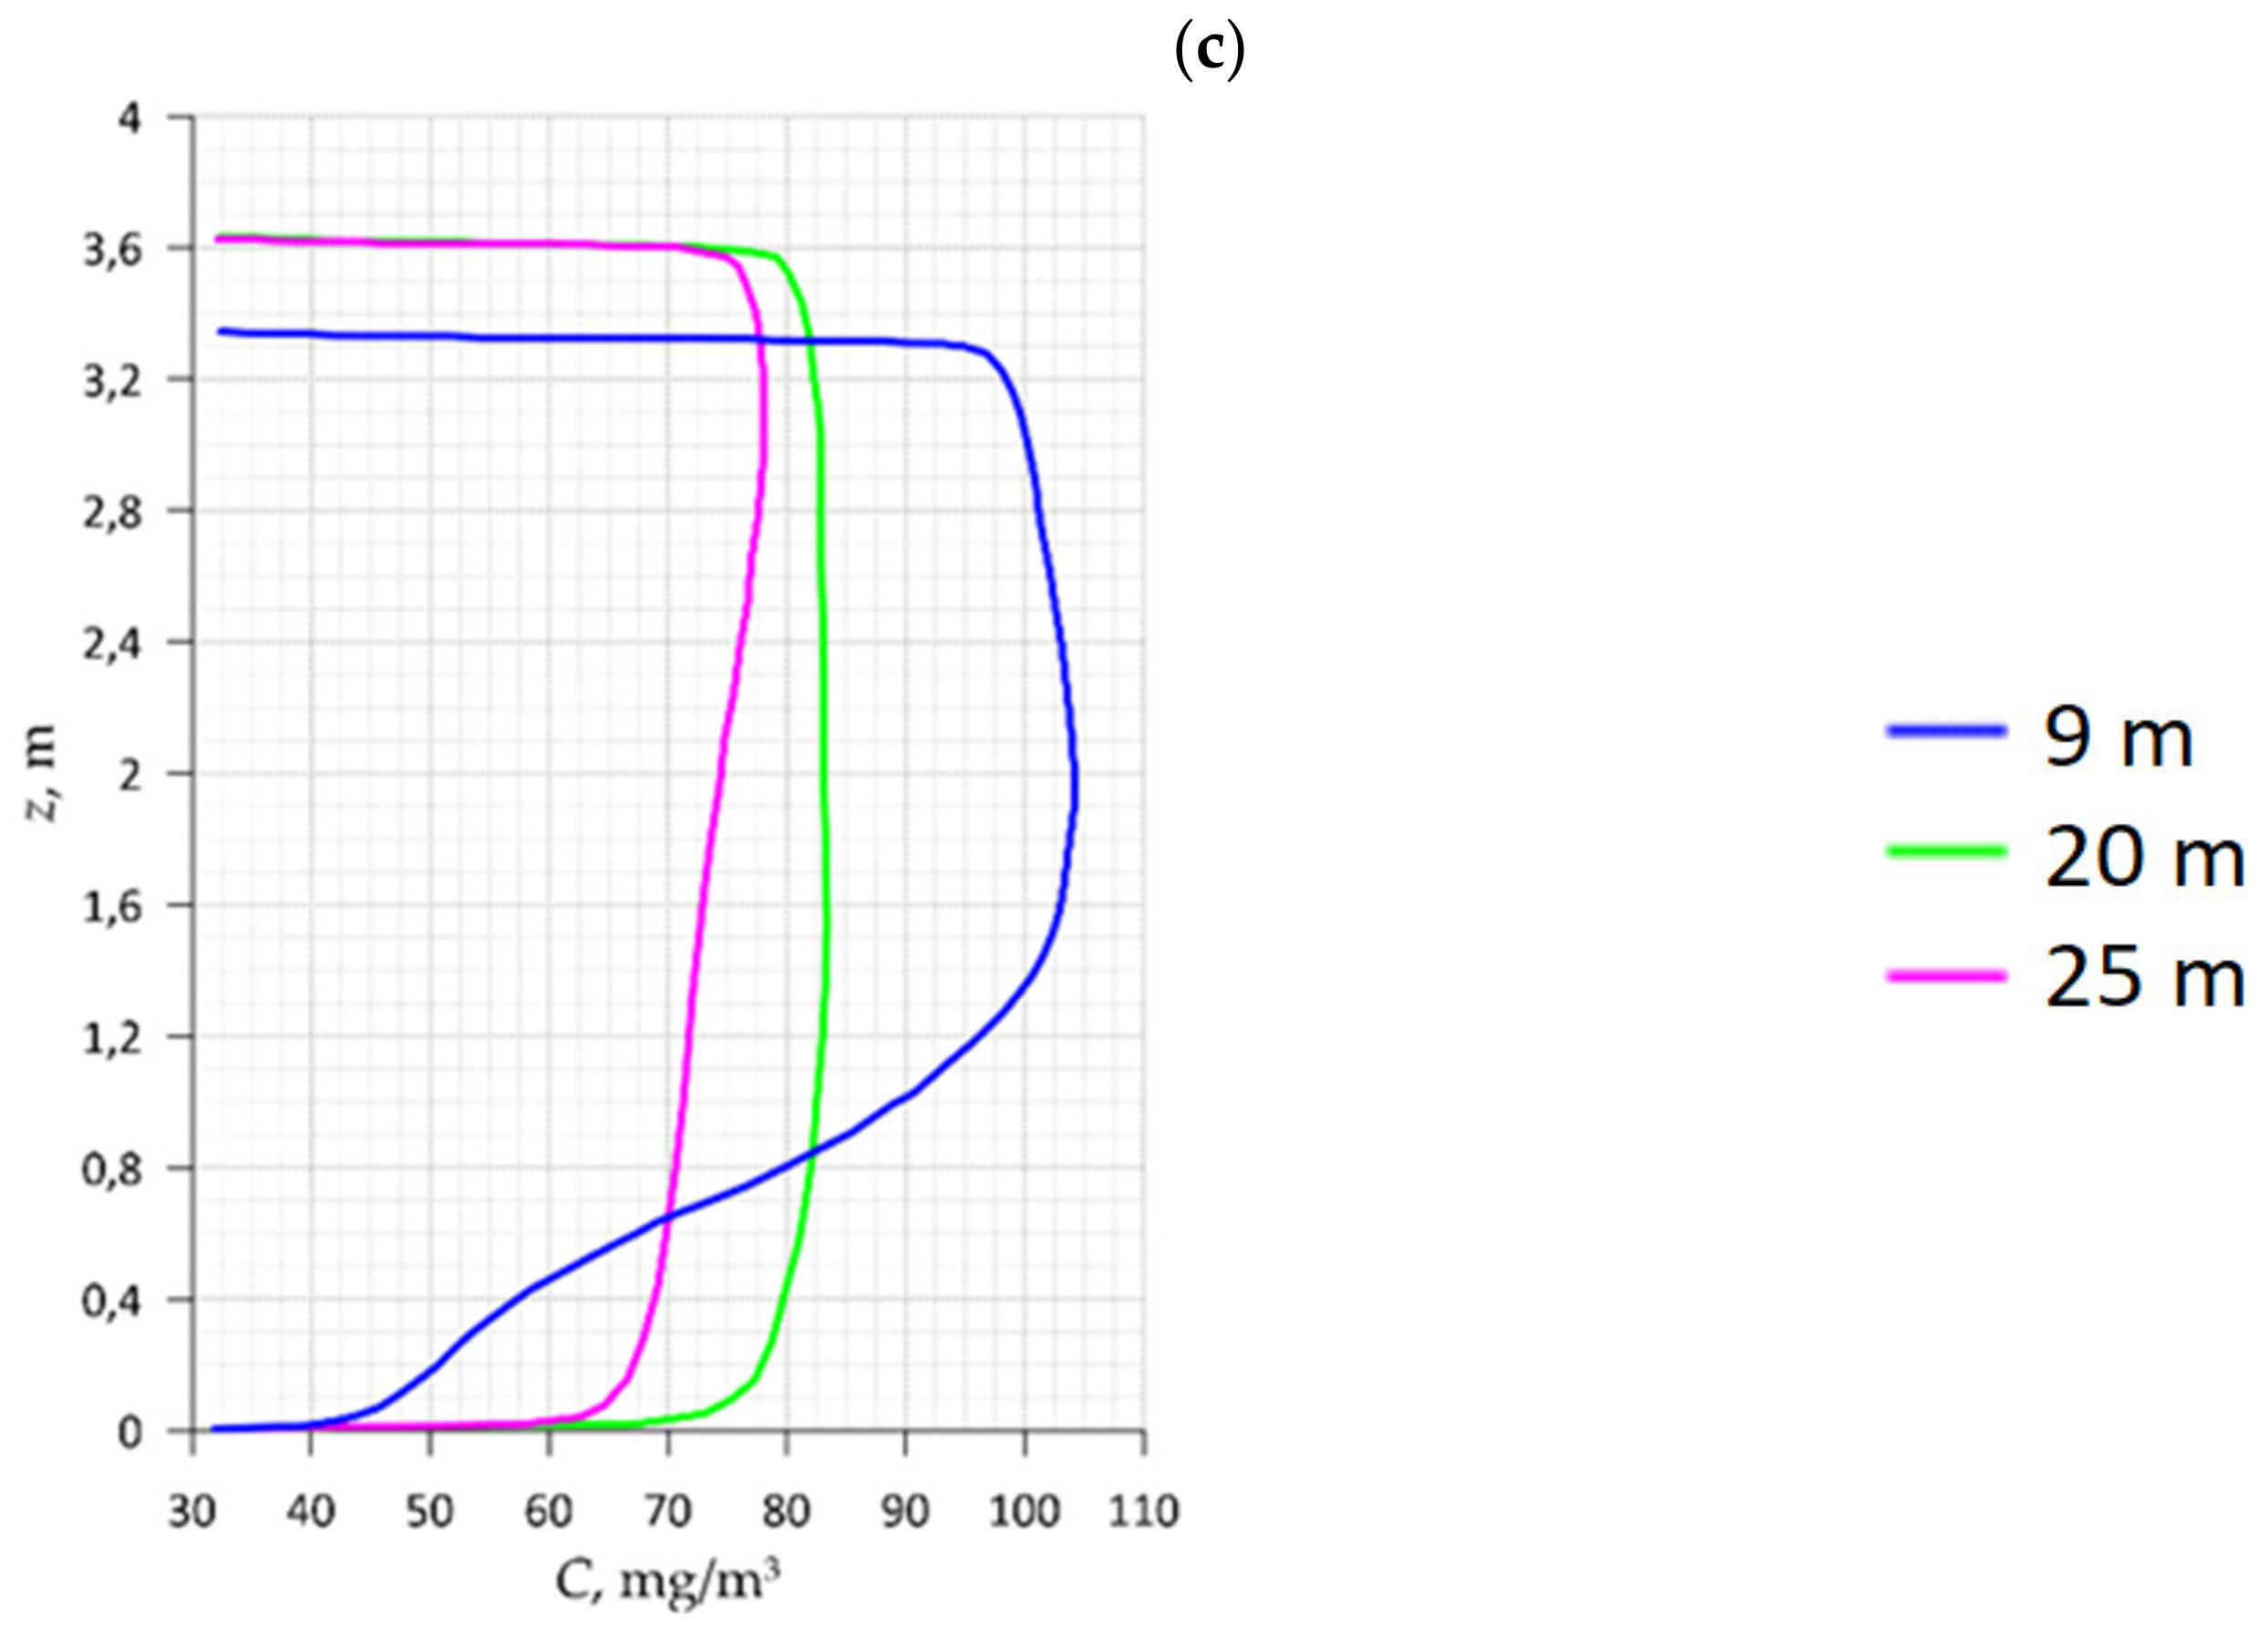
A forced ventilation system in which the distance between the end of the ventilation duct and the combine driver’s cab is 10 m and the mean velocity of the air flowing out the ventilation duct is 19.4 m/s.
A forced ventilation system in which the distance between the end of the ventilation duct and the combine driver’s cab is 25 m and the mean velocity of the air flowing out the ventilation duct is 20 m/s.
An exhaust ventilation system in which the air velocity at the inlet to the ventilation duct is 7.8 m/s. The air duct inlet is located on the combine, as shown in
Figure 1.
For all three cases, the diameters of the ventilation ducts are identical (0.5 m). During the measurements, the combine was operating at full power. The time during which the operating combine moves 1 m (15–20 min) is quite large compared to the characteristic time of measuring air parameters in the section of the drift. Therefore, no corrections for the displacement of the measuring sections were made.
Figure 1 also shows the layout of the measurement sections in the longitudinal horizontal section of the drift.
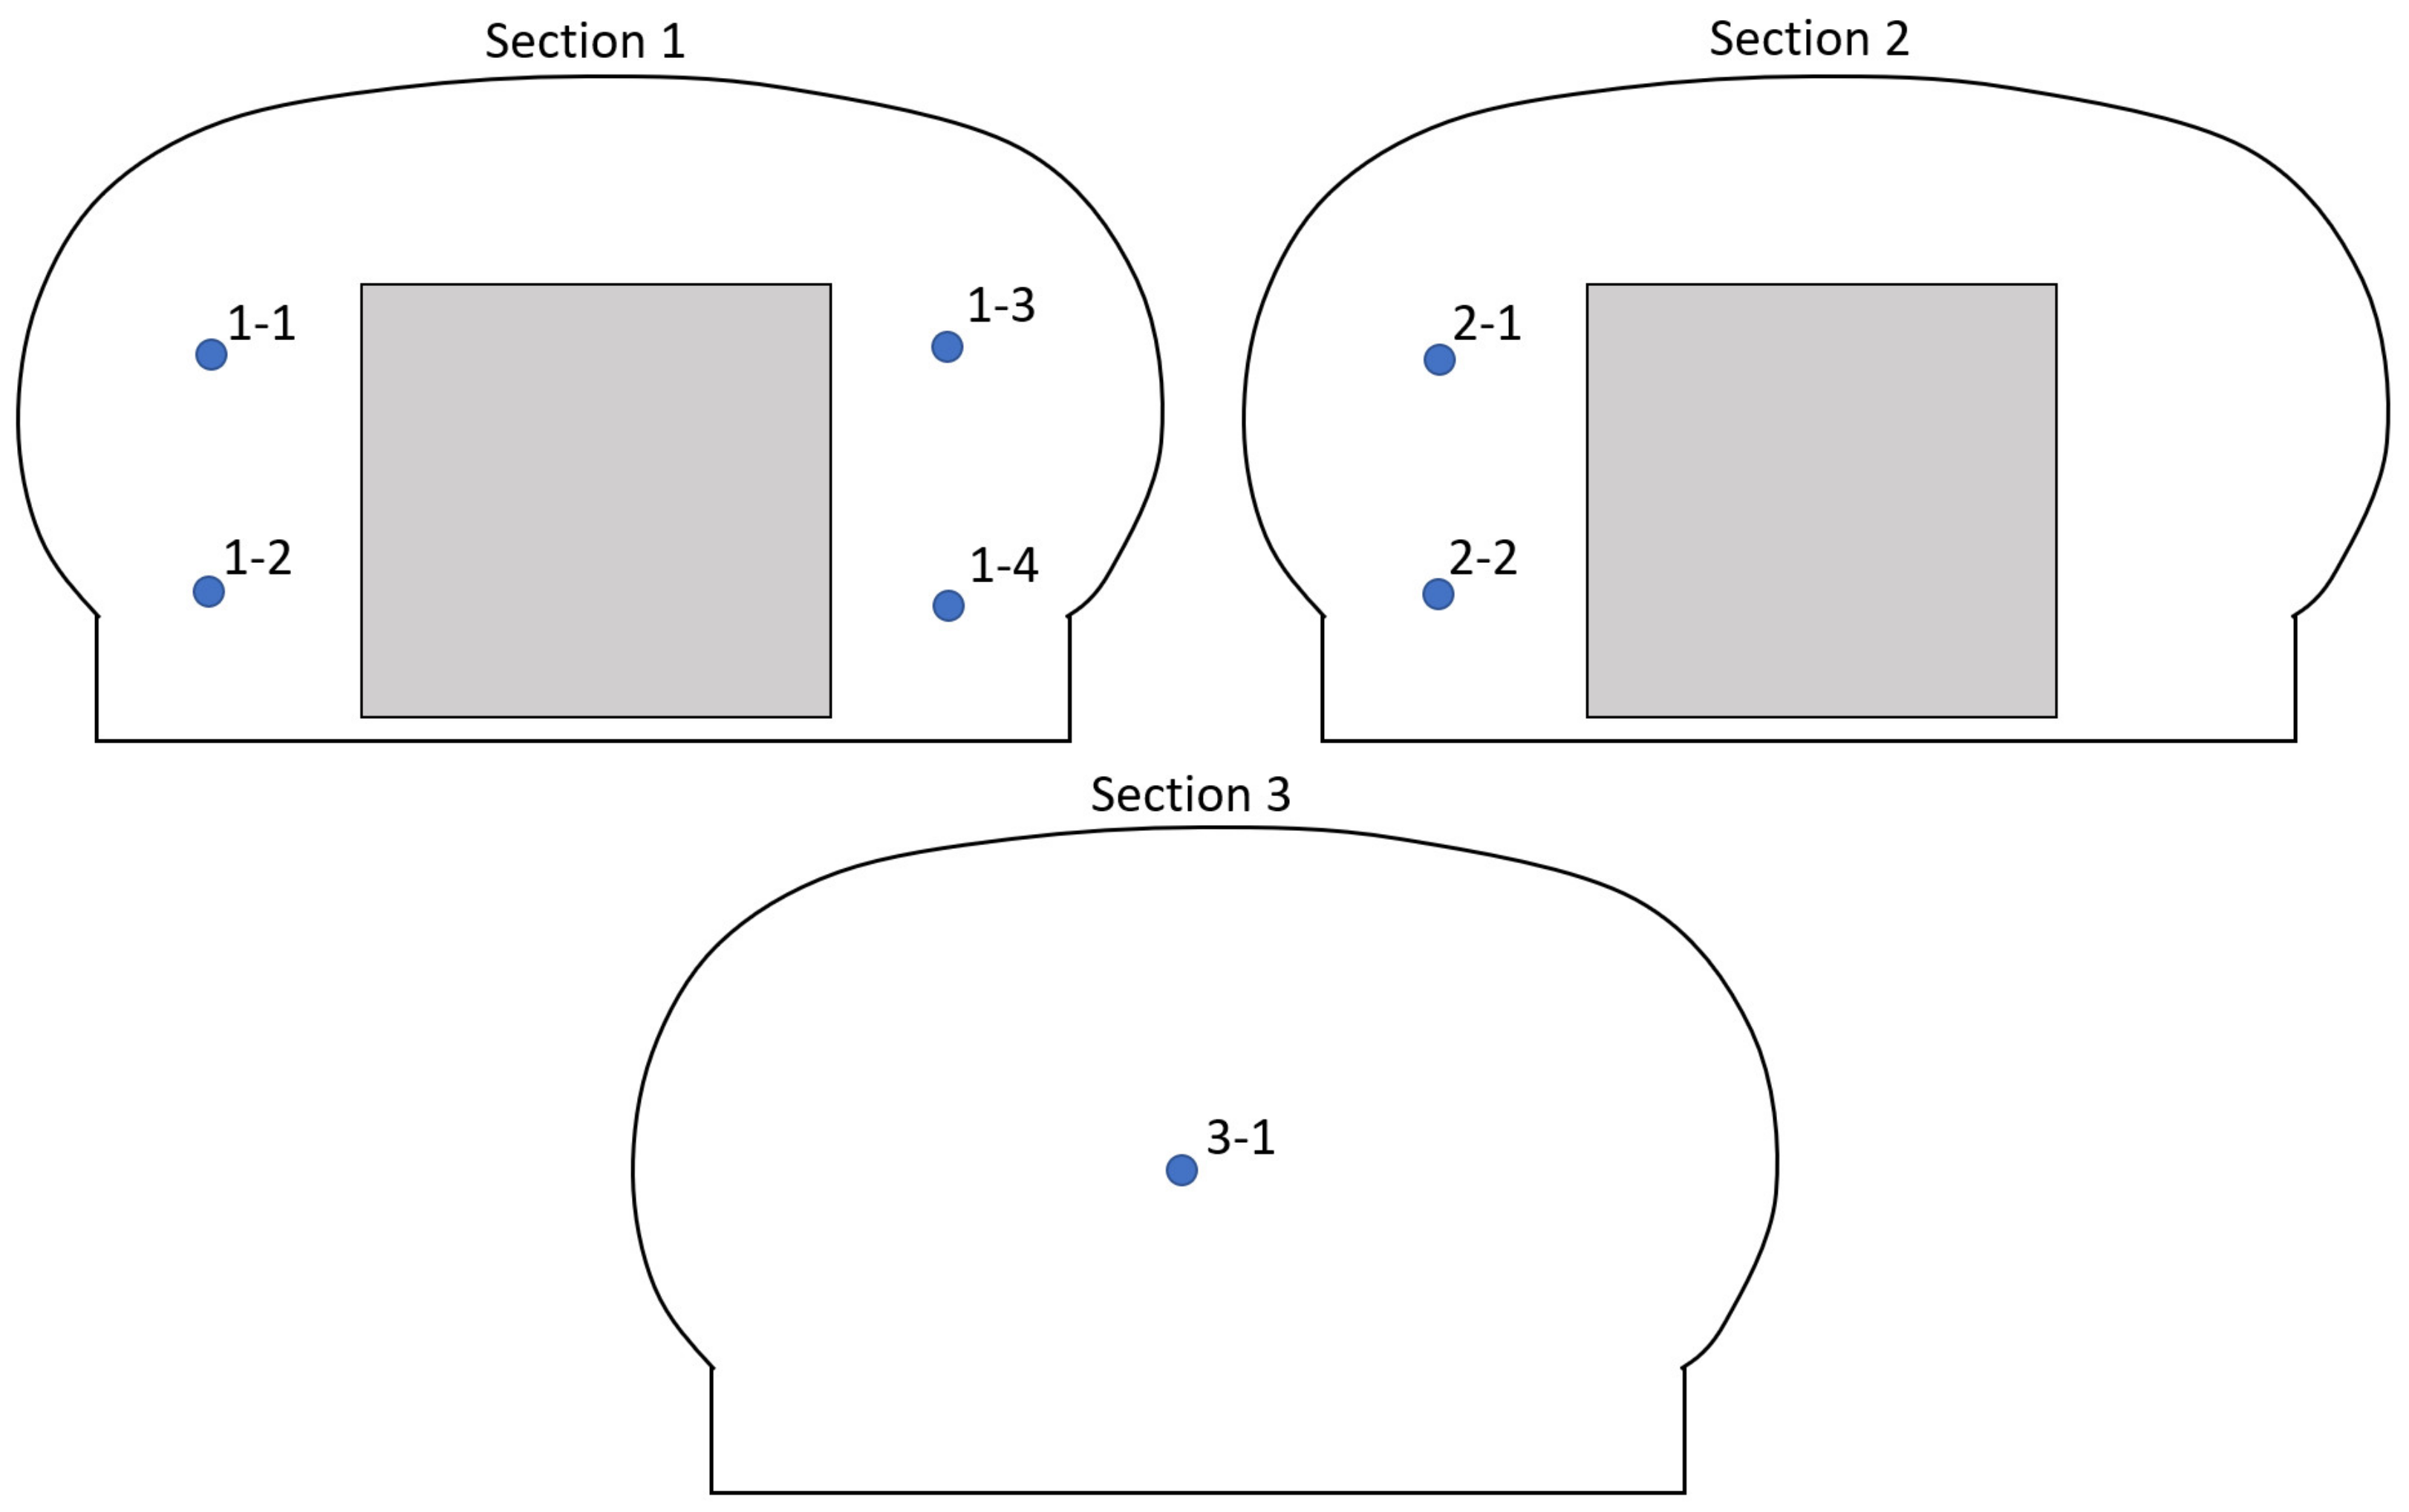
Figure 2 shows the measurement points for each measurement section. The combine driver’s cab is located in Section 1 and corresponds to measuring points 1-1 and 1-2. At each point, a series of measurements of the dust concentration was carried out; the arithmetic mean was then calculated. A portable dust analyzer Testo CEL-712 Microdust Pro was used. The measurement range of dust mass concentration is 0.1–1500 mg/m
3 and the relative error is less than ±10% (after a preliminary verification procedure). The air flow velocity at each point was measured using APR-2 anemometer with an absolute error equal to 0.03 + 0.02 × V(m/s). For each point, the velocity and mass concentration of dust were measured continuously for 0.5–1 min, after which the time-averaged value was calculated.
Table 1 shows the results of measurements of the mass concentration of dust for each case at measuring points located in Sections 1, 2, and 3. In general, we found that for all three cases, there are local zones in the dead-end drift with a high dust concentration of more than 90 mg/m
3 (mainly in Section 1). On average, the concentrations for all three cases are comparable (for the second case, the concentrations are slightly higher). The standard deviations of the dust concentrations for each case are also comparable. The results do not allow us to conclude that one ventilation system or another is superior solely based on experimental measurements. At the same time, it is important to note that the air flow rate in case 3 is 2.5 times lower than for cases 1 and 2.
At the measuring points corresponding to the combine driver’s cab, the lowest dust concentrations were measured for the first and third cases. This is explained by the following facts: In the first case, there is intense mass transfer around the cab due to the influence of a stream of fresh air coming out of the ventilation duct. The measured local air velocity in this zone for case 1 is 2–2.5 m/s. As a result, the dust is diluted in a sufficiently large volume of air, and its concentration drops. In the third case, the dust source closest to the driver’s cab (transfer bin) does not have time to significantly affect the air quality in the cab zone, since convective mass transfer dominates and is directed towards the ventilation duct on the right side of the combine. When operating with the concepts “right side" and "left side" of the combine, it is assumed that the observer is at the mouth of a dead-end drift-in this case, the driver’s cab for the observer is to the left of the combine.
At the same time, the air velocity near the driver’s cab for the third case is significantly lower than for cases 1 and 2 and varies in the range of 0.17–0.37 m/s. Thus, the relatively low air velocity provides more comfortable working conditions.
The maximum measured dust concentration was about 110 mg/m
3, which corresponds to a dust volume concentration of less than 0.00001%. At the same time, local dust concentrations near the combine shield and transfer bin will be significantly higher; however, in general, it can be concluded that for most of the air space of a mine working, the thesis that the volume concentration of dust does not exceed 0.1% is correct. Considering that the average size of dust particles for the Verkhnekamskoye deposit does not exceed 10 µm [
5], it is appropriate to use the single-velocity continuum approach to model the distribution of dust in a dead-end drift, since the dust does not significantly affect the dynamics of air flows in a dead-end drift, and the interaction between individual dust particles is insignificant. In this sense, the dust aerosol behaves like a homogeneous multicomponent mixture (while not being one in essence).
The minimum measured dust concentration is about 30 mg/m3. This is true even for the exhaust ventilation, although for it at point 3-1 the air must be clean. However, under real conditions, the ventilation duct through which dusty air is removed is rarely completely sealed. It consists of separately interconnected elements through which a small amount of dusty air enters the atmosphere of the drift. The resulting background concentration of dust (about 30 mg/m3) characterizes the tightness of the ventilation duct.
This section does not contain analysis of the airflow distribution within the considered cases, since this analysis is conducted in the following sections of the article during model validation.
3. Mathematical Model and Its Numerical Implementation
At the next stage of the study, we formulated a mathematical model that describes the spread of dust in a dead-end drift during the operation of a combine. The main assumptions are presented below:
The dust particles do not affect the air flow and move along with it (the dust aerosol is a one-velocity continuum);
The dust particles are of the same size and do not interact with each other, and do not absorb moisture from the air;
The dust–air mixture behaves like an incompressible medium;
The density of dust–air mixture depends on temperature;
There exists a local thermodynamic equilibrium between phases;
The distribution of all parameters of the dust–air mixture is stationary;
Gravitational settling and coagulation of dust particles are not considered.
Assumption 7 is possible due to the high velocities of the air in the dead-end drift and its relatively small length. The characteristic times of gravitational settling and coagulation of dust particles turn out to be significantly higher than the characteristic time of dust particle presence in the considered section of the mine until it enters the ventilation duct or leaves the part of the drift under consideration.
The model is based on the mass, momentum, and energy balance equations in the steady-state formulation written for the mixture as a whole:
where
is the velocity vector of the dust–air mixture in m/s,
is the pressure in Pa,
and
are molecular and turbulent viscosities in Pa·s,
is the density of the dust–air mixture in kg/m
3,
is the gravity vector in m/s
2,
is the specific internal energy of the dust–air mixture in J/kg,
and
are molecular and turbulent thermal conductivities in W/(m·°C), and
is the temperature in °C.
The specific internal energy of the dust–air mixture depends on the temperature according to the following relation:
where
is the velocity magnitude of the dust–air mixture in m/s and
is the specific heat capacity of the dust–air mixture in J/(kg·°C).
The system is supplemented by the ideal-gas equation of state:
where
is the individual gas constant for air in J/(kg·°C).
Turbulent viscosity and thermal conductivity are determined based on the characteristics of the turbulent flow—in this case, the turbulent kinetic energy
k and the dissipation rate of the turbulent kinetic energy,
ε [
31]:
where
is the model constant and
is the turbulent Prandtl number.
The realizable k-ε turbulence model [
32] is used to close the above system of equations. The
parameter in Equation (6) is calculated using the formula:
where
is the symmetric part of the strain rate tensor in 1/s,
is the asymmetric part of the strain rate tensor in 1/s,
is the Levi-Civita tensor,
is the vector of the angular velocity of the dust–air mixture in 1/s, and
and
are the model parameters.
In accordance with the realizable
k-ε model, the evolution of turbulent kinetic energy and dissipation rate are described by the equations:
where
,
, and
are the terms that characterize the generation of turbulent kinetic energy measured in kg/(m·s
3) and
and
are the model parameters.
The model constants are as follows:
The Menter-Lechner model [
33] was used to describe the flow behavior in a thin boundary layer near the solid walls. The essence of this model is the source term
in the turbulent kinetic energy equation, which accounts for near-wall effects. The additional term
is non-zero only in a viscous sublayer near the solid walls. In the logarithmic region, it automatically becomes zero.
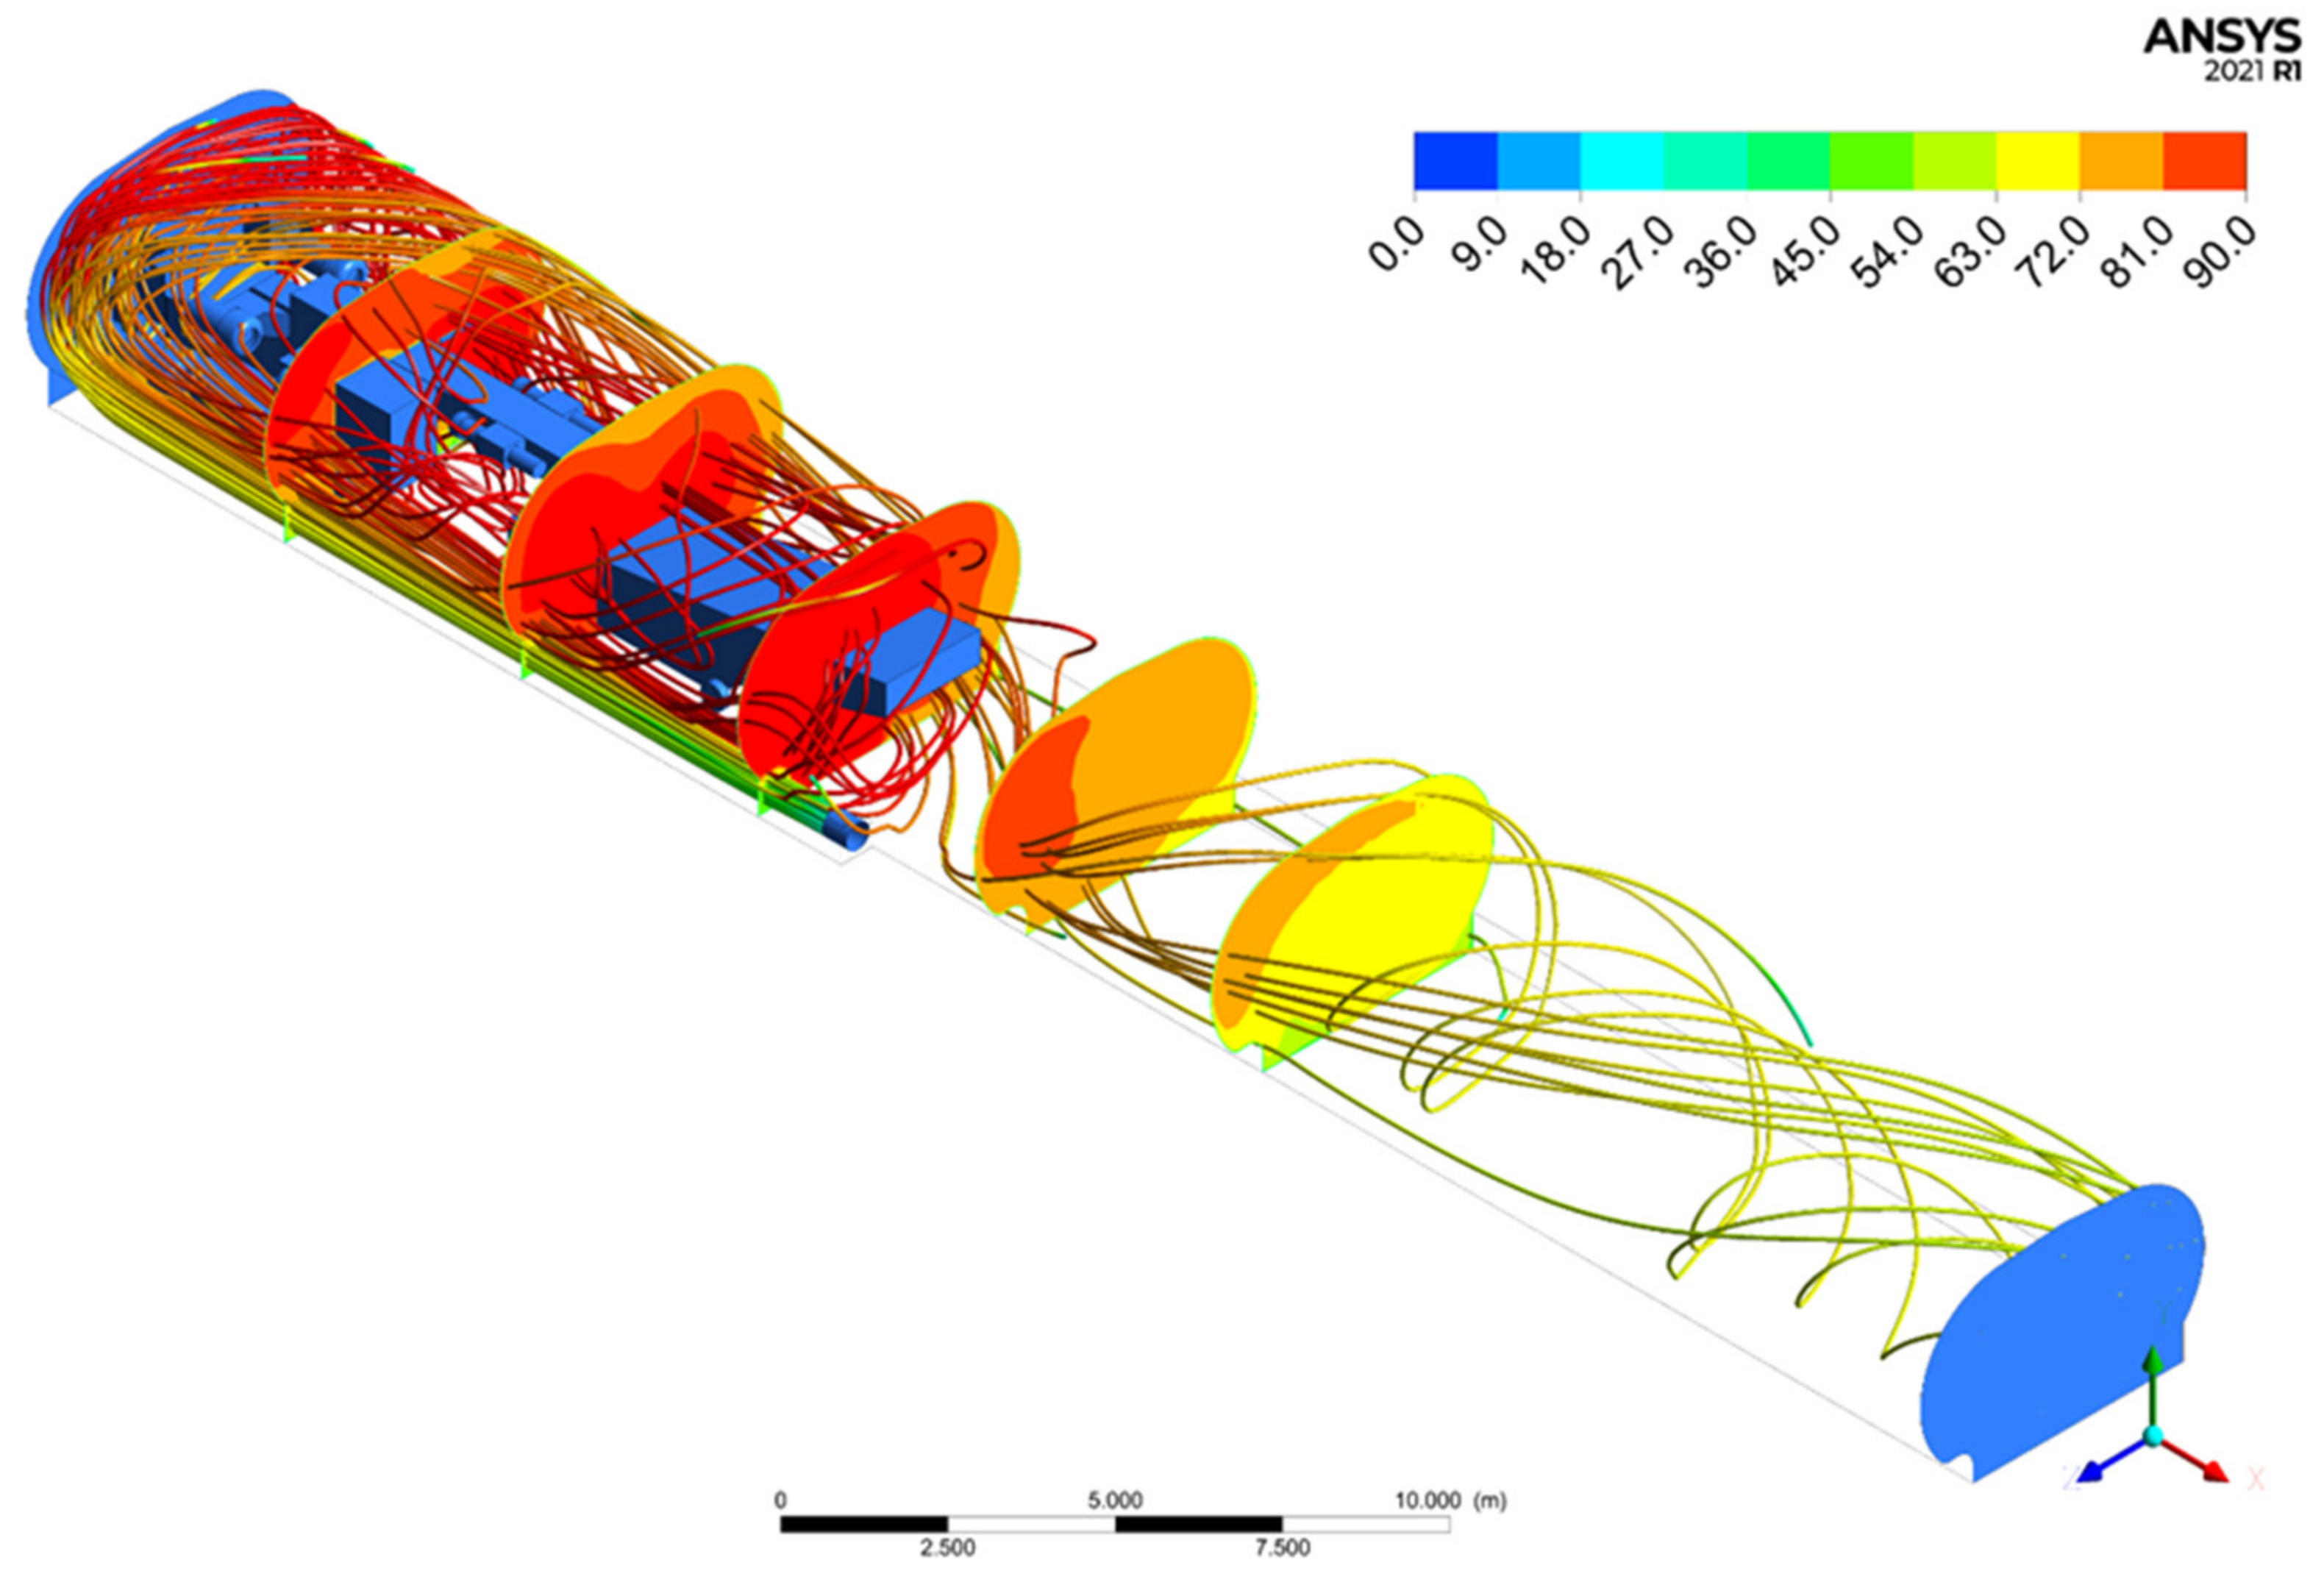
Combine engines are equipped with cooling systems (small fans), through which air is forced to flow at a certain rate. To take this factor into account in the model, a condition was set on the internal surfaces of the five engines of the combine in the form of a fixed tangential velocity component (see
Figure 3a). In most calculations, the tangential velocity component is assumed to be 5 m/s. This made it possible to obtain air flow through the engine comparable to the real one. The value of the tangential velocity was determined based on experimental measurements of air circulation in the engines.
At the outflow of the ventilation duct, the air velocity was fixed. The air velocity value is positive with the forced ventilation system and negative with the exhaust ventilation system. The static pressure was set to zero at the mouth of the dead-end drift.
The temperature of the drift walls was assumed to be 10 °C. At the same time, the temperature of the internal surfaces of the combine engines is 50 °C, which was also selected based on experimental studies of the temperature of the air leaving the engines during the operation of the combine. On the walls of the combine, a condition of no heat flow was imposed. The temperature of the air entering the computational domain was assumed to be 10 °C.
The dynamics of the salt dust were described using a simple convection-diffusion model of passive impurity. In this case, due to the low concentration of dust over the course of the numerical simulation, it was convenient to introduce a dimensionless concentration
. The value of the dust concentration near contaminated surfaces is taken as a unit of measurement of the concentration
, i.e., the maximum concentration of dust in the drift, while the zero value of the dimensionless concentration corresponds to the background level of dust content at the drift’s mouth. The distribution of dust is determined from the transport equation:
where
is the diffusion coefficient measured in m/s
2, adjusted according to the experimental data and
is the coefficient of turbulent diffusion in m/s
2, calculated as the ratio of the turbulent viscosity and the turbulent Schmidt number for air.
As noted above, the process of dust formation is observed mainly near the combine protective shield and the upper part of the transfer bin. In this regard, the proposed model considers two surface sources of dust. The first is located on the surface of the combine protective shield, the second on the upper surface of the transfer bin (see
Figure 3b). On these surfaces, the boundary condition (in terms of the dimensionless concentration)
was set. At that, the space behind the protective shield, where the executive body operates, is not considered in the model.
It is important to note that the chosen source boundary condition is atypical for the study of dust aerosol dynamics in mines. In works related to the modeling of coal dust in longwalls, a constant dust flow boundary condition is most often used [
34]. This is reasonable if the dust inflow from the object generating this dust is modeled explicitly, or the experimental data are used. In our case, the dust generation surfaces are effective surfaces; that is, dust generation does not occur directly on them. For example, in the case of a transfer bin, because of crushed ore from the combine boom falling into the hold of the transfer bin, a dust cloud is formed above the hold, partially limited by the walls of the hold. In this case, there is both a constant influx of dust mass to the dust cloud, and a constant outflow due to local settling of dust back into the hold, as well as due to convective transfer of dust by the air flowing through the dust cloud. In this case, it is assumed that approximately the same concentration of dust is maintained in the steady dust cloud. As such, under the chosen effective dust formation surface in
Figure 3b, one can understand the conventional boundary of this dust cloud. This assumption is valid when the intensity of convective dust transfer from the cloud is lower than the intensity of dust release as a result of falling crushed ore. At the same time, an increase in the air flow passing through this source of dust formation leads to increase in the dust captured and transferred by the air.
It was assumed that dust settles on the drift walls. For this reason, the boundary condition was set on the walls. In contrast to the working surface, a combine is in high-dust conditions for a long time and its surface is usually covered with a significant layer of dust. Therefore, it is more difficult for dust particles to cling to the surface of the combine. In addition, the walls of the combine usually have a relatively low roughness and are subject to vibrations during its operation. To consider the described effects on the combine walls, the boundary condition was set, where n is the normal vector to the boundary. This corresponds to the case in which the processes of settling and escape of dust particles from the wall occur with the same intensity and, thus, compensate each other.
It is important to note that the model does not consider the processes of coagulation and condensation of salt aerosol particles in the interior points of the domain. These physical processes can be significant if we consider a sufficiently long movement of salt aerosol along sufficiently long tracts under conditions of high relative humidity of the flow [
35]. In the present work, a relatively short domain is considered. The characteristic time for a dust particle to pass through this drift is rather short, and the relative air humidity is low (about 30%, according to the experimental data), so that the particles do not absorb moisture and do not have time to coagulate.
The dimensional concentration of dust was calculated by the formula:
where
is the dust concentration in the drift far from dust sources (background level) in mg/m
3,
is the average dimensionless dust concentration calculated during the simulation, and
r is the model parameter that has the dimension of dust concentration and is adjusted on the basis of the available experimental data on the dust concentrations, measured in mg/m
3.
The average dimensionless concentration was calculated over the course of the simulation from the average dust concentration at the boundary through which the air leaves the computational domain. In case of an exhaust ventilation system, this is the ventilation duct, and in the case of forced ventilation system, it is the drift’s mouth.
The computational domain was a dead-end drift 50 m long. The vertical section of the drift is shown in
Figure 2 and
Figure 3. Numerical simulation was carried out for a simplified model of a combine, which incorporated all the large elements that affect the dynamics of air and dust (see
Figure 3). The subsequent detailing of the model leads to an exponential increase in the finite volume count in the computational mesh and to worsening of the convergence of the solution. This is related to the appearance of complex connections between individual parts of the combine and thin flow areas between them.
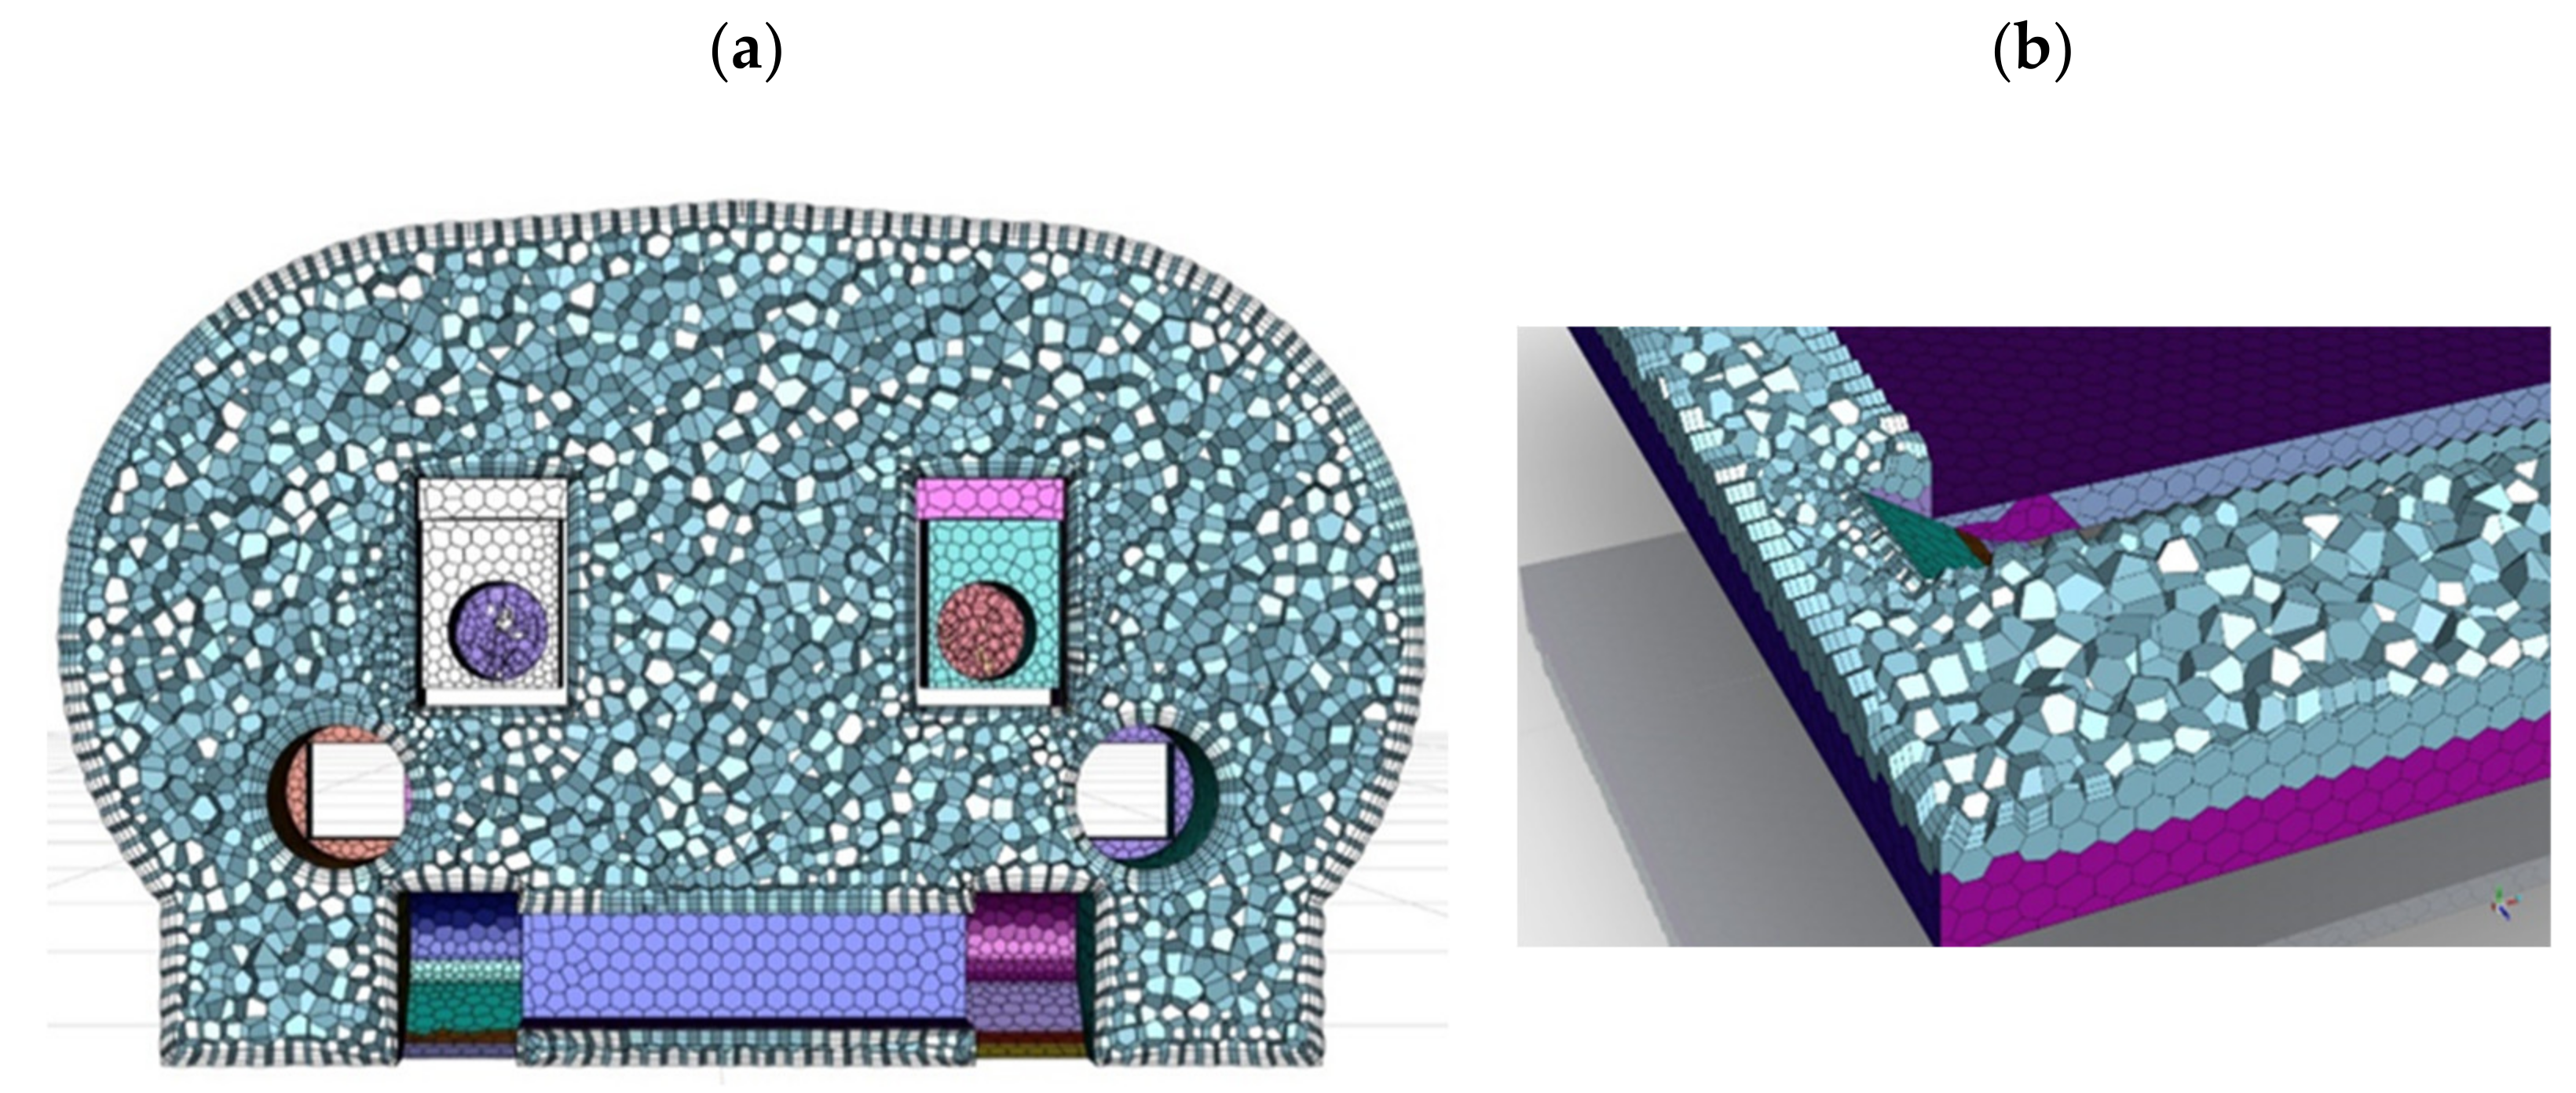
At the first stage of creating the computational mesh, a hexagonal two-dimensional mesh was generated at all boundaries of the computational domain. Then, a three-dimensional mesh was built considering the boundary layer near solid surfaces. The volume mesh consisted of polyhedra (see
Figure 4). The choice of this type of element is due to a significant reduction in the number of finite volumes compared to a tetrahedral mesh. As a result, the solution convergence becomes faster and the amount of memory required for the calculation is reduced. In the case of the forced ventilation system, the computational mesh consists of 4.6 million nodes and 1.2 million finite volumes (or cells).
The spatial discretization of the equations was carried out using Monotonic Upstream-centered Scheme for Conservation Laws (MUSCL) scheme that was third-order in accuracy [
36]. The method of pseudo-evolutionary equations was used. While solving the stationary problem, iterations were carried out over the effective time until the stationary solution was reached.


