Article

Not Only Trees Matter—Traffic-Related PM Accumulation by Vegetation of Urban Forests

by
Robert Popek
1,*,
Beata Fornal-Pieniak
2,
Filip Chyliński
3,
Magdalena Pawełkowicz
4,
Jan Bobrowicz
3,
Dominika Chrzanowska
1,
Natalia Piechota
1 and
Arkadiusz Przybysz
1
1
Section of Basic Research in Horticulture, Department of Plant Protection, Institute of Horticultural Sciences, Warsaw University of Life Sciences—SGGW, Nowoursynowska Street 159, 02-776 Warsaw, Poland
2
Department of Environmental Protection and Dendrology, Institute of Horticultural Sciences, Warsaw University of Life Sciences—SGGW, Nowoursynowska Street 159, 02-776 Warsaw, Poland
3
Instytut Techniki Budowlanej, Filtrowa Street 1, 00-611 Warsaw, Poland
4
Department of Plant Genetics, Breeding and Biotechnology, Institute of Biology, Warsaw University of Life Sciences—SGGW, Nowoursynowska Street 159, 02-776 Warsaw, Poland
*
Author to whom correspondence should be addressed.
Sustainability 2022, 14(5), 2973; https://doi.org/10.3390/su14052973
Submission received: 2 February 2022 / Revised: 24 February 2022 / Accepted: 1 March 2022 / Published: 3 March 2022
(This article belongs to the Topic Urban Biodiversity and Design)

Abstract

:
In terms of the process of air purification, a lot of attention has been devoted to trees and shrubs. Little attention has been paid to herbaceous vegetation from the lower forest layers. Urban forests are often located on the outskirts of cities and surround exit roads where there is heavy traffic, generating particulate matter (PM) pollution. The aim of this study was to investigate the spread of PM from the road traffic in the air and to investigate how individual layers of urban forests accumulate PM. We conducted comparative analyses of PM accumulation on plants in five zones away from the road, into the forest, in the air, and in four vegetation layers: mosses, herbaceous plants, shrubs and trees. The results show that all forest layers accumulate PM. We show that PM is very efficiently accumulated by herbaceous plants growing along roadsides, and that the PM that was not deposited on herbaceous plants was accumulated by trees and shrubs. With increasing distance from the road into the forest, the PM content on herbaceous plants decreased and the accumulation on trees and shrubs increased. We estimated that PM concentration in the air dropped significantly in the front line of the trees, but it was still detectable up to 50 m into the forest. The results presented herein show that meadow vegetation and urban forests play a very important role in air purification. Our results provide a better understanding of the complexity of urban forest interactions and provide the basis for better planning of urban greenery.

1. Introduction

Urbanisation is a process that causes many negative modifications in the city environment, such as temperature increase (up to 3–10 °C, Urban Heat Island effect) and soil and atmospheric pollution, particularly of traffic origin (nitrogen oxides, sulphur dioxide, ozone, particulate matter—PM10 and PM2.5) [1,2,3]. The health effects of exposure to air pollution related to traffic (TRAP—traffic-related air pollution) have been thoroughly studied [4,5,6,7]. A significant negative relationship between human health and particulate matter (PM) has been found [7,8]. Due to its strong, adverse health effects and high concentration, especially in urban areas, PM is ranked first among air pollutants that threaten health and life by the WHO [5]. Especially dangerous is small PM, which poses a great threat to human health and life [7,8]. In the case of PM2.5 (or smaller PM) it is difficult to determine a safe level below which there are no adverse health effects [5]. Reports from the World Health Organization indicate that long-term exposure to PM pollutants leads to shorter life expectancy [5]. Exposure to PM pollution may cause respiratory irritation, coughing, breathing problems, worsening of asthma symptoms, decreased lung function and in extreme situations heart rate disturbance, and even heart attack or premature death in people with respiratory and circulatory problems [9].
The degrees and types of pollution are diversified in European countries [10]. Transport emissions are one of the main global sources of pollution, including particulate matter (PM) in urban areas [11,12], which also holds true in Poland [13]. The roadside concentrations of PM decrease with the distance from the road; however, pollution emitted by transport vehicles can be present in the air even 50–100 m from the road source [14,15]. The common opinion is that road PM has a maximum range of several dozen meters (up to 100 m) in terrain, not limited by physical barriers [16]. Conversely, Wu et al. [17] showed that in Macao (China), over the total measured distance from the road (0–228 m), the maximum decreases of PM10, PM2.5 and PM1 were only 7%, 9%, and 10% of the maximum occurring at 2 m from the road, respectively. Transport vehicles emit various dangerous air pollutants, e.g., exhaust fumes; however, the largest share in the pollution emitted from roads is non-exhaust road emissions [11,18]. Non-exhaust sources account for 90% of PM10 and 85% of PM2.5 from traffic [18] and are the result of tire wear, brake wear, road surface wear, and resuspension of road dust [19,20].
Global strategic action, considering sustainable development, adaptation to climate warming, and the mitigation of pollutants (including air pollution), has focused on a green economy [21], comprising the creation of green infrastructure (GI) in urban areas. Urban ecosystems are typically fragmented areas, where natural spaces are adjacent to residential, industrial, or business zones, crisscrossed by roads and sidewalks, and belong to the “green infrastructure” of the city. Urban forests are one of the basic patches of “green infrastructure”, performing biological diversity functions according to European Union law [22]. The urban forest is usually a natural space with vegetation, including mosses, herbaceous plants, shrubs and tree layers in a city [23]. With the development of urbanisation, the ecological value of urban forests, which improve urban environmental quality, have become important [24,25]. Urban forests occupy almost 120,000 ha in Polish cities [26]. Generally, the flora of urban forests is more disturbed than in forests located outside of the city [27] because of the urbanisation process [3,28], but these forests still serve many positive ecological functions as reservoirs of biodiversity of flora and fauna and in their role as shaping the main ecological corridors of the city [25,29].
Plants are currently the only effective tool to reduce PM air pollution in larger areas, such as big urban agglomerations [30]. Quantifying the amount of PM that deposits and accumulates on different plant species was studied by Popek et al. [31], Mo et al. [32], Chen et al. [33], and Przybysz et al. [34]. It was confirmed by these authors that plants serve as natural filters; however, every plant species has a different ability to accumulate PM. Most studies are focused on parks, roadside vegetation, street trees, hedges, shrubs, green walls, and green roofs located in city centres, the most representative and densely populated places, where they mitigate pollution impacts. The places with the most polluted air in cities are, however, located elsewhere, e.g., on routes leading out of cities and industrial areas [35]. Urban greenery in these locations is the most important and often the only barrier between very high PM pollution and inhabited areas [34]. Despite the fact that researchers have developed successful algorithms for air pollution spreading [36,37], there is still a lack of such models for plant communities, especially for urban forests. A holistic understanding and improvement of the efficiency of urban greenery in places with the most polluted air may be critical in reducing the negative impact of PM on city dwellers. The research must take into account that urban green areas (including urban forests) have diversified vertical and horizontal structures of vegetation. For this reason, our innovative approach is to assess the effectiveness of PM accumulation by studying all of the vegetation growing on polluted exit roads from a big European city.
We undertook the problem of analysing the surroundings of the city’s exit road and determining the distribution of PM in the context of developing a vegetation barrier in order to manage urban pollution prevention. The purpose of the study was to analyse and understand PM accumulation using entire plant communities, consisting of mosses, herbaceous plants, shrubs, and tree layers, depending on the distance from the source of pollution (road). The proposed methodology takes into account the influence of the chemical composition and origin of PM on its distribution in the urban forest. Our results will provide a better understanding of the role of large plant communities in air purification processes. These analyses focused on the verification of three hypotheses: (1) All forest vegetation layers—mosses, herbaceous plants, shrubs, and tree layers—accumulate PM. (2) The chemical and physical composition of PM close to the road is different than that further into the forest. (3) The use of well-designed and diversified urban greenery reduces the concentration of PM in the air. We demonstrated differences and similarities between the accumulation of PM in specified zones and clearly described guidelines for the type and quality of vegetation barriers with better protective properties for the environment and for humans.

2. Materials and Methods
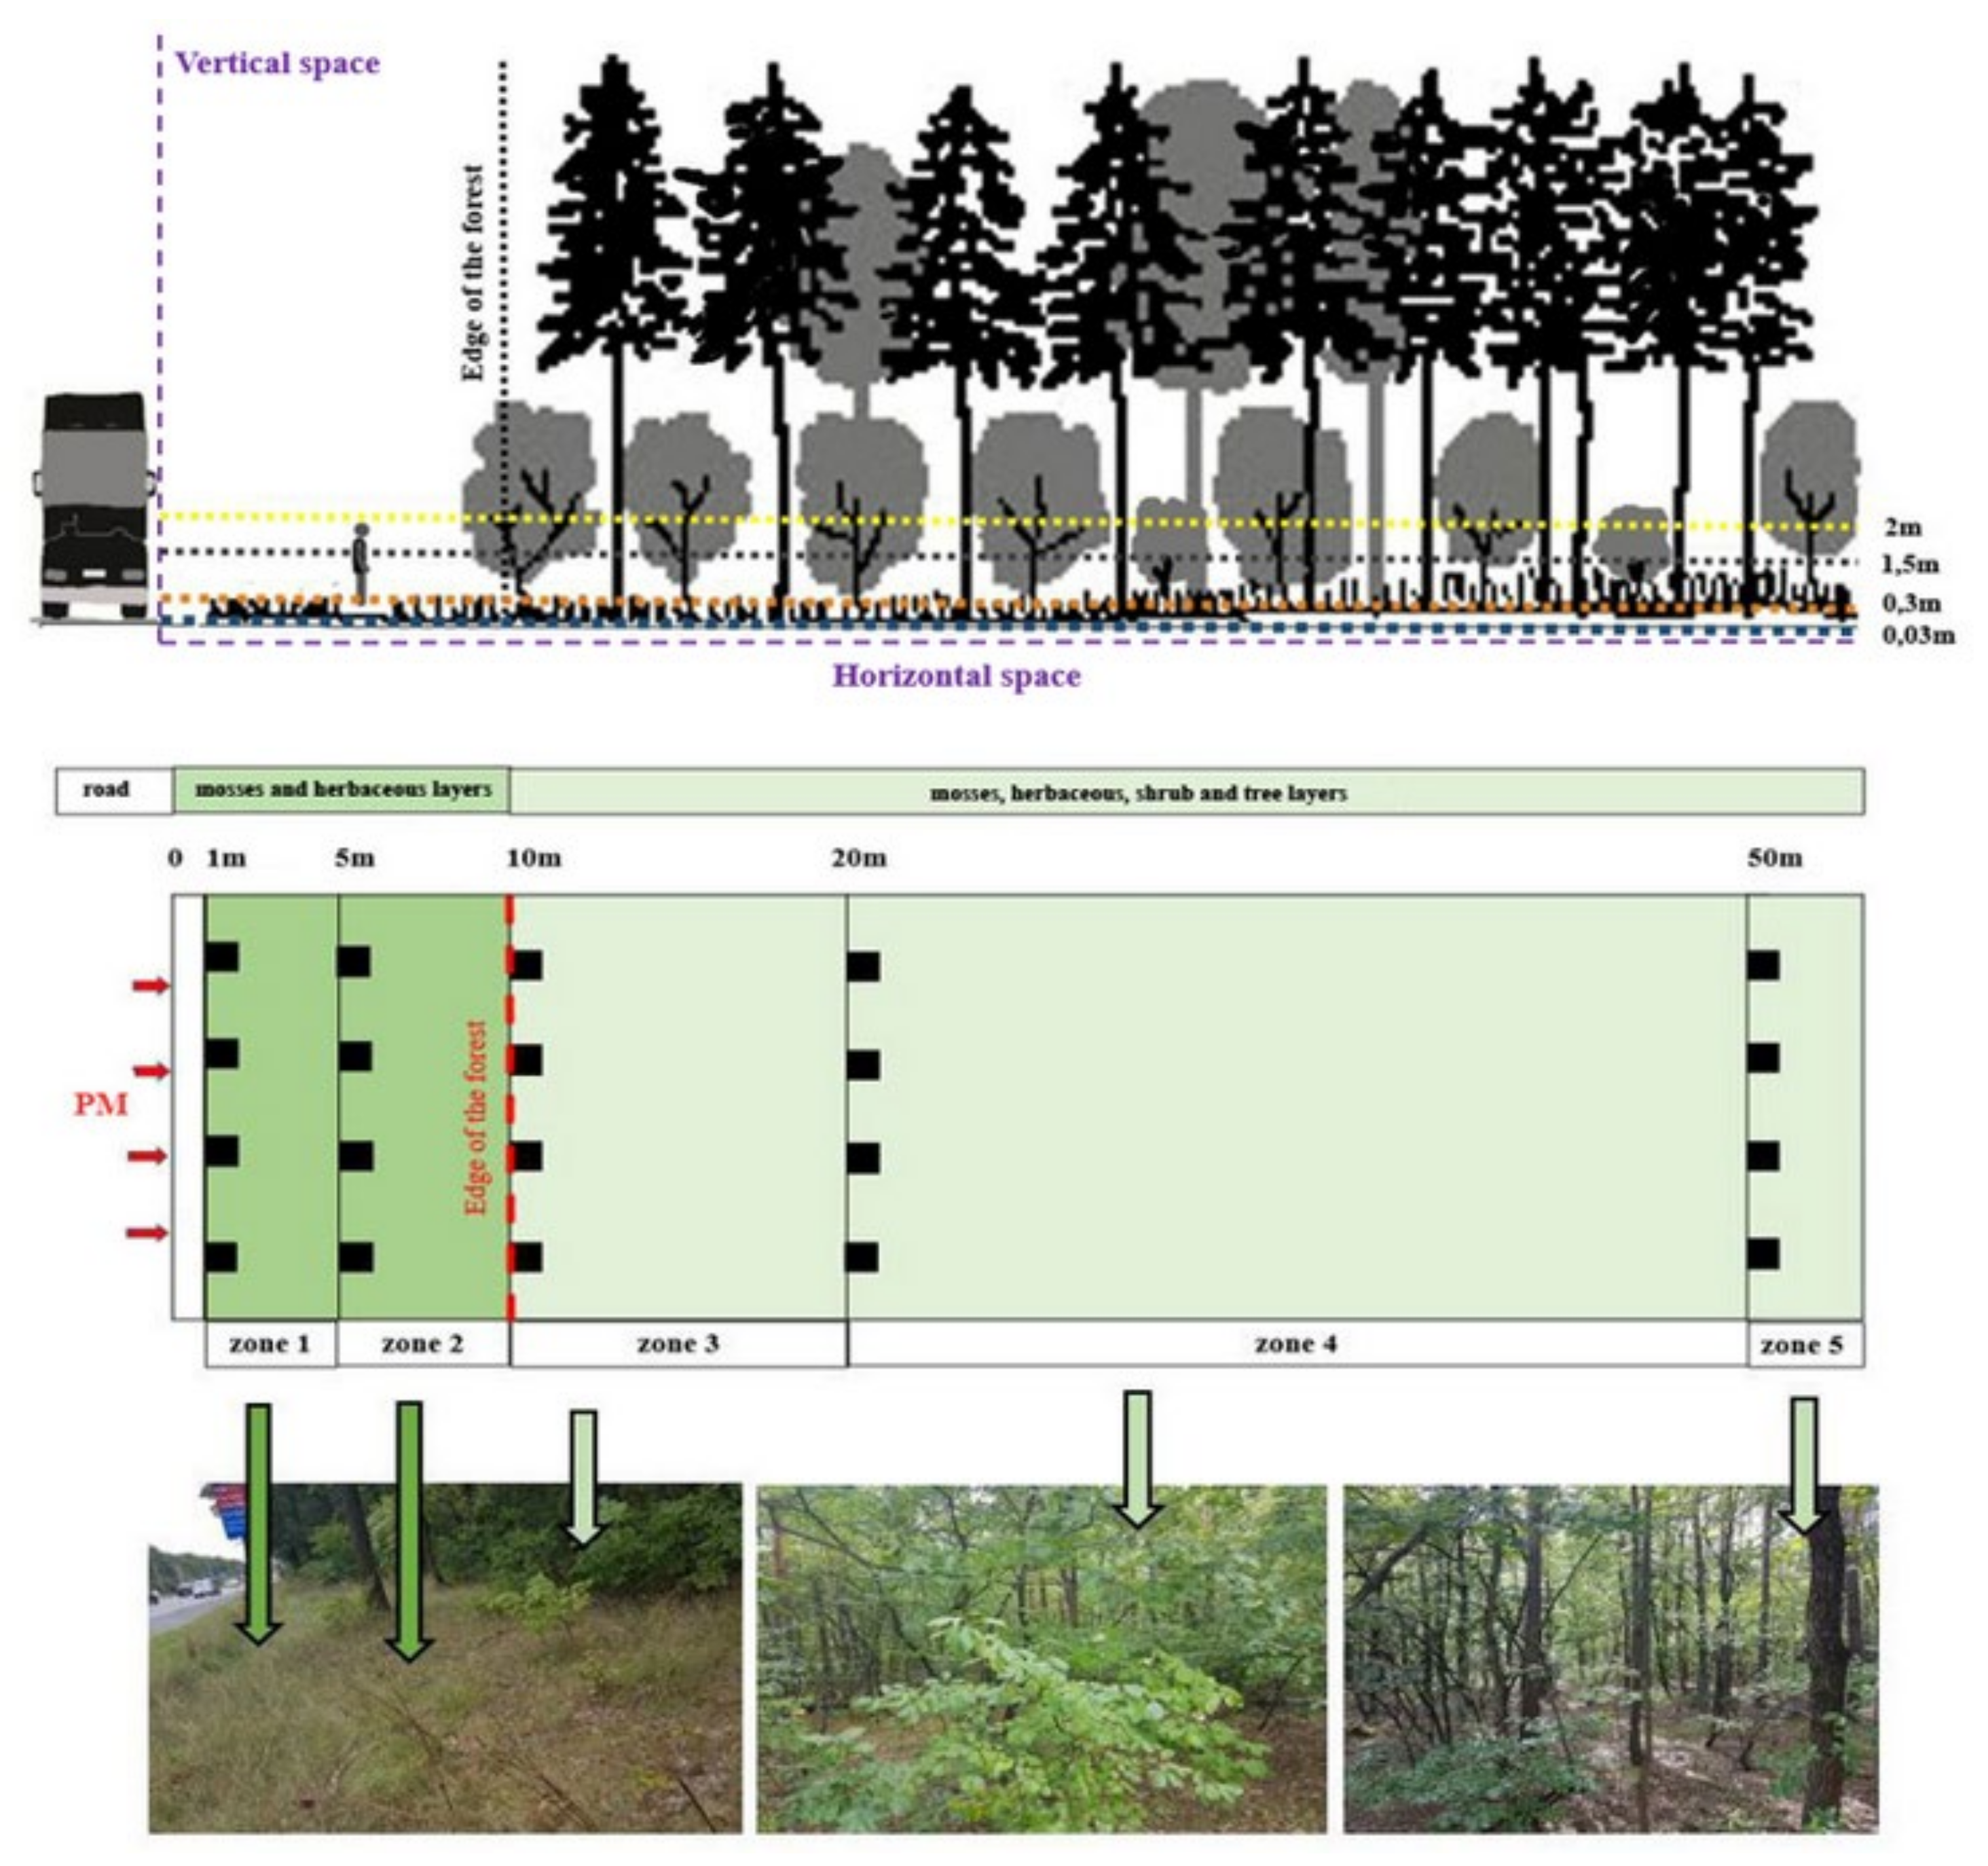
2.1. Study Area

Studies were conducted in 2020 in Warsaw (Poland) (at 52°14′ N and 21°1′ E), which has a population of 1.8 million. Warsaw, the capital city of Poland, is situated on the bank of the Vistula River, in the heartland of the Masovian Plain (Figure 1). Warsaw has a humid continental climate, with cold winters and warm summers, and it also borders an oceanic climate. Like other Polish cities, Warsaw is struggling with high air pollution, especially in the winter season (the average annual concentration of PM10 and PM2.5 was 44 µg·m−3 and 25 µg·m−3 for the city centre in 2018) [38]. The studied object was part of Młociny Forest, which is represented by fresh coniferous forest (Peucedano-Pinetum) growing on predominantly poor, sandy soil with a small amount of humus. Coniferous forests dominate in Warsaw [39]. Młociny Forest is situated on the north, near the entrance to the city. This forest is one of the main ecological corridors in the north part of the city. The forest is crossed by a road (S7 highway), with double traffic lines each way. The road is crowded because it is the main exit road leading to the Baltic Sea. The traffic of cars on the studied road is 64,997 cars/24 h [40].

2.2. Plant Sample Collection

One of the research goals was the identification of the composition of plant species in the study area, which was divided into two spaces: horizontal and vertical. In the horizontal space, we separated five zones from the source of pollution (road), depending on the distance from the road: 1, 5, 10, 20, and 50 m (Figure 2). The first two zones were represented by low vegetation, typical for spontaneous street greenery adjacent to the road, while zones No. 3, 4, and 5 were covered by mosses, herbaceous plants, shrubs, and trees. During the field studies, plants belonging to all vegetation layers (mosses, herbaceous plants, shrubs, and trees) were analysed. In the vertical space, we established four zones: mosses (up to 0.03 m); the herbaceous layer, including plants up to 0.3 m in height; the shrub layer, including species up to 1.5 m in height; and the tree layer, with tree species up to 2 m in height. Plant species were classified into vegetation groups: mosses, grasses (including grasses and herbaceous plants), synanthropic plants, shrubs, and trees, according to Matuszkiewicz [39]. The plant species were named according to Mirek et al. [41]. Each plant species in each zone was analysed according to the Braun–Blanquette method [42]. Plants were harvested from the five zones depending on their distance to the road: 1, 5, 10, 20, and 50 m. In the first two zones (1 m and 5 m) only mosses and herbaceous plants were collected because of the lack of shrubs and trees. In the other three zones (10 m, 20 m, and 50 m), plant samples were also harvested from shrubs and trees. Mosses were collected from the ground (squares 30 × 30 cm); herbaceous plants were represented mostly by grasses and herbaceous plants 30 cm tall (squares 100 × 100 cm); leaves from shrubs were taken from randomly selected plants from a height of 1.0–1.5 m; leaves from trees were taken from a height of 1.5–2.0 m. From each transect, leaves were taken from four random biological repetitions (n = 4 × 5 mosses + 4 × 5 herbaceous plants; 3 × 4 trees and 3 × 4 trees). Samples were collected in mid-September, at the end of the growing season. To ensure the PM deposition on plants, collection was made after a minimum of five days of dry weather, as rain washes PM away from leaves. Samples were placed in paper bags, labelled, and kept at ambient temperature awaiting analysis (Figure 2).

2.3. Quantitative Analysis of PM in Horizontal and Vertical Vegetation Zones

PM of two categories (PM water-washable from leaf surfaces—SPM; PM retained in leaf wax—WPM) and three size fractions (0.2–2.5, 2.5–10, and 10–100 µm) were determined using the method described by Dzierżanowski et al. [43]. A representative portion of each sample (about 300 cm2, to avoid clogging the pores of filters) was first washed with water to obtain surface PM (SPM) and then with chloroform to obtain the PM present in the epicuticular waxes (WPM). After passing the liquids through a sieve with a mesh size of 100 mm, they were filtered using three types of filters: Type 91 and Type 42 paper filters, and PTFE membrane filters (Whatman, Maidstone, UK), with pore sizes of 10, 2.5, and 0.2 µm, respectively. Before and after filtration, all filters were dried in a dryer, stabilised for humidity, and weighed to obtain three size fractions: large PM (10–100 µm), coarse PM (2.5–10 µm), and fine PM (0.2–2.5 µm). The quantity of waxes was weighed after the evaporation of the chloroform and collected (after filtration) in pre-weighed beakers. The amount of PM and wax was then recalculated to μg·cm−2 after measuring the leaf area of the samples taken for analysis (Image Analysis System, Skye Instruments Ltd., Llandrindod Wells, UK).

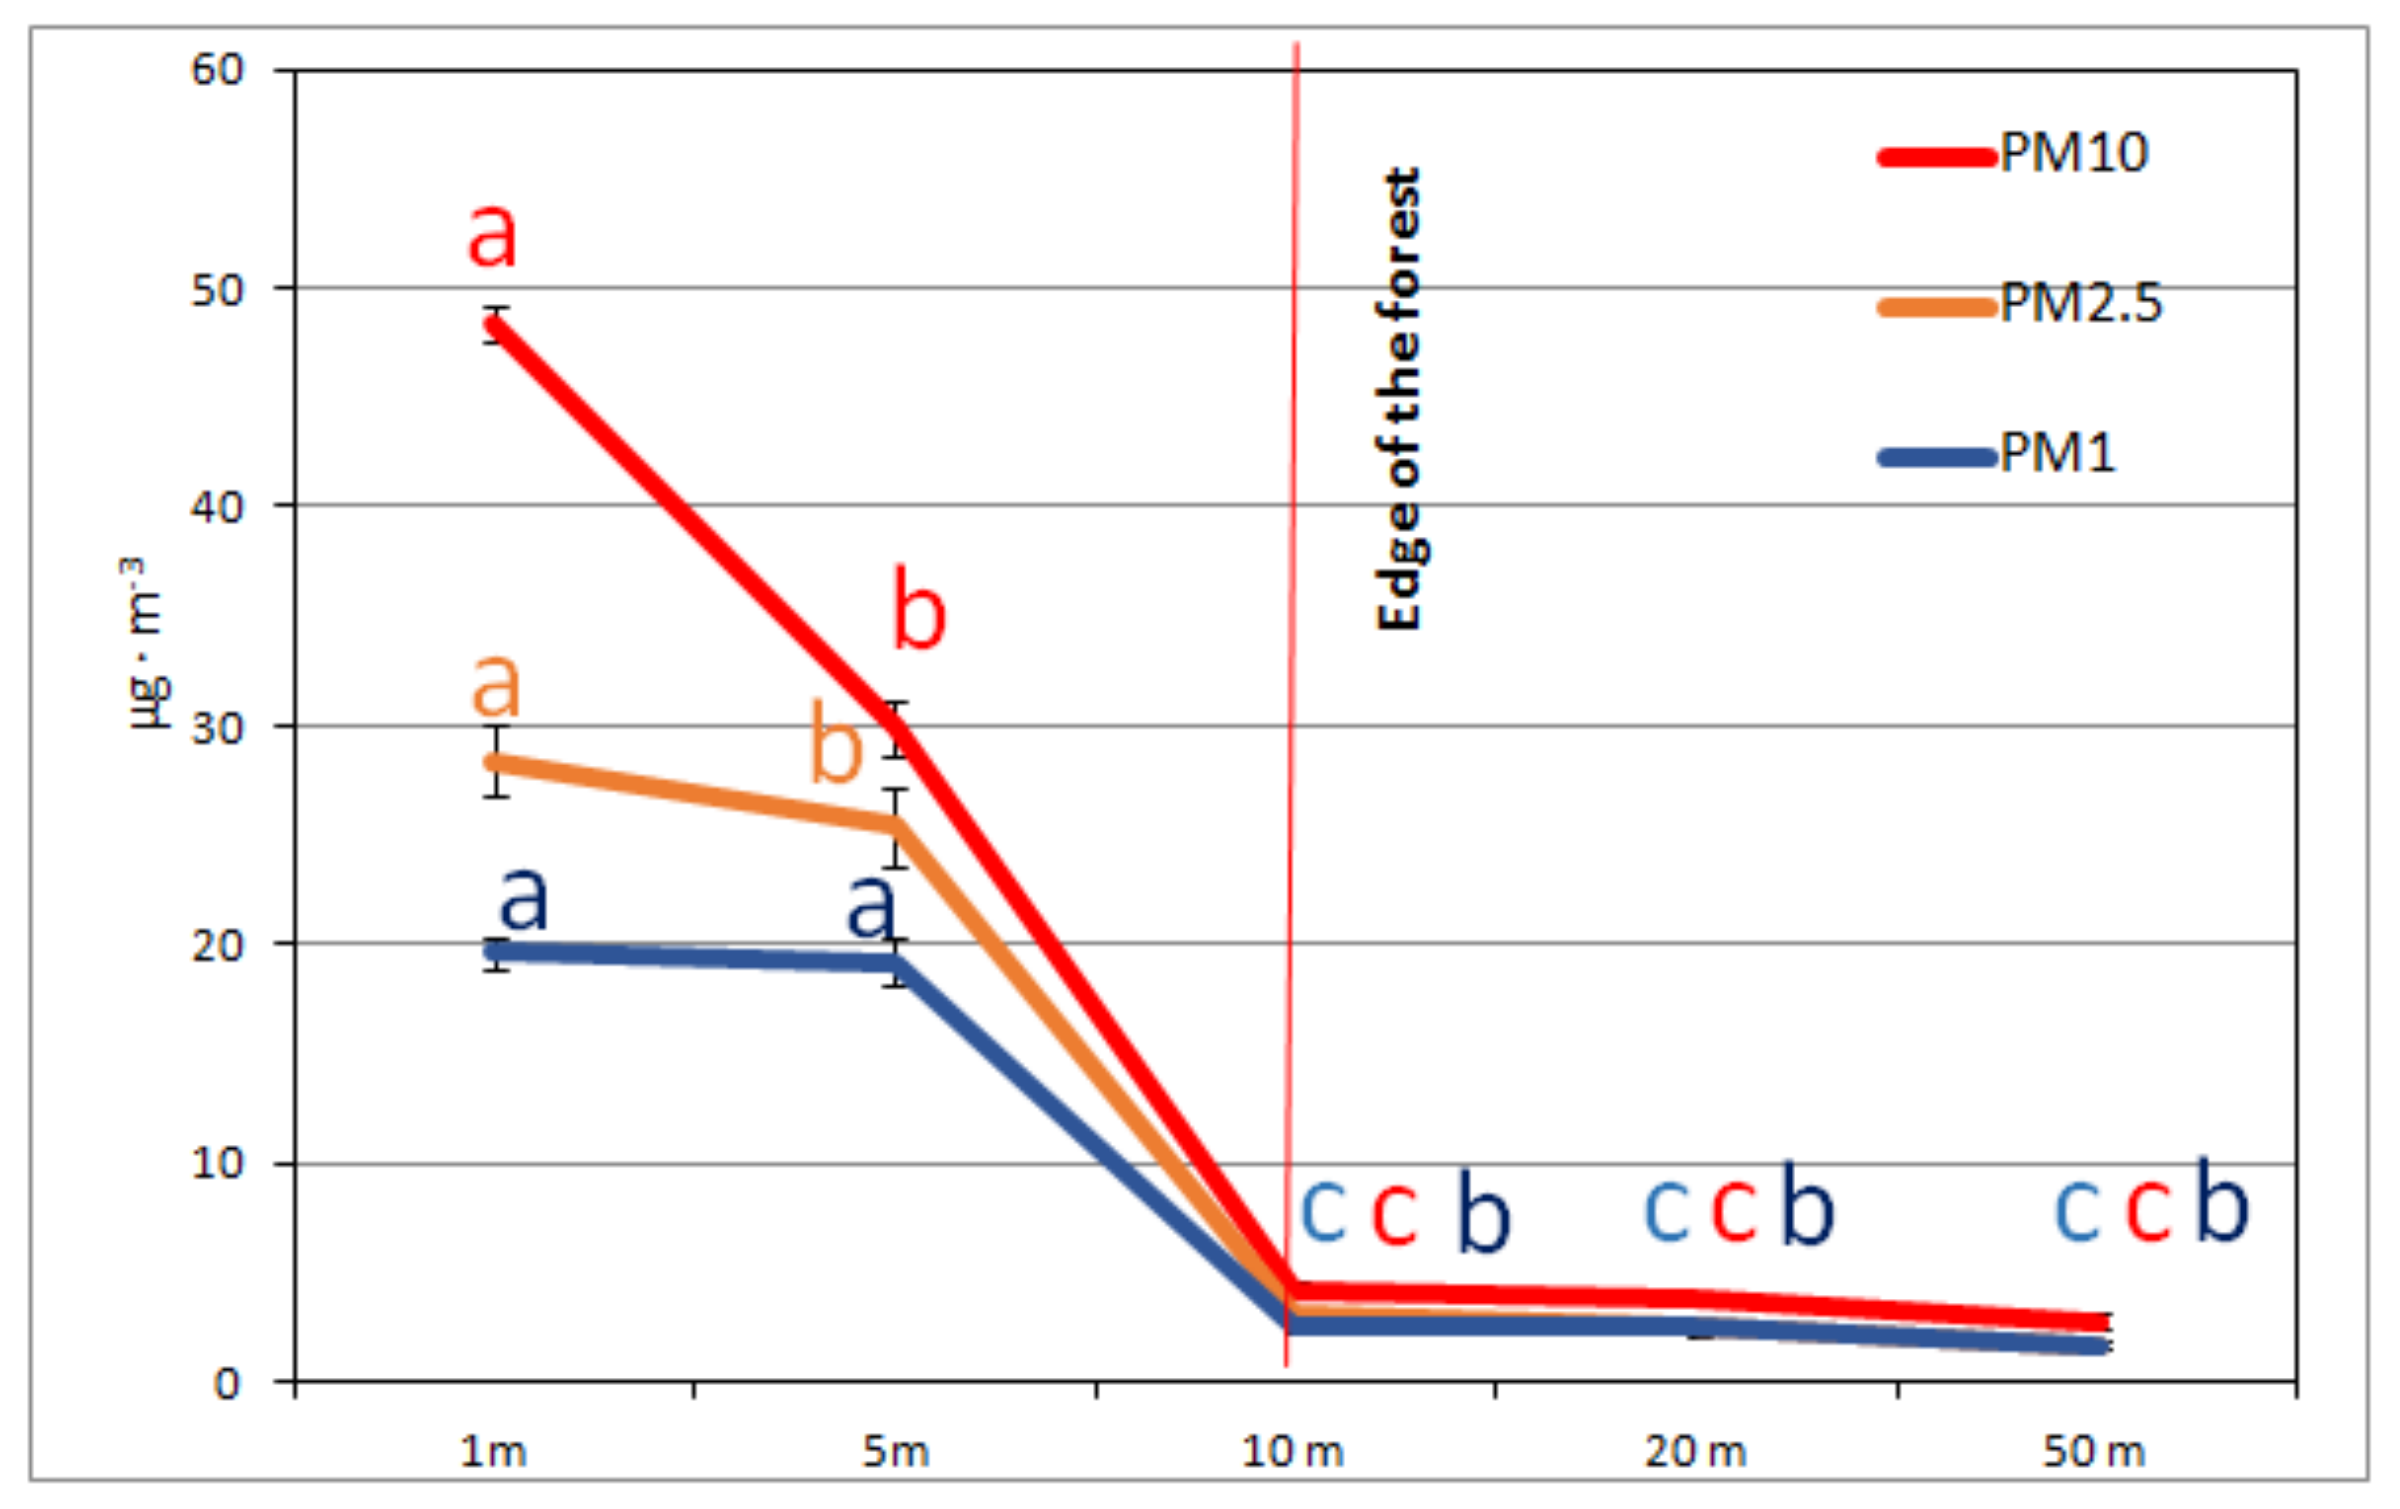
2.4. Quantitative Analysis of PM in the Air

For measurements of PM concentration in air, the Dust Air Personal Controller (The Central Mining Institute and EMAG-SERWIS, Katowice, Poland), supported by the Dust Air Sampler application, was used. In each distance from the edge of the road, 20 measurements of PM10, PM2.5, and PM1 (3 min each) were performed simultaneously. During the measurements, the device was placed 1.5 m above ground. All the measurements were done on one sunny day, a few days after the last rainfall, during the evening rush hour.

2.5. Statistical Analysis

One and two-way ANOVA [44] was conducted to compare the values of the measured amounts of PM: total, large, core, and fine size fractions, and SPM, WPM, and PM concentration in air. Tukey’s HSD test (p = 0.05) was employed to assess the significance of differences among variants. Prior to all analyses, normal distribution was verified with the Shapiro–Wilk test. The data are given as means with standard errors of the mean (± SE). Statistical analyses were conducted using StatGraphics Plus 4.1 software (StatPoint Technologies, Inc., The Plains, VA, USA).

2.6. SEM Examinations

The aim of the microscope investigation was to identify the type of particles in the PM collected from plants, to determine their origin. For this purpose, a PM sample collected from the roadside was examined to identify what type of particles might come from the road. Observations of the samples of PM collected from the plants were aimed to search for similar particles that came from the road as well as other particles that were not part of road dust. Semi-quantitative analysis was also conducted to discover how far road-derived PM can penetrate into forest zones. Dried filter papers from the water extraction were examined using SEM (Scanning Electron Microscope) techniques. Paper filters with a 10 µm pore size and residues from water extract filtration were selected as the filters with the highest PM content. Samples of 5 × 5 mm were cut from the centre of the paper filter for each zone and type (mosses, herbaceous plants, shrubs, trees). The samples were evaporated into gold prior to SEM examination. Observations were carried out using a scanning electron microscope produced by Zeiss, model Sigma 500VP (Carl Zeiss Microscopy GmbH, Köln, Germany). Secondary electron (SE) and backscattered electron (BSE) images were collected. Phase compositions were analysed using an EDX detector, model Oxford Ultim Max 40, with an AztecLive software (Oxford Instruments NanoAnalysis & Asylum Research, High Wycombe, UK). Semiquantitative analysis was performed to estimate the number of inorganic particles in the analysed material. For each sample, three random areas were scanned in 300 mag. using an EDX detector and 15 kV EHT (Electron High Tension). The sum of the amount of silicone, aluminium, and calcium were calculated and treated as a marker of the inorganic PM content.

3. Results

3.1. Vegetation Species Composition

Plant species belong to five vegetation groups: forest, shrubs, grasses (including grasses and herbaceous plants), synanthropic plants, and mosses. All zones were mainly dominated by grasses, herbaceous plants, and mosses. The moss Syntrichia ruralis (Hedw. F. Weber & D. Mohr) dominated in zone 2, and Pleurozium schreberi (Willd. ex Brid. Mitt.) in zone three. Plants such as Lolium perenne (L.), Poa trivialis (L.), Achillea millefolium (L.), Taraxacum officinale (F.H. Wiggers coll.), Plantago major (L.), Dactylis glomerata (L.), Festuca ovina (L.), Festuca rubra (L.), Calamagrostis epigejos (L.), Roth, Peucedanum oreoselinum (L.), Moench., Melampyrum nemorosum (L.), and Hieracium pilosella (L.) represent grassy vegetation. Festuca ovina, which is a characteristic plant species of a Peucedano-Pinetum forest, had the highest cover (%) among all plant species in the study area. Other plants, such as Sonchus arvensis (L.), Conyza canadensis (L.) Cronquist, and Linaria vulgaris, were classified as synanthropic plants. Shrub species such as Frangula alnus (Mill.), Cornus alba (L.), and Juniperus communis (L.) were found in zones 3, 4, and 5. Single shrub plants grew not only in the shrub layer but in the herbaceous and tree layers as well. The tree species Quercus robur (L.), Quercus petraea (Matt.) Liebl., Acer platanoides (L.), Prunus padus (Mill.), and Sorbus aucuparia (L.) grew mostly in zones 2, 3, 4, and 5. Most of these were found in the tree layer, but single species were also found in the shrub and herbaceous layers (Table 1).

3.2. PM Concentrations in the Air

In this study, the concentrations of PM in the air varied both in terms of concentrations of different PM size fractions at the same distance from the road and the concentrations of a given PM fraction depending on the distance from the pollution source (Figure 3). The highest concentration (average for all distances) was recorded for the PM10 (17.8 µg·m−3), which exceeded air concentrations of PM2.5 and PM1 by 31% and 49%, respectively. The highest PM concentrations of all fractions were recorded in the two zones (1 m and 5 m) located closest to the road. The reduction in concentrations of PM10 and PM2.5 between 1 m (zone 1) and 5 m (zone 2) from the pollution source was significant and amounted to 38% (PM10) and 10% (PM2.5), while no significant statistical difference was found for the smallest PM1 fraction. Significant and very high reduction in PM concentration was observed just behind the forest edge compared to the concentrations at 5 m from the road, at 86%, 88%, and 86% for PM10, PM2.5, and PM1, respectively. There were no significant statistical differences in PM concentrations inside the forest (Figure 3).

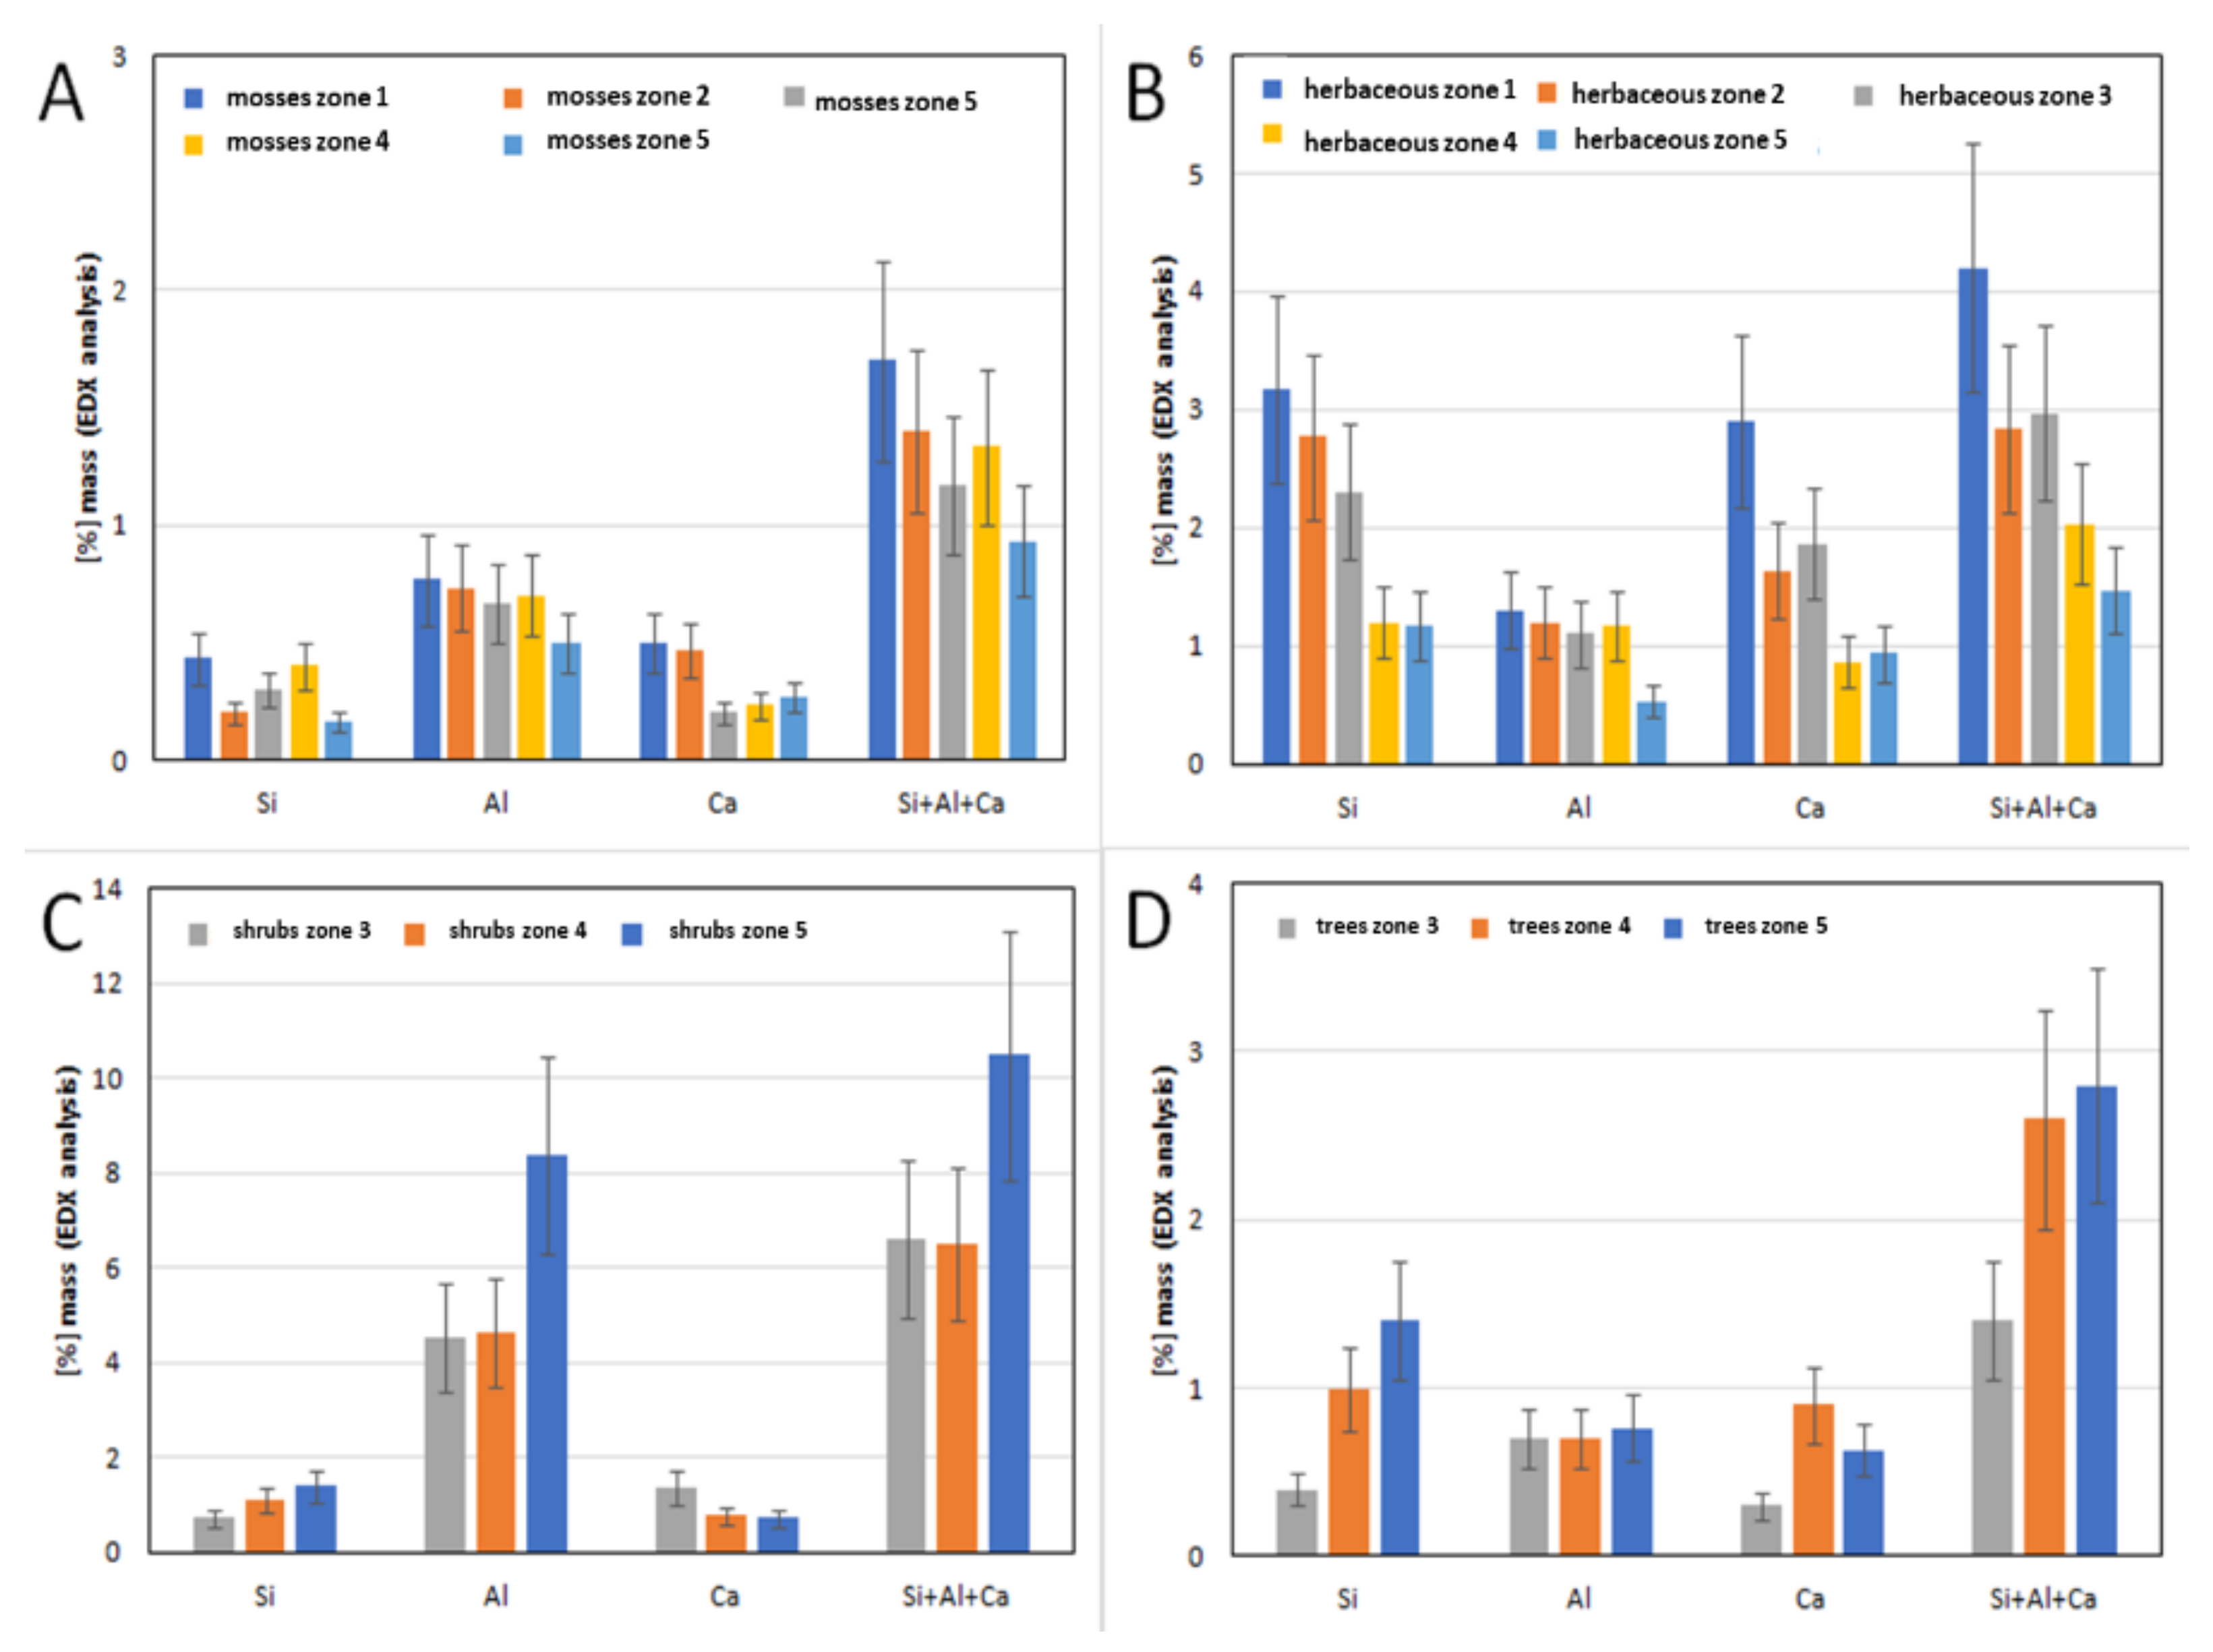
3.3. PM Accumulation on Plants

Vegetation growing in the five zones differed in the level of total PM accumulation (Figure 4A). Only mosses and herbaceous plants grew in the two zones closest to the pollution source (1 m and 5 m from the road). Plants from these two groups accumulated the highest amounts of total PM at a distance closest to the road. Total PM accumulation by the mosses growing 1 m from the road was also the highest in the experiment. The amount of total PM accumulated by mosses then decreased significantly with increasing distance from the pollution source. Five metres away from the road, it had already decreased by 41%, while at the forest edge, total PM accumulation by mosses was more than two times lower. Inside the forest, the amount of PM accumulated on mosses continued to decrease, reaching, in the zone farthest from the road (50 m from the pollution source), only 12% of the accumulation recorded 1 m from the road. A very similar trend was recorded for herbaceous plants, except that there was no difference in the total PM accumulation between 1 m and 5 m from the pollution source. At a distance of 50 m from the road, herbaceous plants accumulated 64% less total PM than in the zone closest to the road. Total PM accumulation by trees and shrubs followed an opposite trend. The lowest values of total PM on leaves of both groups were accumulated in zone 3, which was the forest edge (10 m from the road). At further distances, the total PM accumulation increased significantly. At greater distances from the road (50 m), the highest total PM accumulation was detected on herbaceous plants and trees, with 15% less on shrubs and much less on mosses (around 61%) (Figure 4A).
Differences in accumulation between different vegetation layers were also noted for all PM size fractions (Figure 4B–D). The amount of large PM on plants showed a similar trend to accumulation of total PM, most probably because this PM fraction had the largest share in total PM (Figure 4B). Only for shrubs was the trend of large PM accumulation opposite to total PM accumulation, as the greatest accumulation of large PM on shrubs was observed at the forest edge. Examining the large PM deposition on the vegetation layers located in the forest, it was shown that the highest accumulation at the forest edge was on the mosses and herbaceous plants, but deeper inside the forest the highest amounts of large PM were recorded on herbaceous plants and trees, and the lowest on mosses (Figure 4B). For mosses and herbaceous plants, a similar trend of accumulation as that noted for large PM was also recorded for coarse PM (Figure 4C). The highest amounts of coarse PM on mosses and herbaceous plants were detected at the closest distance from the road, and the lowest, 50 m from the pollution source, 40 m deep into the forest. Shrubs and trees accumulated the lowest amounts of coarse PM at the forest edge, respectively 56% and 69% higher at a distance of 20 m, while there was a slight decrease at 50 m from the road compared to 20 m (Figure 4C). The accumulation trend of the smallest fraction was completely different from that of the previous two PM size fractions (Figure 4D). Only for mosses, the highest accumulation of fine PM was also recorded at 1 m from the road. In subsequent forest zones, there was usually a slight decrease in PM fine deposition on mosses (eventually, reaching 40% of the accumulation recorded 1 m from the road). Herbaceous plants accumulated the highest amount of fine PM 10 m from the road, then fine PM deposition on herbaceous plants decreased by 20% on average at 1 m and 5 m from the road and reached the lowest levels at 20 m and 50 m from the road (42% decrease). The lowest amounts of fine PM fraction for shrubs and trees were found at the forest edge (10 m from the road), while it was significantly higher at 20 m and 50 m from the pollution source, by 79% and 82%, respectively (Figure 4D).
The amount of SPM accumulated on the mosses and herbaceous plants growing at different distances from the road was consistent with the accumulation trends obtained for total PM (Figure 4E). The highest deposition of SPM on mosses and herbaceous plants was recorded 1 m from the road, while the lowest at 50 m. The lowest amount of SPM was accumulated by shrubs and trees at 10 m from the road, which is where it first occurred. SPM deposition on shrubs and trees then increased by 28% (20 m from the road) and 50% (50 m from the road) at larger distances (Figure 4E). The largest differences between the examined vegetation types were found in the accumulation of PM immobilised in epicuticular wax layers (Figure 4F). For the mosses, the amount of WPM decreased with the increasing distance from the road, reaching 90% less WPM at 50 m from the road than close to it. In the case of herbaceous plants, the highest amount of WPM was found at the forest edge, just slightly lower in shorter distances from the road and 50% lower inside the forest; thus, a very similar trend was recorded as for fine PM. The distance from the road did not affect the accumulation of WPM on shrubs. The highest accumulation of WPM on the leaves of trees was recorded at 20 m from the road, and it was lower by one-third at a further distance from the road and by two-thirds on the forest edge (Figure 4F).

3.4. SEM Examinations

During the SEM examinations, several types of PM were observed, which can be divided into two groups: inorganic particles, probably originating from the road, and organic particles originating from the forest. PM collected from the roadside mainly contains inorganic particles, such as aggregates (quartz, plagioclase, feldspar, pyroxene, orthoclase, calcium carbonate, dolomite, amphibolite, anorthoclase), industrial wastes (fly ash), and asphalt conglomerates (aggregate particles in the asphalt matrix). Trace amounts of organic compounds, such as plant pollen, were also found (Figure 5A). Figure 5B–E present various types of particles observed in the PM collected on paper filters. Two groups of particles were observed. The first included the inorganic particles similar to those observed in dust from the side of the road, such as quartz, plagioclase, pyroxene, calcium carbonate, dolomite, and fly ash. The second group is organic particles, which mainly include different types of plant pollen and plant particles. Figure 5B presents various types of plant pollen and an asphalt particle. Figure 5C presents a grain of asphalt, which is a conglomerate of calcium carbonate, quartz, and various types of aluminosilicate grains in the asphalt matrix. An example of PM collected from the tree zone (4) is shown in Figure 5E. Most of the visible particles include various types of plant pollen. Inorganic particles such as the quartz grains shown in Figure 5F can also be found in other areas of this sample.

3.5. Semi-Quantitative Analysis

Figure 6A–D presents the results of semi-quantitative analysis for different types of plants. Silicone, aluminium, and calcium were elements used as inorganic PM markers in the first step. The concentration of those elements alone was not sufficient to show the trends of inorganic PM accumulation in the zones. Better results were observed when analysing the sum of elements Si + Al + Ca, which was selected as an inorganic PM marker (IPM). According to this, the IPM factor for moss and herbaceous plants had the highest values in zone 1 (near the road), which decreased with increasing distance (zones 2–5), while for shrubs and trees IPM was the highest in zone 5. Uncertainties of semi-quantitative analysis results were estimated as consolidated uncertainties of each element for the entire population of values obtained. Due to relatively small population, the uncertainty values were quite high; however, this allowed for some conclusions to be drawn.

4. Discussion

PM is mainly the result of anthropogenic processes in cities [27]. In this study, we analysed the accumulation of PM from a city’s exit road and its distribution into the urban forest. The studied urban forest had a zonal structure. The highest number and cover of herbaceous plants was represented by synanthropic and grass species in the first two zones (No. 1 and No. 2), located near the source of transport pollution. The plant species composition in zones 3, 4, and 5 were more typical for fresh coniferous forests, which means that the habitat was more “natural”, with less anthropogenic impacts. When designing vegetation barriers to mitigate near-road air pollution, zones of urban greenery characterised by different structures of vegetation, including herbaceous plants and mosses, are rarely taken into the account; the greatest emphasis is placed only on trees and shrubs [45,46,47,48]. However, for safety (better visibility, avoiding accidents) and space reasons, trees and high shrubs cannot grow in the immediate vicinity of roads and intersections. Consequently, where trees cannot be planted, PM emitted from the road may be dispersed and transferred to new locations [48,49,50,51] or accumulated by herbaceous plants and grasses [39]. The presence of trees can in turn lead to elevated PM concentrations close to the road because high vegetation acts as a dam for polluted air [50,51]. In some cases PM dispersion can be interpreted as a favourable phenomenon, as it leads to lower PM concentration in the air at the place of its emission [50,52]. Conversely, PM that has not been adsorbed on any physical barrier may be relocated to new locations, which are perceived as clean since they are devoid of PM sources. It seems that a much safer solution would be PM accumulation and its permanent retention on plants growing in the immediate vicinity of the road. The critical problem to be addressed is finding plants that will be able to tolerate very difficult growing conditions (salinity, drought, pollution, soil degradation, and compotation), grow along the roads, not pose a threat to road users, and effectively accumulate PM from the air. The results of this work demonstrate that more attention should be paid to herbaceous plants. Many perennial herbaceous plants can tolerate a close proximity to roads. Herbaceous plants, especially those that are relatively big in size, tend to have deep root systems and, as resource-conserving species, invest more in their defence and storage mechanisms [53]. In this study, herbaceous plants were shown to grow in areas where airborne PM concentrations were significantly high (5 and 10 times higher than at the forest edge). These plants were the most exposed to the toxic effects of air pollutants and constituted the first physical barrier (filter for air pollution) between the road and cleaner air. Herbaceous vegetation turned out to be effective at PM accumulation. PM accumulation by herbaceous perennial plants is a consequence of their location, which is as close as possible to emission sources (1–10 m from the road), but also their morphology and canopy structure. The high accumulation of PM by plants growing in the immediate vicinity of the emission sources is a well-described phenomenon [54,55]. Many herbaceous plants are covered with hairs and a thick waxy coating, which are the features that determine the effective accumulation of PM [56,57]. In this work, we analysed the leaves of Achillea millefolium, Plantago major, and Hieracium pilosella, which are covered with hairs. The high proportion of grasses (mowed rarely or not at all) in the assessed plant community was responsible for the high density and porosity of the plant filter. The high efficiency of PM accumulation by herbaceous plants was previously shown by Przybysz et al. [52], Weber et al. [56], Speak et al. [58], and Janhäl [59], while the ability of grasses to accumulate PM from the air was demonstrated by Przybysz et al. [34]. Unmoved herbaceous plant communities are typically tall enough (30–50 cm at least), yet permeable and dense enough to act as an effective air filter near the source of roadway emissions. In order to exploit the phytoremediation potential of herbaceous plants fully, it is worth limiting the mowing of roadside vegetation, especially in locations where aesthetics are less important, as for example, the city exit road studied in this work. It has already been shown that the structure and location of greenery near pollution emission sources has a much greater impact on PM accumulation potential than the biodiversity and species composition of plant communities [34]. This suggests that even a spontaneous roadside herbaceous community can have a positive impact on the air quality near roads.
The first line of trees accumulates (per unit of leaf area, not the whole plant) significantly less PM than herbaceous perennials. This is a surprising result, as until now street-adjacent trees were seen as the only element of urban greenery having a real impact on limiting air pollution with PM [60,61]. In this work, the higher efficiency of PM accumulation by herbaceous plants compared to trees is attributed to their shorter distance from the road, which was the only PM source in the area. Possibly, herbaceous plants filtered the polluted air emitted from the road before it reached the trees. Since the air pollutants were emitted close to the ground, and the herbaceous plants were right next to the road, they could significantly reduce PM dispersion and transport. Conversely, the trees grew just 10 m away from the road, which is relatively close to the emission source; thus, they should accumulate PM efficiently, especially considering their height (at least a few meters) and planting density. The high concentration of PM in the air between the road and the first row of trees shows that, despite the very effective accumulation of PM by herbaceous plants, the air was still polluted, and the amount of PM deposited on shrubs and tree leaves should be higher. Another explanation may be the re-suspension of PM temporarily accumulated on shrubs and trees by wind and rain. Wind and rain can remove significant amounts of PM from the leaf surface [34,51,59,62,63]. Re-suspended PM returns to the environment and can pollute the air again. It seems that herbaceous plants growing under and close to the trees most probably also accumulate PM re-suspended from taller vegetation. It can be assumed that herbaceous plants growing along the road should adhere to the first row of trees, so that they could accumulate PM re-suspended from trees and shrubs. Under trees and shrubs, especially near the roadside, there should be no hardened surfaces (pavements, bicycle paths, parking lots), because they cause further re-suspension of PM. This is another piece of evidence that herbaceous plants (preferably tall and unmown) play a very important role in removing PM from the air and should be a permanent element of urban greenery along roads. If possible, lawns should be replaced by meadows. Lawns offer fewer ecosystem services (biodiversity, food for pollinators, habitat for invertebrates) and require higher maintenance costs than a meadow [64]. In addition, lawns require mowing, which results in additional air pollutant emissions [65].
A new and very interesting finding of this study is the increasing accumulation of PM on leaves inside the forest, despite the very low concentration of PM in the forest (20 and 50 m from the road). Previous studies have indicated that PM accumulation on plants decreases with increasing distance from the edge of the forest/park [55]. Popek et al. [55], however, studied a large city park with lower planting density and the presence of numerous wide footpaths, which resulted in greater ventilation and air movement. The small amount of PM that reached the interior of the park did not have to be accumulated by the plants, but could be carried somewhere else. The trees and shrubs in this park were also exposed to rain and wind. In the present study, the dense canopy of tall trees constituted an insulating layer for air pollutants, including PM. Once PM was transferred deeper into the forest, it was trapped there due to little/no air movement. Most probably, most of the PM that entered the forest was accumulated by forest vegetation and then retained for a long period of time. The plant samples in the forest were collected at a height of 1.5 m; therefore, the analysed plant material was exposed to rain and wind only to a minimal extent. PM was not regularly washed off the surface of the leaves, as happened at the edge of the forest. Moreover, the increased accumulation inside the forest mainly concerns the smallest PM and the most detrimental to health (0.2–10 µm). On the contrary, the accumulation of PM by herbaceous plants and mosses decreased with increasing distance from the road, and it was significantly lower inside the forest. It is probable that before the PM fell by gravity onto lower vegetation, it was accumulated and retained by trees and shrubs. The presence of a dense forest close to the road caused the PM concentration in the air between the road and the first row of trees to be very high, often exceeding the permissible standards. The results obtained in this study support the finding of Vos [66], who showed that trees can increase PM concentrations along the road. Tong et al. [50] argue that, unlike trees, lawns (and possibly other low vegetation) lead to the dispersion of pollutants into the air, consequently lowering the concentration of PM. We are of the opinion that in order to combat air pollution generated by road transport effectively, roadside greenery must be diverse and have a layered structure. A mixture of relatively tall herbaceous plants should be grown along the roadside in areas where the presence of shrubs and trees is not possible. The task of the usually underestimated herbaceous vegetation is to capture PM from the air immediately after its emission. Shrubs and trees, in turn, act as a barrier against the uncontrolled spread and accumulation of PM that has not been deposited on herbaceous plants present in zones 1 and 2. The first rows of trees should be relatively porous so as to enable PM transport into the forest, where it will be permanently accumulated by trees and shrubs. For the above reason, the area between the road and the first rows of trees should be inaccessible to human activity, e.g., bicycle and walking paths should always be at least a few rows of trees away.
In this work, the spatial distribution of selected inorganic PM (containing Si, Al, and Ca) emitted by non-exhaust road emissions was examined. On the surface of herbaceous plants and mosses, as expected, the share of inorganic PM in total accumulated PM decreased along with the increasing distance from the road. This was especially true for the sum of Si, Al, and Ca. Conversely, the proportion of organic PM increased, which is a typical phenomenon resulting from flowering plants, fungal sporulation, and the presence of organic matter in the air. In the case of the foliage of trees and shrubs, an increase in the accumulation with increasing distance from the road was found not only for organic PM but also for inorganic PM. This corresponds well with the previously discussed increase in the amount of total PM deposited on the leaves of trees and shrubs inside the forest. The increase in the accumulation of organic PM on the leaves of woody plants growing inside the forest is easy to explain (pollen, fungal spores, fragments of plants and animals), while an increase in the amount of road-derived inorganic PM by shrubs and trees located 20 and 50 m from the road is surprising. The long distance from the PM emission source (road), the presence of plant barriers (herbaceous plants and the first rows of trees), and the low concentration of air PM inside the forest suggest that the accumulation of inorganic PM on the leaves of shrubs and trees growing in the forest should be very low. The reason for the large amount of PM, also inorganic, on woody plants growing in the forest 20 and 50 m from the road is most probably the high PM retention on leaves. For typical urban shrubs and trees (street-adjacent plants, low density parks, individual trees), PM is regularly washed off from the leaf surface by rain or removed by wind [34,51,59,62,64]. Rain of medium intensity (20 mm) removes up to 25% of previously accumulated PM from foliage [67]. The amount of PM deposited on the leaves of trees can change significantly within 24 h due to environmental factors [59]. In this study, a tall and dense forest canopy served as a green umbrella and wind protection for the plants growing below. PM accumulation by shrubs and trees growing in the forest was not interrupted by rain events, and despite the very low PM concentration in the forest air, the amount of PM on the foliage of forest trees and shrubs was high, and was higher than on plants growing in the first row from the road. The presence of inorganic PM on the leaves of plants growing inside the forest shows that pollution from non-exhaust road emissions might be transferred deep into the forest, but only in small amounts. The results obtained in this study suggest that urban forests together with roadside herbaceous plants significantly reduce the dispersion and distribution of PM to new areas through efficient accumulation of road-borne air pollutants. With a properly planned and maintained urban forest spatial distribution alongside roads, PM can be considerably lowered, compared to the 50–100 m suggested by Zhu et al. [16], Weijers et al. [14], and Wang et al. [15]. This is undoubtedly of great importance for the health of people living in the vicinity of roads. PM particles found on the side of the road were typical of building materials used for road construction. Particles of fly ash found in PM might originate in the road foundation, for which it is often used, or they might be directly transported through the air from the nearest coal power plant, located about ten kilometres away. The IPM factor for mosses and herbaceous plants had the highest values in zone 1 (near the road), which might be explained by the fact that the areas located farther away from the road have lower concentrations of dust caused by the greater distance from the source. However, different trends were observed for shrubs and trees, as the IPM factor was the lowest in zone 3, and it increased in areas located further from the road (zones 4 and 5). The different trends of the IPM factor in shrub-tree layers than in mosses and herbaceous layers might be explained by exposure to the wind, which might blow the PM from the higher plants located in areas near the road more effectively than from the plants inside the forest.
The results obtained in this study suggest that in order to better exploit the potential of plants for air purification from PM, it is necessary to understand PM accumulation by entire plant communities, such as urban forests, and not just individual groups or species of plants. Moreover, the impact of plants on air quality is usually assessed by measuring the concentration of PM in the air or by the amount of PM accumulated by plants. It is less frequent that these two methods are used simultaneously. In our opinion, in order to assess properly the phytoremediation process along roads, the two previously mentioned parameters should be supplemented by a qualitative analysis of PM accumulated by plants. In this work, we developed an inorganic PM marker (IPM) for the inorganic particles (Si, Al, and Ca). If we only measured PM concentration in the air, we might consider the forest as PM-free, and the high PM accumulation in shrubs and trees would be overlooked. Conversely, if we only determined the PM on plant leaves, we would probably assume that PM concentration in forest air is very high. A lack of a qualitative analysis of PM accumulated on the leaf surface would suggest that only organic PM was retained by plants in the forest, and inorganic PM from the road was removed from the air by the first rows of trees. The analysis of inorganic PM allowed us to trace the distribution and explain the fate of PM emitted from the road.
In order to properly estimate the usefulness of urban greenery in air purification processes, assessment cannot be limited to the effectiveness of PM accumulation (or of other air pollutants) by individual species or groups of plants (mosses, herbaceous plants, grasses, shrubs, trees). Urban greenery should rather be treated as one multifunctional and complex mechanism. Mosses, herbaceous plants, shrubs, and trees perform different tasks and complement each other in air purification processes. The results of this study additionally suggest that not only organised greenery (parks, street trees), but also urban forests with diversified horizontal and vertical vegetation layers with mosses, grasses, and synanthropic and forest plant species, play an important role in purifying urban air. A deeper understanding of the interactions between various elements of urban greenery will not only help to better understand the complexity of the processes taking place during air purification, but can also be used when creating recommendations for people dealing with urban greenery, so that they can make full use of the potential of plants in cities.

5. Conclusions

Urban forests, located near busy exit roads from the cities, efficiently accumulate PM from the air. A novelty in this work was to demonstrate that due to the presence of herbaceous plants near the road, the PM concentration in the air behind the first tree line of the urban forest is much lower than at the emission source. PM, however, was detectable as far away as 50 m from the emission source, i.e., 40 m deep into the city forest. Moreover, we noted that the amount of road-derived inorganic PM on herbaceous plants decreases with distance from the emission source, while it increases on the foliage of shrubs and trees. This high accumulation of PM on shrubs and trees growing inside the urban forest suggests its high retention on foliage, which is related to the negligible influence of rain and wind. In the future, studies should focus on examining plant complexes rather than the ability of individual plants to accumulate PM. Our new results demonstrated that each plant layer of the urban forest is diversely exposed to PM and affected by meteorological factors. These layers also have different predispositions to accumulate and retain PM. The studies on the dynamics of PM accumulation, retention, and re-suspension in the context of meteorological factors should be of high priority in the future. Knowledge gained from such experiments will enable better planning of urban forests along roads in order to reduce air pollution. Due to the need for air purification in the vicinity of high traffic roads, as well as ecological values, and the interplay between location and high PM accumulation, properly designed and maintained urban forests are a valuable resource in reducing air pollution in cities.

Author Contributions

Conceptualization, R.P. and B.F.-P.; methodology, R.P., B.F.-P. and F.C.; validation, R.P., B.F.-P. and F.C.; formal analysis, R.P.; investigation, R.P., B.F.-P., F.C., D.C. and N.P.; resources, R.P.; data curation, R.P. and J.B.; writing—original draft preparation, R.P., F.C., A.P., M.P. and B.F.-P.; writing—review and editing, M.P. and A.P.; visualization, R.P., B.F.-P., F.C., J.B, M.P. and A.P.; supervision, R.P.; project administration, R.P. and B.F.-P., funding acquisition, F.C. All authors have read and agreed to the published version of the manuscript.

Funding

This research was financed by the Ministry of Science and Higher Education in Poland under Agreement No. 6967/IA/2019 of 9 July 2019.

Institutional Review Board Statement

Not applicable.

Informed Consent Statement

Not applicable.

Data Availability Statement

Requests for data supporting reported results should be addressed to R.P.

Conflicts of Interest

The authors declare no conflict of interest.

References

  1. Haddad, N.M.; Brudvig, L.A.; Clobert, J.; Davies, K.F.; Gonzalez, A.; Holt, R.D.; Lovejoy, T.E.; Sexton, J.O.; Austin, M.P.; Collins, C.D.; et al. Habitat Fragmentation and Its Lasting Impact on Earth’s Ecosystems. Sci. Adv. 2015, 1, e1500052. [Google Scholar] [CrossRef] [PubMed] [Green Version]
  2. Patarkalashvili, T. Urban Forests and Green Spaces of Tbilisi and Ecological Problems of the City. Ann. Agrar. Sci. 2017, 15, 187–191. [Google Scholar] [CrossRef]
  3. Referowska-Chodak, E. Pressures and Threats to Nature Related to Human Activities in European Urban and Suburban Forests. Forests 2019, 10, 765. [Google Scholar] [CrossRef] [Green Version]
  4. Health Effects Institute (HEI). Traffic-Related Air Pollution: A Critical Review of the Literature on Emissions, Exposure, and Health Effects; HEI: Boston, MA, USA, 2010; pp. 5–44. [Google Scholar]
  5. World Health Organization (WHO). Review of Evidence on Health Aspects of Air Pollution-REVIHAAP Project; WHO Regional Office for Europe: Bonn, Germany, 2013; pp. 12–126. [Google Scholar]
  6. Tong, Z.; Baldauf, R.W.; Isakov, V.; Deshmukh, P.; Max Zhang, K. Roadside Vegetation Barrier Designs to Mitigate Near-Road Air Pollution Impacts. Sci. Total Environ. 2016, 541, 920–927. [Google Scholar] [CrossRef]
  7. Hime, N.J.; Marks, G.B.; Cowie, C.T. A Comparison of the Health Effects of Ambient Particulate Matter Air Pollution from Five Emission Sources. Int. J. Environ. Res. Public Health 2018, 15, 1206. [Google Scholar] [CrossRef] [Green Version]
  8. Zinia, N.J.; McShane, P. Ecosystem Services Management: An Evaluation of Green Adaptations for Urban Development in Dhaka, Bangladesh. Landsc. Urban Plan. 2018, 173, 23–32. [Google Scholar] [CrossRef]
  9. Xing, Y.-F.; Xu, Y.-H.; Shi, M.-H.; Lian, Y.-X. The Impact of PM2.5 on the Human Respiratory System. J. Thorac. Dis. 2016, 8, E69–E74. [Google Scholar] [CrossRef]
  10. European Environment Agency (EEA). The European Environment—State and Outlook 2020: Knowledge for Transition to a Sustainable Europe. Available online: https://www.eea.europa.eu/soer/2020 (accessed on 10 December 2021).
  11. Pant, P.; Harrison, R.M. Estimation of the Contribution of Road Traffic Emissions to Particulate Matter Concentrations from Field Measurements: A Review. Atmos. Environ. 2013, 77, 78–97. [Google Scholar] [CrossRef]
  12. Nawrot, N.; Wojciechowska, E.; Rezania, S.; Walkusz-Miotk, J.; Pazdro, K. The Effects of Urban Vehicle Traffic on Heavy Metal Contamination in Road Sweeping Waste and Bottom Sediments of Retention Tanks. Sci. Total Environ. 2020, 749, 141511. [Google Scholar] [CrossRef]
  13. Dzikuć, M.; Adamczyk, J.; Piwowar, A. Problems Associated with the Emissions Limitations from Road Transport in the Lubuskie Province (Poland). Atmos. Environ. 2017, 160, 1–8. [Google Scholar] [CrossRef]
  14. Weijers, E.; Khlystov, A.; Kos, G.; Erisman, J. Variability of Particulate Matter Concentrations along Roads and Motorways Determined by a Moving Measurement Unit. Atmos. Environ. 2004, 38, 2993–3002. [Google Scholar] [CrossRef]
  15. Wang, J.; Chan, T.; Ning, Z.; Leung, C.; Cheung, C.; Hung, W. Roadside Measurement and Prediction of CO and PM2.5 Dispersion from On-Road Vehicles in Hong Kong. Transp. Res. Part D Transp. Environ. 2006, 11, 242–249. [Google Scholar] [CrossRef]
  16. Zhu, Y.; Hinds, W.C.; Kim, S.; Shen, S.; Sioutas, C. Study of Ultrafine Particles Near a Major Highway with Heavy-Duty Diesel Traffic. Atmos. Environ. 2002, 36, 4323–4335. [Google Scholar] [CrossRef]
  17. Wu, Y.; Hao, J.; Fu, L.; Wang, Z.; Tang, U. Vertical and Horizontal Profiles of Airborne Particulate Matter Near Major Roads in Macao, China. Atmos. Environ. 2002, 36, 4907–4918. [Google Scholar] [CrossRef]
  18. Timmers, V.R.; Achten, P.A. Non-Exhaust PM Emissions from Electric Vehicles. Atmos. Environ. 2016, 134, 10–17. [Google Scholar] [CrossRef]
  19. Thorpe, A.; Harrison, R.M. Sources and Properties of Non-Exhaust Particulate Matter from Road Traffic: A Review. Sci. Total Environ. 2008, 400, 270–282. [Google Scholar] [CrossRef]
  20. Penkała, M.; Ogrodnik, P.; Rogula-Kozłowska, W. Particulate Matter from the Road Surface Abrasion as a Problem of Non-Exhaust Emission Control. Environments 2018, 5, 9. [Google Scholar] [CrossRef] [Green Version]
  21. United Nations Environment Programme (UNEP). Annual Report 2011; UNEP Division of Communications and Public Information: Nairobi, Kenya, 2012. [Google Scholar]
  22. Maes, J.; Domenech, F.N.; Zulian, G.; Lopes Barbosa, A.; Vizcaino Martinez, M.; Polce, C.; Vandecasteele, I.; Mari Rivero, I.; Bastos de Morais Guerra, C.; Perpiña Castillo, C.; et al. Mapping and Assessment of Ecosystems and Their Services: Trends in Ecosystems and Ecosystem Services in the European Union between 2000 and EUR 27143; Publications Office of the European Union: Luxembourg, 2015. [Google Scholar]
  23. Konijnendijk, C.C. The Forest and the City. In The Cultural Landscape of Urban Woodland; Springer: New York, NY, USA, 2008. [Google Scholar] [CrossRef]
  24. Zhang, Y.; Chen, H.Y.H.; Reich, P. Forest Productivity Increases with Evenness, Species Richness and Trait Variation: A Global Meta-Analysis. J. Ecol. 2012, 100, 742–749. [Google Scholar] [CrossRef]
  25. Zhang, F.; Chung, C.K.L.; Yin, Z. Green Infrastructure for China’s New Urbanisation: A Case Study of Greenway Development in Maanshan. Urban Stud. 2019, 57, 508–524. [Google Scholar] [CrossRef] [Green Version]
  26. Jaszczak, R. Forest and Forest Management within the Influence of Cities in Poland. (Las i Gospodarka Leśna w Zasięgu Oddziaływania Miast w Polsce). Stud. Mater. CEPL 2008, 10, 152–171. (In Polish) [Google Scholar]
  27. Tyrväinen, L.; Miettinen, A. Property Prices and Urban Forest Amenities. J. Environ. Econ. Manag. 2000, 39, 205–223. [Google Scholar] [CrossRef] [Green Version]
  28. Fornal-Pieniak, B.; Ollik, M.; Schwerk, A. Impact of Different Levels of Anthropogenic Pressure on the Plant Species Composition in Woodland Sites. Urban For. Urban Green. 2019, 38, 295–304. [Google Scholar] [CrossRef]
  29. Sanesi, G.; Colangelo, G.; Lafortezza, R.; Calvo, E.; Davies, C. Urban Green Infrastructure and Urban Forests: A Case Study of the Metropolitan Area of Milan. Landsc. Res. 2017, 42, 164–175. [Google Scholar] [CrossRef]
  30. Ferrini, F.; Fini, A.; Mori, J.; Gori, A. Role of Vegetation as a Mitigating Factor in the Urban Context. Sustainability 2020, 12, 4247. [Google Scholar] [CrossRef]
  31. Popek, R.; Gawrońska, H.; Wrochna, M.; Gawroński, S.; Saebø, A. Particulate Matter on Foliage of 13 Woody Species: Deposition on Surfaces and Phytostabilisation in Waxes–A 3-Year Study. Int. J. Phytoremediat. 2013, 15, 245–256. [Google Scholar] [CrossRef]
  32. Mo, L.; Ma, Z.; Xu, Y.; Sun, F.; Lun, X.; Liu, X.; Chen, J.; Yu, X. Assessing the Capacity of Plant Species to Accumulate Particulate Matter in Beijing, China. PLoS ONE 2015, 10, e0140664. [Google Scholar] [CrossRef] [PubMed]
  33. Chen, B.; Li, S.; Yang, X.; Lu, S.; Wang, B.; Niu, X. Characteristics of Atmospheric PM2.5 in Stands and Non-Forest Cover Sites Across Urban-Rural Areas in Beijing, China. Urban Ecosyst. 2016, 19, 867–883. [Google Scholar] [CrossRef]
  34. Przybysz, A.; Wińska-Krysiak, M.; Małecka-Przybysz, M.; Stankiewicz-Kosyl, M.; Skwara, M.; Kłos, A.; Kowalczyk, S.; Jarocka, K.; Sikorski, P. Urban Wastelands: On the Frontline between Air Pollution Sources and Residential Areas. Sci. Total Environ. 2020, 721, 137695. [Google Scholar] [CrossRef]
  35. Zhou, C.; Li, S.; Wang, S. Examining the Impacts of Urban Form on Air Pollution in Developing Countries: A Case Study of China’s Megacities. Int. J. Environ. Res. Public Health 2018, 15, 1565. [Google Scholar] [CrossRef] [Green Version]
  36. Zhang, X.; Chen, Y. Admissibility and Robust Stabilization of Continuous Linear Singular Fractional Order Systems with the Fractional Order α: The 0 < α < 1 Case. ISA Trans. 2018, 82, 42–50. [Google Scholar] [CrossRef]
  37. Todorov, V.; Dimov, I.; Ostromsky, T.; Zlatev, Z.; Georgieva, R.; Poryazov, S. Optimized Quasi-Monte Carlo methods based on Van der Corput sequence for sensitivity analysis in air pollution modelling. In Recent Advances in Computational Optimization, WCO 2020, Studies in Computational Intelligence, 1st ed.; Fidanova, S., Ed.; Springer: New York, NY, USA, 2022; Volume 986, pp. 389–405. [Google Scholar] [CrossRef]
  38. Główny Inspektorat Ochrony Środowiska (GIOŚ). The Condition of the Environment in Poland. Rapport 2018. (Stan Środowiska w Polsce. Raport 2018); Biblioteka Monitoringu Środowiska: Warszawa, Poland, 2018; p. 251. (In Polish) [Google Scholar]
  39. Matuszkiewcz, W. Guide to the Identification of Plant Communities in Poland (Przewodnik do Oznaczania Zbiorowisk Roślinnych Polski); PWN: Warszawa, Poland, 2014; p. 540. (In Polish) [Google Scholar]
  40. Public Road Authority (PRA). Interactive Map of the Apr Zdm Automatic Measurement System. Available online: https://zdm-warszawa.maps.arcgis.com (accessed on 18 December 2021).
  41. Mirek, Z.; Zając, M.; Zając, A.; Piękoś-Mirkowa, H. Vascular Plants of Poland. A Checklist; W. Szafer Institute of Botany: Cracow, Poland, 1995; p. 308. [Google Scholar]
  42. Braun-Blanquet, J. Parc National Suisse, Zernez et Bernina. Bull. Société Bot. Fr. 1951, 98, 54–58. [Google Scholar] [CrossRef] [Green Version]
  43. Dzierżanowski, K.; Popek, R.; Gawrońska, H.; Saebø, A.; Gawroński, S. Deposition of Particulate Matter of Different Size Fractions on Leaf Surfaces and in Waxes of Urban Forest Species. Int. J. Phytoremediat. 2011, 13, 1037–1046. [Google Scholar] [CrossRef] [PubMed]
  44. Todorov, V.; Dimov, I.; Ostromsky, T.; Apostolov, S.; Georgieva, R.; Dimitrov, Y.; Zlatev, Z. Advanced Stochastic Approaches for Sobol’ Sensitivity Indices Evaluation. Neural Comput. Appl. 2020, 33, 1999–2014. [Google Scholar] [CrossRef]
  45. Łukowski, A.; Popek, R.; Karolewski, P. Particulate Matter on Foliage of Betula Pendula, Quercus Robur, and Tilia Cordata: Deposition and Ecophysiology. Environ. Sci. Pollut. Res. 2020, 27, 10296–10307. [Google Scholar] [CrossRef] [PubMed] [Green Version]
  46. Sgrigna, G.; Baldacchini, C.; Dreveck, S.; Cheng, Z.; Calfapietra, C. Relationships between Air Particulate Matter Capture Efficiency and Leaf Traits in Twelve Tree Species from an Italian Urban-Industrial Environment. Sci. Total Environ. 2020, 718, 137310. [Google Scholar] [CrossRef] [PubMed]
  47. Li, X.; Zhang, T.; Sun, F.; Song, X.; Zhang, Y.; Huang, F.; Yuan, C.; Yu, H.; Zhang, G.; Qi, F.; et al. The Relationship between Particulate Matter Retention Capacity and Leaf Surface Micromorphology of Ten Tree Species in Hangzhou, China. Sci. Total Environ. 2021, 771, 144812. [Google Scholar] [CrossRef]
  48. Wang, X.; Teng, M.; Huang, C.; Zhou, Z.; Chen, X.; Xiang, Y. Canopy Density Effects on Particulate Matter Attenuation Coefficients in Street Canyons during Summer in the Wuhan Metropolitan Area. Atmos. Environ. 2020, 240, 117739. [Google Scholar] [CrossRef]
  49. Patra, A.; Colville, R.; Arnold, S.; Bowen, E.; Shallcross, D.E.; Martin, D.; Price, C.S.; Tate, J.; ApSimon, H.; Robins, A. On street observations of particulate matter movement and dispersion due to traffic on an urban road. Atmos. Environ. 2008, 42, 3911–3926. [Google Scholar] [CrossRef]
  50. Tong, Z.; Whitlow, T.H.; MacRae, P.F.; Landers, A.J.; Harada, Y. Quantifying the Effect of Vegetation on Near-Road Air Quality Using Brief Campaigns. Environ. Pollut. 2015, 201, 141–149. [Google Scholar] [CrossRef]
  51. Viippola, V.; Yli-Pelkonen, V.; Järvi, L.; Kulmala, M.; Setälä, H. Effects of Forests on Particle Number Concentrations in Near-Road Environments across Three Geographic Regions. Environ. Pollut. 2020, 266, 115294. [Google Scholar] [CrossRef]
  52. Przybysz, A.; Popek, R.; Stankiewicz-Kosyl, M.; Zhu, C.; Małecka-Przybysz, M.; Maulidyawati, T.; Mikowska, K.; Deluga, D.; Griżuk, K.; Sokalski-Wieczorek, J.; et al. Where Trees Cannot Grow–Particulate Matter Accumulation by Urban Meadows. Sci. Total Environ. 2021, 785, 147310. [Google Scholar] [CrossRef] [PubMed]
  53. Eziz, A.; Yan, Z.; Tian, D.; Han, W.; Tang, Z.; Fang, J. Drought Effect on Plant Biomass Allocation: A Meta-Analysis. Ecol. Evol. 2017, 7, 11002–11010. [Google Scholar] [CrossRef] [PubMed]
  54. Mori, J.; Hanslin, H.M.; Burchi, G.; Sæbø, A. Particulate Matter and Element Accumulation on Coniferous Trees at Different Distances from a Highway. Urban For. Urban Green. 2015, 14, 170–177. [Google Scholar] [CrossRef]
  55. Popek, R.; Gawrońska, H.; Gawroński, S.W. The Level of Particulate Matter on Foliage Depends on the Distance from the Source of Emission. Int. J. Phytoremediat. 2015, 17, 1262–1268. [Google Scholar] [CrossRef] [PubMed]
  56. Weber, F.; Kowarik, I.; Säumel, I. Herbaceous Plants as Filters: Immobilization of Particulates along Urban Street Corridors. Environ. Pollut. 2014, 186, 234–240. [Google Scholar] [CrossRef] [PubMed]
  57. Muhammad, S.; Wuyts, K.; Samson, R. Immobilized Atmospheric Particulate Matter on Leaves of 96 Urban Plant Species. Environ. Sci. Pollut. Res. 2020, 27, 36920–36938. [Google Scholar] [CrossRef]
  58. Speak, A.F.; Rothwell, J.J.; Lindley, S.J.; Smith, C.L. Urban Particulate Pollution Reduction by Four Species of Green Roof Vegetation in a UK City. Atmos. Environ. 2012, 61, 283–293. [Google Scholar] [CrossRef]
  59. Janhäll, S. Review on Urban Vegetation and Particle Air Pollution—Deposition and Dispersion. Atmos. Environ. 2015, 105, 130–137. [Google Scholar] [CrossRef]
  60. Nguyen, T.; Yu, X.; Zhang, Z.; Liu, M.; Liu, X. Relationship between Types of Urban Forest and PM2.5 Capture at Three Growth Stages of Leaves. J. Environ. Sci. 2015, 27, 33–41. [Google Scholar] [CrossRef]
  61. Zhang, Z.; Liu, J.; Wu, Y.; Yan, G.; Zhu, L.; Yu, X. Multi-Scale Comparison of the Fine Particle Removal Capacity of Urban Forests and Wetlands. Sci. Rep. 2017, 7, srep46214. [Google Scholar] [CrossRef] [Green Version]
  62. Popek, R.; Haynes, A.; Przybysz, A.; Robinson, S.A. How Much Does Weather Matter? Effects of Rain and Wind on PM Accumulation by Four Species of Australian Native Trees. Atmosphere 2019, 10, 633. [Google Scholar] [CrossRef] [Green Version]
  63. Xu, X.; Yu, X.; Bao, L.; Desai, A.R. Size Distribution of Particulate Matter in Runoff from Different Leaf Surfaces during Controlled Rainfall Processes. Environ. Pollut. 2019, 255, 113234. [Google Scholar] [CrossRef] [PubMed]
  64. Bretzel, F.; Vannucchi, F.; Romano, D.; Malorgio, F.; Benvenuti, S.; Pezzarossa, B. Wildflowers: From Conserving Biodiversity to Urban Greening—A Review. Urban For. Urban Green. 2016, 20, 428–436. [Google Scholar] [CrossRef]
  65. Baldauf, R.; Fortune, C.; Weinstein, J.; Wheeler, M.; Blanchard, F. Air Contaminant Exposures during the Operation of Lawn and Garden Equipment. J. Expo. Sci. Environ. Epidemiol. 2006, 16, 362–370. [Google Scholar] [CrossRef] [PubMed]
  66. Vos, P.E.J.; Maiheu, B.; Vankerkom, J.; Janssen, S. Improving Local Air Quality in Cities: To Tree or not to Tree? Environ. Pollut. 2013, 183, 113–122. [Google Scholar] [CrossRef]
  67. Przybysz, A.; Sæbø, A.; Hanslin, H.M.; Gawroński, S. Accumulation of Particulate Matter and Trace Elements on Vegetation as Affected by Pollution Level, Rainfall and the Passage of Time. Sci. Total Environ. 2014, 481, 360–369. [Google Scholar] [CrossRef]
Figure 1. Localisation of the studied area (schema) (A)—Warsaw, (B)—Młociny Forest.
Sustainability 14 02973 g001
Figure 2. Vegetation structure and studied samples in five zones (four samples in each zone—black squares 1 m/1 m) (own graph scaled).
Sustainability 14 02973 g002
Figure 3. The concentration of PM10, PM2.5, and PM1 in air depending on the distance from the source of pollution. Different letters in particular colours show statistically significant differences.
Sustainability 14 02973 g003
Figure 4. Amount of (A) Total PM, (B) large, (C) core, (D) fine PM fraction, (E) SPM and (F) WPM accumulated on the leaves of plants of different forest layers depending on the distance from the source of pollution. Differently coloured letters for particular forest layers and black for distances show statistically significant differences.
Sustainability 14 02973 g004
Figure 5. (A) Example of analysed area (undergrowth—zone 2); (B) PM collected from the side of the road, 1—orthoclase, 2—pyroxene, 3—calcium carbonate, 4—quartz, 5—plagioclase, 6—feldspar, 7,8—quartz, 9—pyroxene, 10—fly ash, 11—quartz, 12—amphibolite, 13—anorthoclase, 14—quartz; (C) example of observed particles; (D) asphalt particle; (E) sample trees—zone 4; (F) example of inorganic particle (quartz).
Sustainability 14 02973 g005
Figure 6. Concentration of selected elements in layers: (A) mosses, (B) herbaceous plants, (C) shrubs, (D) trees.
Sustainability 14 02973 g006
Table 1. Percentage cover (in %) of plant species in moss, herbaceous plant, shrub, and tree layers.
Plant Species in Moss LayerCover in %Plant Species in Herbaceous LayerCover in %Plant Species in Shrub LayerCover in %Plant Species in Tree LayerCover in %
zone 1
Syntrichia
ruralis
5Lolium perenne25none0none0
Plantago major25
Poa trivialis15
Sonchus arvensis10
Taraxacum officinale10
Achillea millefolium5
Conyza canadensis5
zone 2
Syntrichia
ruralis
5Festuca ovina90none0none0
Melampyrum nemerosum5
Calamagrostis epigejos5
Festuca rubra1
Quercus robur1
Linaria vulgaris1
Hieracium pilosella1
zone 3
Pleurozium schreberi5Festuca ovina85Quercus robur20Quercus robur35
Melampyrum nemerosum10Frangula alnus10Quercus petraea10
Dactylis glomerata1Prunus padus5Frangula alnus5
Calamagrostis epigejos1Cornus alba5Acer platanoides1
Prunus padus1
zone 4
Pleurozium schreberi5Festuca ovina25Frangula alnus10Quercus robur30
Calamagrostis epigejos15Quercus robur10Frangula anus5
Acer platanoides5
Frangula alnus5
Melampyrum nemerosum5
Acer pseudoplatanus1
Quercus robur1
zone 5
Pleurozium schreberi20Festuca ovina50Frangula alnus10Frangula alnus15
Frangula alnus10Prunus padus5Prunus padus5
Calamagrostis epigejos5Juniperus communis1
Publisher’s Note: MDPI stays neutral with regard to jurisdictional claims in published maps and institutional affiliations.

