Article

The Cost Benefit Analysis of Commercial 100 MW Solar PV: The Plant Quaid-e-Azam Solar Power Pvt Ltd.

1
Dipartimento di Ingegneria, Università degli Studi di Napoli “Parthenope”, Isola C4 Centro Direzionale, 80143 Napoli, Italy
2
Department of Engineering, Arizona State University, Tempe, AZ 85281, USA
3
Dipartimento di Economia e Impresa, Università degli Studi della Tuscia, Loc. Riello s.n.c., 01100 Viterbo, Italy
*
Author to whom correspondence should be addressed.
Sustainability 2022, 14(5), 2895; https://doi.org/10.3390/su14052895
Submission received: 13 January 2022 / Revised: 22 February 2022 / Accepted: 23 February 2022 / Published: 2 March 2022

Abstract

:
The energy crisis in Pakistan has crippled the country’s economy with an energy shortfall reaching up to 6000 MW. Fortunately, Pakistan lies close to the Sun Belt and therefore receives very high irradiation. To this end, in the beginning of 2014 the Pakistani government sanctioned a solar photovoltaic project namely Quaid-e-Azam Solar Park which was rated at 1000 MW. In this study, a cost benefit analysis for the Quaid-e-Azam Solar Park has been developed. The model uses RETScreen software. In fact, a literature review pointed out that most of the previous research work with reference to cost benefit analysis for solar projects has been mainly carried out on smaller power plants. The outcome of the study shows promising results with the simple payback period coming out at 5.6 years. Furthermore, this analysis can serve as guideline for future solar photovoltaic projects in Pakistan and can help in the development and utilization of the huge solar potential of the country, thus aiding in the reduction of energy shortage. In its proposal, our research is unique and innovative in the Pakistani context. The results aim to serve as a guideline for decision makers and researchers interested in this topic.

1. Introduction

Today, modern advancements assume a basic part in the improvement of any nation that have planned to increase their energy trade [1]. In this context, solar photovoltaic (PV) technology has gained global importance [2]. However, industry development advancement relies upon an efficient supply of electric power [3]. In any case, Pakistan is going through a power shortage that is negatively influencing the lives of individuals. The primary explanation behind the power shortage is the expanding costs of hydrocarbon assets and the absence of any desire to predict the expanding energy requirement in the nation [4]. The majority of Pakistan relies on conventional sources of power generation. The share of thermal power was 62.5% trailed by hydroelectric power (33.6%) and atomic (3.9%). In thermal power, oil had the biggest share (35.1%), trailed by characteristic gas (27.3%) and coal (0.6%). Except for hydroelectric power generation, no other renewable source is associated with the force framework [5]. Pakistan’s electricity sector is facing the worst crisis in its history. It is saddled with an overloaded infrastructure with sizeable capacity shortfall and is marred by unprecedented load shedding. The demand far surpasses supply, and henceforth load shedding is becoming a typical common phenomenon through power shutdown [6]. The shortfall in power generation across the country was more than 6000 MW, with demand standing at 14,475 MW and supply at 9465 MW [7]. There are reports that some rural areas have been experiencing load shedding and blackouts for up to 20 h, while in cities load shedding of 10 h a day can occur [8]. The upsurge of power shortages represents one of the most serious adverse domestic developments in Pakistan. The electricity shortage did not emerge suddenly. It is the direct result of imprudent and reckless energy policies over the last three decades. Hence, Pakistan’s energy bankruptcy is ultimately due to massive institutional and governance failure [9]. The energy crisis in Pakistan has crippled the country’s economy with an energy shortfall reaching up to 6000 MW. Amid this crisis, solar energy provides a way out for meeting the country’s power demands [10]. Moreover, the government is also seeking to increase the renewable energy sources within the country [11]. Pakistan, being close to the equator, receives abundant sunlight and therefore has a huge potential for solar energy [12]. The irradiation in the majority of the cities in Pakistan is close to 4.5 kWh/day, which is very high and can be used to produce electricity through solar technologies such as photovoltaic or solar thermal technologies [13]. In this context, in the beginning of 2014 the Pakistani government sanctioned a solar photovoltaic project (the Quaid-e-Azam Solar Park) which was rated at 1000 MW. At the end of 2014, the first phase of the project with a capacity of 100 MW was completed and came into being as the Quaid-e-Azam Solar Power Pvt Ltd. (QASP). (Bahawalpur, Pakistan). A literature review pointed out that most of the previous research work with reference to cost benefit analysis for solar projects has been mainly carried out on smaller power plants. The aim of the present research is to bridge this gap. Thus, our research develops a cost benefit analysis for the QASP 100 MW solar plant. RETScreen software was used to make an energy model and perform a cost, financial, and emission analysis. The results of the analysis showed that the simple payback period of the project is 5.6 years and the equity payback period is 5.8 years. The net present value (NPV) calculated by the model is $31,661,157 and the benefit to cost ratio is 1.33. Furthermore, the model shows that the net greenhouse gas (GHG) reductions over the lifecycle of the project (i.e., 25 years) are 2,264,250 tons of carbon dioxide. These results indicate that large scale solar PV systems in Pakistan can not only bridge the energy gap but also help in reducing carbon emissions. These results also reflect a positive outcome for private or foreign investments as the return on investment (ROI) can be gained in almost 5 to 6 years over the 25-year lifetime of the project. Moreover, this analysis can assist in increasing the use of solar PV in the country and act as a reference for other large scale commercial PV projects in Pakistan. In its proposal, our research is unique and innovative within the Pakistani context. The results aim to serve as a guideline for decision makers and researchers interested in this topic. In addition, the proposed analysis helps commercial and future investors evaluate the economic and financial benefits of investing in Solar PV technology in similar areas to that of QASP, Pakistan.
The rest of the paper is organized as follows: Section 2 summarizes current developments on the economic topic under consideration. Section 3 outlines our materials and methods. In Section 4 and in Section 5, the main results and their discussion are summarized, respectively. Section 6 points out suggested directions for future research that have emerged from the analysis. Finally, Section 7 summarizes the main conclusions of the study.

2. Literature Review

For an efficient utilization of a solar power plants, a cost benefit and techno economic analysis is very important for determining the optimum conditions for efficient operation [14]. In fact, as suggested by Khan et al. [15], the peculiarity of a photovoltaic system is that it requires a strong commitment of initial capital and low maintenance costs (annually about 1% of the cost of the system) [16]. The analysis of all of the economic aspects relating to a photovoltaic system is complex, considering that each installation must be evaluated in its particular context (local conditions, regulations, solar radiation, available areas, etc.) [17]. In order to make a correct comparison, it is necessary to talk about the value of the energy produced and not about the cost of energy. This is due to the fact that the quality of the energy produced by photovoltaic sources is not the same as that of traditional sources (environmental impact, intermittent energy, etc.). To better understand the reference scenario, we have investigated the documents published on this topic in the literature. In the last few years, there have been interesting studies that analyze the most cost benefit analysis for a PV plant. For a comprehensive survey of the phenomenon, an investigation using SCOPUS database, the largest abstract and citation database of peer-reviewed literature, was carried out. SCOPUS supports a Boolean syntax, which is a type of search allowing users to combine keywords with operators such as AND, NOT, and OR to further produce more relevant results. Thus, search string used in the literature survey was “solar power plant” AND “cost benefit analysis”. The string was defined according to the standards of the SCOPUS database. We applied three main criteria to select articles. Only articles in which the string “solar power plant” was found in “article title” and the string “cost benefit analysis” was found in (1) article title, in (2) abstract, or in (3) key words were analyzed. The survey into SCOPUS highlighted 179 documents on this topic. The first document was published in 1987, as shown in Figure 1. From 2017 (17 documents) to 2021 (26 documents) there is a percentage increase in the number of publications equal to 53%. The data highlights the growing scientific interest on this issue.
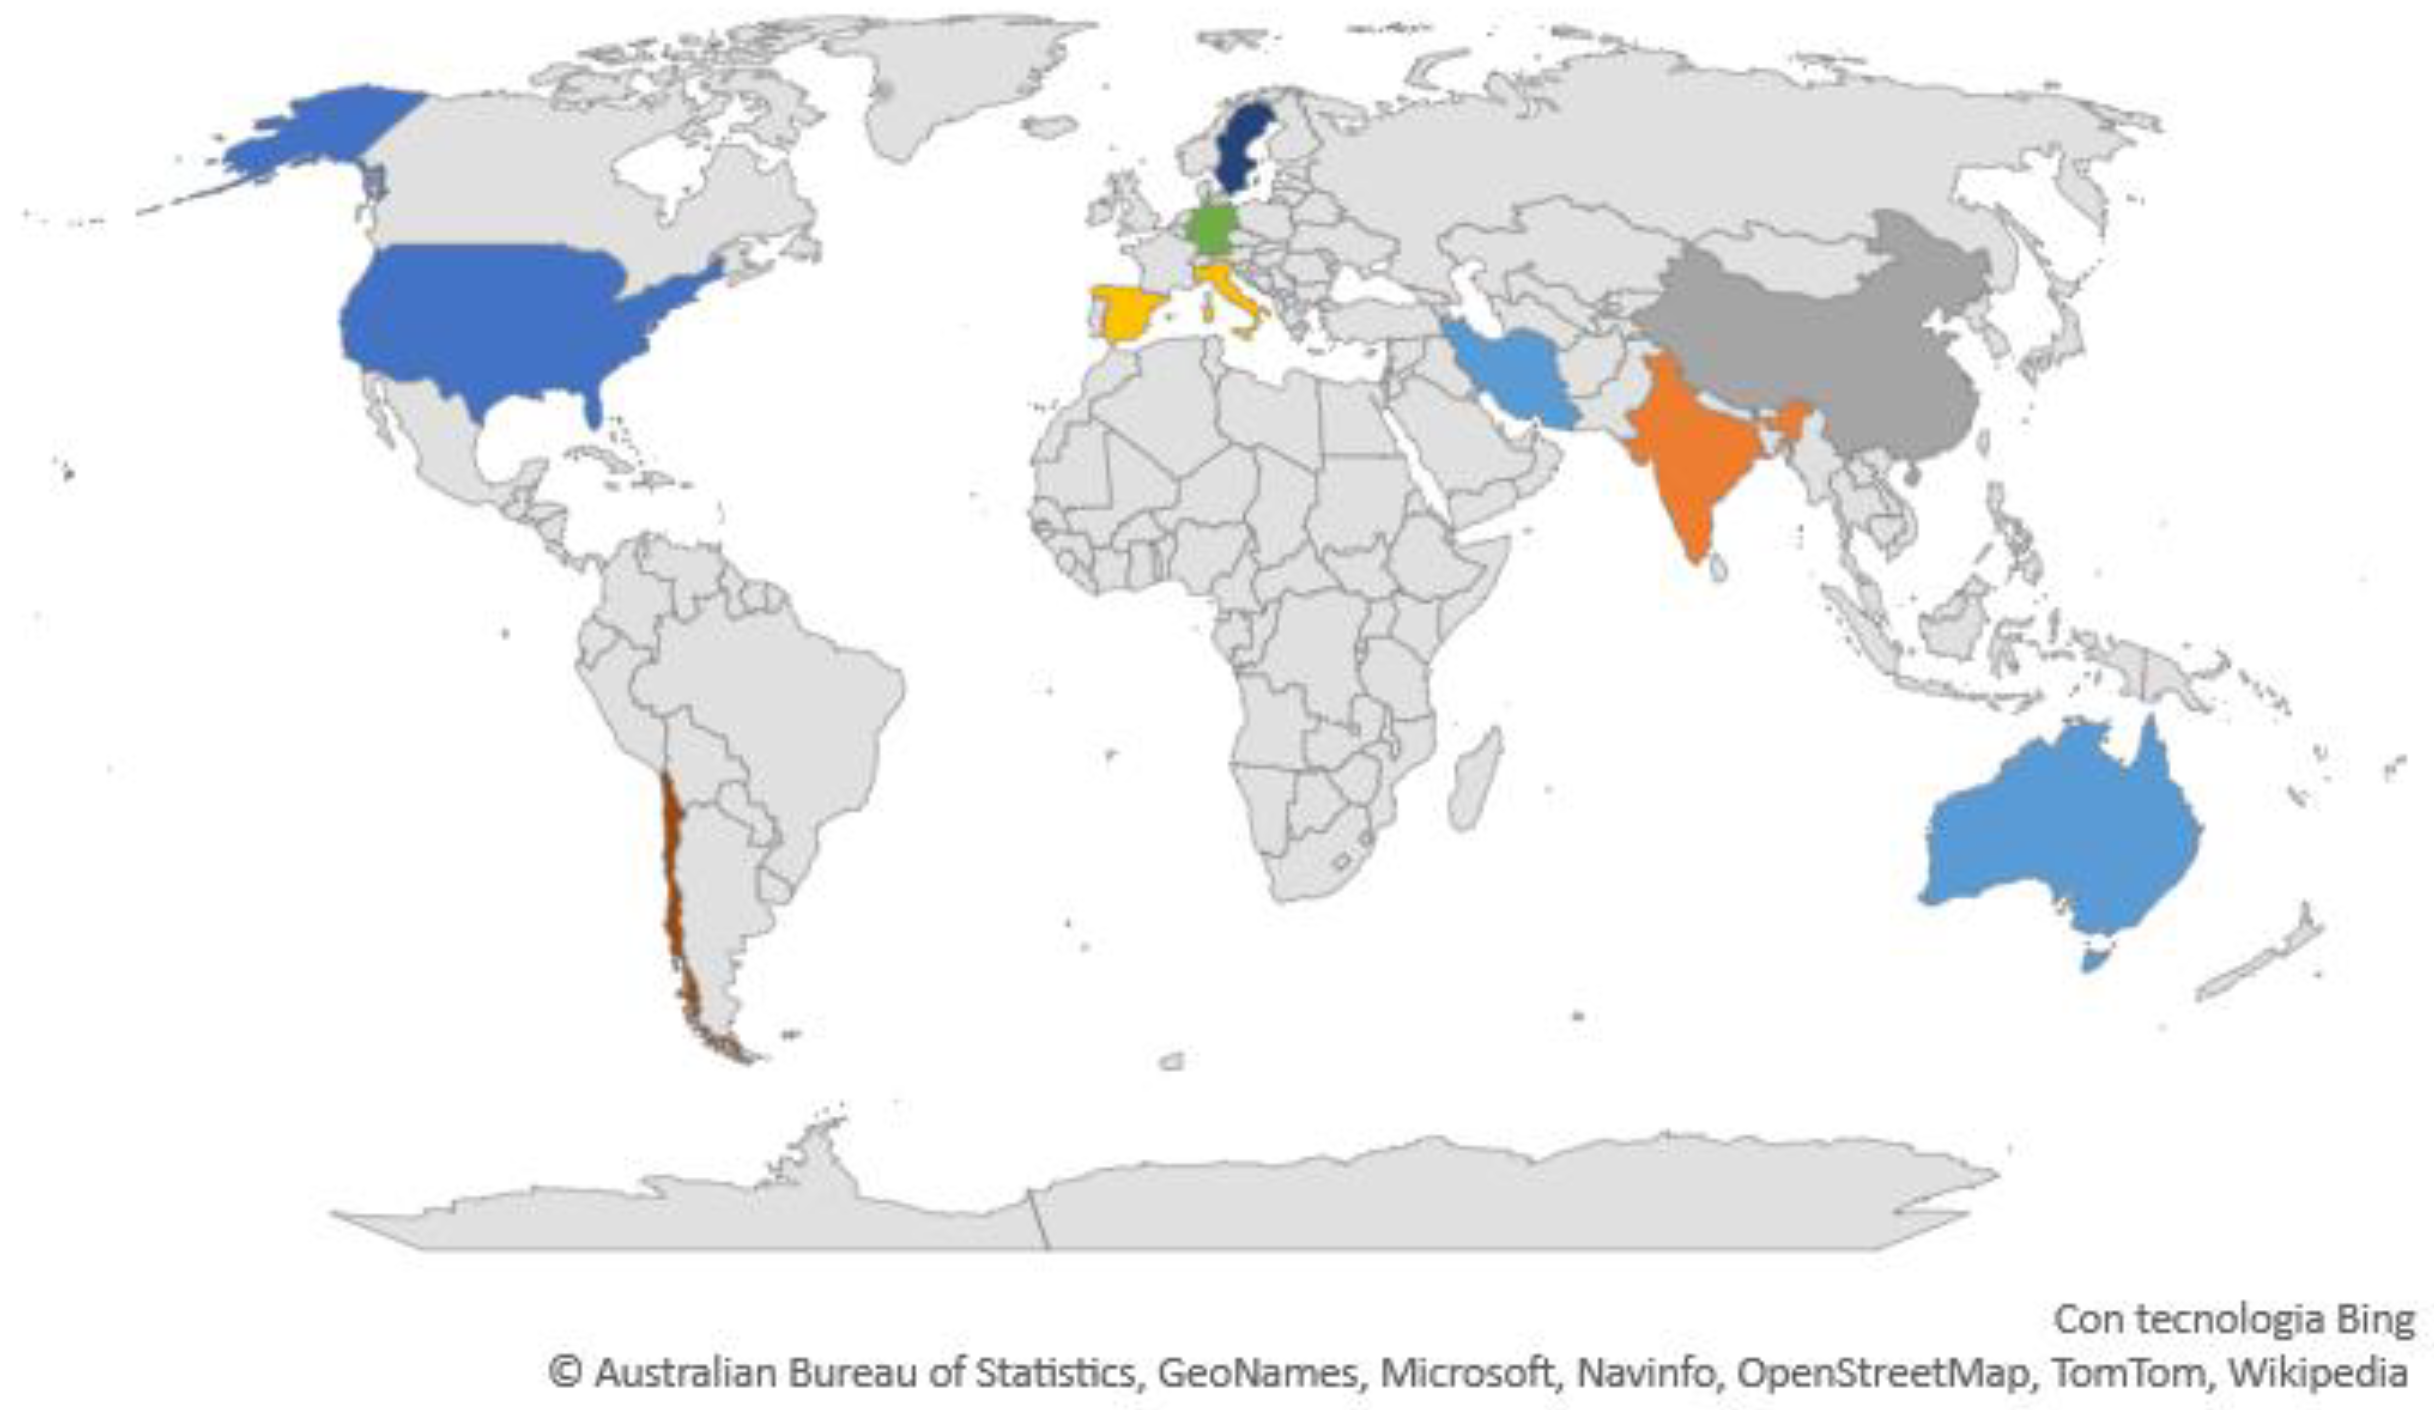
Among the ten most productive countries, it emerges that the most productive countries are the United States (15%) and India (14%), followed by China (9%) as shown in Figure 2.
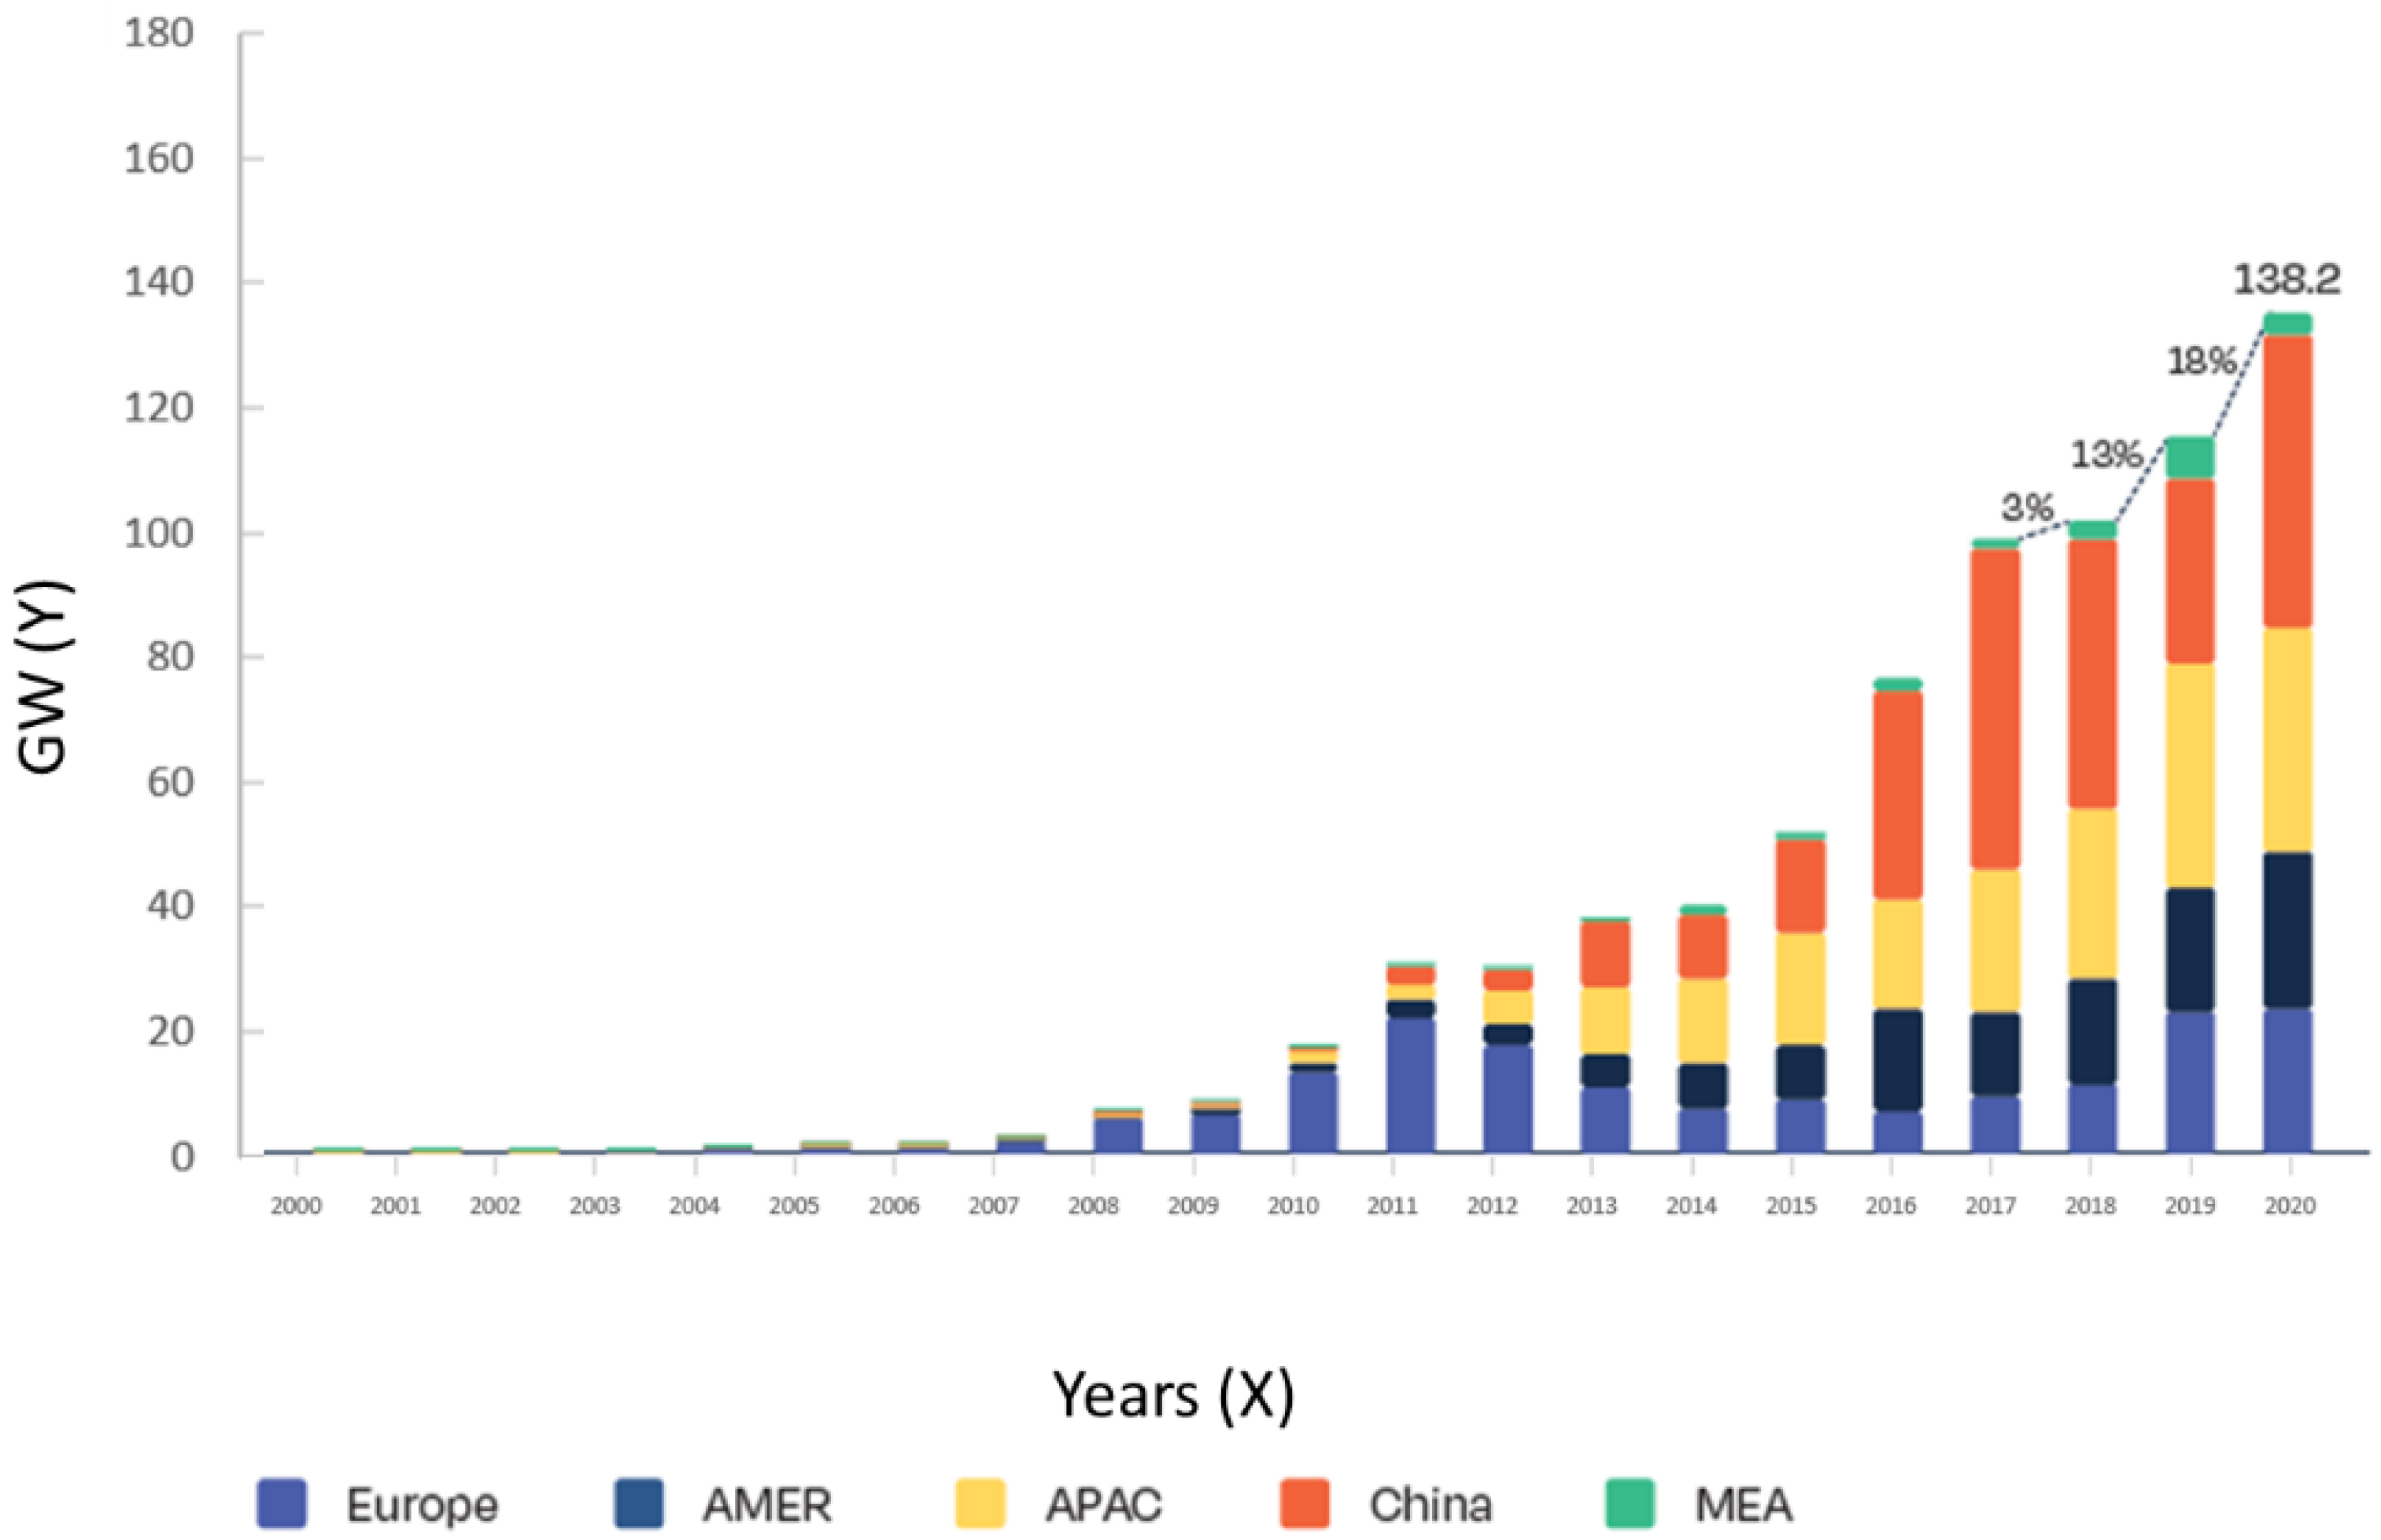
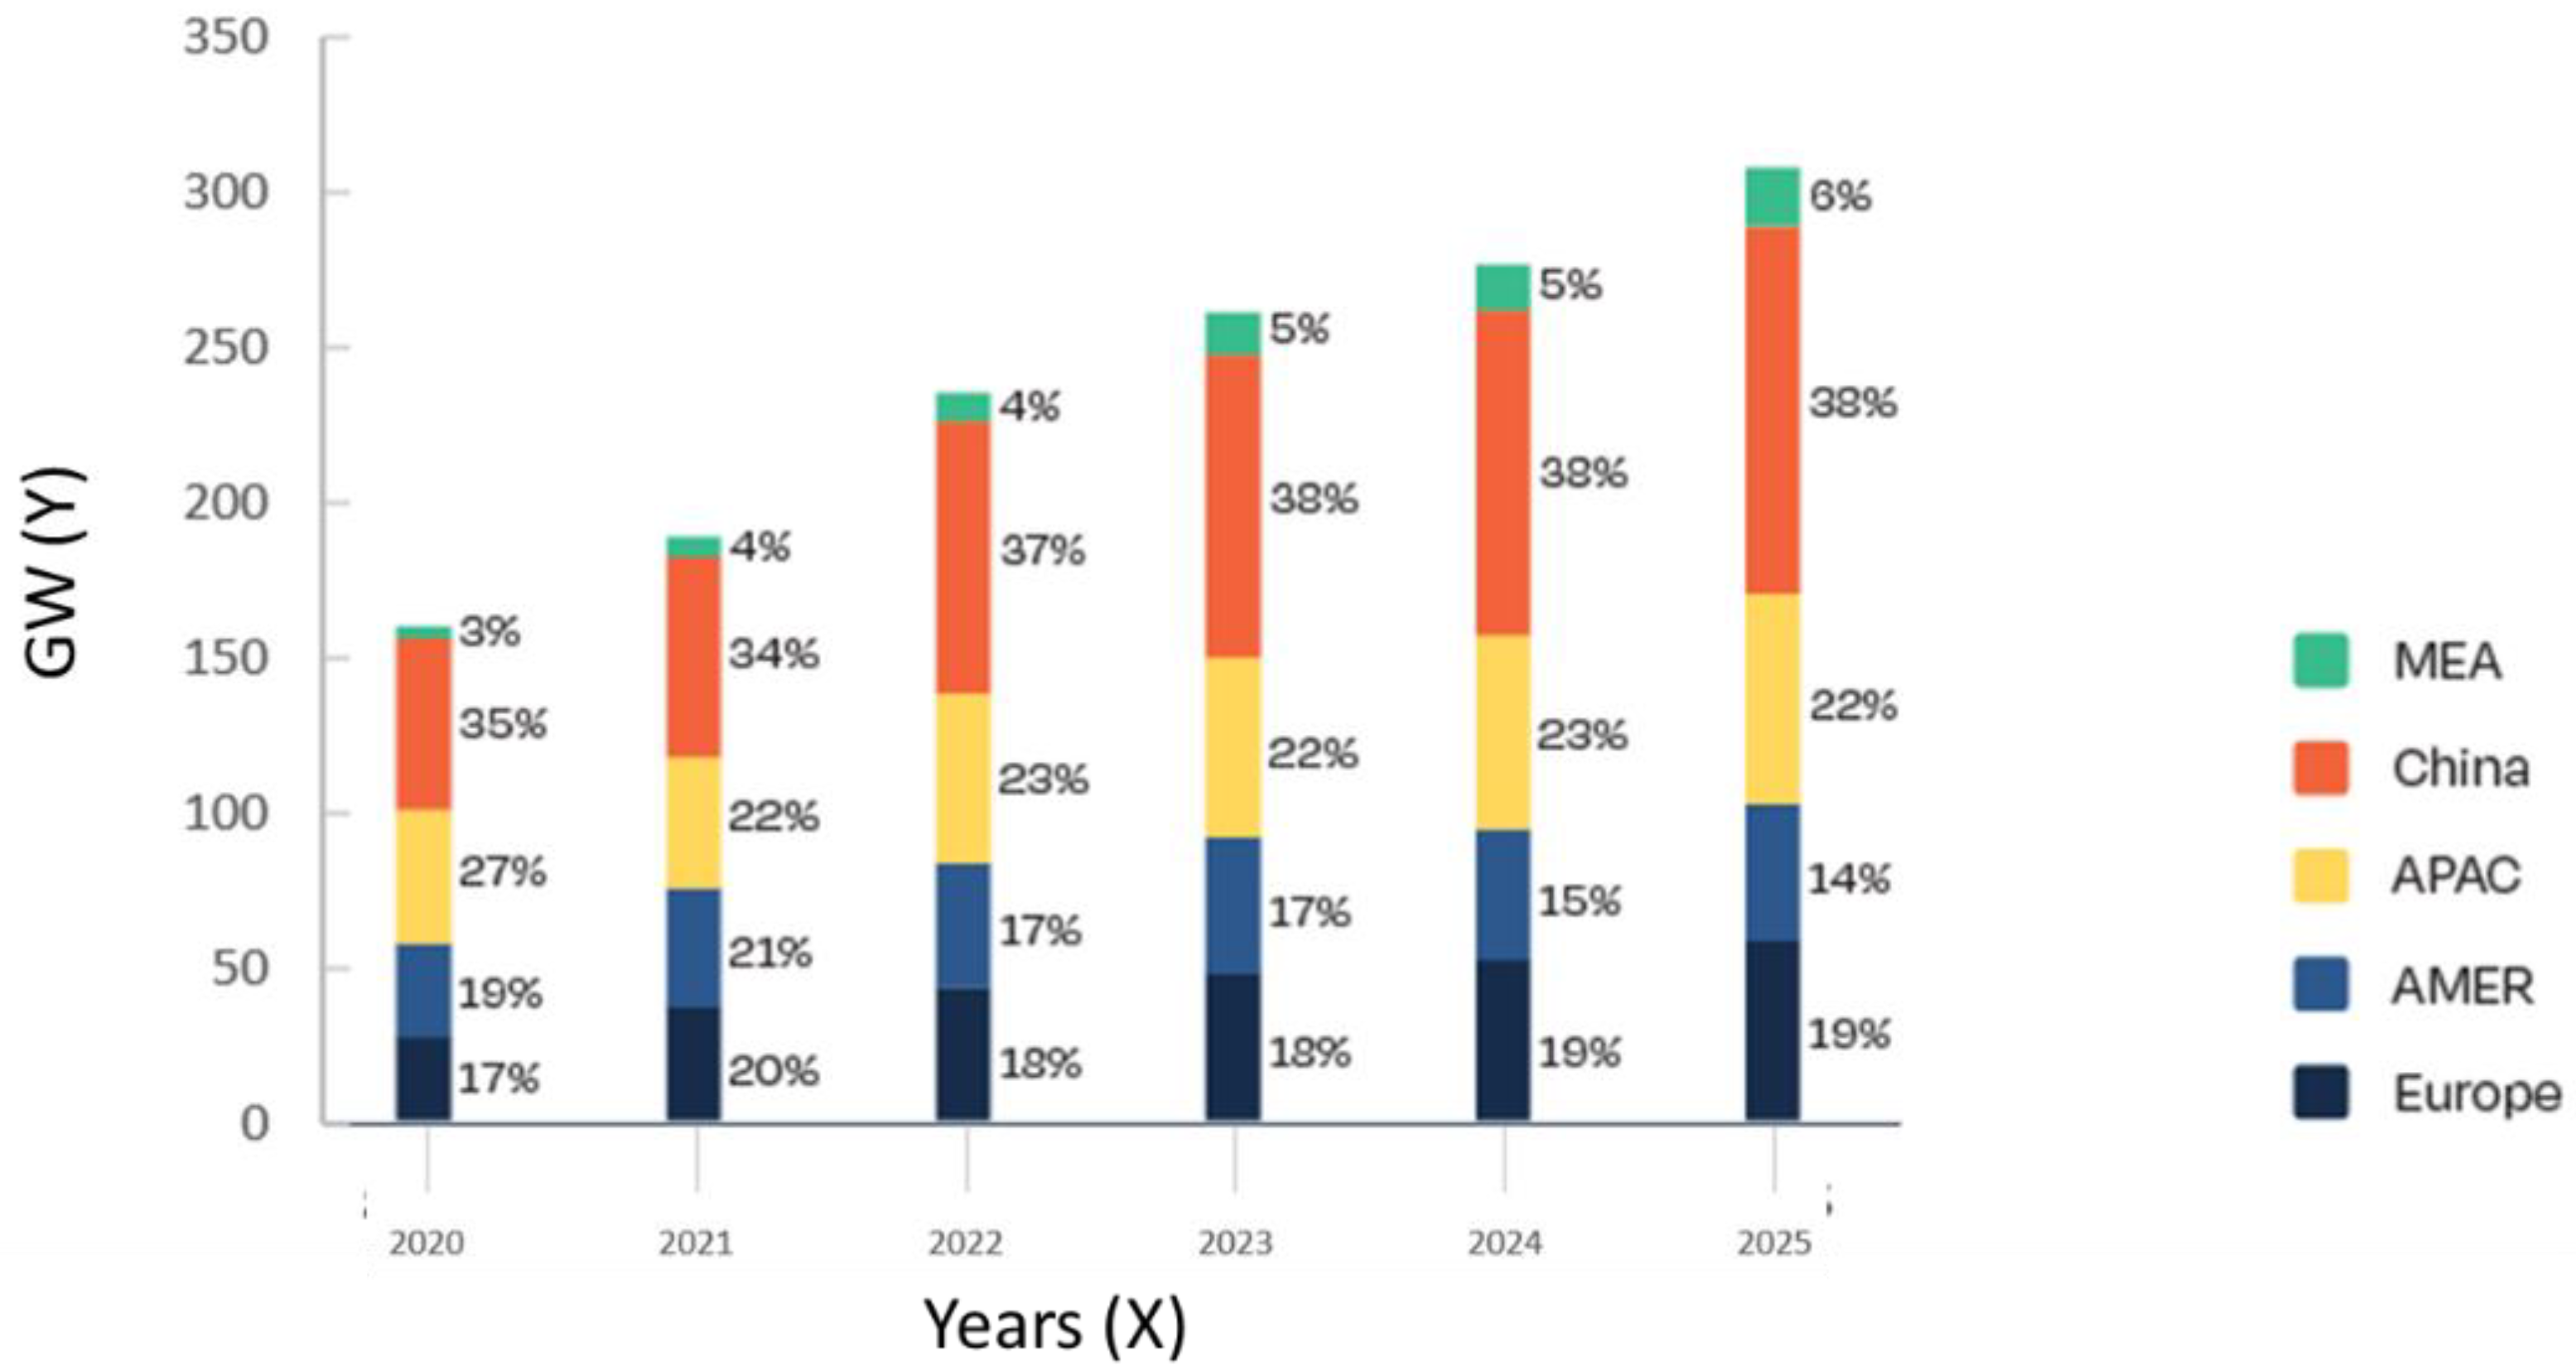
The result does not surprise us since, alongside the interest of the scientific community, the importance of the topic is also demonstrated by the latest Global Market Outlook Report [18] produced the SolarPower Europe Association. The market analysis showed that in 2020, despite the impact of the COVID-19 pandemic, the sector globally recorded double-digit growth (+18%) and a new annual record of 138.2 GW of solar technologies installed (Figure 3). Furthermore, possible growth is estimated for the period from 2021 to 2025. In this context, the United States and China are the main players.
Furthermore, possible growth is estimated for the period from 2021 to 2025. In this context, the United States and China are the main players (Figure 4).
Among the documents identified on SCOPUS, we have more carefully analyzed those closest to our research. In detail, Ullah et al. [19] develop a feasibility of a solar thermal power plant in Pakistan. Irfan et al. [20] present a techno economic analysis for an off-grid solar PV system. He suggests that their designated area (Punjab) in Pakistan is not only ideal for solar but will also supply cheap electricity and assist in reducing carbon emissions. Xu et al. [21] present a similar study for another area (Sindh) in Pakistan, reahcing the same conclusion that solar PV can provide cheap and green energy. Moreover, Shah et al. also presents a techno-economic analysis for use of solar PV in the Balochistan region of Pakistan, suggesting similar positive outcomes for cheaper and carbon-free sources electricity [22]. Sadiq et al. also reports similar findings as per his cost benefit analysis for a solar water heating system in Islamabad, Pakistan [23]. Although there is some research work highlighting the benefits of solar energy in Pakistan using techno-economic or cost benefit analysis, most of them have taken into consideration either residential or small-scale systems and have not performed analysis on larger commercial systems. However, our literature review pointed out that most of the previous work with reference to cost benefit analysis for solar projects has been mainly carried out on smaller power plants. The aim of the present research is to bridge this gap. Thus, our research develops a cost benefit analysis for the commercial system QASP 100 MW solar plant. RETScreen software was used to make an energy model and perform a cost, financial, and emission analysis.

3. Materials and Methods

This paper uses RETScreen software for energy modeling, financial analysis and GHG reduction analysis of QASP [24]. RETScreen has been developed by Canada Excellence Research Chairs (CERC) to facilitate investors in determining the viability of any clean energy project all over the world [25]. Extensive databases from various sources allows for a more accurate calculation of net present value (NPV), cumulative cash flows and simple payback [26]. The software is widely used by researchers and academics to perform energy and cost benefit analysis for renewable energy systems, furthermore it is a freeware and easy to use [27]. In our study, five criterions are selected for analyzing the financial viability for QASP (Payback Period, NPV, internal rate of return (IRR), benefit-cost ratio (BCR), and reduction in GHG Emissions). To state our aims briefly, this analysis will ascertain the time it would require recuperating the initial investment and determine what the yearly cash inflows will be throughout the life of the project. This analysis helps commercial and future investors evaluate the economic and financial benefits of investing in solar PV technology in similar areas to that of QASP, Pakistan. In addition to the benefit of ameliorating the energy crisis, these plants also help curb the GHG emissions. Each benchmark method is briefly discussed below. Payback period (Equation (1)) is the time in which the primary money inflows of a solar project are thought to be recuperated from the money inflows created by the venture. It is one of the easiest venture evaluation systems [28]. The formula to calculate payback period can be modeled by the following equation [29]:
P a y b a c k   P e r i o d = x + y z
where x is the last period with negative cash flow, y is the absolute value of cash flow at the end of period x, and z is the total cash flow after the period y.
NPV (Equation (2)) is used to decide the present estimation of a venture by the discounted aggregate of all money in-streams obtained from the solar project. NPV is different from ROI as the latter does not considers the time value of money. NPV calculations accounts for the time value of money from the QASP by including inflation, interest, and opportunity costs [30]. NPV can be calculated using the formula [31]:
N P V = C 0 + i = 0 T C i ( 1 + r ) i
where −C0 is the initial investment, C is the cash flow, r is the discount rate, i is the number of time periods, and T is the maximum time period.
While NPV can demonstrate the project’s net present worth in dollars, the IRR uncovers the rate of return from NPV money cash flows from an investment in solar PV based project. IRR (Equation (3)) is a useful tool for investors to determine the viability of an investment when comparing projects. IRR can be determined as the value of ρ that would make the following equation zero [32]:
B T C T ( 1 + ρ ) T = 0
A BCR is a calculation, used in cost-benefit analysis, that endeavors to recapitulate the cumulative value for money of an investment opportunity. A BCR is the ratio of the benefits of a project, stated in discounted present values and comparative to its costs. The higher the BCR, the better the investment. Generally, BCR should be greater than 1. To estimate annual and project lifetime energy production from the 100 MW solar power plant the data inputs that are required includes power plant location (co-ordinates), location climate details, PV module type and specifications, overall system specifications, and aggregate losses. The location of QASP is in Cholistan, district Bahawalpur (latitude 29.4, Longitude 71.7) in Punjab, Pakistan [33]. Cholistan is a desert and characterized by arid and dry climate. For local climate values, which include the solar irradiation, RETScreen software uses SolarGIS and Meteonorm databases [34]. Table 1 represents the relevant data.
Solar irradiation, azimuth, sunshine hours, and ambient temperature have significant impact on the power output of the plant. QASP employs poly-crystalline JA Solar poly-Si—JAP6-60-255/MP solar panels with a rated power output of 255 W per unit of PV module and an efficiency of 15.6%. To produce 100 MW of cumulative output, about 400,000 units of PV panels have been installed over an area of 500 acres (2.023 million m2). This power plant does not employ any solar tracking equipment due to inhibitive cost. The slope of the panels has been kept equal to the latitude (i.e., 29.4 degrees). Miscellaneous losses of the plant are around 23% and include PV loss due to irradiance level, PV loss includes loss due to temperature, array soiling/dust loss, module quality loss, module array mismatch loss, ohmic wing loss, inverter loss, external transformation loss and transmission loss. The specifications for all main equipment, PV modules, inverter, and transformers are shown in Table 2.
The transformer has a maximum efficiency of 98.7%, dimension of 155 × 2150 × 850 mm, an ambient operation temperature range of −30 to 60 °C and has a warranty of 5 years. All of the data discussed above is used in the RETScreen model.

4. Results

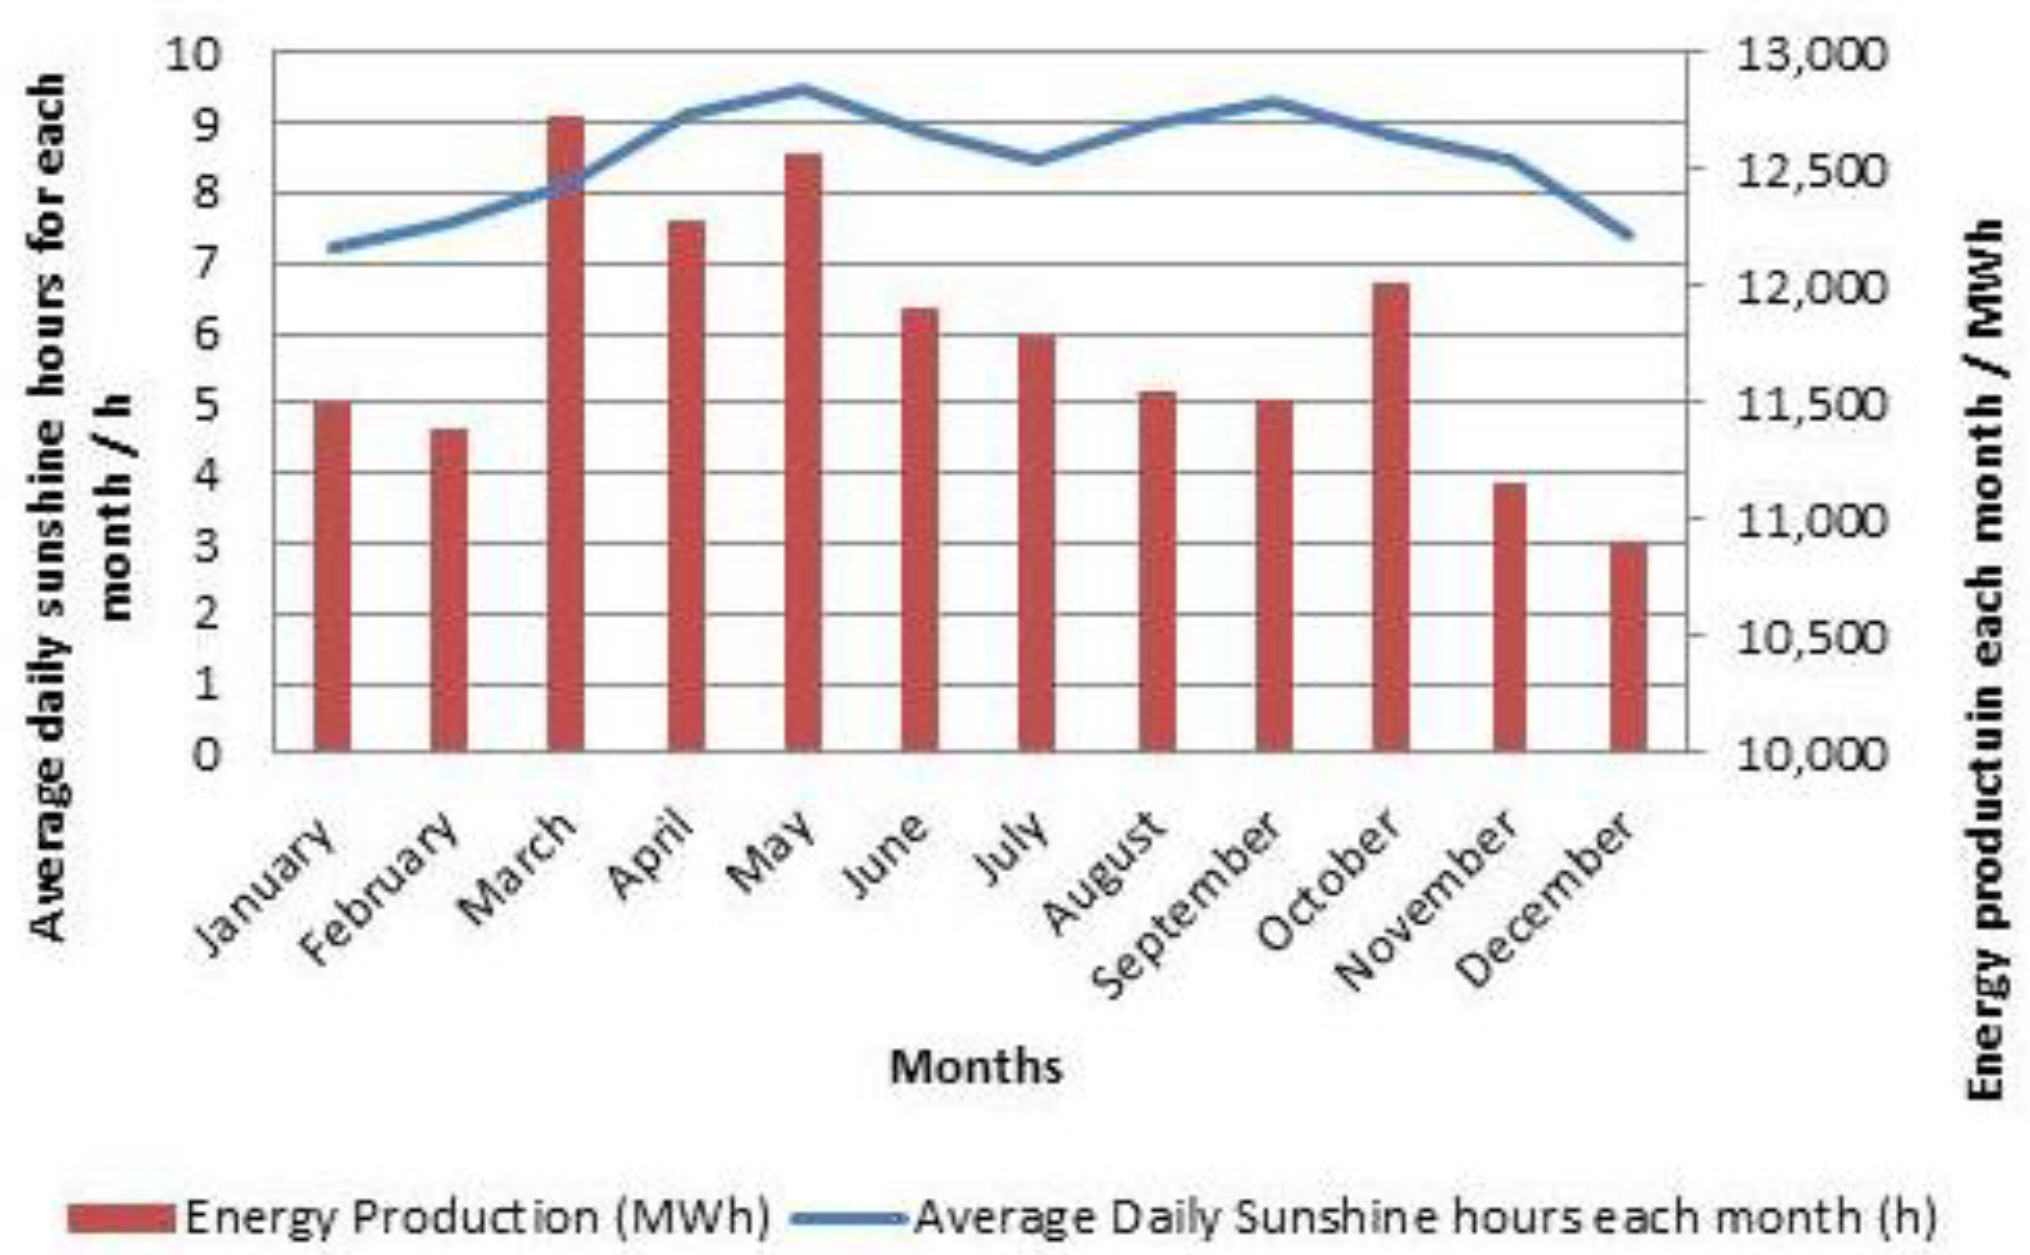
RETScreen calculated the annual energy output (141,306 MWh) against an annual average sunshine hours of 8.5 h. The monthly energy output for QASP against an average sunshine hours per month is plotted in Figure 5.
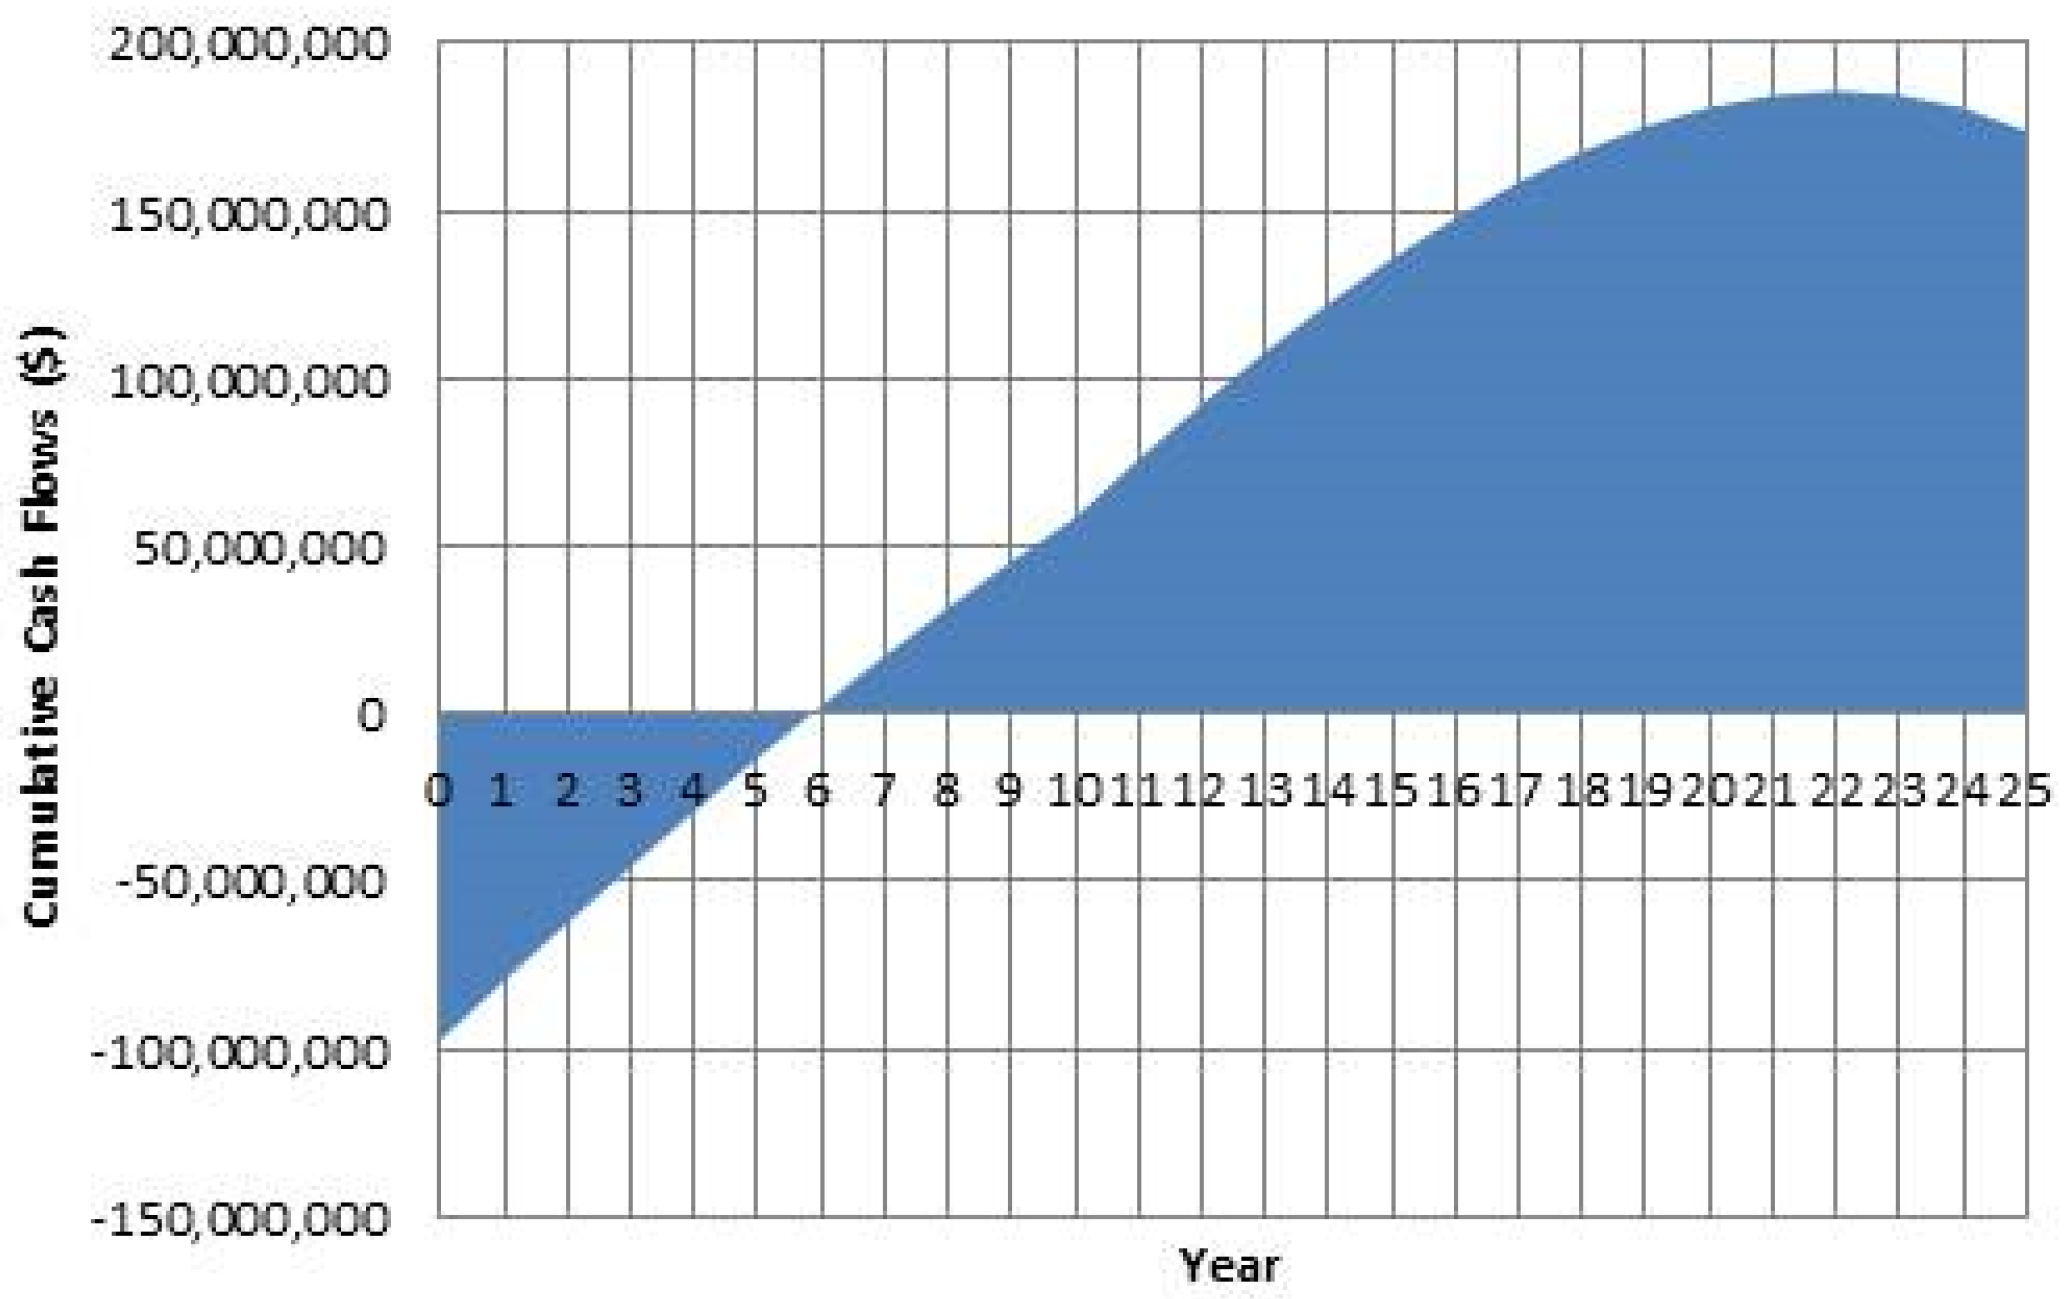
The cumulative cash flows of the power plant were also calculated over the plant’s life cycle of 25 years the following graph in Figure 6 shows the cash flows over the period of the plant’s life cycle.
From these cash flows, RETScreen calculated the required financial parameters for example IRR, NPV and BCR. These are summarized in Table 3.
GHG emission reduction for 100 MW solar power plant was also estimated. A very respectable 95,570 t of CO2 (per annum) emissions has been estimated to be reduced, which would have been emitted from a conventional thermal power plant. The annual energy output for QA Solar was calculated at around 141,306 MWh which is comparable to the target energy value of 153,300 MWh by the National Electric Power Regulatory Authority (NEPRA) and reported in the annual performance report of the solar plant in the 2020–2021 period [35]. This energy is the actual electrical energy that has been exported to the main grid. Similarly, the capacity factor of the plant is calculated to be around 15.8%, which is also very close to benchmark value of 17.5% set by NEPRA [36], which represents the percentage of actual power delivered relative to theoretical possible. Energy generation from plant varies per month according to the radiation and temperature [37]. In summers, due to increased temperature (and heat), PV panels have less efficiency so the maximum power cannot be extracted [38] as depicted in Figure 2, where sunshine hours increase May through July but overall energy output decreases due to increased temperatures, which conversely affects the PV performance [39]. An important point here is to highlight that electricity export price has been taken as mentioned by National Electric Power Regulatory Authority (NEPRA), i.e., $18.43/MWh. The first step in calculating NPV and IRR is performing cost analysis of the plant. PV panels make up the bulk of the cost and engineering, procurement and construction (EPC) is another major contributor. Moreover, technical and other services also require substantial costs. As this is a grid tied power plant, there is no need for storage [40]. Power systems’ cost have the lion’s share in total initial costs [40. These include cost of PV ($66,299,999), transmission line, substation equipment (transformers, circuit breakers etc.), cables, and inverters ($33,000,000) [41]. These costs amount to about 80.2% of the total initial investment. Power system costs are part of the EPC costs, which themselves constitute the greatest portion of initial capital expenditure. Other costs include the investment for feasibility study ($1,000,000) about 0.7% of total cost, a development ($2,500,000) close to 1.7% of overall cost. Furthermore, the cost of other engineering services is $20,000,000 about 13.8% of total cost and balance of system and miscellaneous costs add approximately $5,172,446 or 3.6% of overall expenditure. Another aspect of these costs are operation and maintenance costs which amount to $3,037,000 per annum for the life of project (25 years). Other annual costs include debt payments for 10 years which are calculated as about $5,154,666 per annum. Primary income of this plant is from selling electricity to the national grid. NEPRA has kept the levelized cost of electricity at $18.4/MWh. Per annum income amounts to $26,042,728. As a way of attracting investment in solar PV, the government kept the income tax to 0% during the time of plant commissioning. To calculate the yearly cash flows and hence other parameters for the 100 MW plant, financial parameters such as discount rate (10%), inflation rate (10%), debt ratio (33%), debt interest rate (1.38%), and debt term (10 years) are important. At the time of tariff determination, values of these rates were taken from State Bank of Pakistan’s archive. Figure 2 show these results. Note that after year five, the project has recovered its initial investment and returns from the project are enough to consider the project to be profitable. The trend for increased cash flows continues till year 24, after which a decline is observed. This represents both the decreased efficiency of the plant and cost of replacing the defected panels in year 25. It is quite evident that this project is quite attractive to the investors. With discount and inflation rates of 10% each, NPV amounts to a very high $31,661,157 and initial investment will be recovered in less than six years. As QASP is part of a larger 1000 MW solar park, these values also act as a guide for future investors. Moreover, as the project has a BCR of 1.33, this solar plant is a very valuable investment opportunity. The reason for this project being so financially viable is mainly due to the reduction in per watt cost of the PV modules over time [42]. As the PV modules are becoming cheaper it is more economical to produce power through solar PV on a large scale, moreover the solar plants also need minimal operation and maintenance during their lifetime, hence once the initial investment recovers in 5 to 6 years, then throughout the module lifetime of around 25 years, the plant owner can expect a good profit margin [43]. Furthermore, this is an environmentally friendly technology and does not produce any harmful gases to the atmosphere [44]. RETScreen was also used to estimate GHG emission reduction for 100 MW solar power plant. To put this into perspective, this same amount of CO2 reduction means that about 15,000 cars and light trucks are not used for a year [45]. As this project relies on clean and renewable solar energy, no CO2, CH4, and N2O will be emitted during the plant operation. Furthermore, this project is eligible for carbon credits under the clean development mechanism (CDM), which can be traded in future for increased revenue.

5. Discussion

Pakistan is a country where there is a high solar potential. In Bahawalpur, with very little rain and lots of sun, the project is not only feasible but also economical despite the installation of a power plant requires a heavy investment (i.e., equipment, labor, services, etc.). In addition, the developed analysis shows that providing the green energy produced reduces gas consumption and avoids the emission of more than CO2 into the atmosphere throughout the life cycle of the plant. In other words, renewable energy plays a fundamental role in a country such as Pakistan. Renewable energy technologies offer, in fact, clean sources of energy that have a much lower environmental impact than conventional energy technologies. The importance of the issue is demonstrated by the fact that major global players such as the multinational Eni S.p.A. are committed to promoting sustainable development in the countries in which they operate (as part of the energy transition strategy in which renewable sources play a central role). Eni, through its company Eni New Energy Pakistan, has started the construction of a new photovoltaic plants in the vicinity of the Bhit gas field (Eni op. 40%) in Pakistan. This trend obviously derives from the Pakistani state’s intent not only to be able to stop the vast economic crisis that is gripping the country but also to cope with the continuous and unbearable blackouts that occur day after day (an economic crisis that encompasses both energy shortages, political difficulties and fear of terrorism, and scarce foreign investment). In addition, it is important to note that the State Bank of Pakistan and the Council for Alternative Energy Development have decided to finance (it is said up to five million rupees, about 50 thousand dollars) the installation of domestic photovoltaic systems. These loans bear the name of “green market” and are aimed at “solar roofs”. It will take time, but we are convinced that only the use of renewable or alternative energy. Solar energy will be able to solve the problem of a chronic lack of electricity in countries such as Pakistan.

6. Directions for Further Research

The analysis of all of the economic aspects related to a photovoltaic system is complex, considering that each installation must be evaluated considering many aspects (local conditions, regulations, solar radiation, available areas, etc.). For years, the solution approach adopted for management decision-making problems has been that provided by single-criterion linear optimization [46]. The use of this methodological approach allows the objective to be made explicit and quantified. However, cost-benefit analysis is also usually a complex decision-making problem in the presence of multiple objectives and the constraints are often not explicit. In these cases, the use of multicriteria analysis models (MCDM) allows one to compare and order the alternatives present in the problem on the basis of data referring to objectives that are often in contrast with each other [47]. The multi-criteria analysis aims to provide support to the decision maker to achieve an acceptable compromise between the various objectives pursued. There are different decision-making methods such as ELECTRE (elimination et choix traduisant la realitè) proposed by Bernard Roy [48], DEMATEL (decision making trial and evaluation laboratory) proposed by the Geneva Research Centre of the Battelle Memorial Institute of Geneva [49], VIKOR (vlsekriterijumska optimizacija i kompromisno resenje) developed by Serafim Opricovic [50], or TOPSIS (technique for order of preference by similarity to ideal solution) proposed by Ching-Lai Hwang and Yoon in 1981 [51]. However, one of the most recognized techniques is AHP (analytic hierarchy process) which is a multi-criteria decision support technique developed in the 1970s by the naturalized Iraqi American mathematician Thomas L. Saaty [52]. AHP is used for a large variety of applications such as allocation of resources; human resources management; evaluation of employee performance; selection of alternatives; cost/benefit analysis; and innovation management. Thus, the aim of future research will be to develop an integrated cost-benefit analysis model enhanced with AHP. In fact, the methodology allows one to compare several alternatives in relation to a plurality of criteria, quantitative or qualitative, and to obtain an overall evaluation for each of them. In this way it is possible to order the alternatives according to an axis of preference; select the globally best alternative; and assign alternatives to predefined subsets. The main strengths are the paired comparison of the decision alternatives and the separation between the importance of the criterion and the impact on the decision [53].

7. Conclusions

In this study a cost benefit analysis for the Quaid-e-Azam Solar Park has been developed. The model uses the RETScreen software. From the cost benefit analysis of the power plant, some important conclusions can be drawn:
  • The installation of the 100 MW solar PV power plant for Bahawalpur is an example of decentralization of the power sector.
  • A high potential for solar energy can help ameliorate the energy crisis in Pakistan and substantially decrease GHG emissions.
  • QA Solar Power is a lucrative project established by the government aimed at a rated capacity of 1000 MW of which the first 100 MW QASP is running and supplying energy to the grid.
  • Through RETScreen software, a cost benefit analysis of the project shows that it has a simple payback of 5.6 years and BCR of 1.33. This project will generate 141,306 MWh per year and prevent about 90,570t CO2 emissions. This high return shows that such a solar PV based projects can be very successful in Pakistan and can help the country to not only eliminate its energy issues but also strengthen its economy in the long run.
Consequently, the model established in this work can serve as guideline for future solar photovoltaic projects in Pakistan and can help in the development and utilization of the huge solar potential of the country, thus aiding in the reduction of energy shortage. In addition, from the investors’ and a regulation point of view, this model can provide an overview of cost analysis.

Author Contributions

Conceptualization, M.A. and F.I.M.; methodology, M.A. and F.I.M.; software, M.A. and F.I.M.; validation, A.P., I.B.; investigation, A.P., I.B., and A.M.; resources, M.A., F.I.M., and A:P.; writing—original draft preparation, M.A., F.I.M., A.P., I.B., and A.M.; writing—review and editing, M.A., F.I.M., A.P., I.B., and A.M.; visualization, M.A., F.I.M., A.P., I.B., and A.M.; supervision, M.A., F.I.M., A.P., I.B., and A.M. All authors have read and agreed to the published version of the manuscript.

Funding

This research received no external funding.

Institutional Review Board Statement

Not applicable.

Informed Consent Statement

Not applicable.

Data Availability Statement

Not applicable.

Acknowledgments

The QASP team especially, Engineer Jahanzaib Jamshed and Engineer Kamran Iqbal for providing relevant data and help for this article.

Conflicts of Interest

The authors declare no conflict of interest.

References

  1. An, J.; Mikhaylov, A. Russian energy projects in South Africa. J. Energy S. Afr. 2020, 31, 58–64. [Google Scholar] [CrossRef]
  2. Khosa, A.A.; Rashid, T.-U.; Shah, N.-U.-H.; Usman, M.; Khalil, M.S. Performance analysis based on probabilistic modelling of Quaid-e-Azam Solar Park (QASP) Pakistan. Energy Strategy Rev. 2021, 29, 100479. [Google Scholar] [CrossRef]
  3. Sannikova, L. Legal Framework for Green Finance in the EU and Russia. Financ. J. 2021, 13, 29–43. [Google Scholar] [CrossRef]
  4. Kessides, I.N. Chaos in power: Pakistan’s electricity crisis. Energy Policy 2013, 55, 271–285. [Google Scholar] [CrossRef]
  5. Ahmad, U.; Khan, M.A. Energy Demand in Pakistan: A Disaggregate Analysis. Pak. Dev. Rev. 2008, 47, 437–455. [Google Scholar]
  6. Kazmi, H.; Mehmood, F.; Tao, Z.; Riaz, Z.; Driesen, J. “Electricity load-shedding in Pakistan: Unintended consequences, opportunities and policy recommendations. Energy Policy 2019, 128, 411–417. [Google Scholar] [CrossRef]
  7. Pasha, H.A.; Saleem, W. The Impact and Cost of Power Load Shedding to Domestic Consumers. Pak. Dev. Rev. 2013, 52, 355–373. [Google Scholar] [CrossRef] [Green Version]
  8. Sakrani, H.; Butt, T.T.; Hassan, M.; Hameed, S.; Amin, I. Implementation of load shedding apparatus for energy management in Pakistan. Commun. Comput. Inf. Sci. 2012, 281, 421–431. [Google Scholar]
  9. Awan, A.B.; Khan, Z.A. Recent progress in renewable energy—Remedy of energy crisis in Pakistan. Renew. Sustain. Energy Rev. 2014, 33, 236–253. [Google Scholar] [CrossRef]
  10. Irfan, M.; Zhao, Z.-Y.; Ahmad, M.; Mukeshimana, M. Solar Energy Development in Pakistan: Barriers and Policy Recommendations. Sustainability 2019, 11, 1206. [Google Scholar] [CrossRef] [Green Version]
  11. Mirza, U.K.; Maroto-Valer, M.M.; Ahmad, N. Status and outlook of solar energy use in Pakistan. Renew. Sustain. Energy Rev. 2003, 7, 501–514. [Google Scholar] [CrossRef]
  12. Pakistan to Unveil First Domestically Produced Solar Panels. Available online: https://www.saurenergy.com/solar-energy-news/pakistan-to-unveil-first-domestically-produced-solar-panels (accessed on 21 October 2021).
  13. Adnan, S.; Khan, A.H.; Haider, S.; Mahmood, R. Solar energy potential in Pakistan. J. Renew. Sustain. Energy 2012, 4, 032701. [Google Scholar] [CrossRef]
  14. Khan, S.; Shaikh, F.; Siddiqui, M.M.; Hussain, T.; Kumar, L.; Nahar, A. Hourly Forecasting of Solar Photovoltaic Power in Pakistan Using Recurrent Neural Networks. Int. J. Photoenergy 2022, 2022, 7015818. [Google Scholar] [CrossRef]
  15. Jamil, S.R.; Wang, L.; Tang, C.; Khan, H.M.S.; Che, D. The role and impact of costing method in the decision-making of energy project: A comparative assessment between levelized cost of energy and benefit-to-cost ratio analysis. Int. J. Energy Res. 2021, in press. [CrossRef]
  16. Kranina, E.I. China on the way to achieving carbon neutrality. Financ. J. 2021, 13, 51–61. [Google Scholar] [CrossRef]
  17. Luo, Y.; Wang, Z.; Zhu, J.; Lu, T.; Xiao, G.; Chu, F.; Wang, R. Multi-objective robust optimization of a solar power tower plant under uncertainty. Energy 2022, 238, 121716. [Google Scholar] [CrossRef]
  18. Europe Solar Power. SolarPower Europe, Global Market Outlook for Solar Power 2021–2025; Solar Power Europe: Brussels, Belgium, 2021. [Google Scholar]
  19. Ullah, I.; Rasul, M.G.; Sohail, A.; Islam, M.; Ibrar, M. Feasibility of a solar thermal power plant in Pakistan. In Thermal Power Plants—Advanced Applications; InTech: London, UK, 2013. [Google Scholar]
  20. Irfan, M.; Zhao, Z.Y.; Ahmad, M.; Rehman, A. A techno-economic analysis of off-grid solar PV system: A case study for Punjab Province in Pakistan. Processes 2019, 7, 708. [Google Scholar] [CrossRef] [Green Version]
  21. Xu, L.; Wang, Y.; Solangi, Y.A.; Zameer, H.; Shah, S.A.A. Off-grid solar PV power generation system in Sindh, Pakistan: A techno-economic feasibility analysis. Processes 2019, 7, 308. [Google Scholar] [CrossRef] [Green Version]
  22. Shah, S.A.A.; Valasai, G.D.; Memon, A.A.; Laghari, A.N.; Jalbani, N.B.; Strait, J.L. Techno-economic analysis of solar PV electricity supply to rural areas of Balochistan, Pakistan. Energies 2018, 11, 1777. [Google Scholar] [CrossRef] [Green Version]
  23. Sadiq, M. Solar water heating system for residential consumers of Islamabad, Pakistan: A cost benefit analysis. J. Clean. Prod. 2018, 172, 2443–2453. [Google Scholar] [CrossRef]
  24. Wazir, R.; Khan, Z.A.; Siddique, S. Techno-economic study for 50 MW wind farm in gawadar coastal city of Balochistan-Pakistan using ARIMA model and RETScreen. In Proceedings of the 17th IEEE International Multi Topic Conference: Collaborative and Sustainable Development of Technologies, Bahria University, Karachi Campus, Pakistan, 8–10 December 2014; pp. 417–421. [Google Scholar]
  25. Mehmood, A.; Shaikh, F.A.; Waqas, A. Modeling of the solar photovoltaic systems to fulfill the energy demand of the domestic sector of Pakistan using RETSCREEN software. In Proceedings of the 2014 International Conference and Utility Exhibition on Green Energy for Sustainable Development (ICUE), Pattaya, Thailand, 19–21 March 2014. [Google Scholar]
  26. Zandi, M.; Bahrami, M.; Eslami, S.; Gavagsaz-Ghoachani, R.; Payman, A.; Phattanasak, M.; Nahid-Mobarakeh, B.; Pierfederici, S. Evaluation and comparison of economic policies to increase distributed generation capacity in the Iranian household consumption sector using photovoltaic systems and RETScreen software. Renew. Energy 2017, 107, 215–222. [Google Scholar] [CrossRef]
  27. Vollaro, R.d.; Vollaro, E.d. Informing on Best Practices Using Design Builder and RET Screen to Calculate Energetic, Financial, and Environmental Impacts of Energy Systems for Buildings. Int. J. Adv. Res. Eng. 2018, 4, 11. [Google Scholar] [CrossRef]
  28. Yuce, M.I.; Yuce, S.; Yuce, I.M. Pre-feasibility Assessment of Small Hydropower Projects in Turkey by RETScreen. J. Am. Water Work. Assoc. 2016, 108, E269–E275. [Google Scholar] [CrossRef]
  29. Oxford Reference. Payback Period Method. Available online: https://www.oxfordreference.com/view/10.1093/oi/authority.20110803100311879 (accessed on 2 January 2022).
  30. Investopedia. How to Calculate Net Present Value (NPV) and Formula. Available online: https://www.investopedia.com/ask/answers/032615/what-formula-calculating-net-present-value-npv.asp (accessed on 31 January 2022).
  31. Reniers, G.; Talarico, L.; Paltrinieri, N. Cost-benefit analysis of safety measures. In Dynamic Risk Analysis in the Chemical and Petroleum Industry; Butterworth-Heinemann: Oxford, UK, 2016. [Google Scholar]
  32. RETScreen. Available online: https://www.nrcan.gc.ca/maps-tools-and-publications/tools/modelling-tools/retscreen/7465 (accessed on 2 January 2022).
  33. Ganoe, R.E.; Stackhouse, P.W.; Deyoung, R.J. RETScreen® Plus Software Tutorial; NASA: Hampton, VA, USA, 2014. [Google Scholar]
  34. Khan, H.A.; Iqbal, M. Feasibility Study Report 10 MW Solar PV Power Project in Quaid E Azam Solar Park. Available online: https://www.qasolar.com/annual-reports/ (accessed on 2 January 2022).
  35. Annual Report 2020–2021 100 MW Solar Power Plant Bahawalpur. 2020. Available online: https://qasolar.com/app/download/12897951699/Annual+Report+of+QASPL+2020.pdf?t=1631704346 (accessed on 2 January 2022).
  36. National Electric Power Regulatory Authority (NEPRA). Available online: https://nepra.org.pk/publications/Annual%20Reports/Annual%20Report%202020-21.pdf (accessed on 2 January 2022).
  37. Rahman, M.M.; Hasanuzzaman, M.; Rahim, N.A. Effects of various parameters on PV-module power and efficiency. Energy Convers. Manag. 2015, 103, 348–358. [Google Scholar] [CrossRef]
  38. Verma, S.; Mohapatra, S.; Chowdhury, S.; Dwivedi, G. Cooling techniques of the PV module: A review. Mater. Today Proc. 2020, 38, 253–258. [Google Scholar] [CrossRef]
  39. Li, C. Comparative performance analysis of grid-connected PV power systems with different PV technologies in the hot summer and cold winter zone. Int. J. Photoenergy 2018, 2018, 8307563. [Google Scholar] [CrossRef]
  40. Agyekum, E.B. Techno-economic comparative analysis of solar photovoltaic power systems with and without storage systems in three different climatic regions, Ghana. Sustain. Energy Technol. Assess. 2021, 43, 100906. [Google Scholar] [CrossRef]
  41. Comstock, O. Construction Costs for Most Power Plant Types Have Fallen in Recent Years. 2017. Available online: https://www.eia.gov/todayinenergy/detail.php?id=31912# (accessed on 2 January 2022).
  42. Castillo-Ramírez, A.; Mejía-Giraldo, D.; Muñoz-Galliano, N.; Castillo-Ramírez, A.; Mejía-Giraldo, D.; Muñoz-Galeano, N. Large-Scale Solar PV LCOE Comprehensive Breakdown Methodology. CTF Cienc. Tecnol. Futur. 2017, 7, 117–126. [Google Scholar] [CrossRef]
  43. Pillai, U. Drivers of cost reduction in solar photovoltaics. Energy Econ. 2015, 50, 286–293. [Google Scholar] [CrossRef]
  44. NREL. What Is the Energy Payback for PV? 2004. Available online: https://www.nrel.gov/docs/fy04osti/35489.pdf (accessed on 31 January 2022).
  45. Behi, B.; Baniasadi, A.; Arefi, A.; Gorjy, A.; Jennings, P.; Pivrikas, A. Cost-benefit analysis of a virtual power plant including solar PV, flow battery, heat pump, and demand management: A Western Australian case study. Energies 2020, 13, 2614. [Google Scholar] [CrossRef]
  46. Ortiz-Barrios, M.; Miranda-De la Hoz, C.; López-Meza, P.; Petrillo, A.; De Felice, F. A case of food supply chain management with AHP, DEMATEL, and TOPSIS. J. Multi-Criteria Decis. Anal. 2020, 27, 104–128. [Google Scholar] [CrossRef]
  47. Petrillo, A.; Carotenuto, P.; Baffo, I.; De Felice, F. A web-based multiple criteria decision support system for evaluation analysis of carpooling. Environ. Dev. Sustain. 2018, 20, 2321–2341. [Google Scholar] [CrossRef]
  48. Figueira, J.R.; Greco, S.; Roy, B. ELECTRE-SCORE: A first outranking based method for scoring actions. Eur. J. Oper. Res. 2022, 297, 986–1005. [Google Scholar] [CrossRef]
  49. Chai, Q.; Li, H.; Tian, W.; Zhang, Y. Critical Success Factors for Safety Program Implementation of Regeneration of Abandoned Industrial Building Projects in China: A Fuzzy DEMATEL Approach. Sustainability 2022, 14, 1550. [Google Scholar] [CrossRef]
  50. Serafim, O.; Gwo-Hshiung, T. The Compromise solution by MCDM methods: A comparative analysis of VIKOR and TOPSIS. Eur. J. Oper. Res. 2004, 156, 445–455. [Google Scholar]
  51. Hwang, C.L.; Lai, Y.J.; Liu, T.Y. A new approach for multiple objective decision making. Comput. Oper. Res. 1993, 20, 889–899. [Google Scholar] [CrossRef]
  52. Saaty, T.L. A scaling method for priorities in hierarchical structures. J. Math. Psychol. 1977, 15, 234–281. [Google Scholar] [CrossRef]
  53. Saaty, T.L. Applications of analytical hierarchies. Math. Comput. Simul. 1979, 21, 1–20. [Google Scholar] [CrossRef]
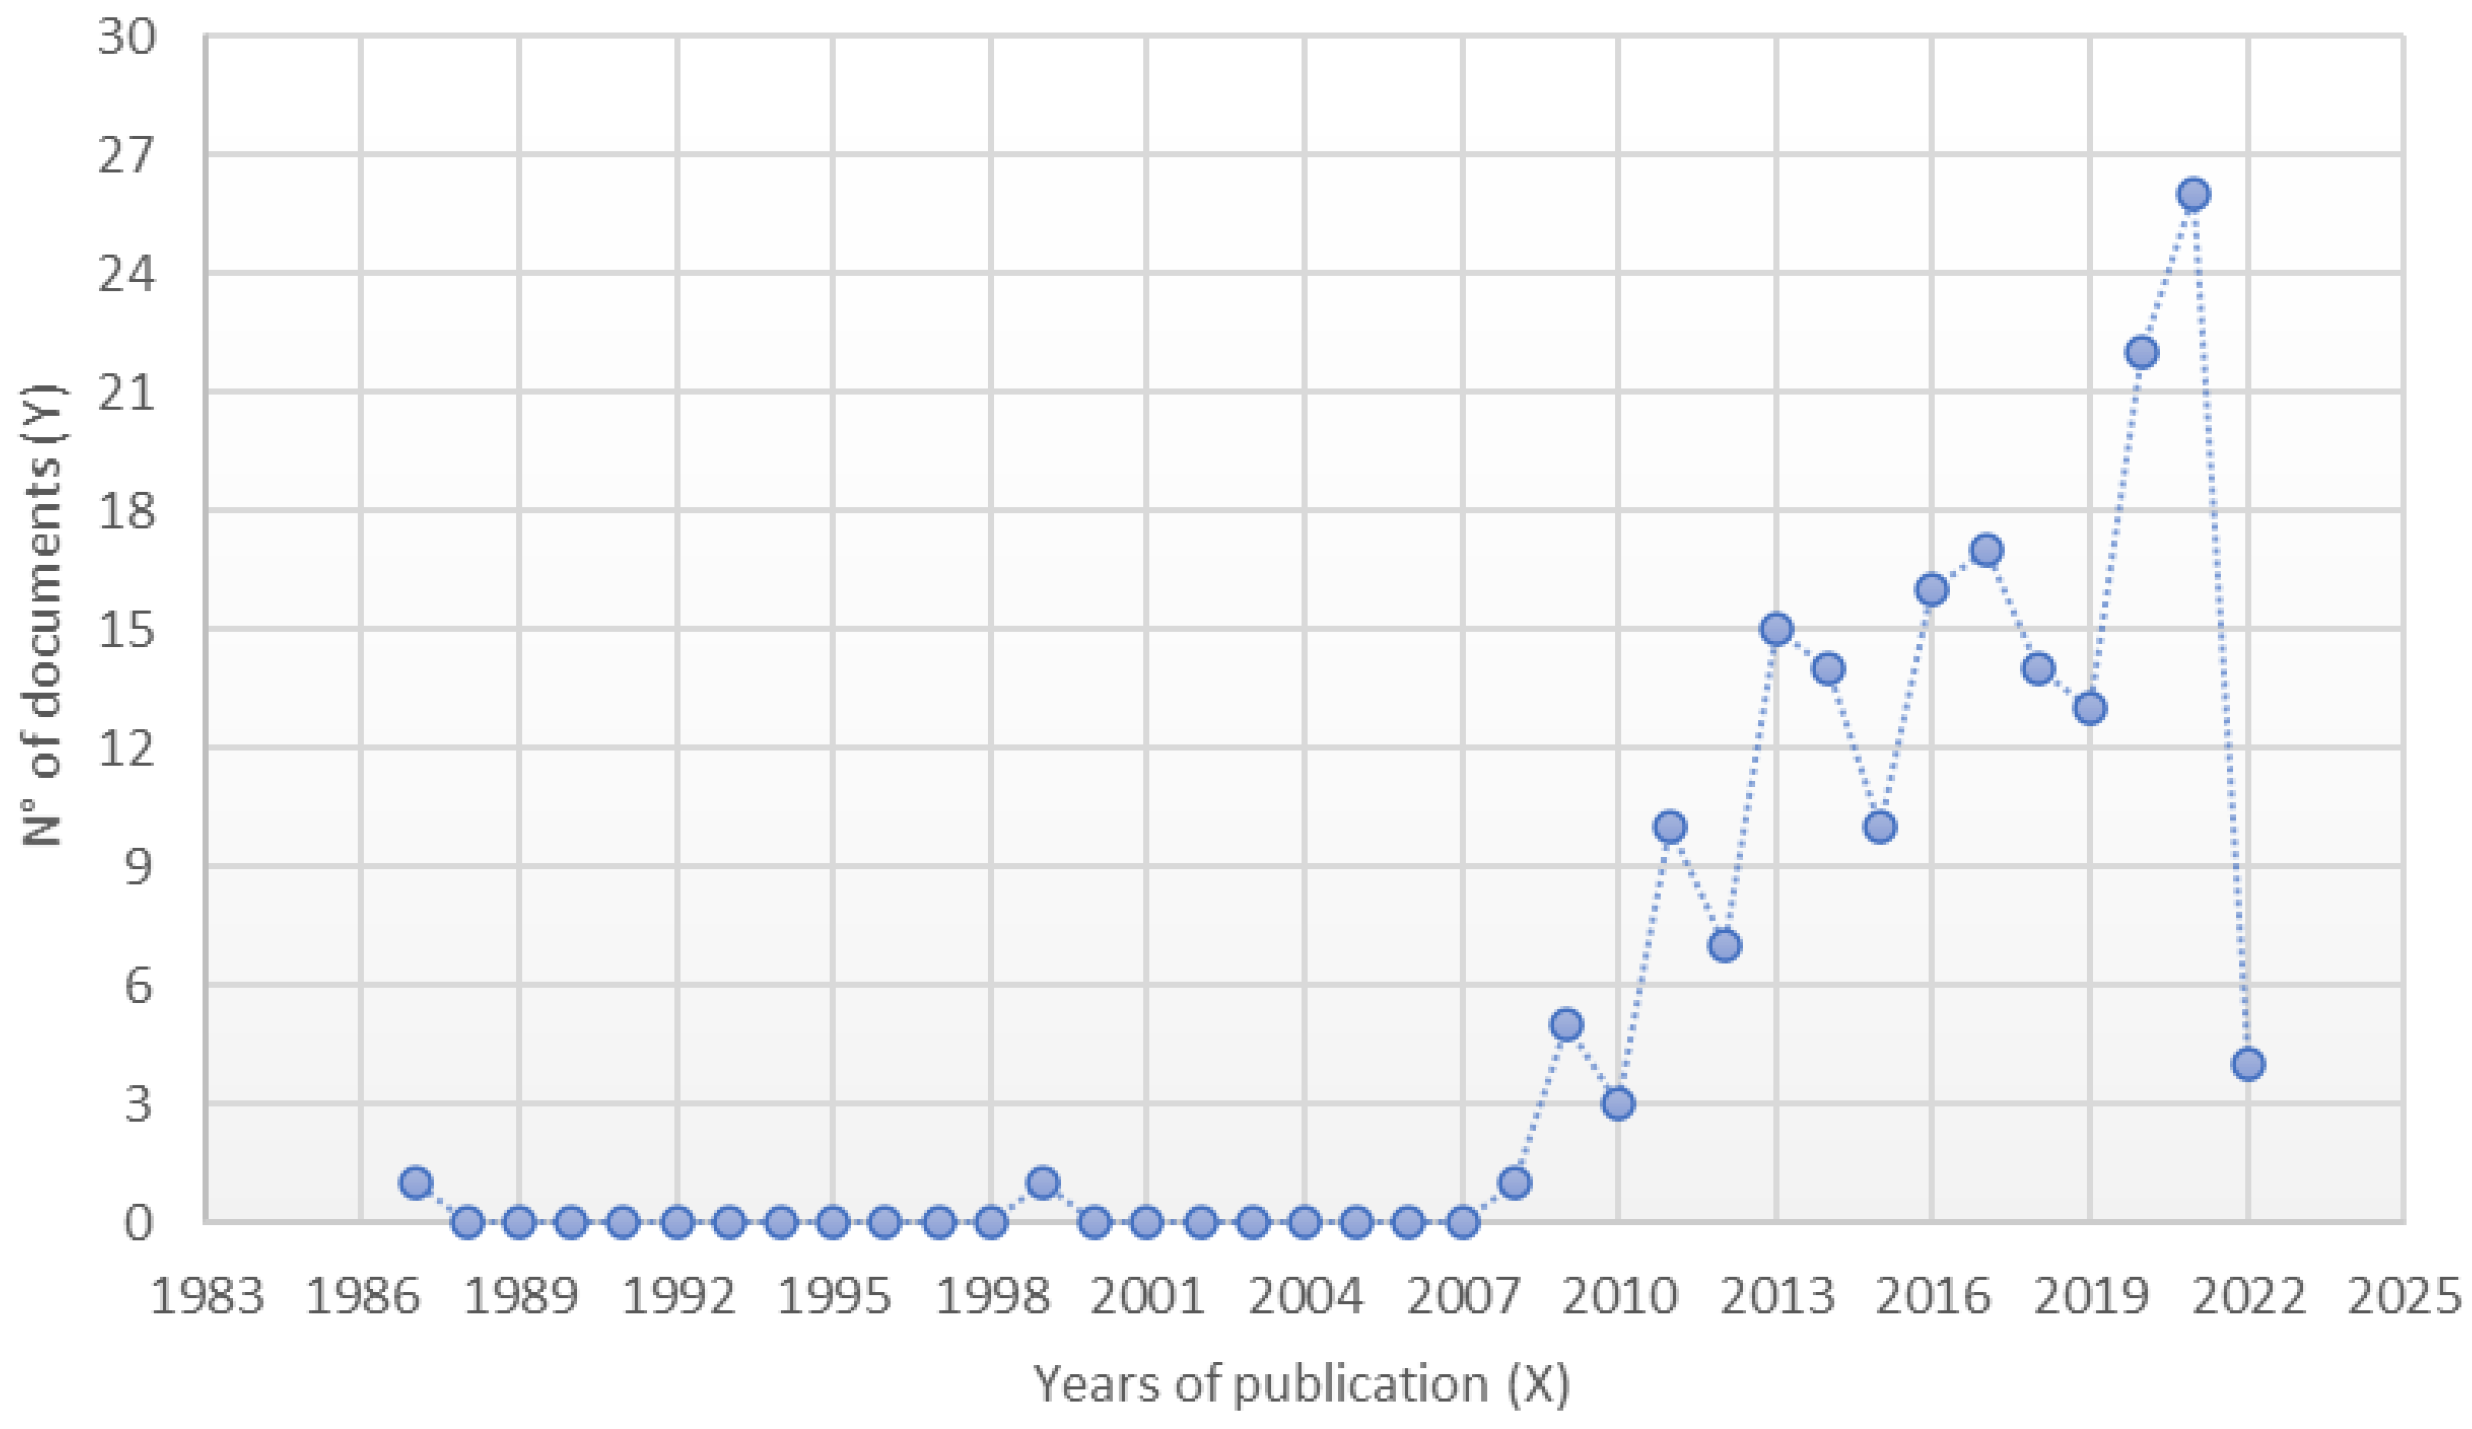
Figure 1. Documents by years (source: Scopus).
Sustainability 14 02895 g001
Figure 2. Documents by country (source: Scopus).
Sustainability 14 02895 g002
Figure 3. Annual solar PV installed capacity from 2000 to 2020 (source: Global Market Outlook For Solar Power 2021–2025).
Sustainability 14 02895 g003
Figure 4. Evolution of global annual solar PV market shares until 2025 (source: Global Market Outlook for Solar Power 2021–2025).
Sustainability 14 02895 g004
Figure 5. Bar graph showing monthly energy prodcution for QASP as given by RETScreen.
Sustainability 14 02895 g005
Figure 6. Cash flow as given by RETScreen.
Sustainability 14 02895 g006
Table 1. Cholistan Climate Data [34,35].
MonthAir
T °C
Rel. Humid%Daily Solar Radiation n-Horizontal kWh/m2/DayAtmosp. PWind SpeedEarth T °CHeating Days
°C-d
Cooling Days
°C-d
January12.642.43.6199.63.013.516880
February15.435.84.4799.43.317.172152
March21.927.85.2599.03.524.90367
April27.726.55.9998.53.732.10531
May31.928.86.5398.13.936.50679
June33.740.66.6797.64.038.00712
July32.059.06.2197.73.635.80682
August30.365.65.6797.93.233.10631
September29.452.05.3198.43.231.90581
October25.630.24.6598.93.127.50483
November19.829.23.8499.43.020.70295
December14.536.33.3499.72.915.1108140
Annual24.639.65.1398.73.427.23485333
Table 2. Summary of all equipment used in QASP solar PV plant [25].
Equipment Technical Specifications
Solar PV Module Specifictaions
Total Capacity Solar Plant (MWp)100ModelJA Solar JAP(BK) 60/225/3BB
Quantity of Arrays9804TypePolycrystalline
Quantity of Modules in a string20Rated Max. Power at STC255 W ± 5 W
Quantity of Modules400,000Module Efficiency15.59%
Quantity of Inverters100Class of ModuleA
Quantity of DC Combiner Boxes1300Dimensions1650 × 991 × 40 mm
Quantity of 33 kV Box Type Transformers100Degradation Gradient0.7%/year
Quantity of 132 kV Transformers (1000 MVA each)2Warranty25 years linear power output
Inverter Specifications Inverter Specifications
ManufacturerTBEAModelTBEA-TC500KH
Input parameters Output parameters
Rated DC Input Power618 KWRated AC Output Power500 kW
Max. DC Input Voltage1000 VMax. AC Voltage Power600 kW
DC Voltage Range450–1000 VRated AC Voltage Range270-350 V
MPP Voltage Range500–820 VRated Grid Voltage315 V
Max. DC Current1236ARated Output Current916 A
33 kV Transformer Specifications 132 kV Transformer Specifications
ManufacturerTBEAManufacturerTBEA
ModelZGS11-1000/33ModelSFZ-100,000/132
Rating Power1000/(500-500) kVARated Power100 MVA
Rated Voltage33.5/0/315 kVRated Voltage33/132 kV
Table 3. Financial viability factor results from RETScreen.
Financial Viability ParametersValue
IRR—Equity15.1%
IRR—Assets8.1%
Simple Payback5.6 years
Equity Payback5.8 years
Net Present Value (NPV)$31,661,157
Annual Life Savings$3,488,049/year
Benefit-Cost Ratio (BCR)1.33
Debt Services Coverage4.40
Publisher’s Note: MDPI stays neutral with regard to jurisdictional claims in published maps and institutional affiliations.