Author Contributions
Data curation, J.W. and Z.Z.; Formal analysis, J.W., Z.Z. and X.Y.; Funding acquisition, D.W.; Investigation, Y.H. and Q.T.; Supervision, D.W. and M.O.; Validation, M.O.; Writing—original draft, J.W. All authors have read and agreed to the published version of the manuscript.
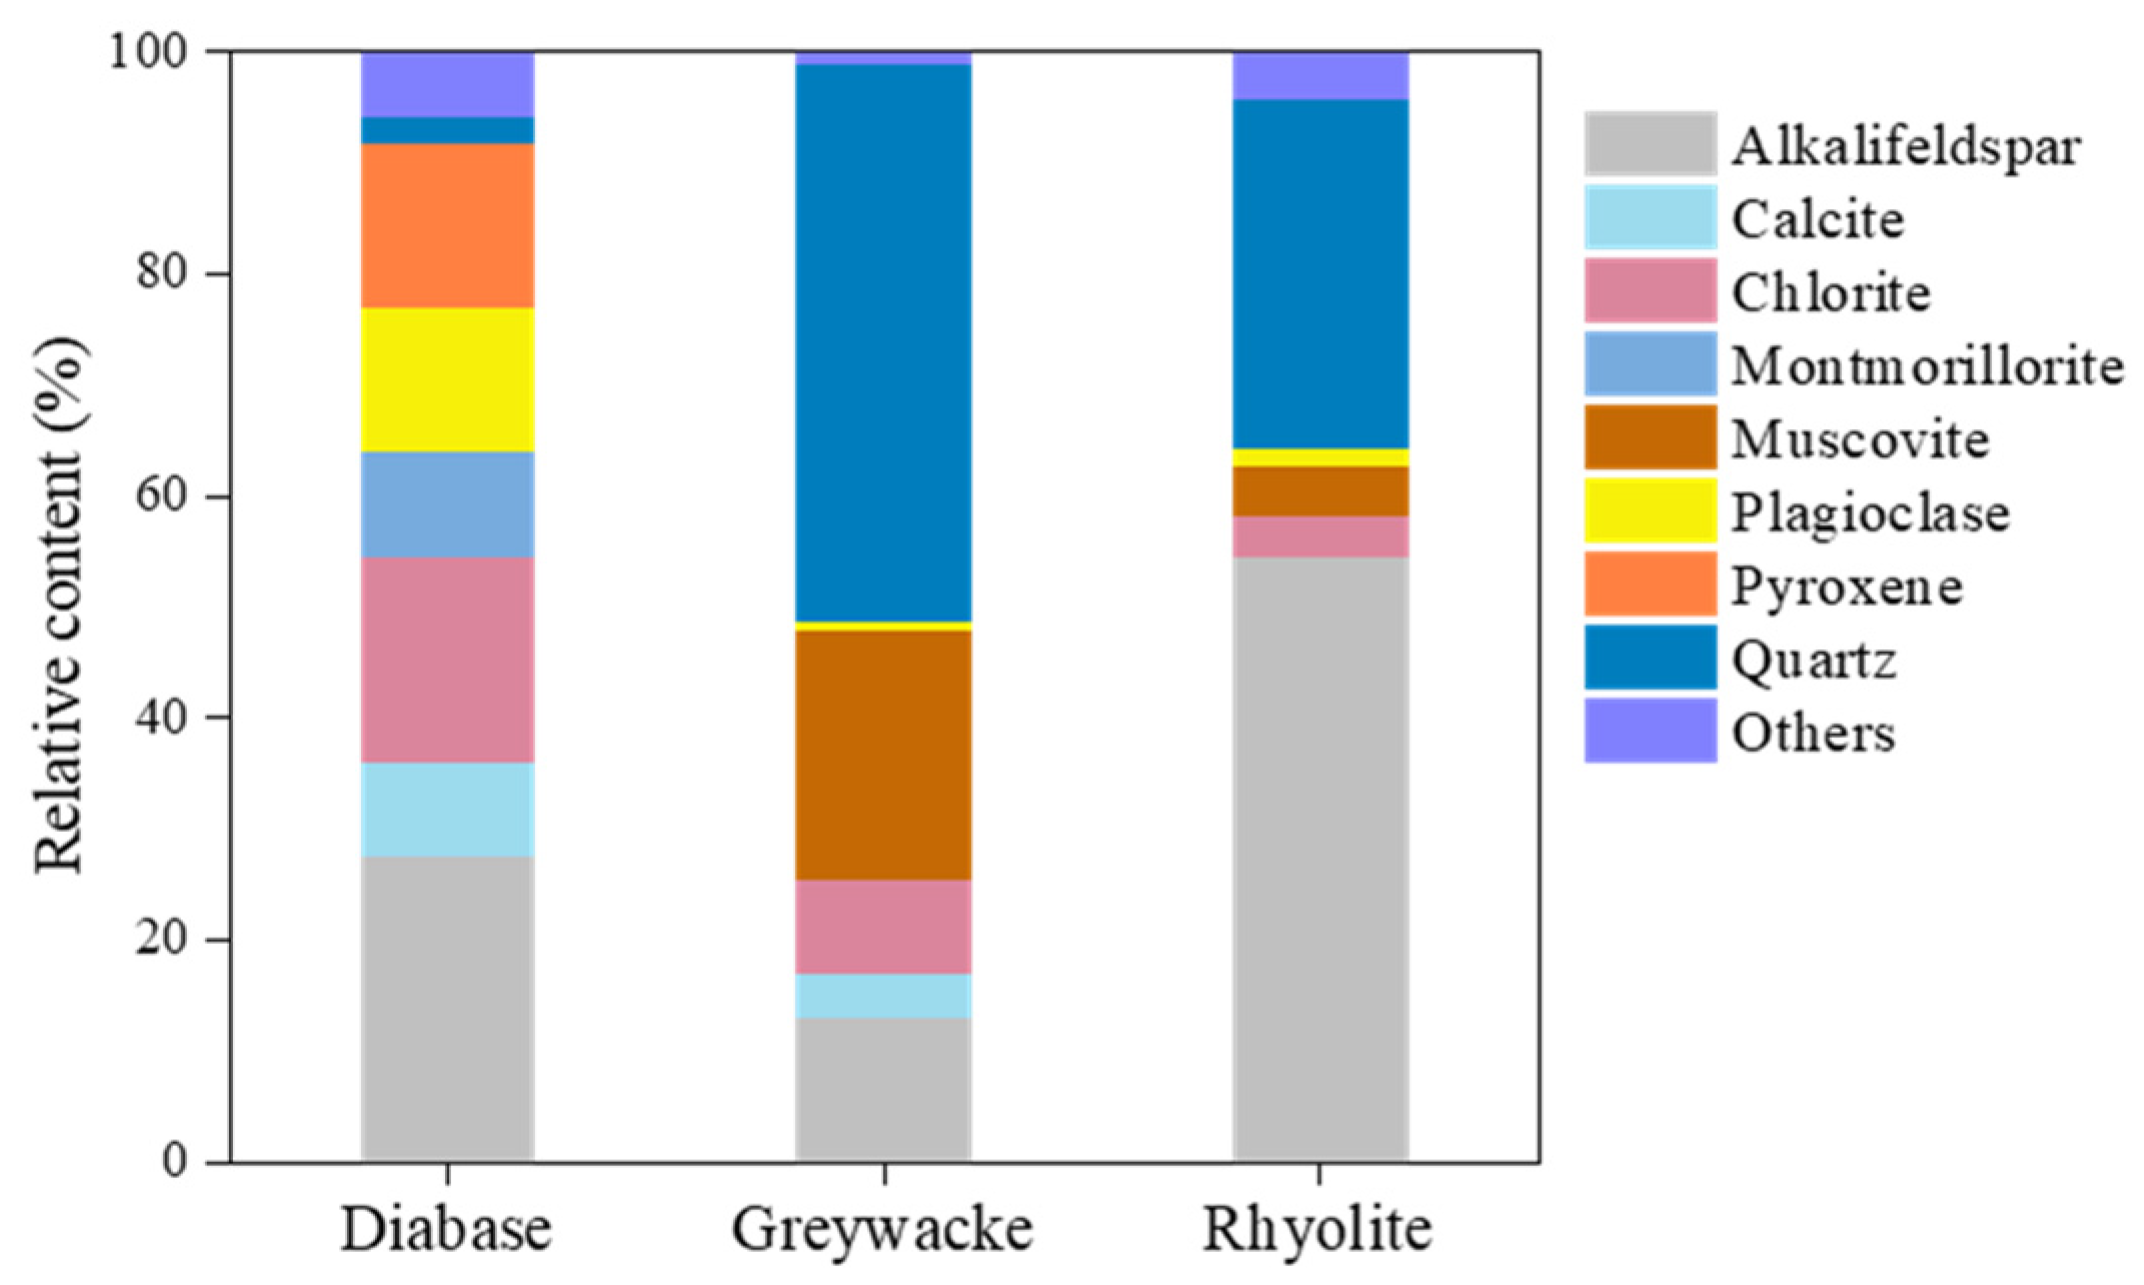
Figure 1.
Mineralogical composition of the three aggregates [
31,
32].
Figure 1.
Mineralogical composition of the three aggregates [
31,
32].
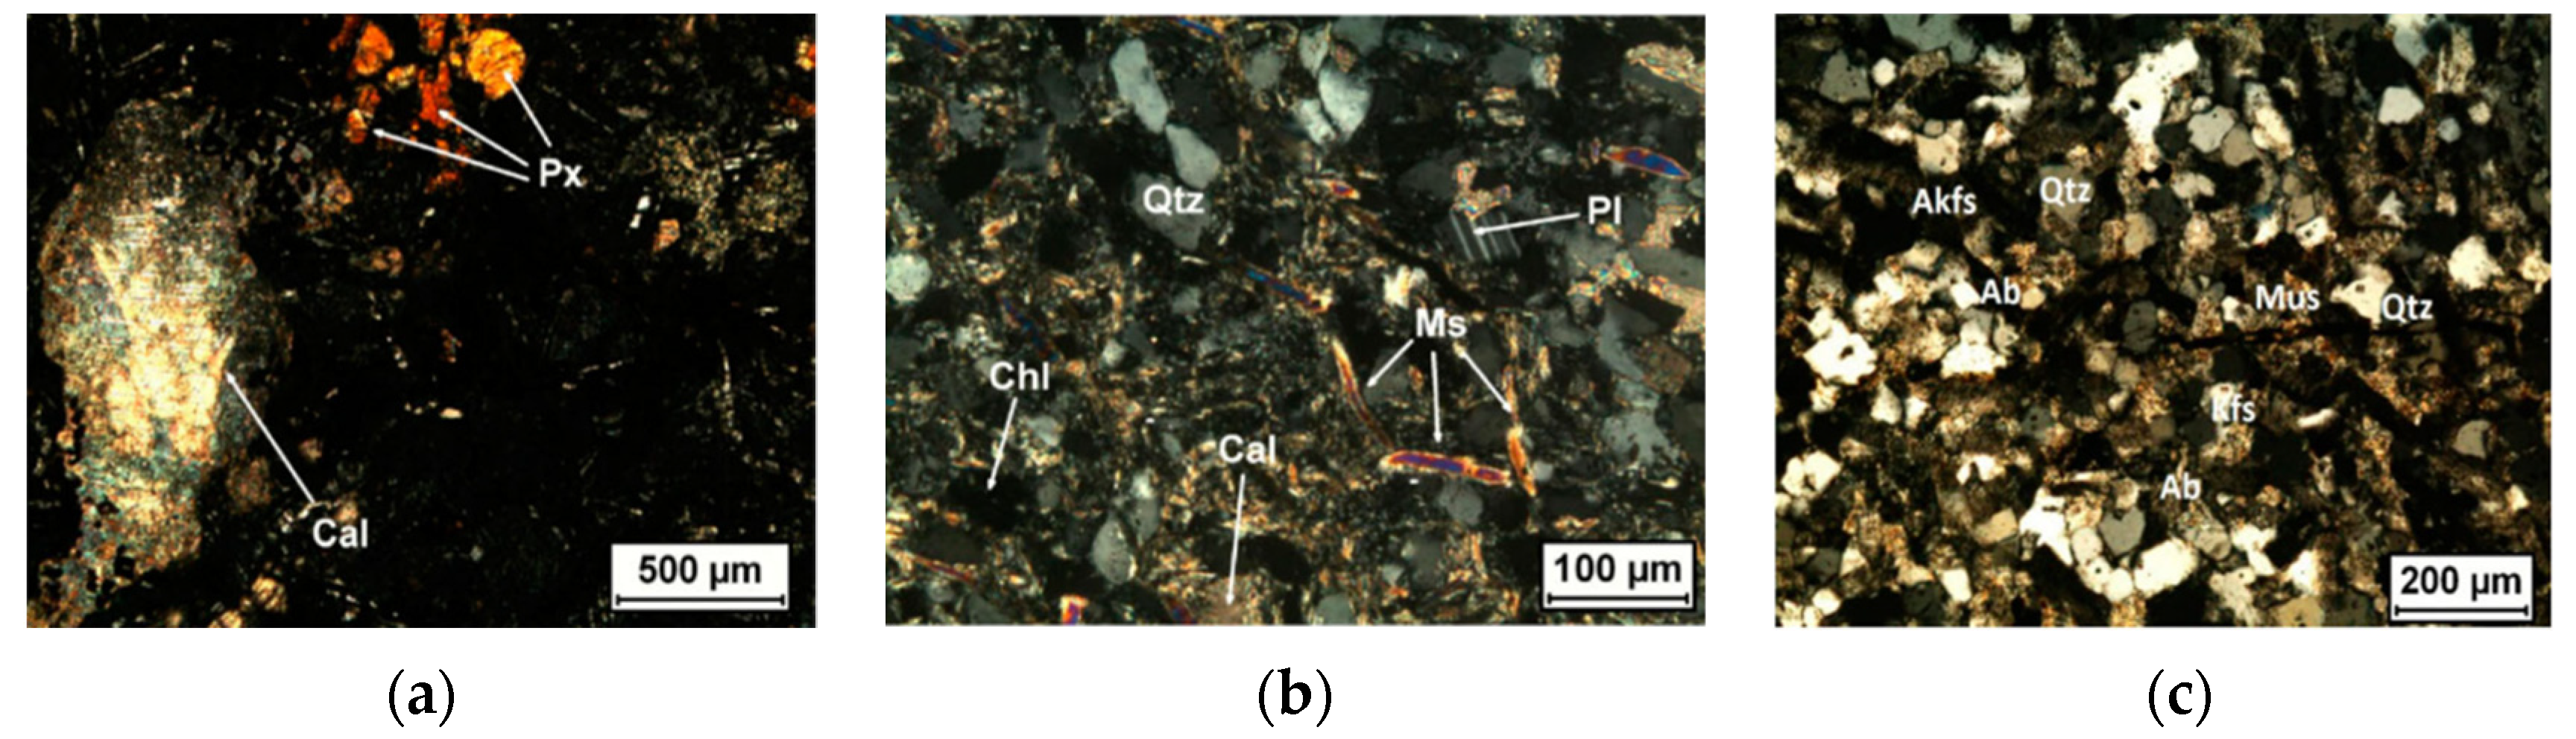
Figure 2.
Microstructure of three aggregates using a thin cross section [
31,
32]. (
a) Diabase (Crystal size: 165 µm); (
b) Greywacke (Crystal size: 45 µm); (
c) Rhyolite (Crystal size: 234 µm).
Figure 2.
Microstructure of three aggregates using a thin cross section [
31,
32]. (
a) Diabase (Crystal size: 165 µm); (
b) Greywacke (Crystal size: 45 µm); (
c) Rhyolite (Crystal size: 234 µm).
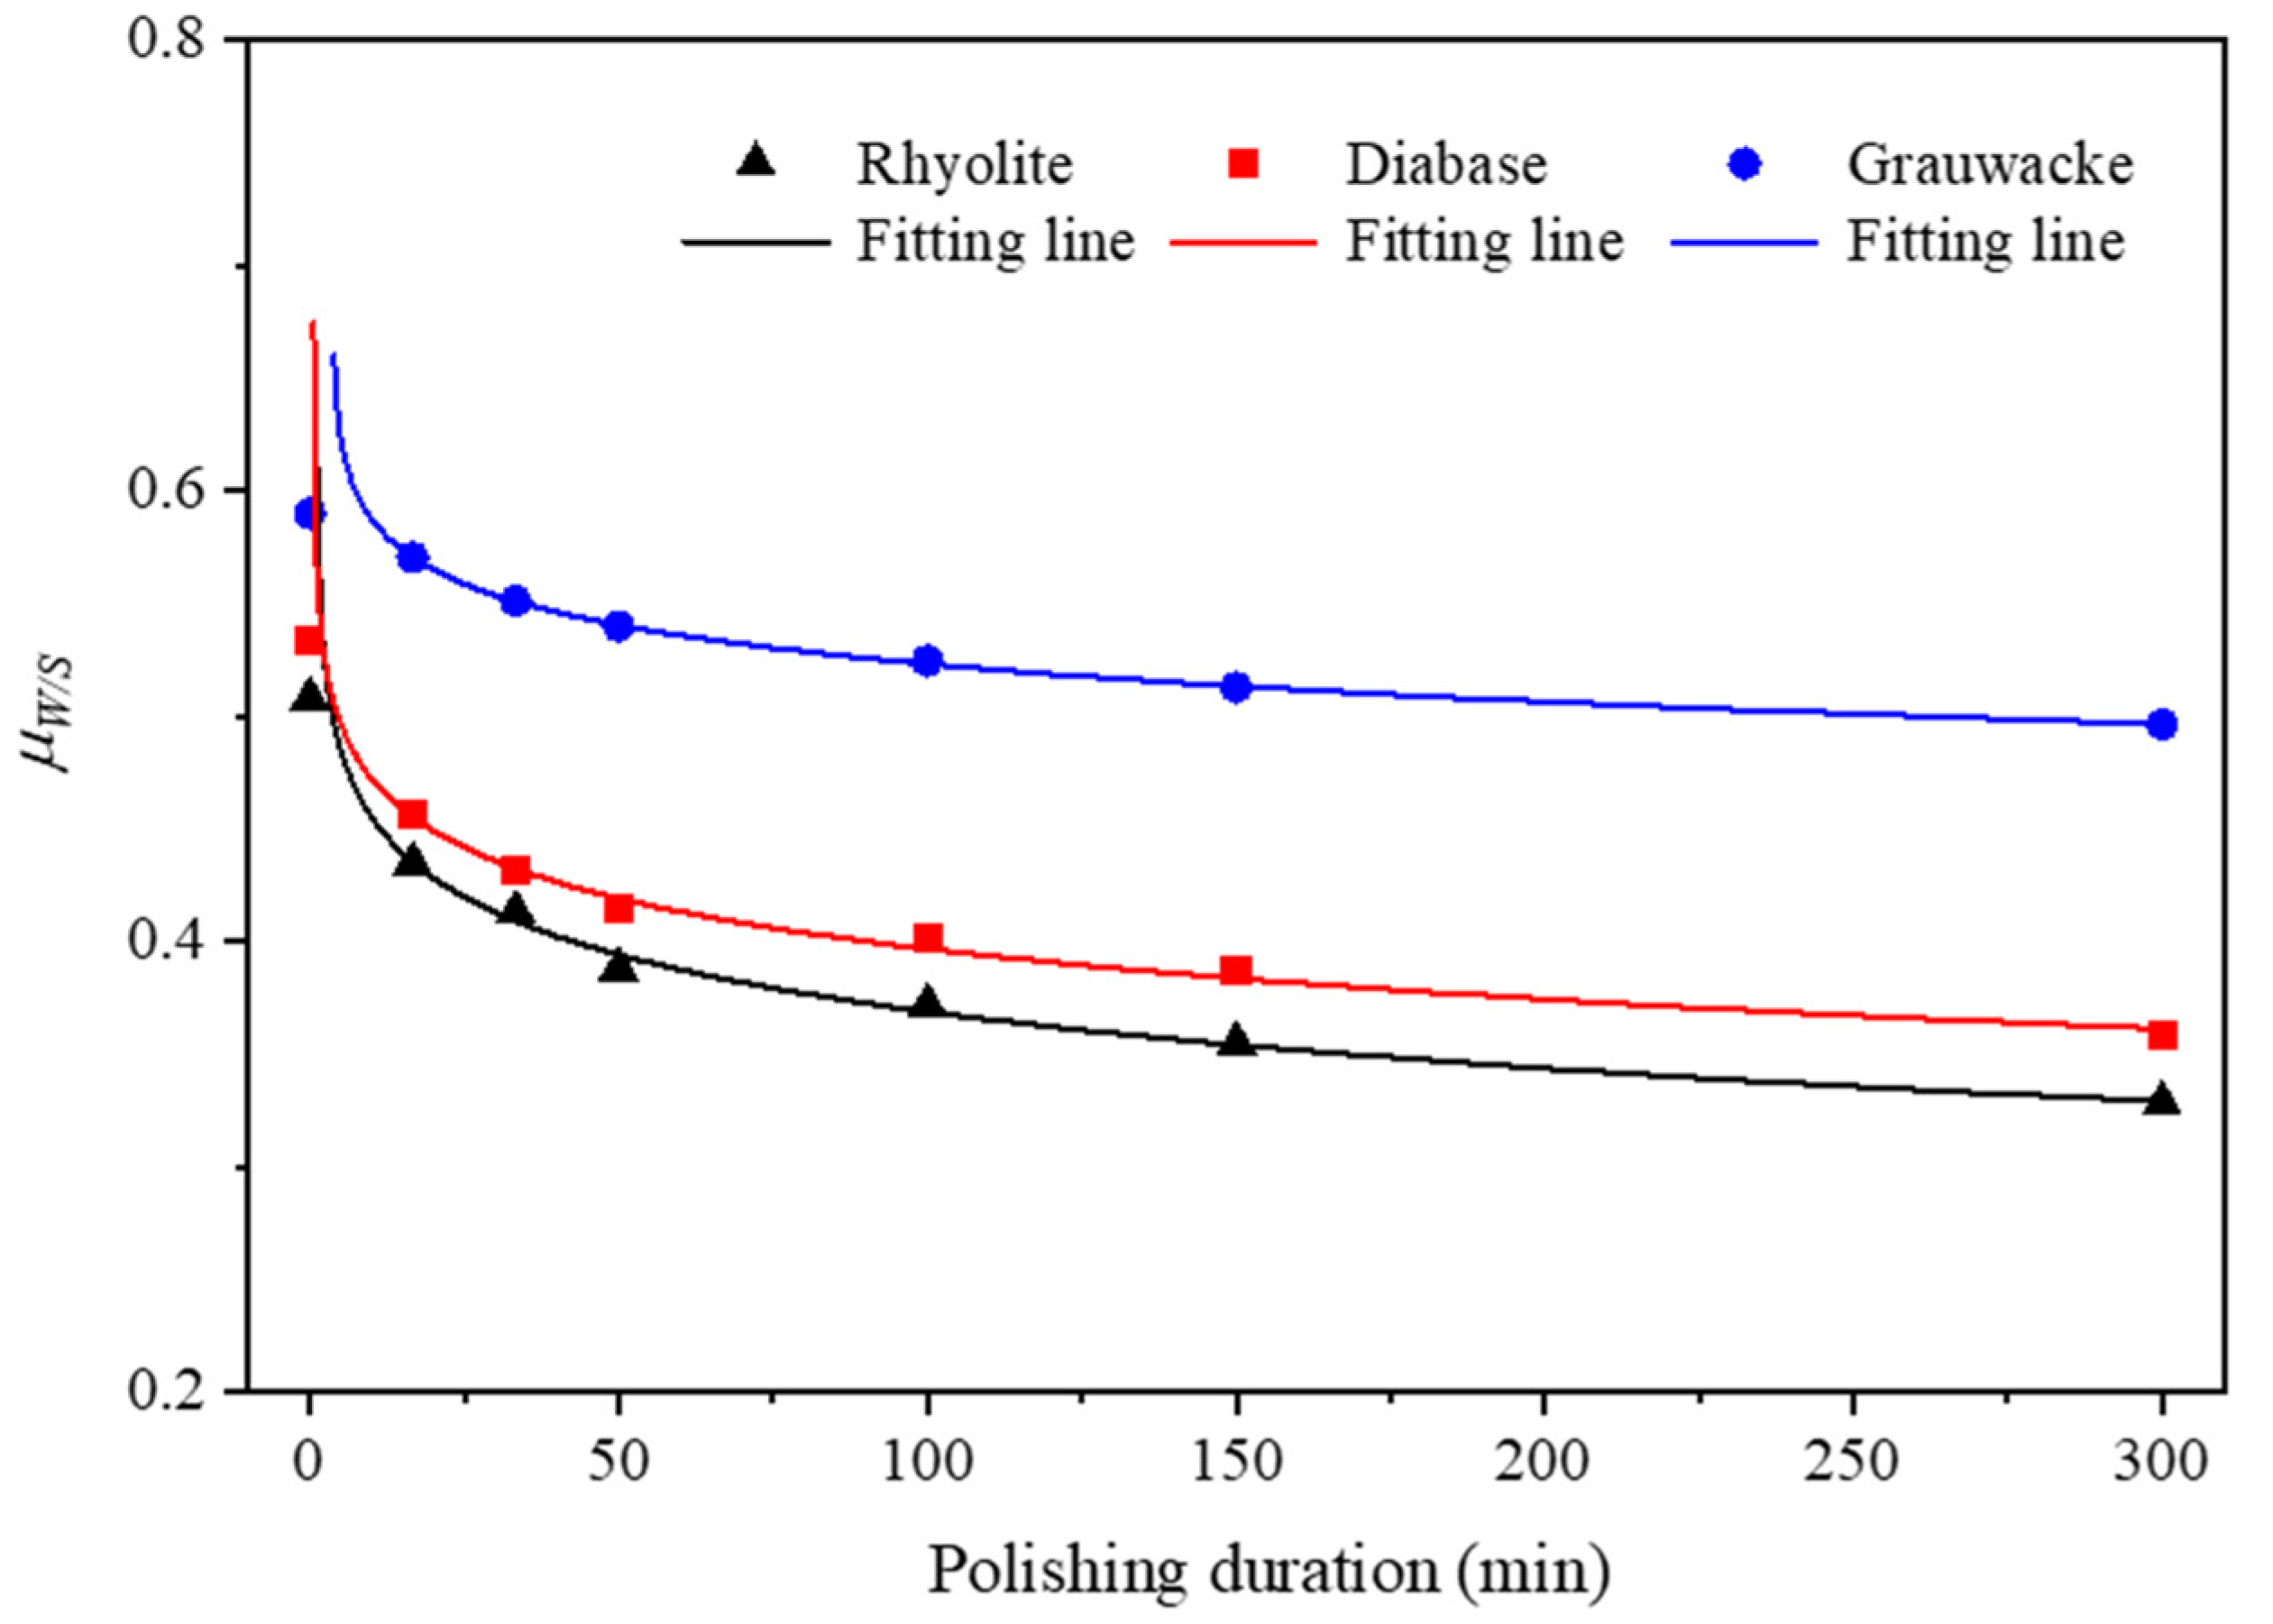
Figure 3.
Evolution of the dynamic friction coefficient μW/S of aggregate.
Figure 3.
Evolution of the dynamic friction coefficient μW/S of aggregate.
Figure 4.
The gradation of SMA-11S asphalt mixture.
Figure 4.
The gradation of SMA-11S asphalt mixture.
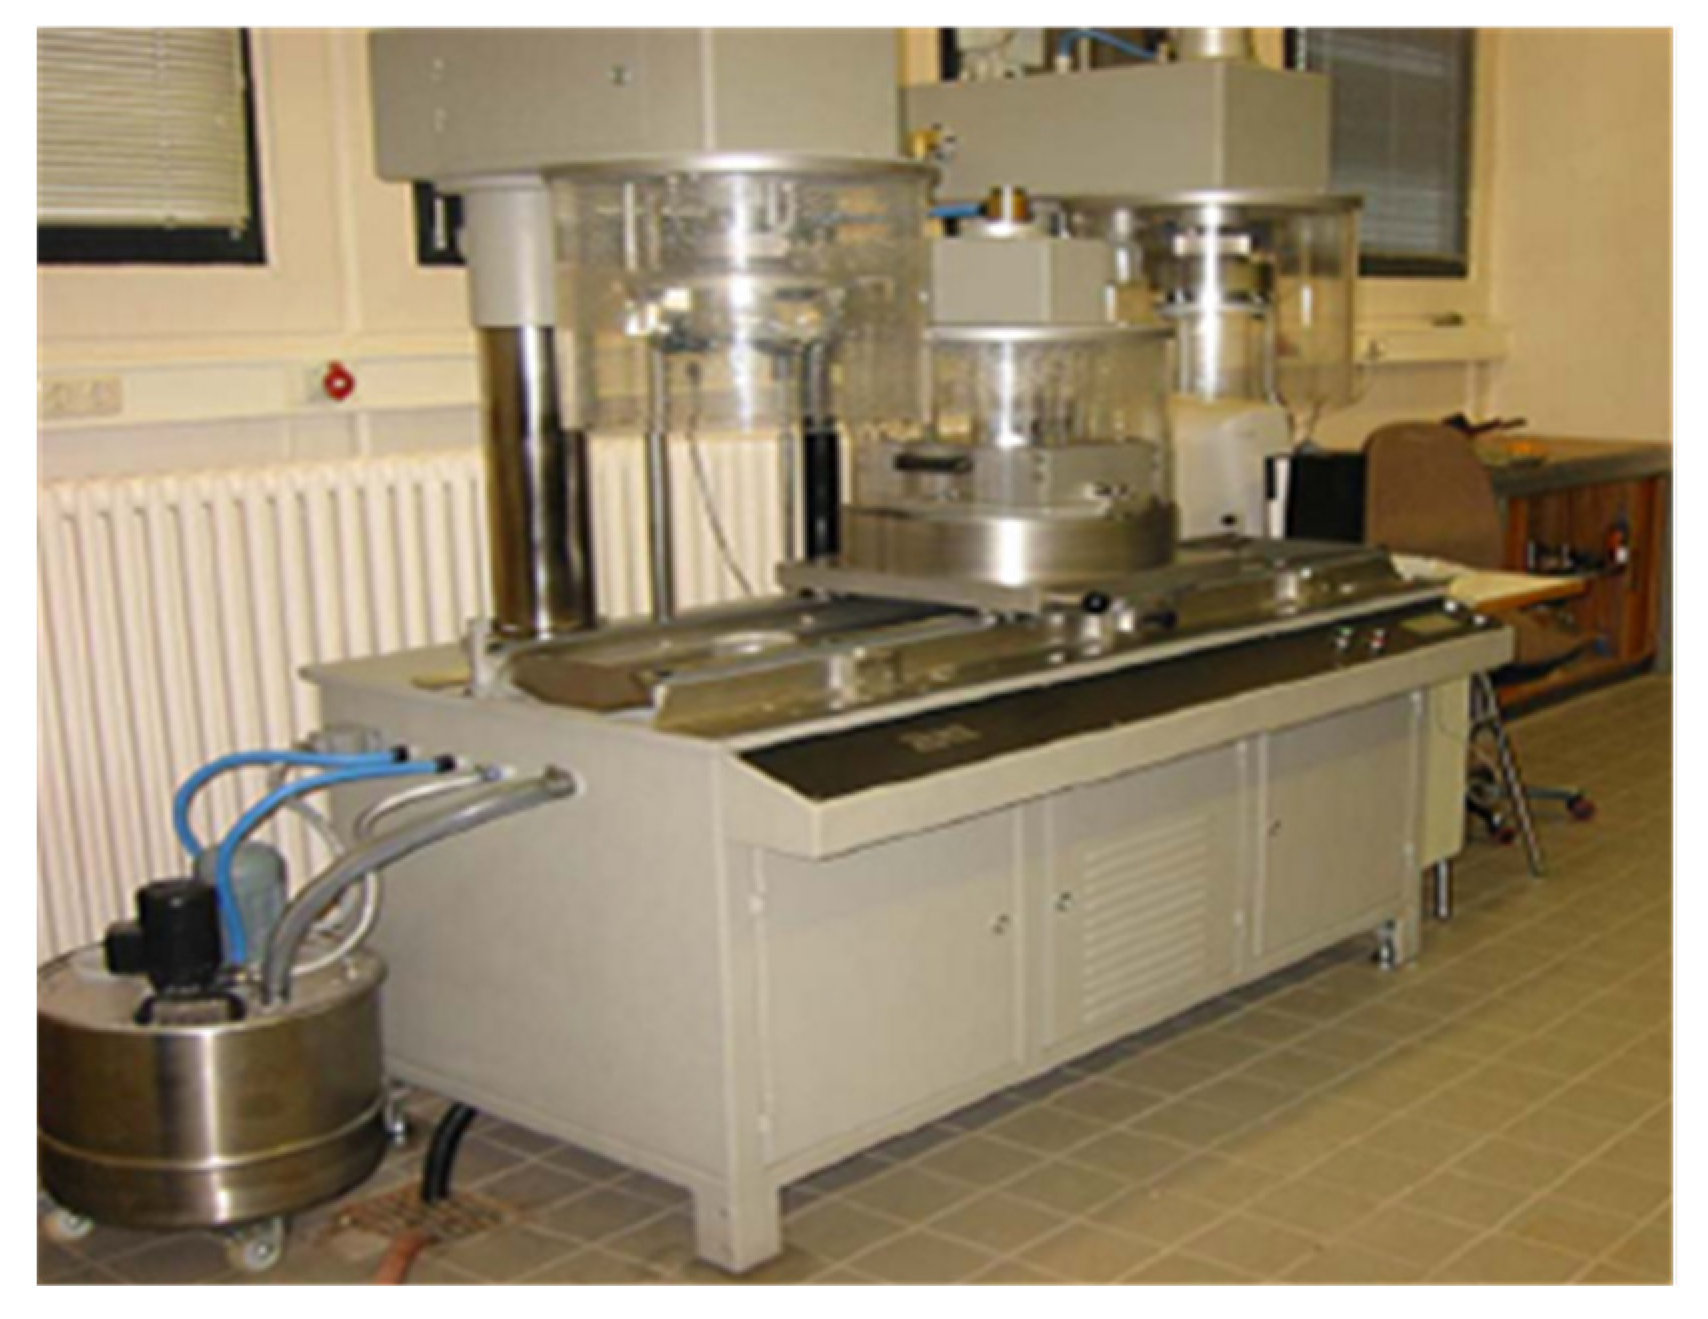
Figure 5.
The Wehner/Schulze machine [
14,
23].
Figure 5.
The Wehner/Schulze machine [
14,
23].
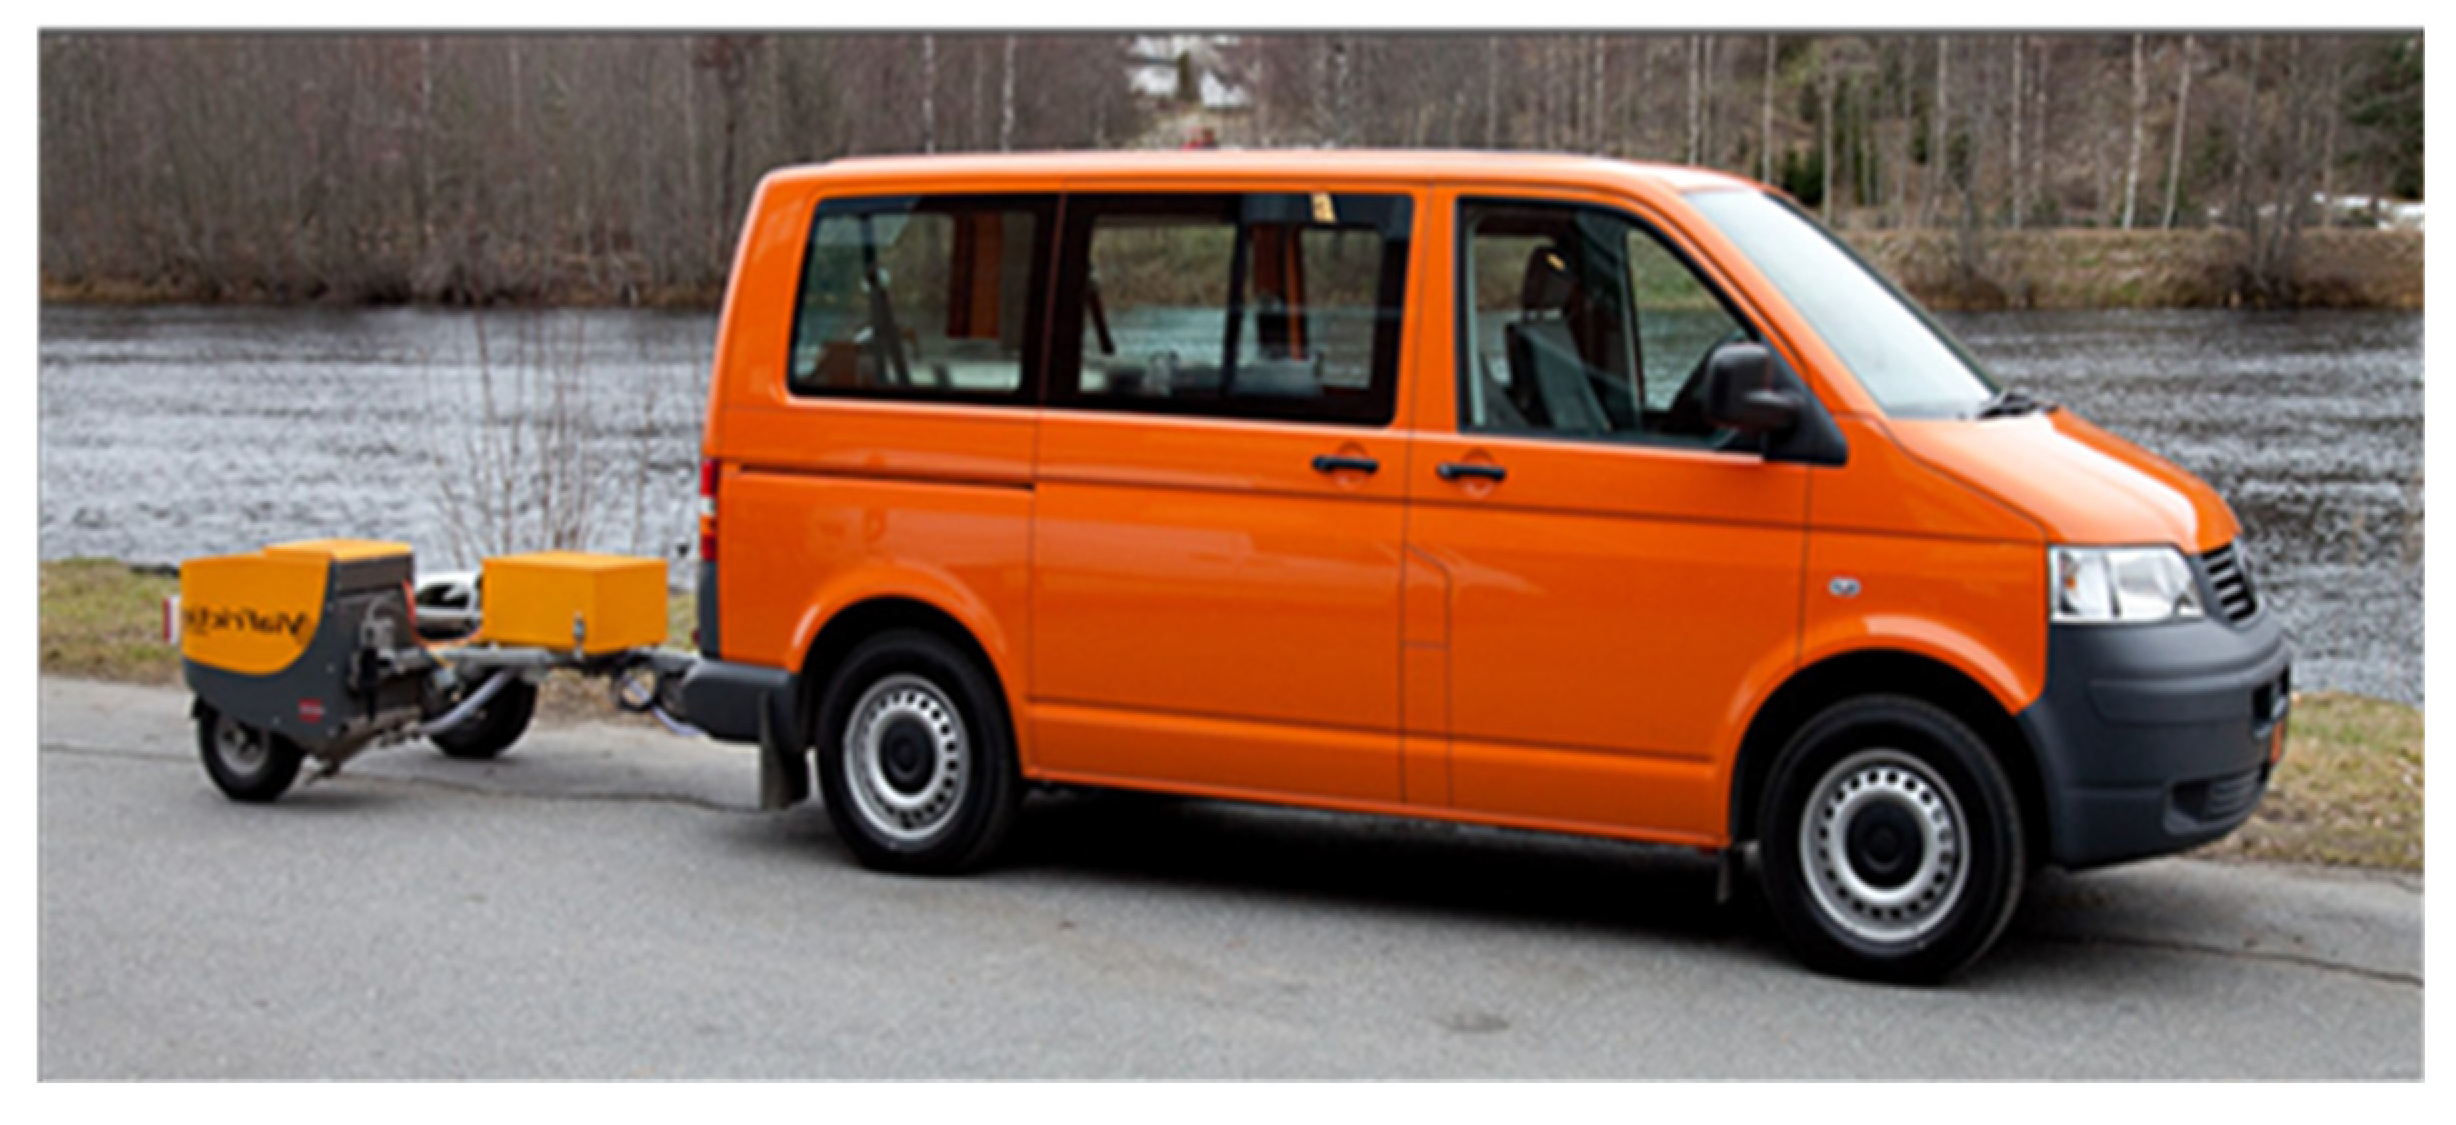
Figure 6.
The ViaFriction test system [
24,
25].
Figure 6.
The ViaFriction test system [
24,
25].
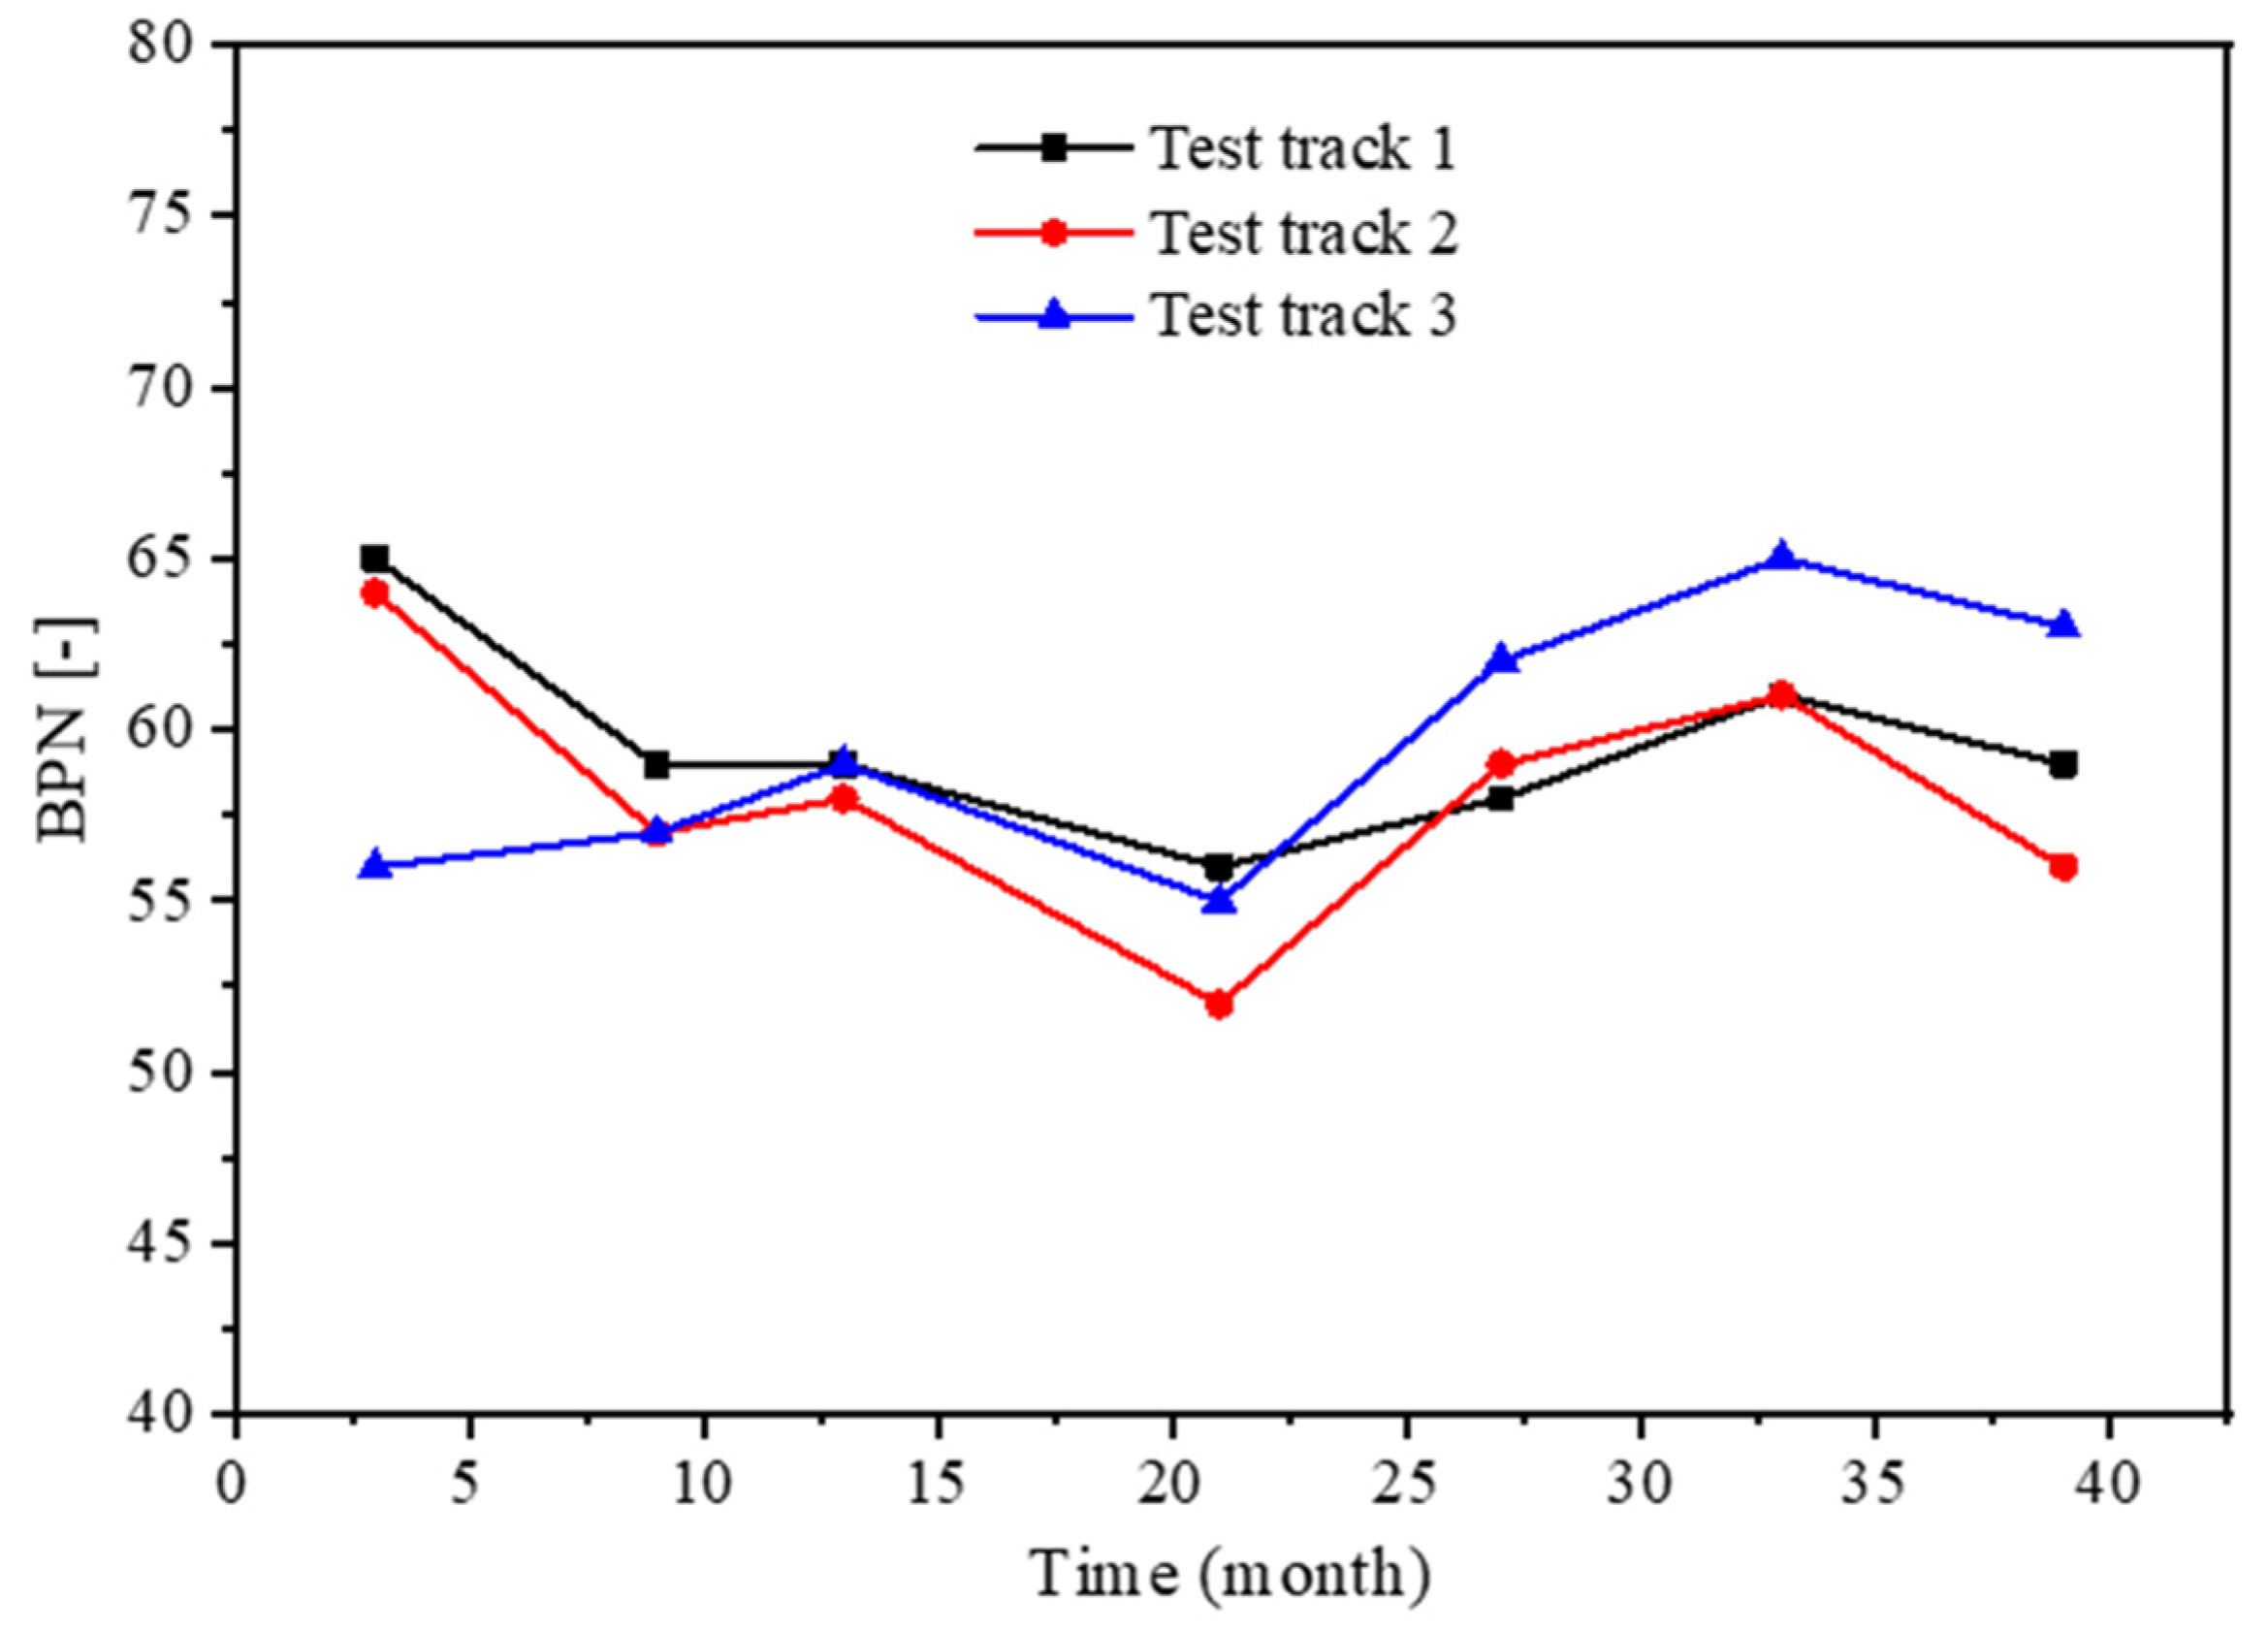
Figure 7.
The BPT test results of different tracks.
Figure 7.
The BPT test results of different tracks.
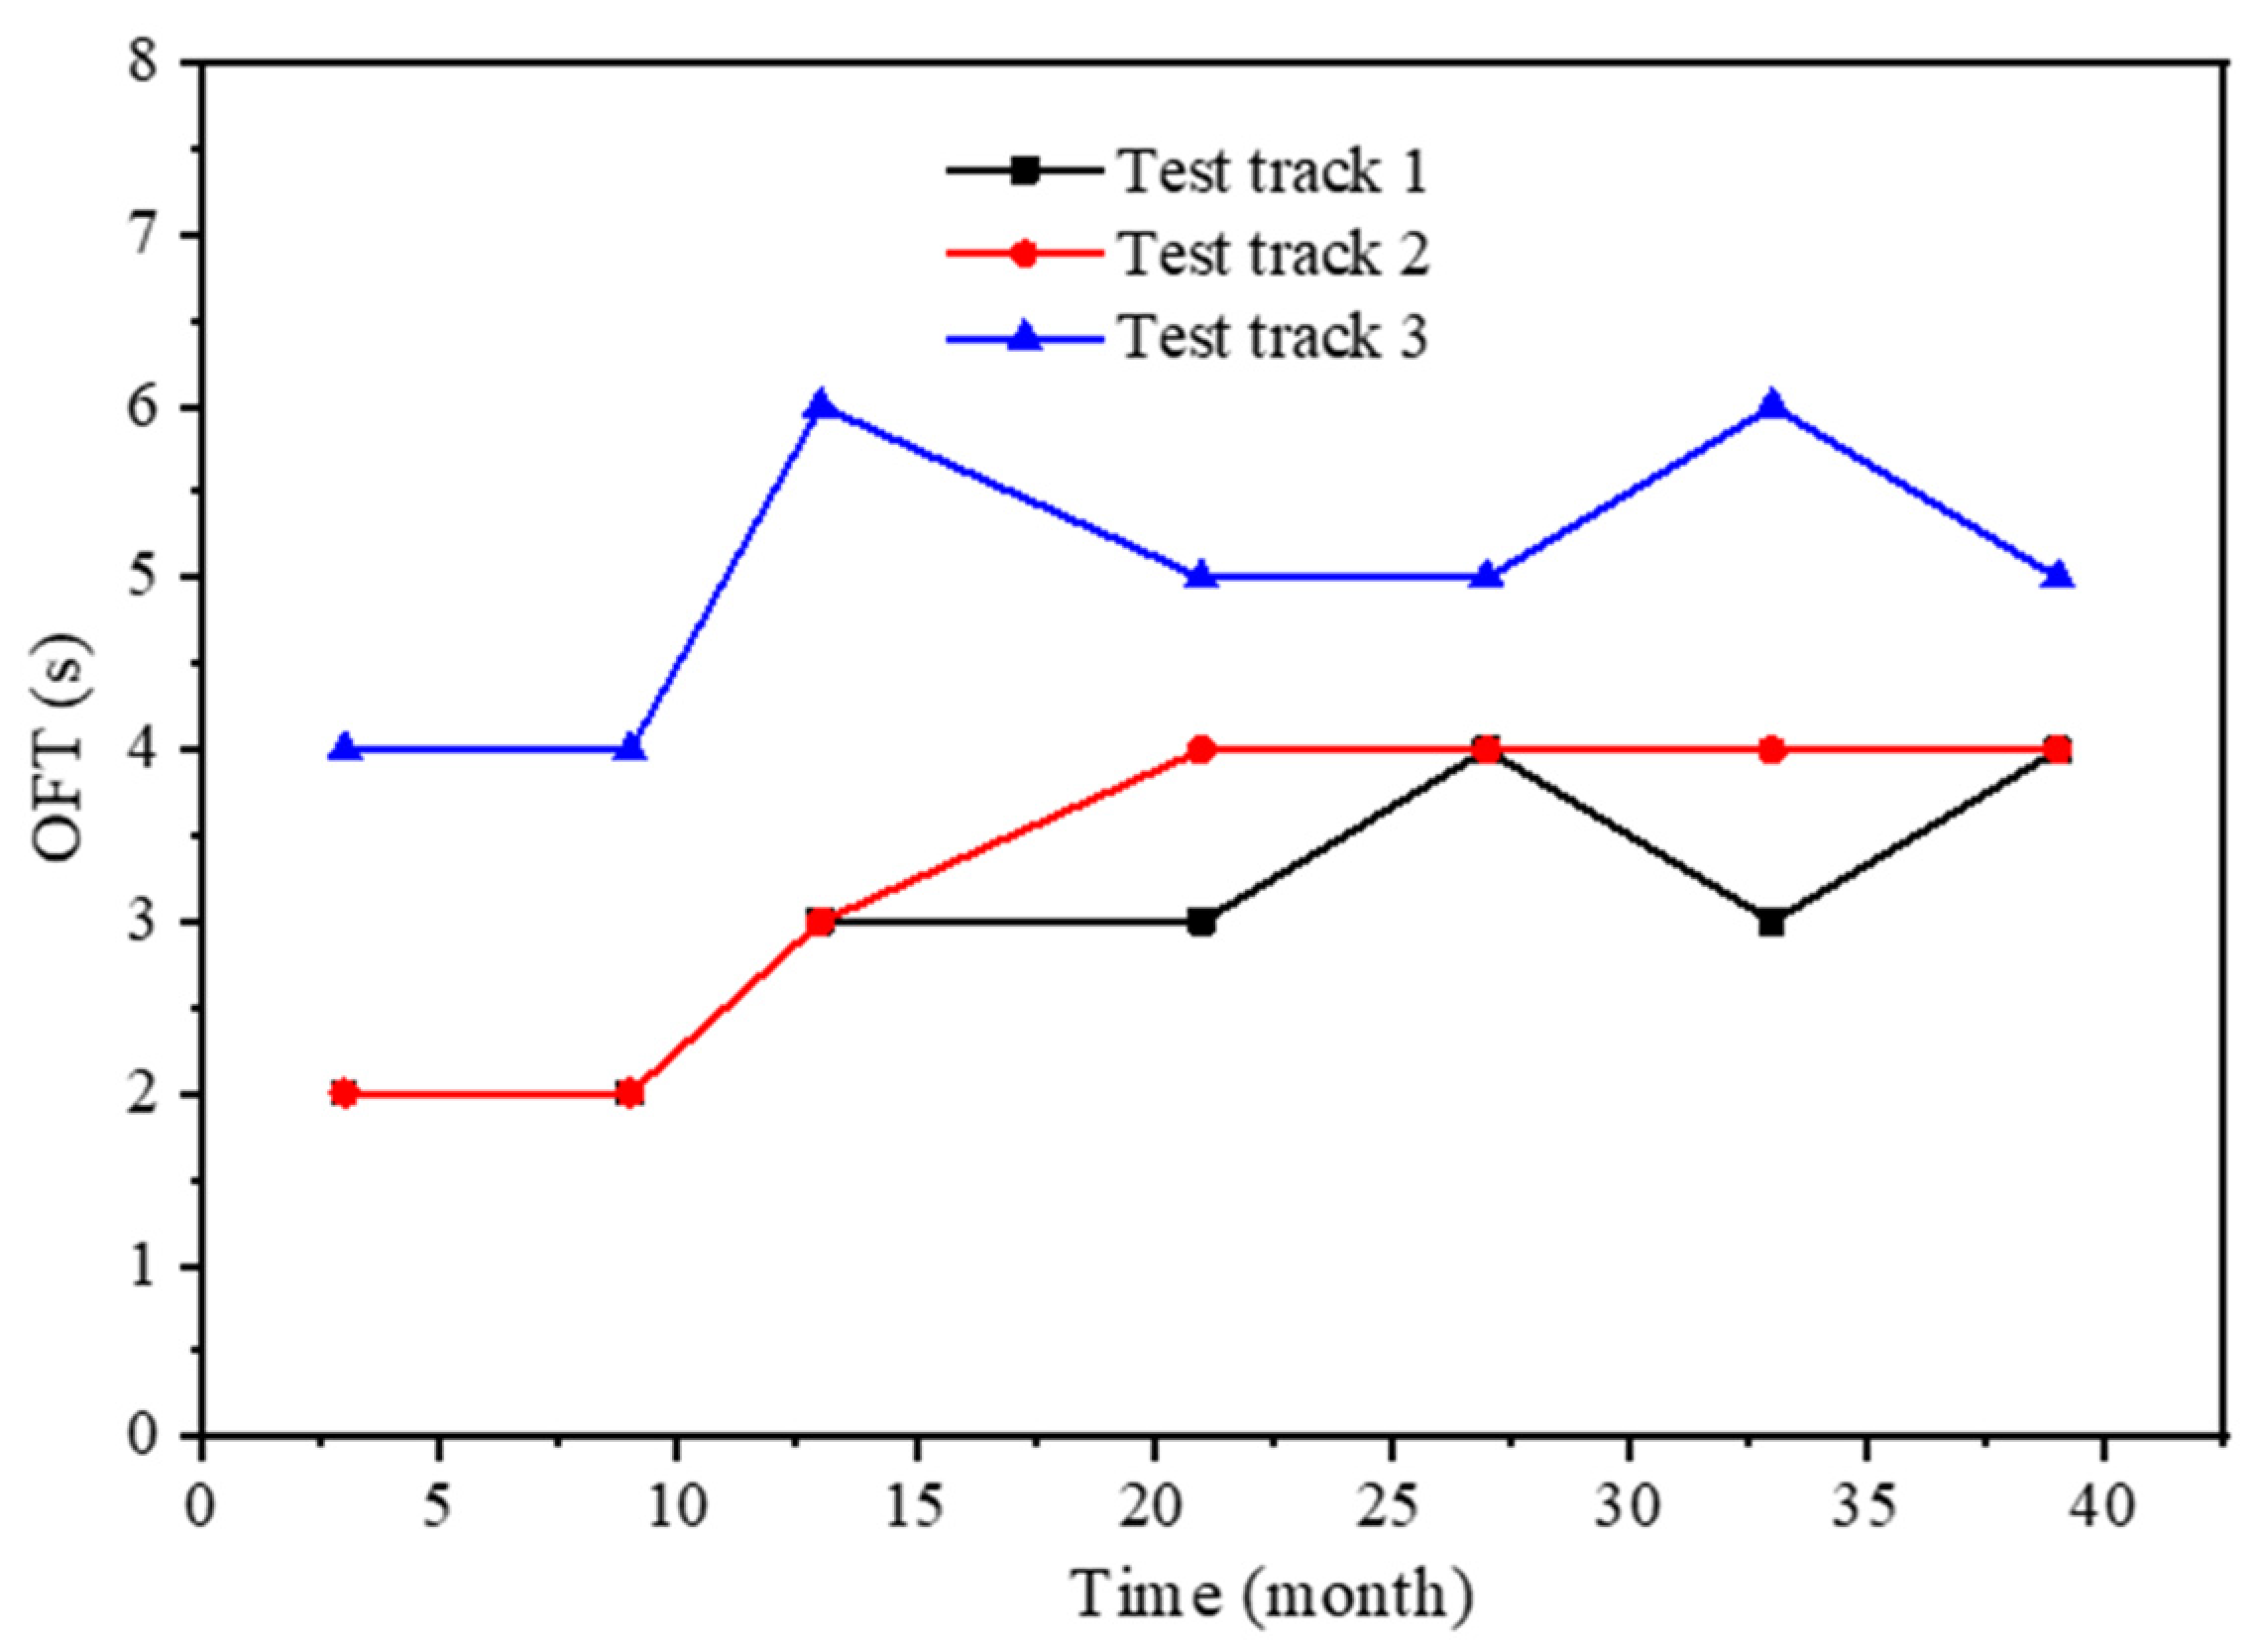
Figure 8.
The OFM test results of different tracks.
Figure 8.
The OFM test results of different tracks.
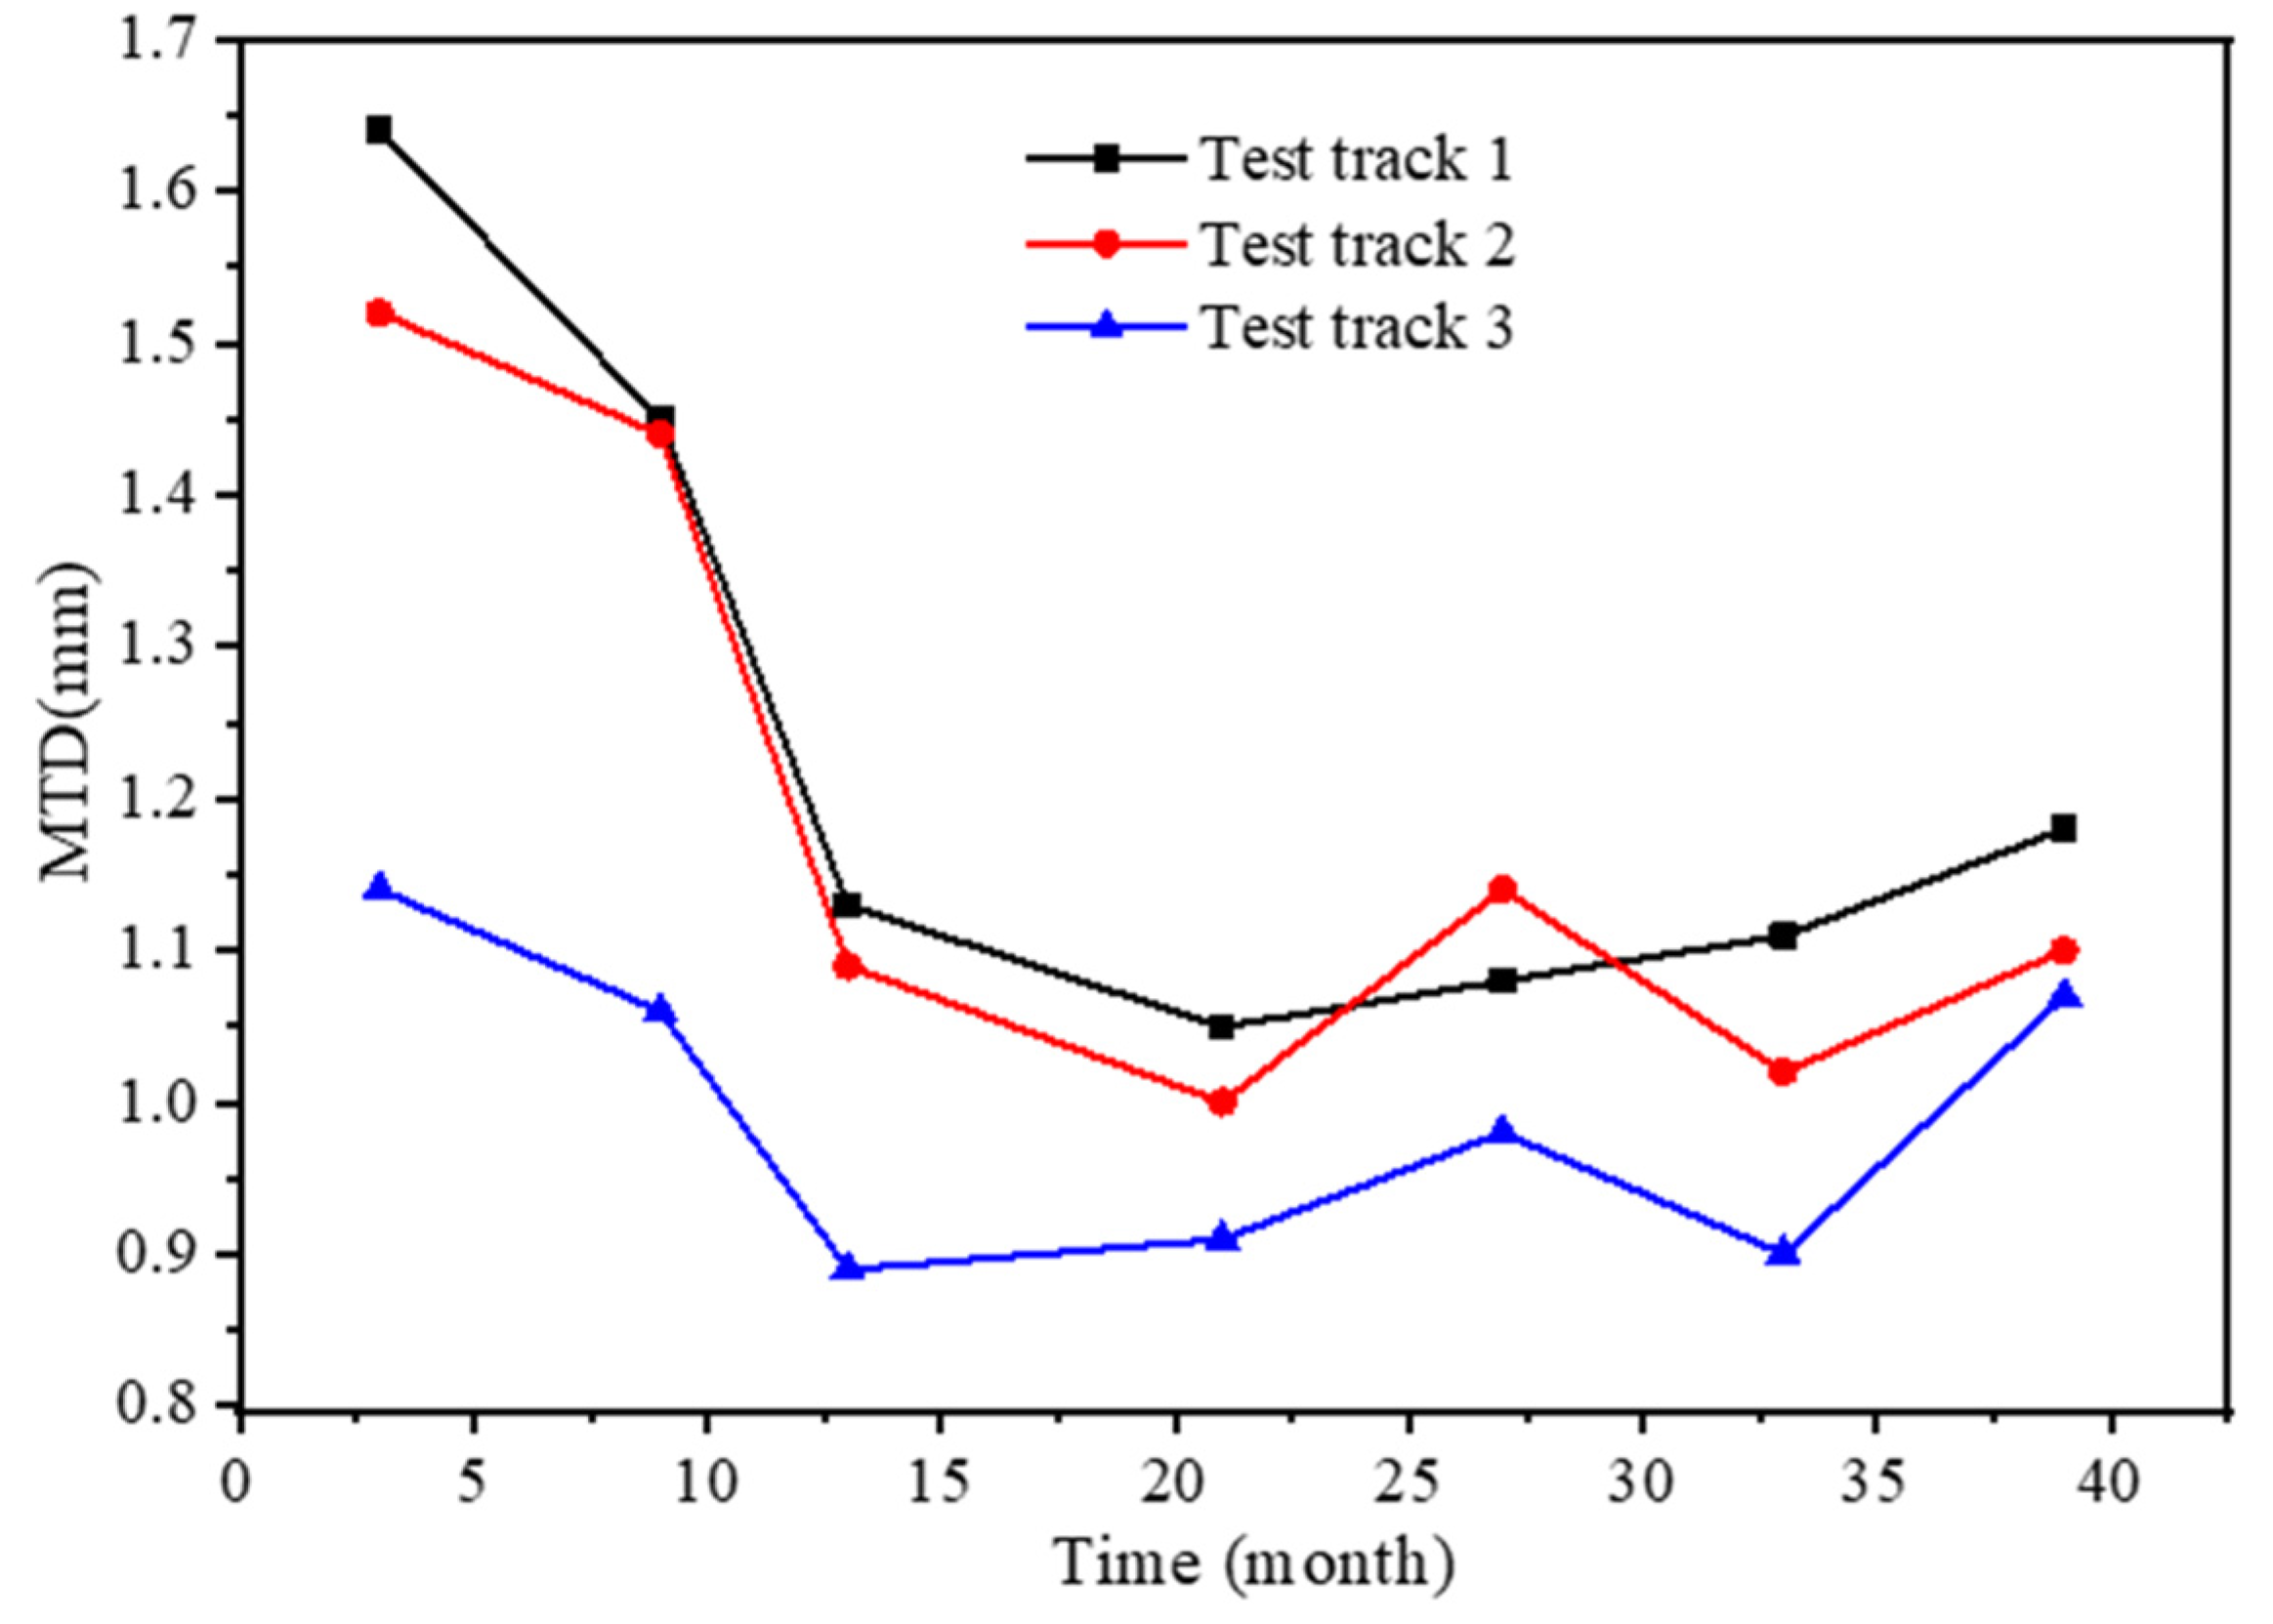
Figure 9.
The MTD test results of different tracks.
Figure 9.
The MTD test results of different tracks.
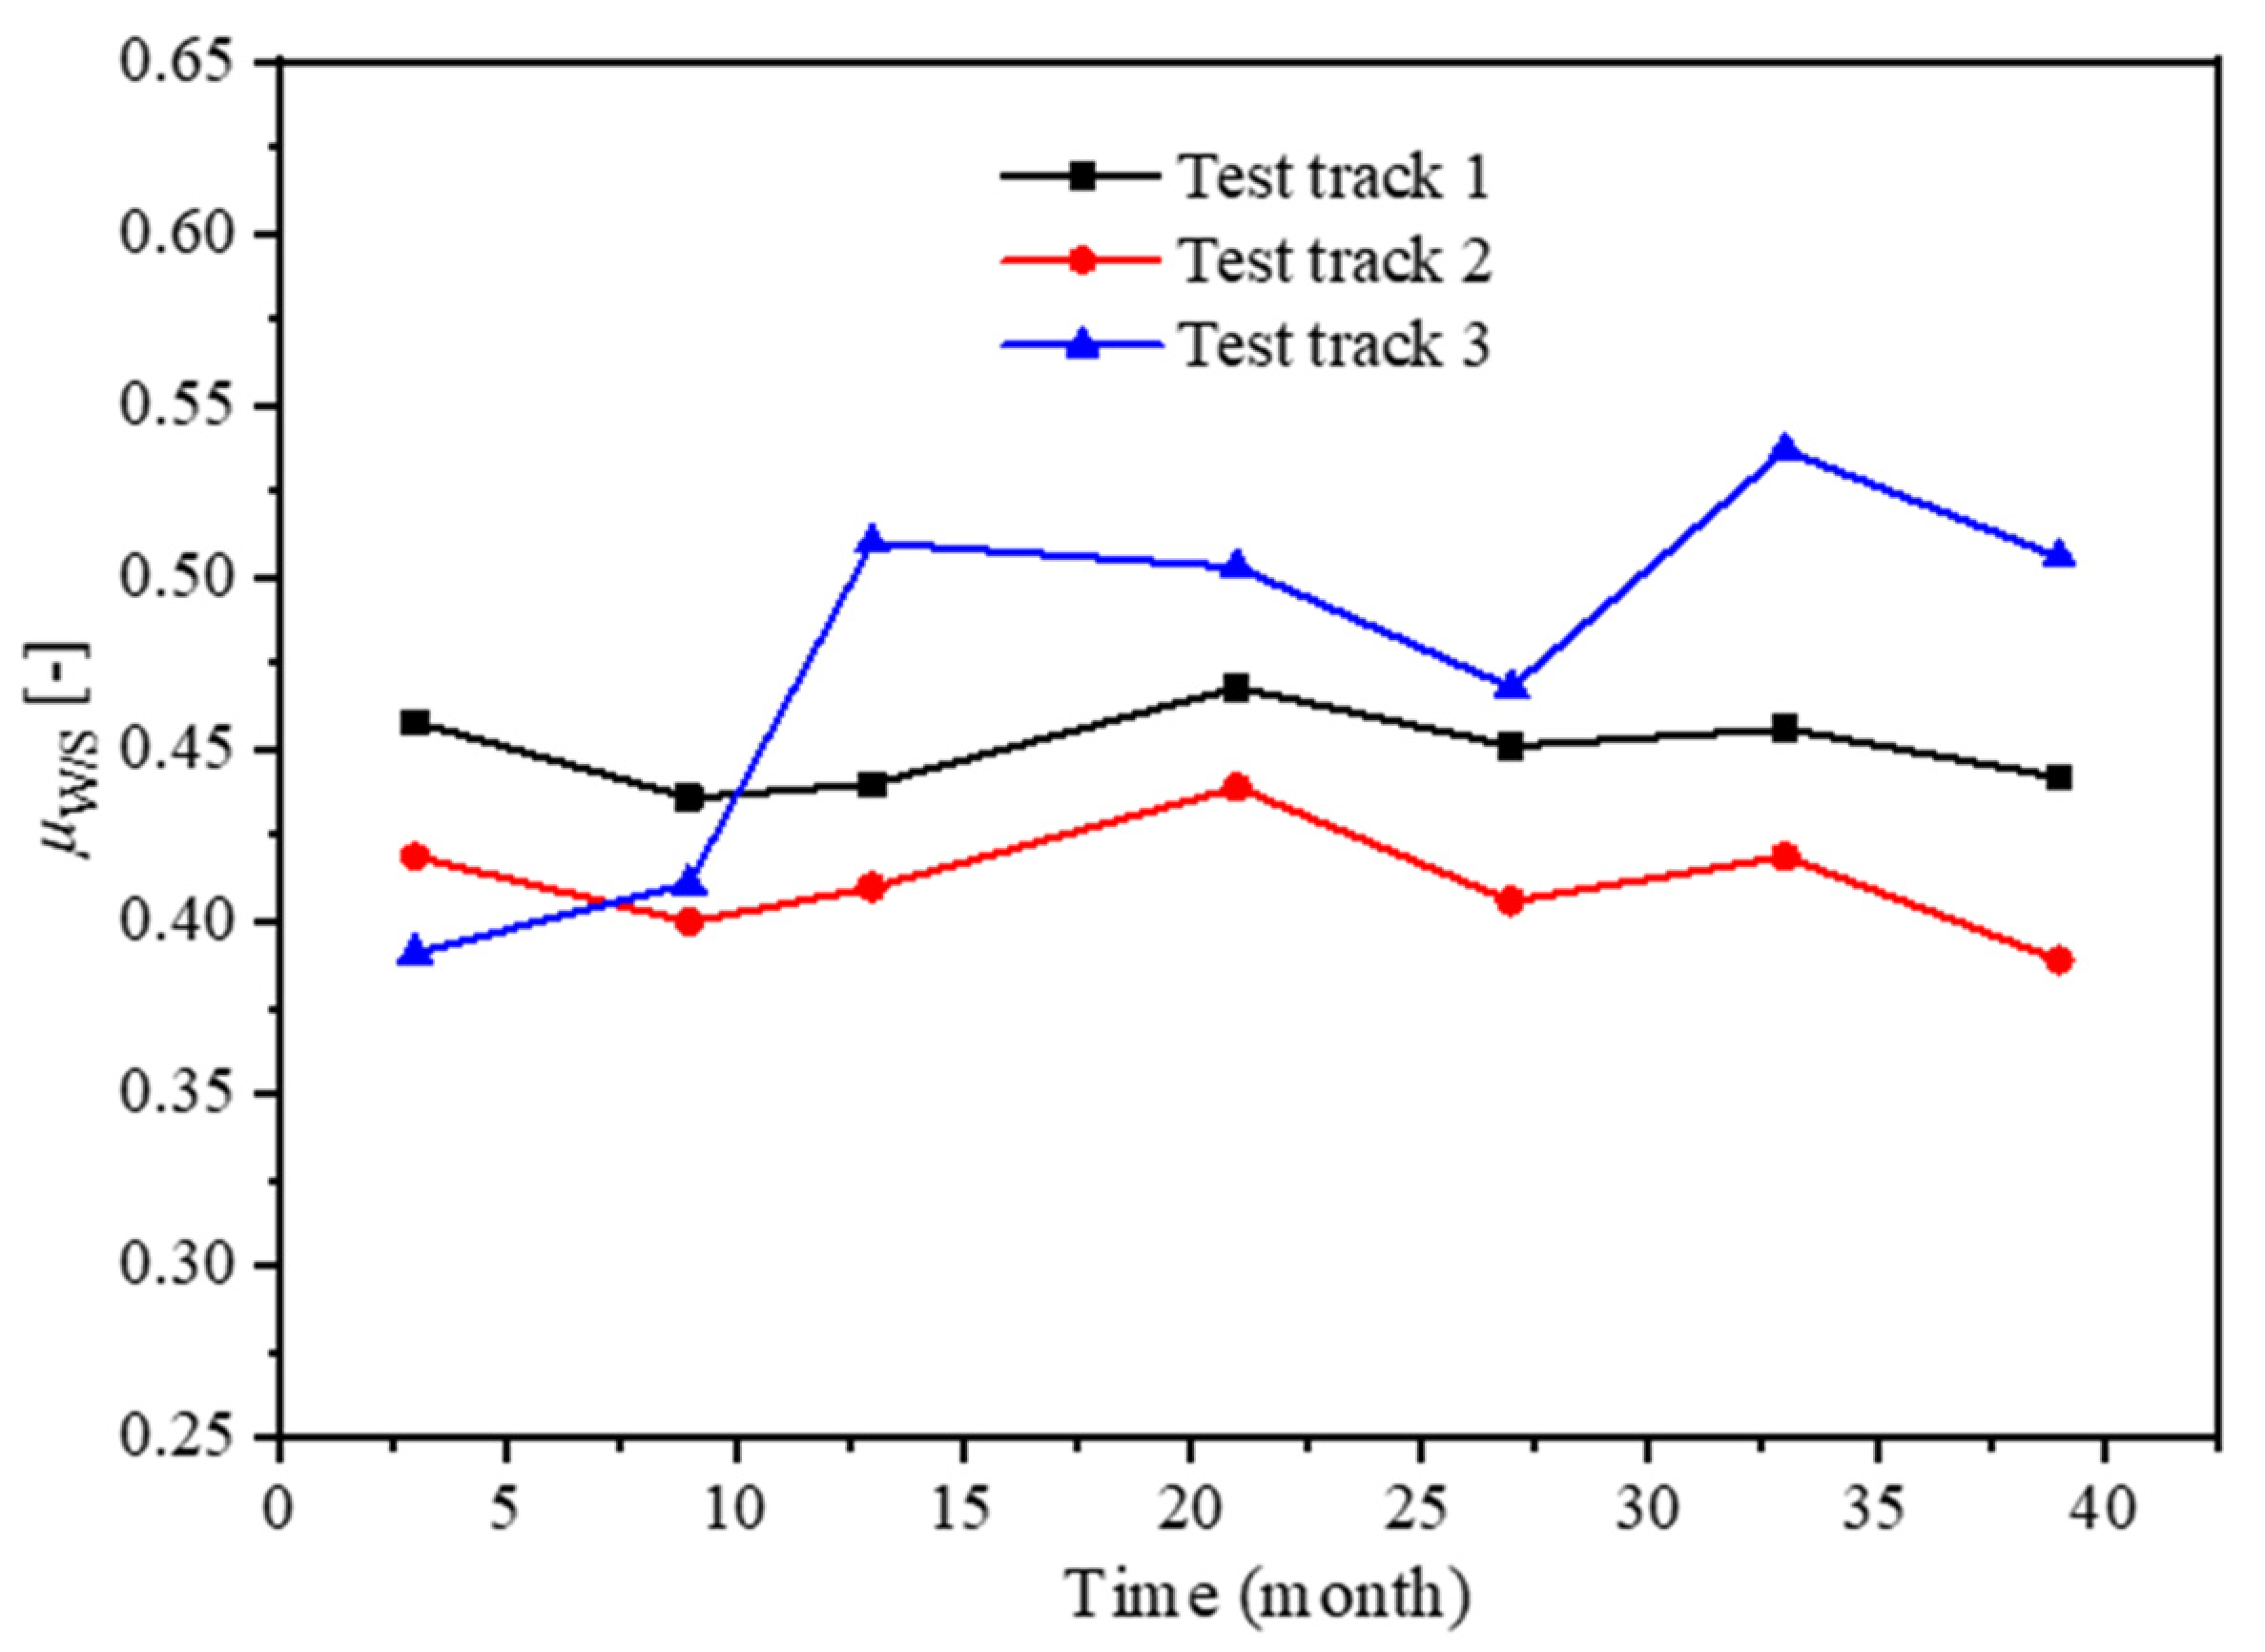
Figure 10.
The W/S test results of different tracks.
Figure 10.
The W/S test results of different tracks.
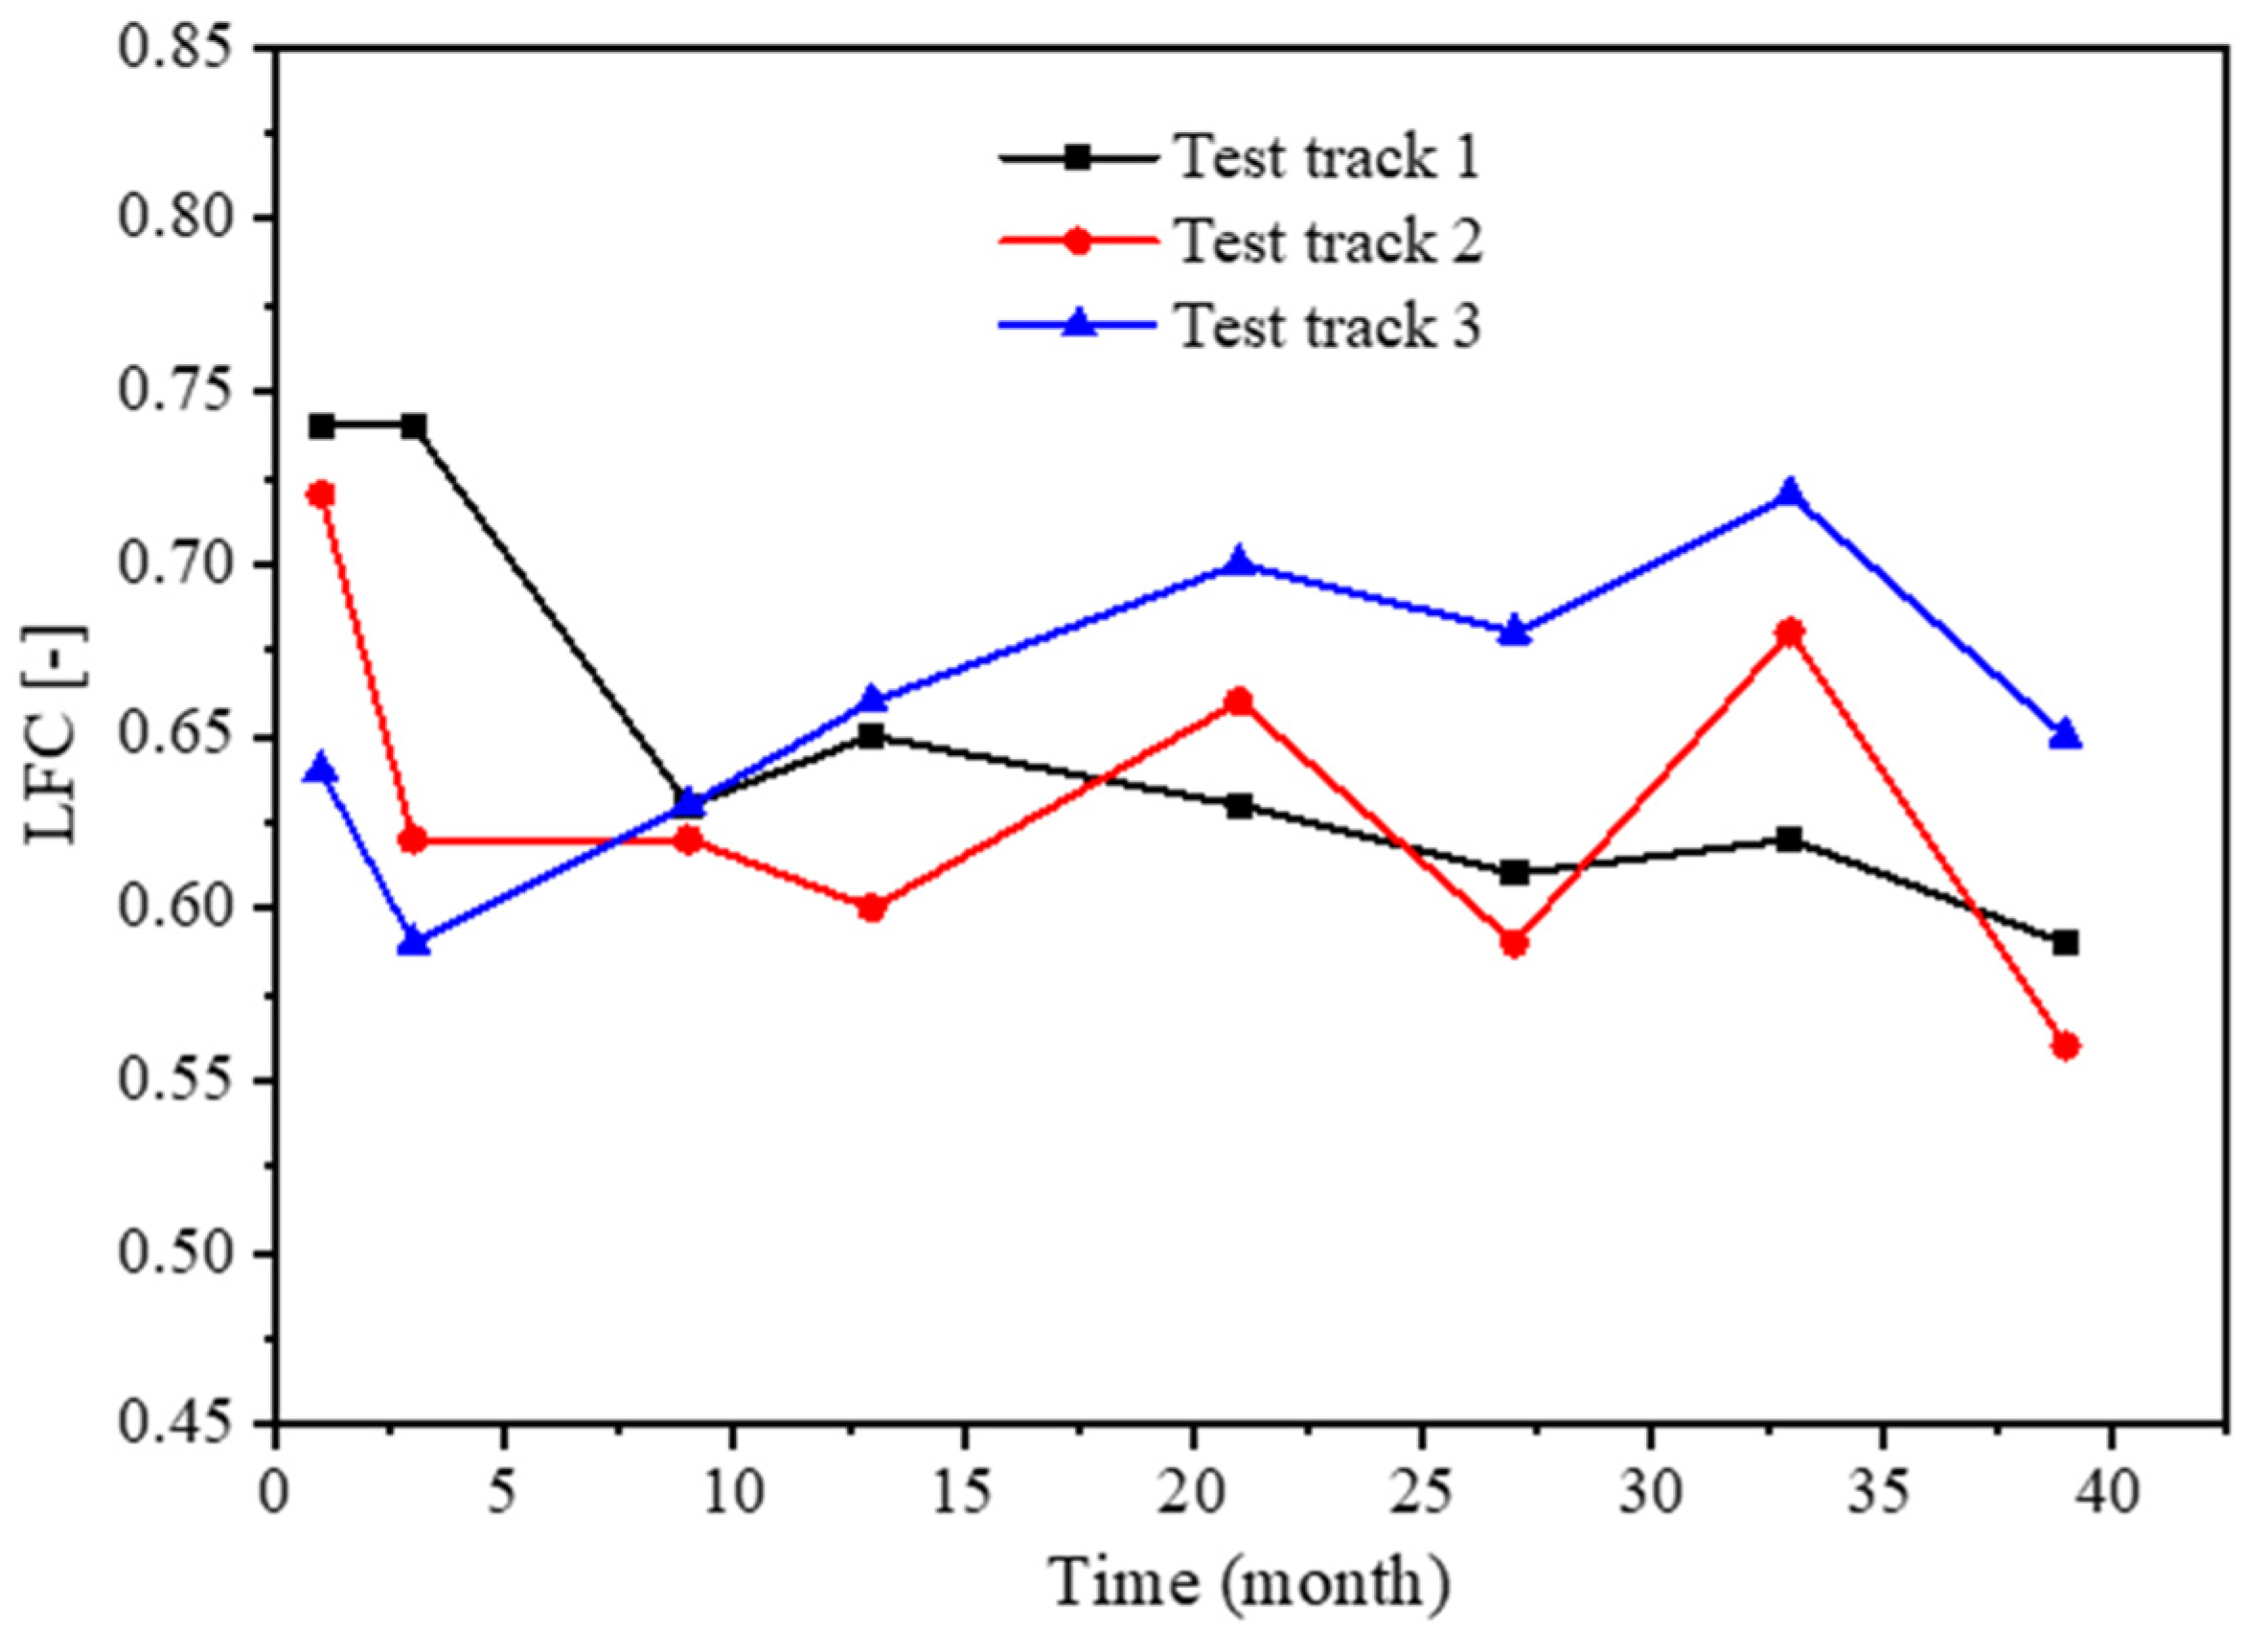
Figure 11.
The LFC test results of different tracks.
Figure 11.
The LFC test results of different tracks.
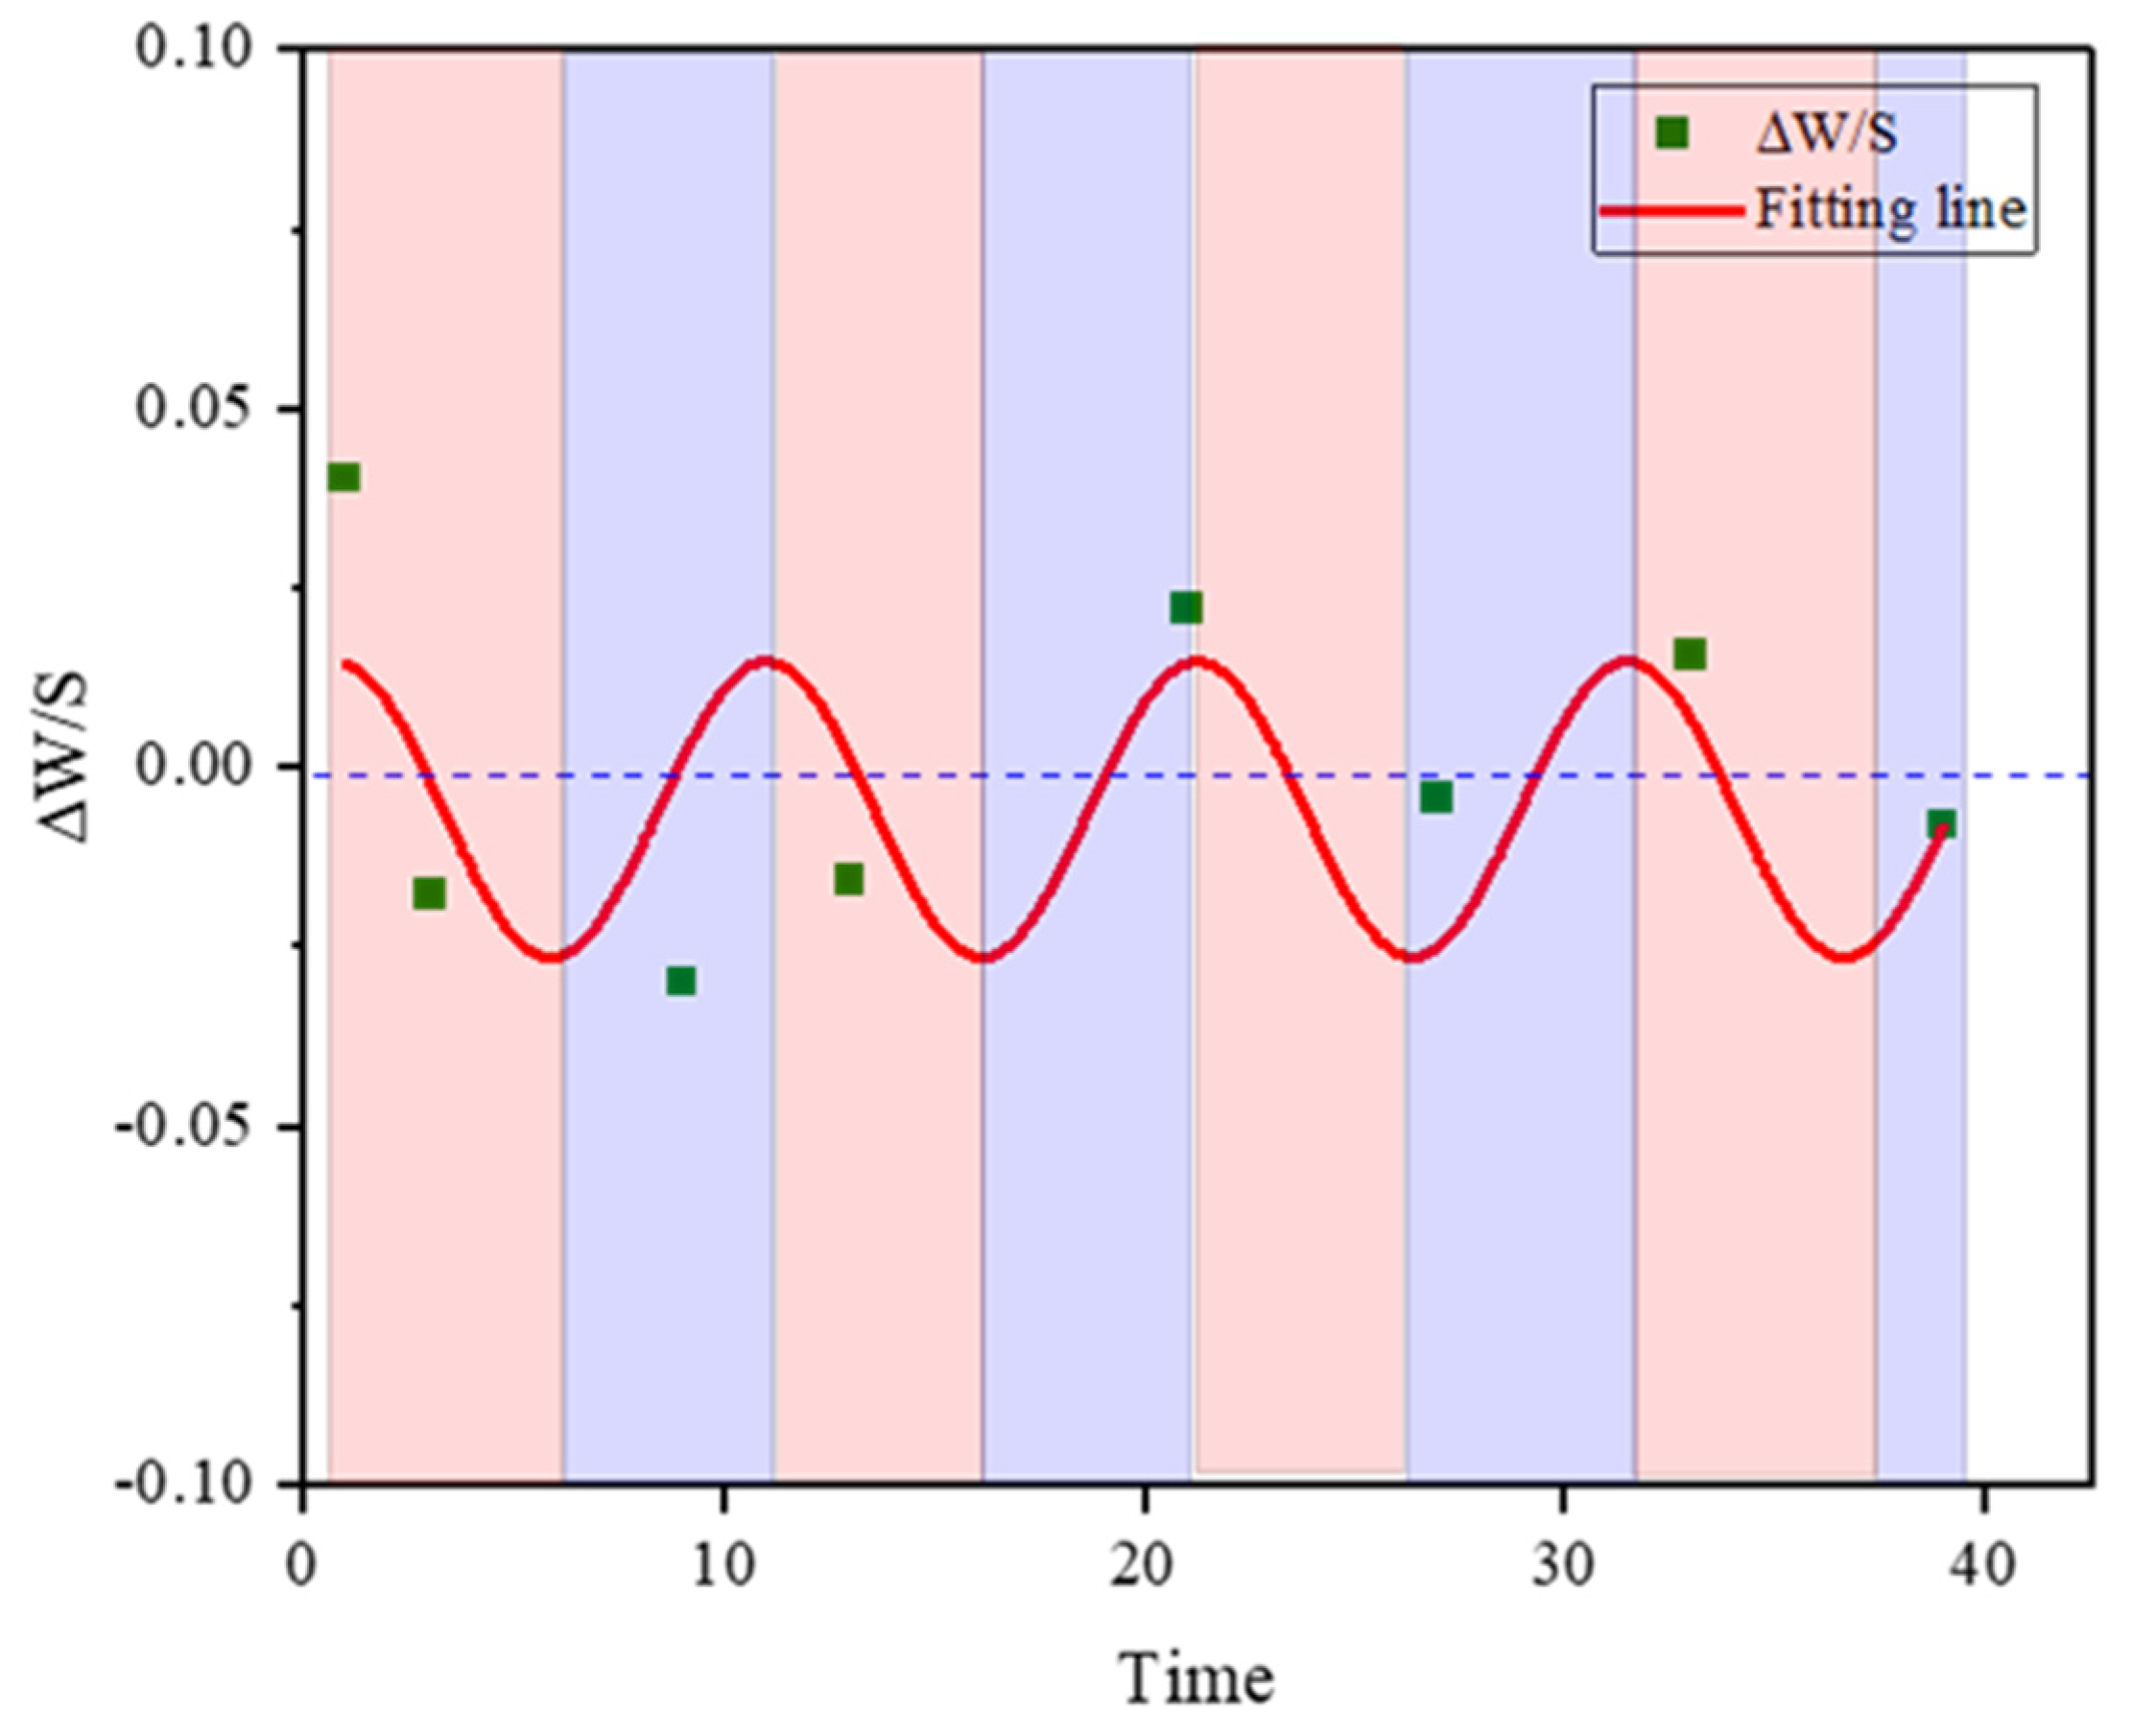
Figure 12.
The regular fluctuation of ∆W/S with time for test track 2.
Figure 12.
The regular fluctuation of ∆W/S with time for test track 2.
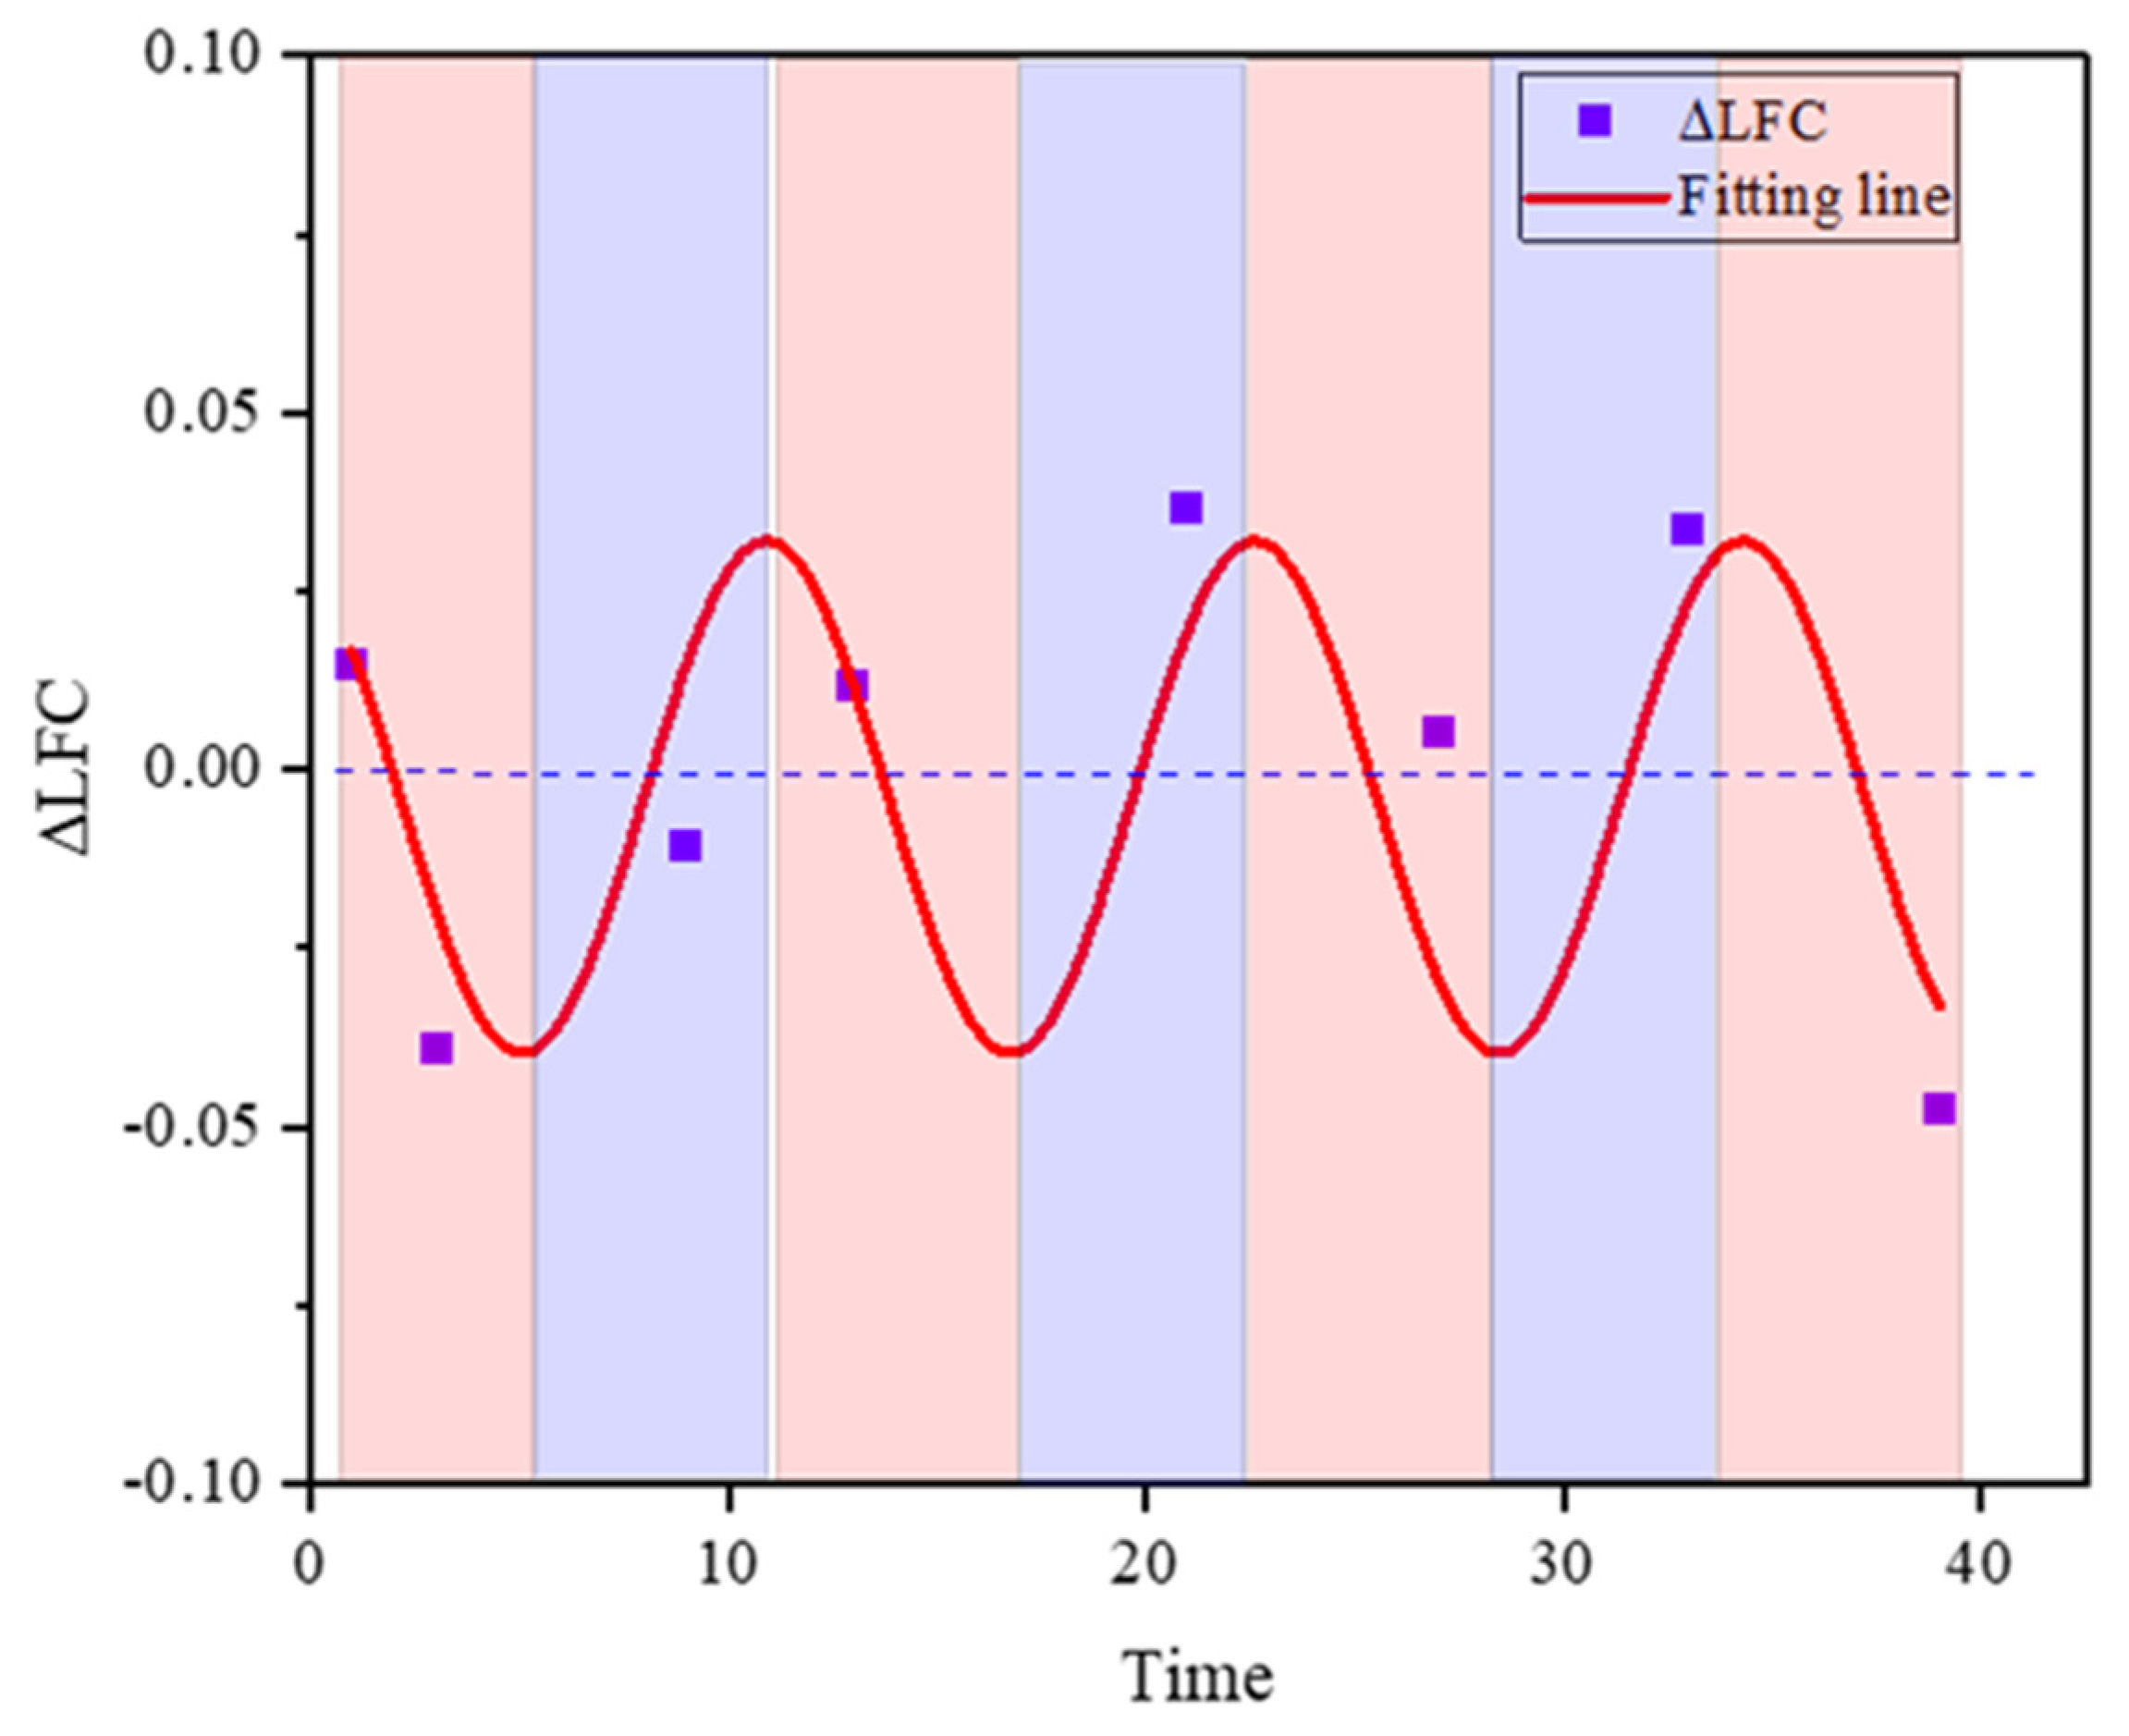
Figure 13.
The regular fluctuation of ∆LFC with time for test track 3.
Figure 13.
The regular fluctuation of ∆LFC with time for test track 3.
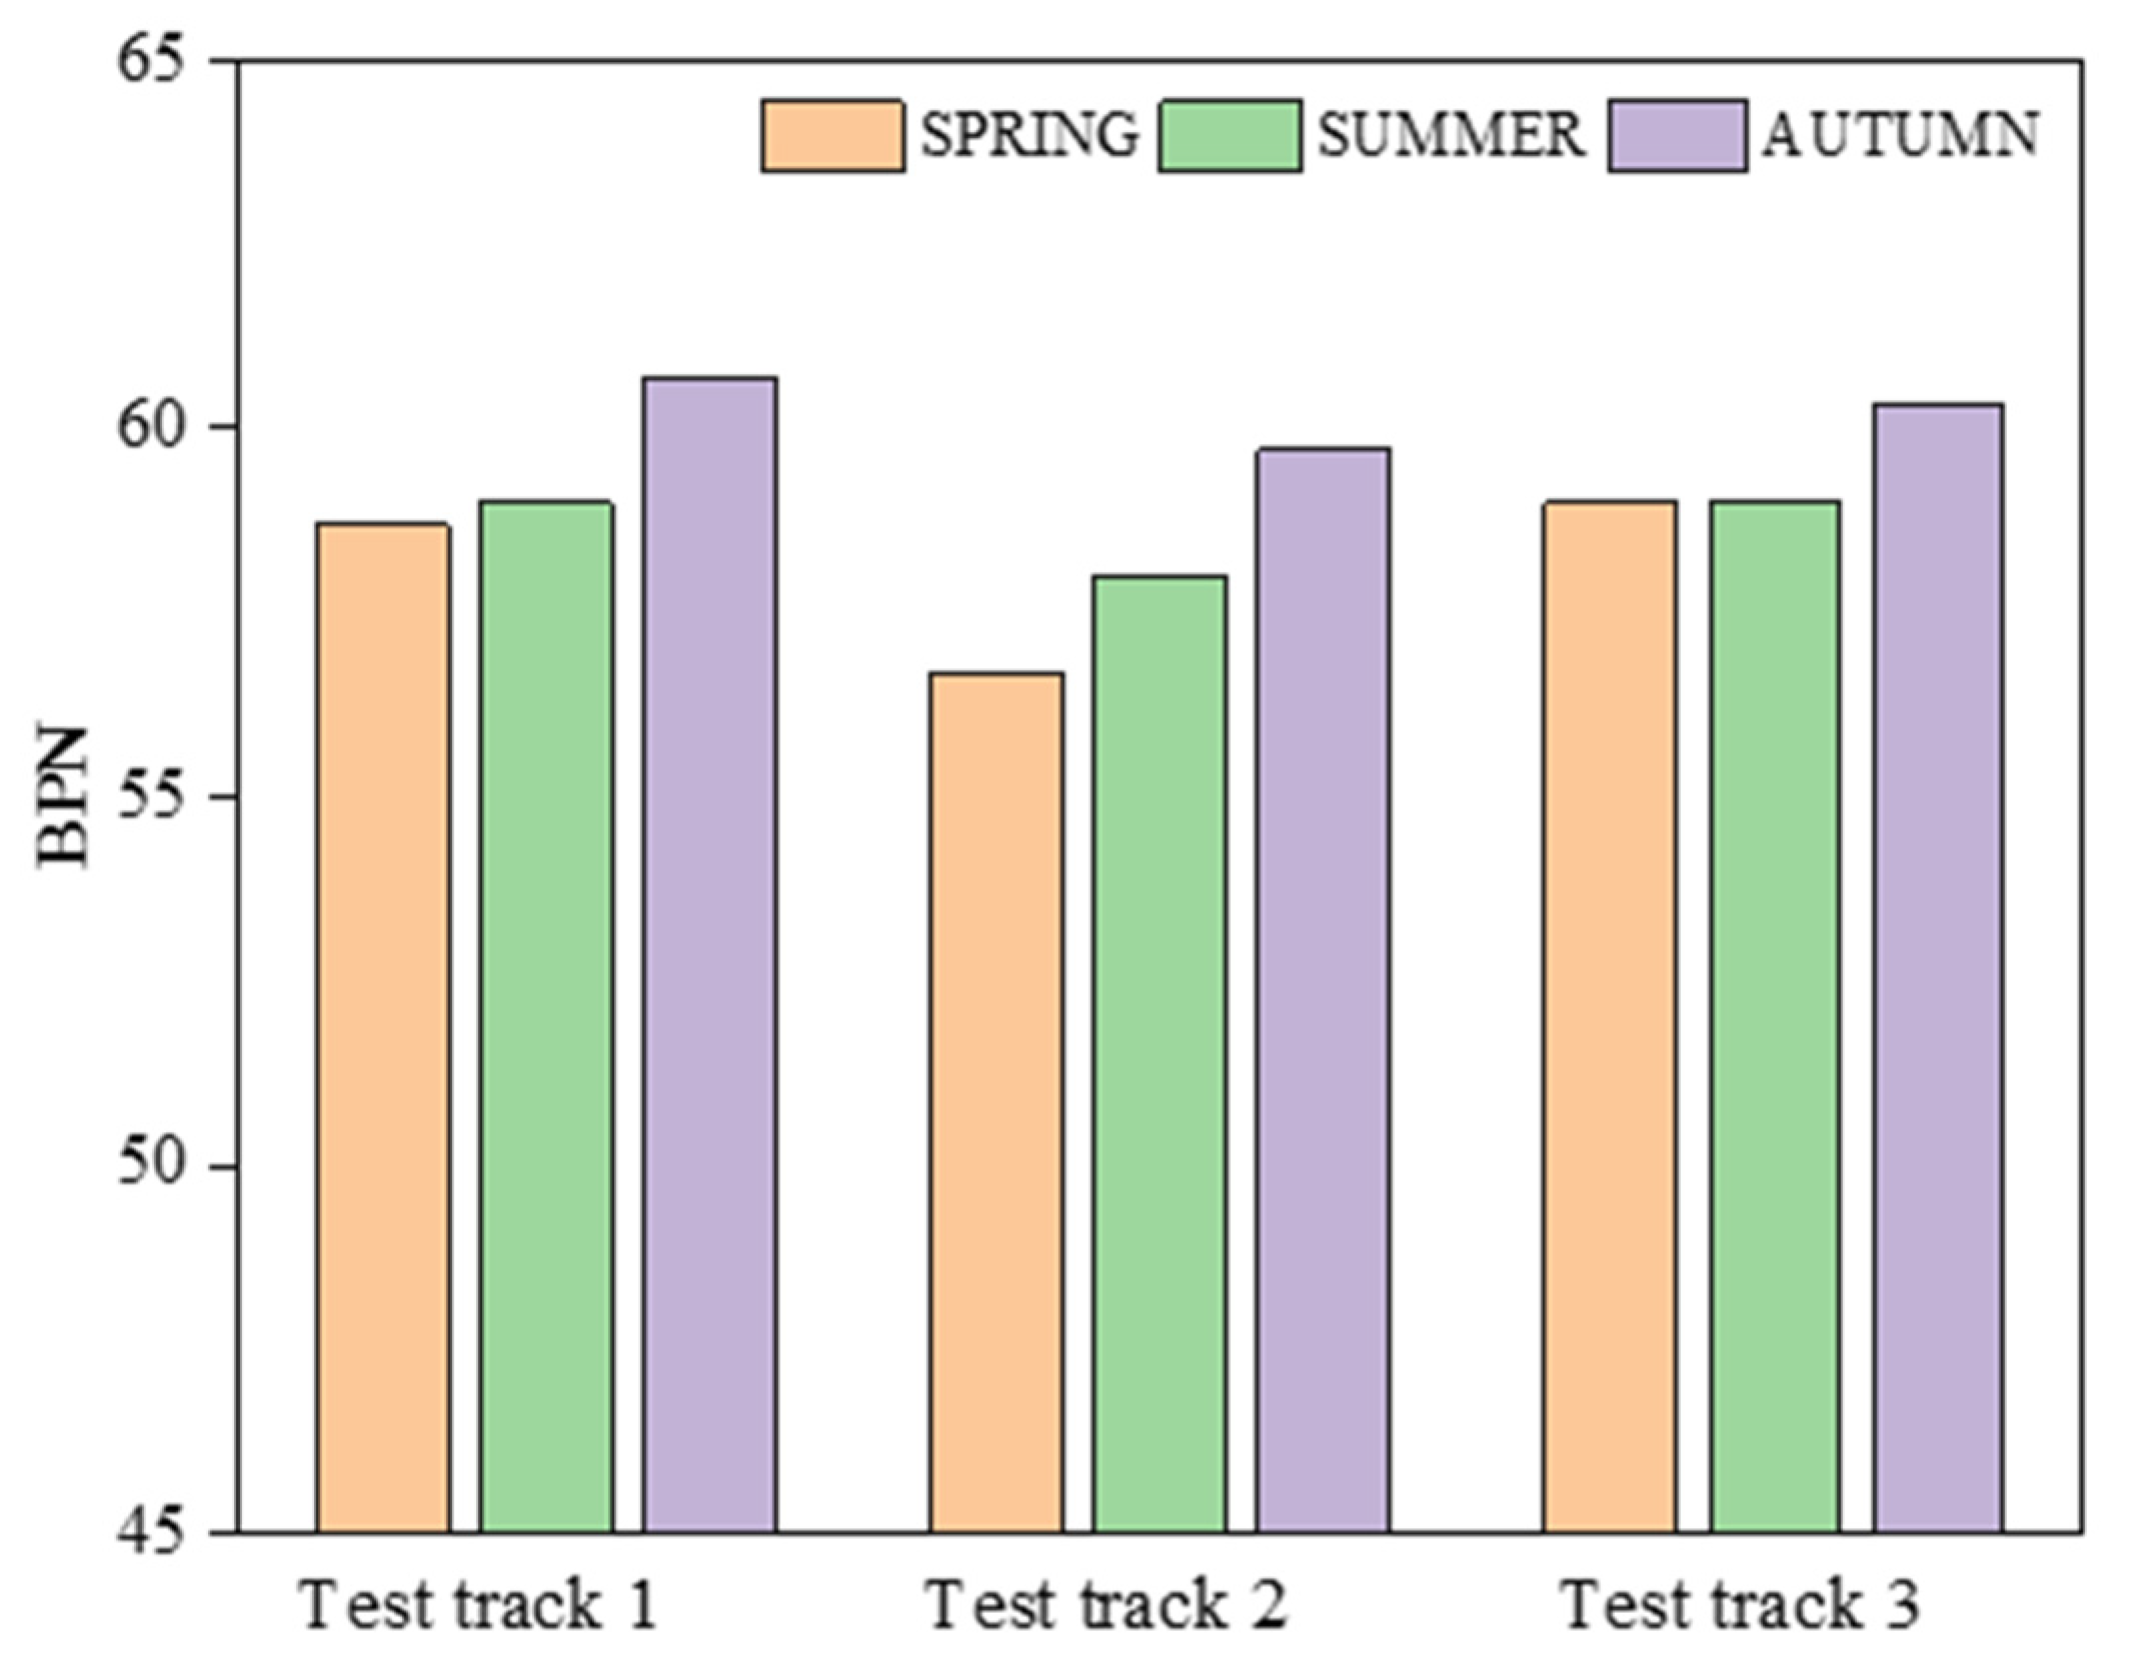
Figure 14.
Seasonal averaged BPN values of different test tracks.
Figure 14.
Seasonal averaged BPN values of different test tracks.
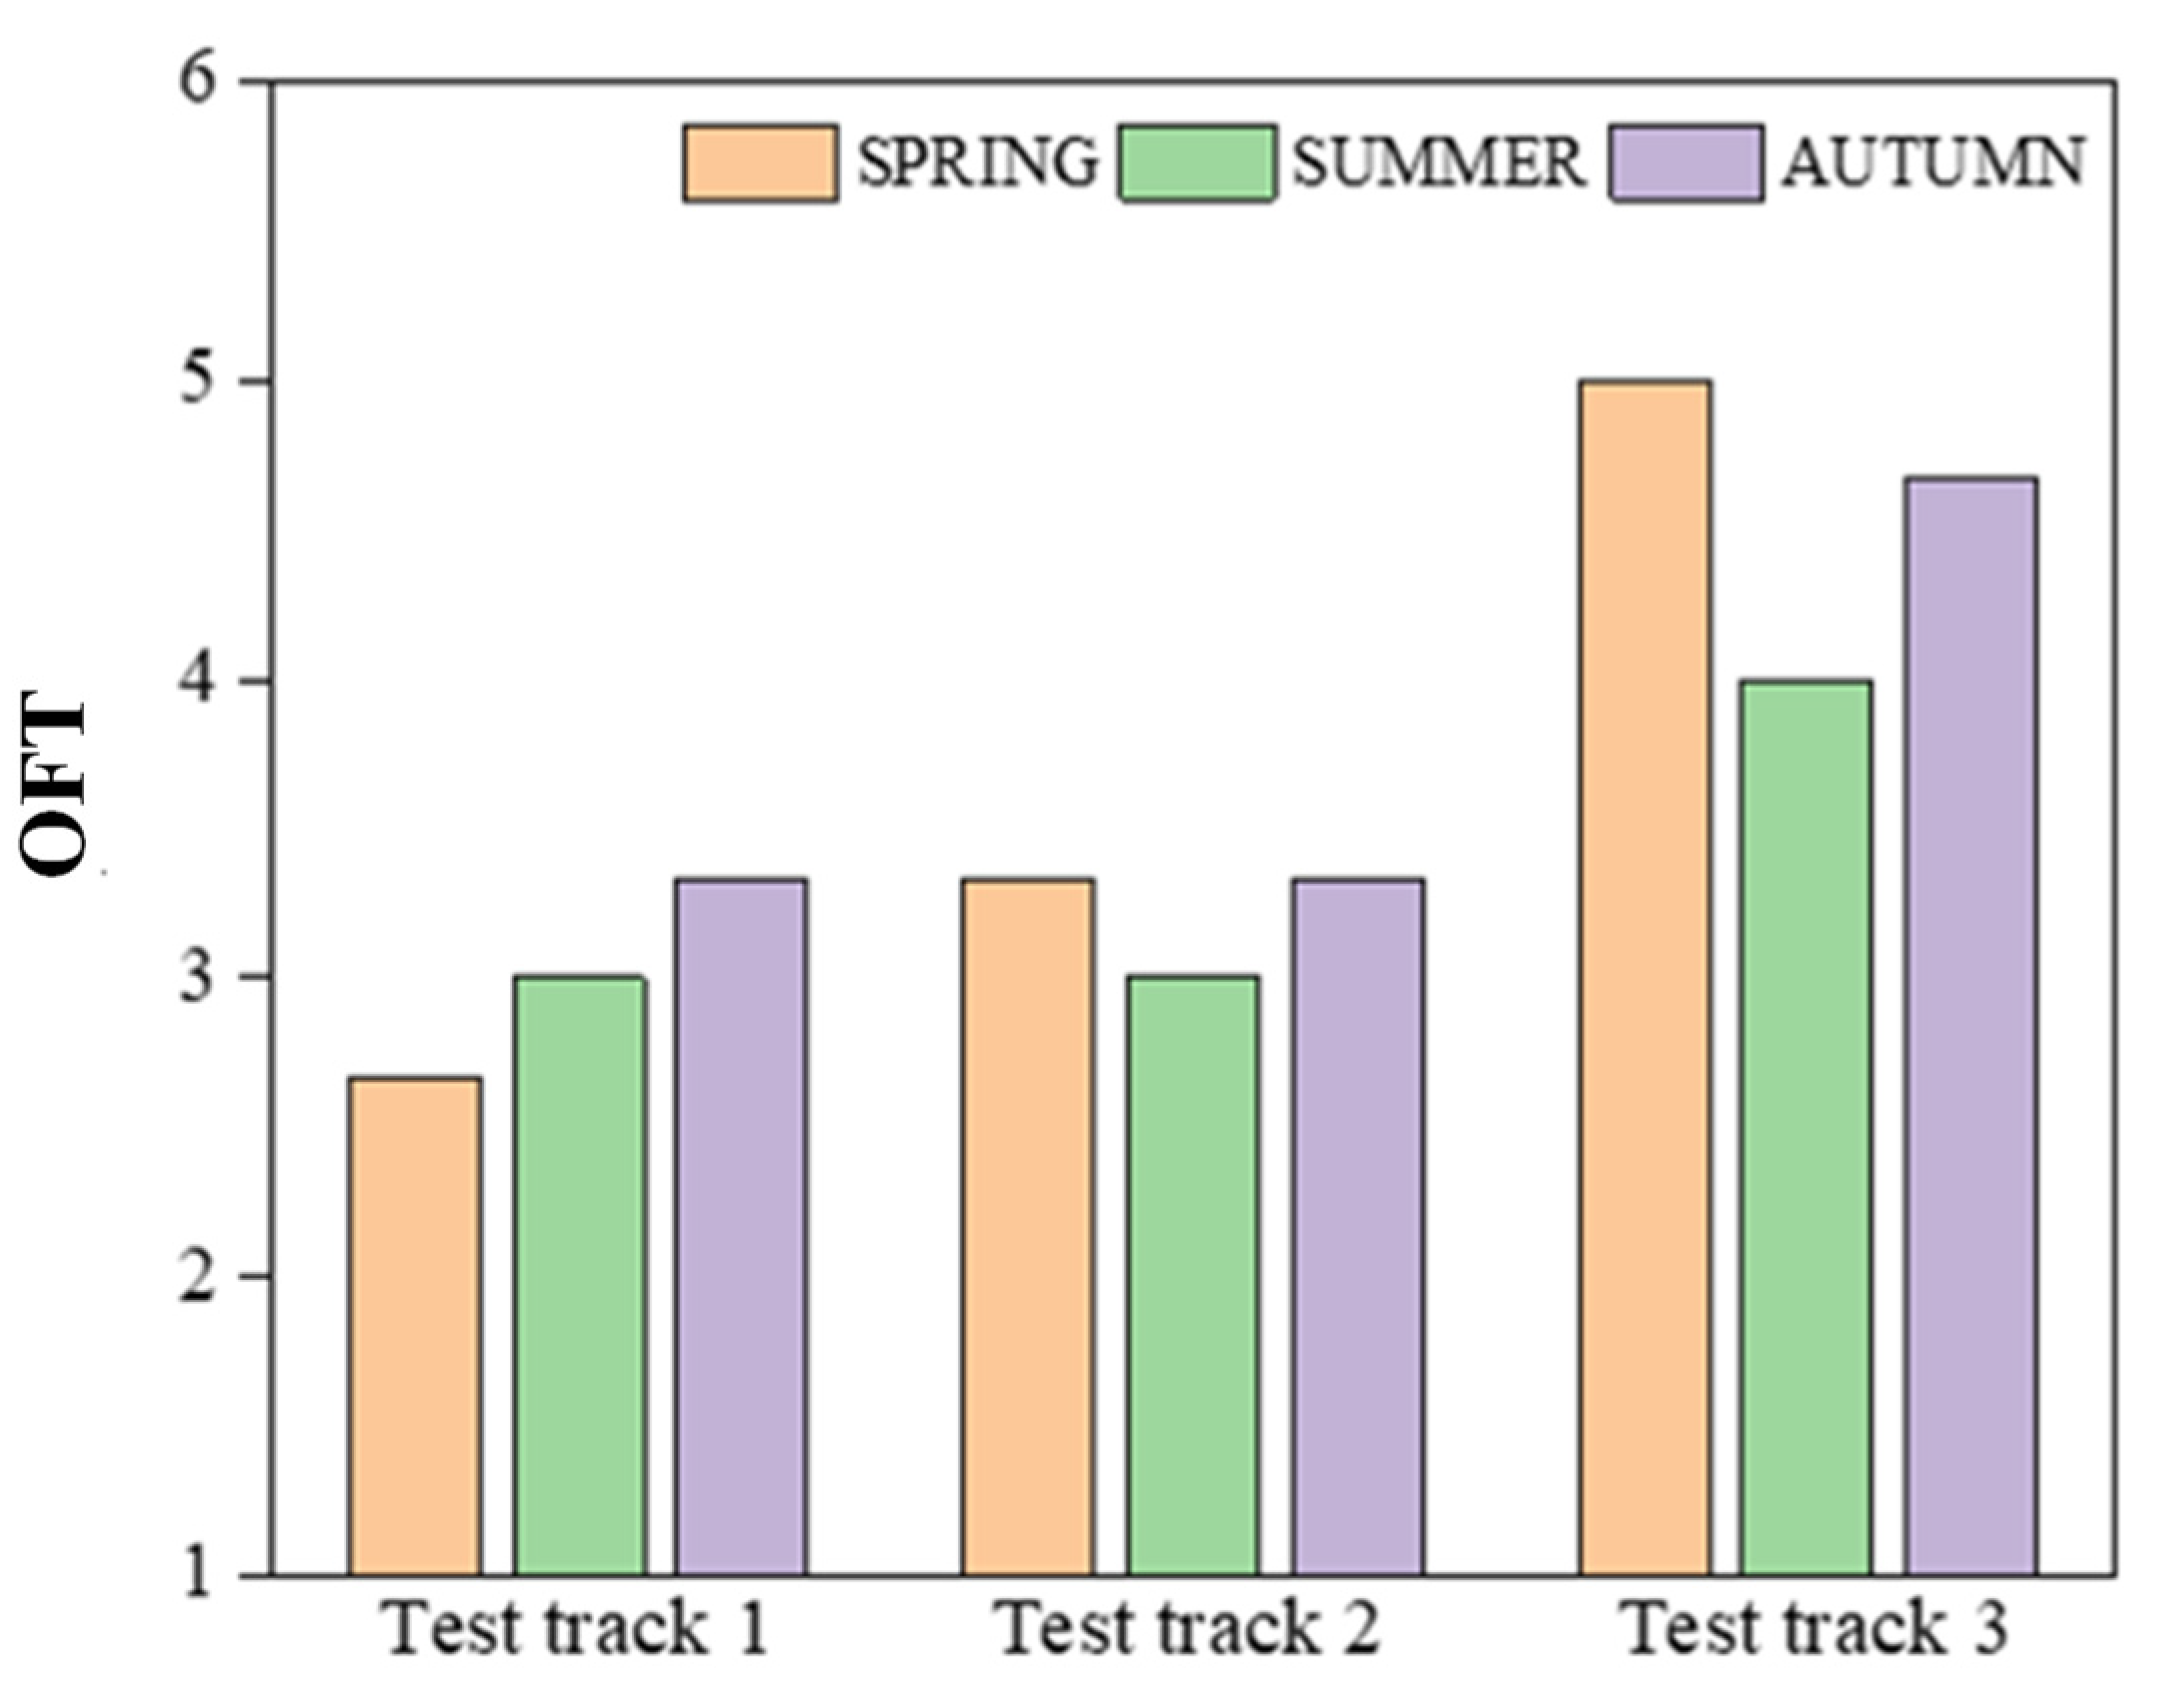
Figure 15.
Seasonal averaged OFT values of different test tracks.
Figure 15.
Seasonal averaged OFT values of different test tracks.
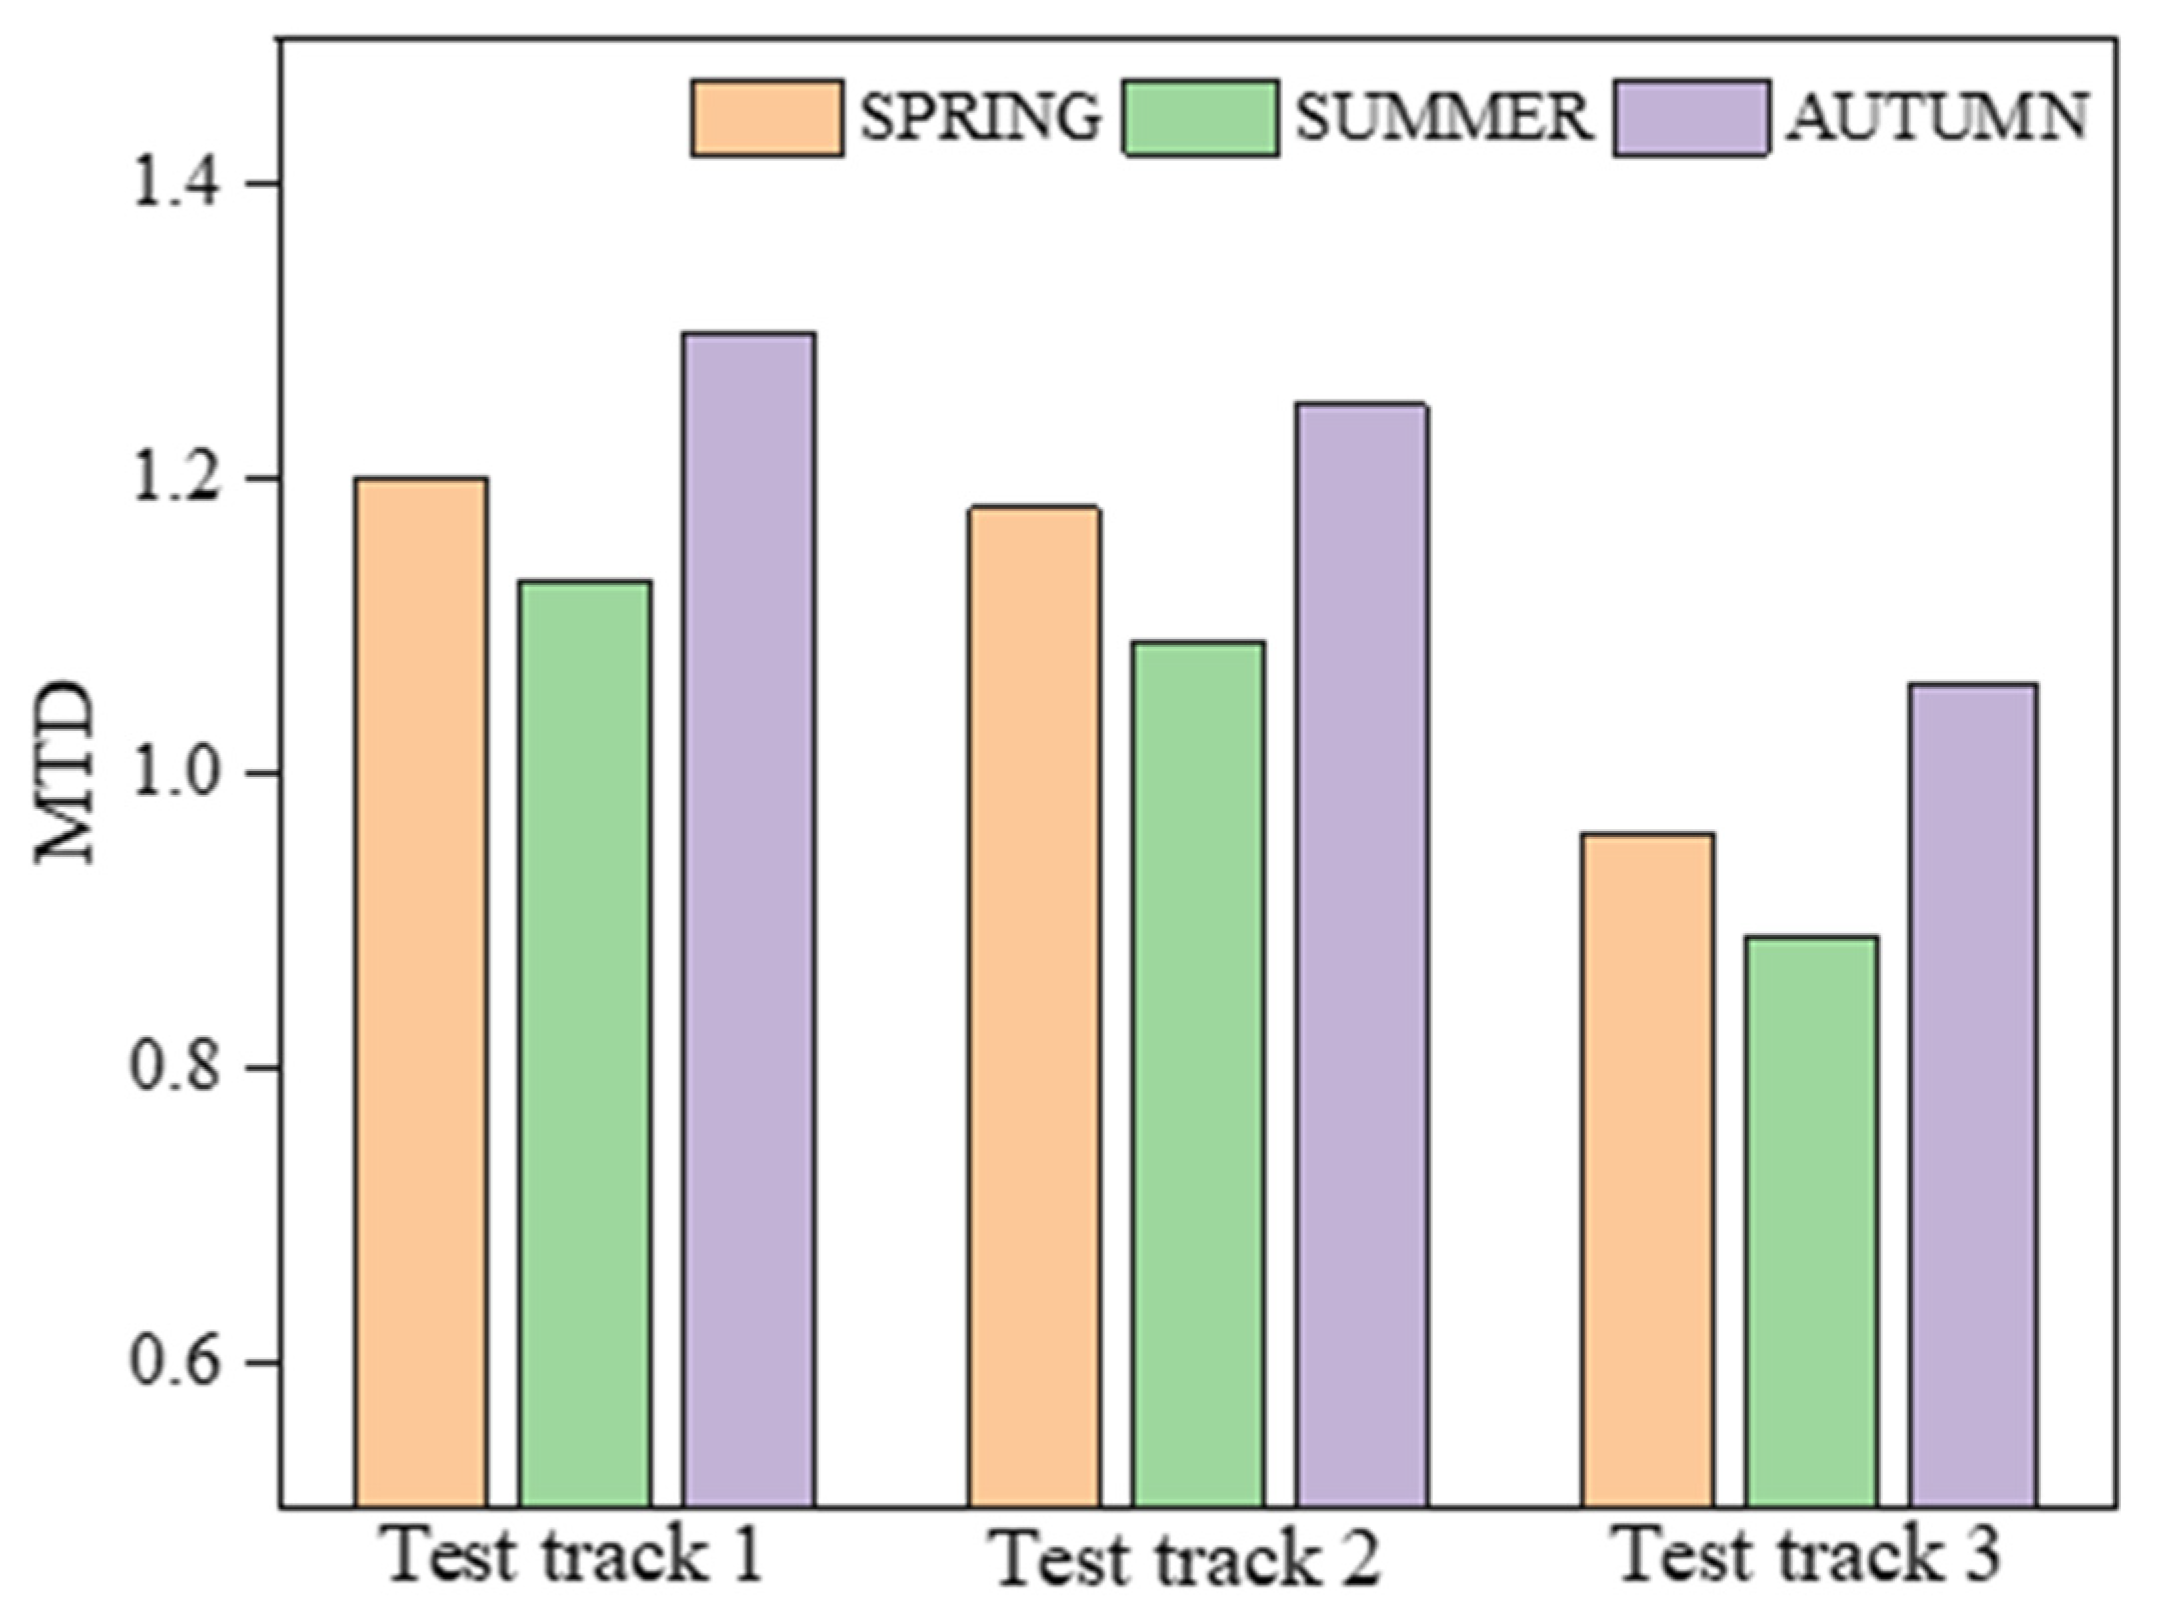
Figure 16.
Seasonal averaged MTD values of different test tracks.
Figure 16.
Seasonal averaged MTD values of different test tracks.
Figure 17.
Seasonal averaged μW/S values of different test tracks.
Figure 17.
Seasonal averaged μW/S values of different test tracks.
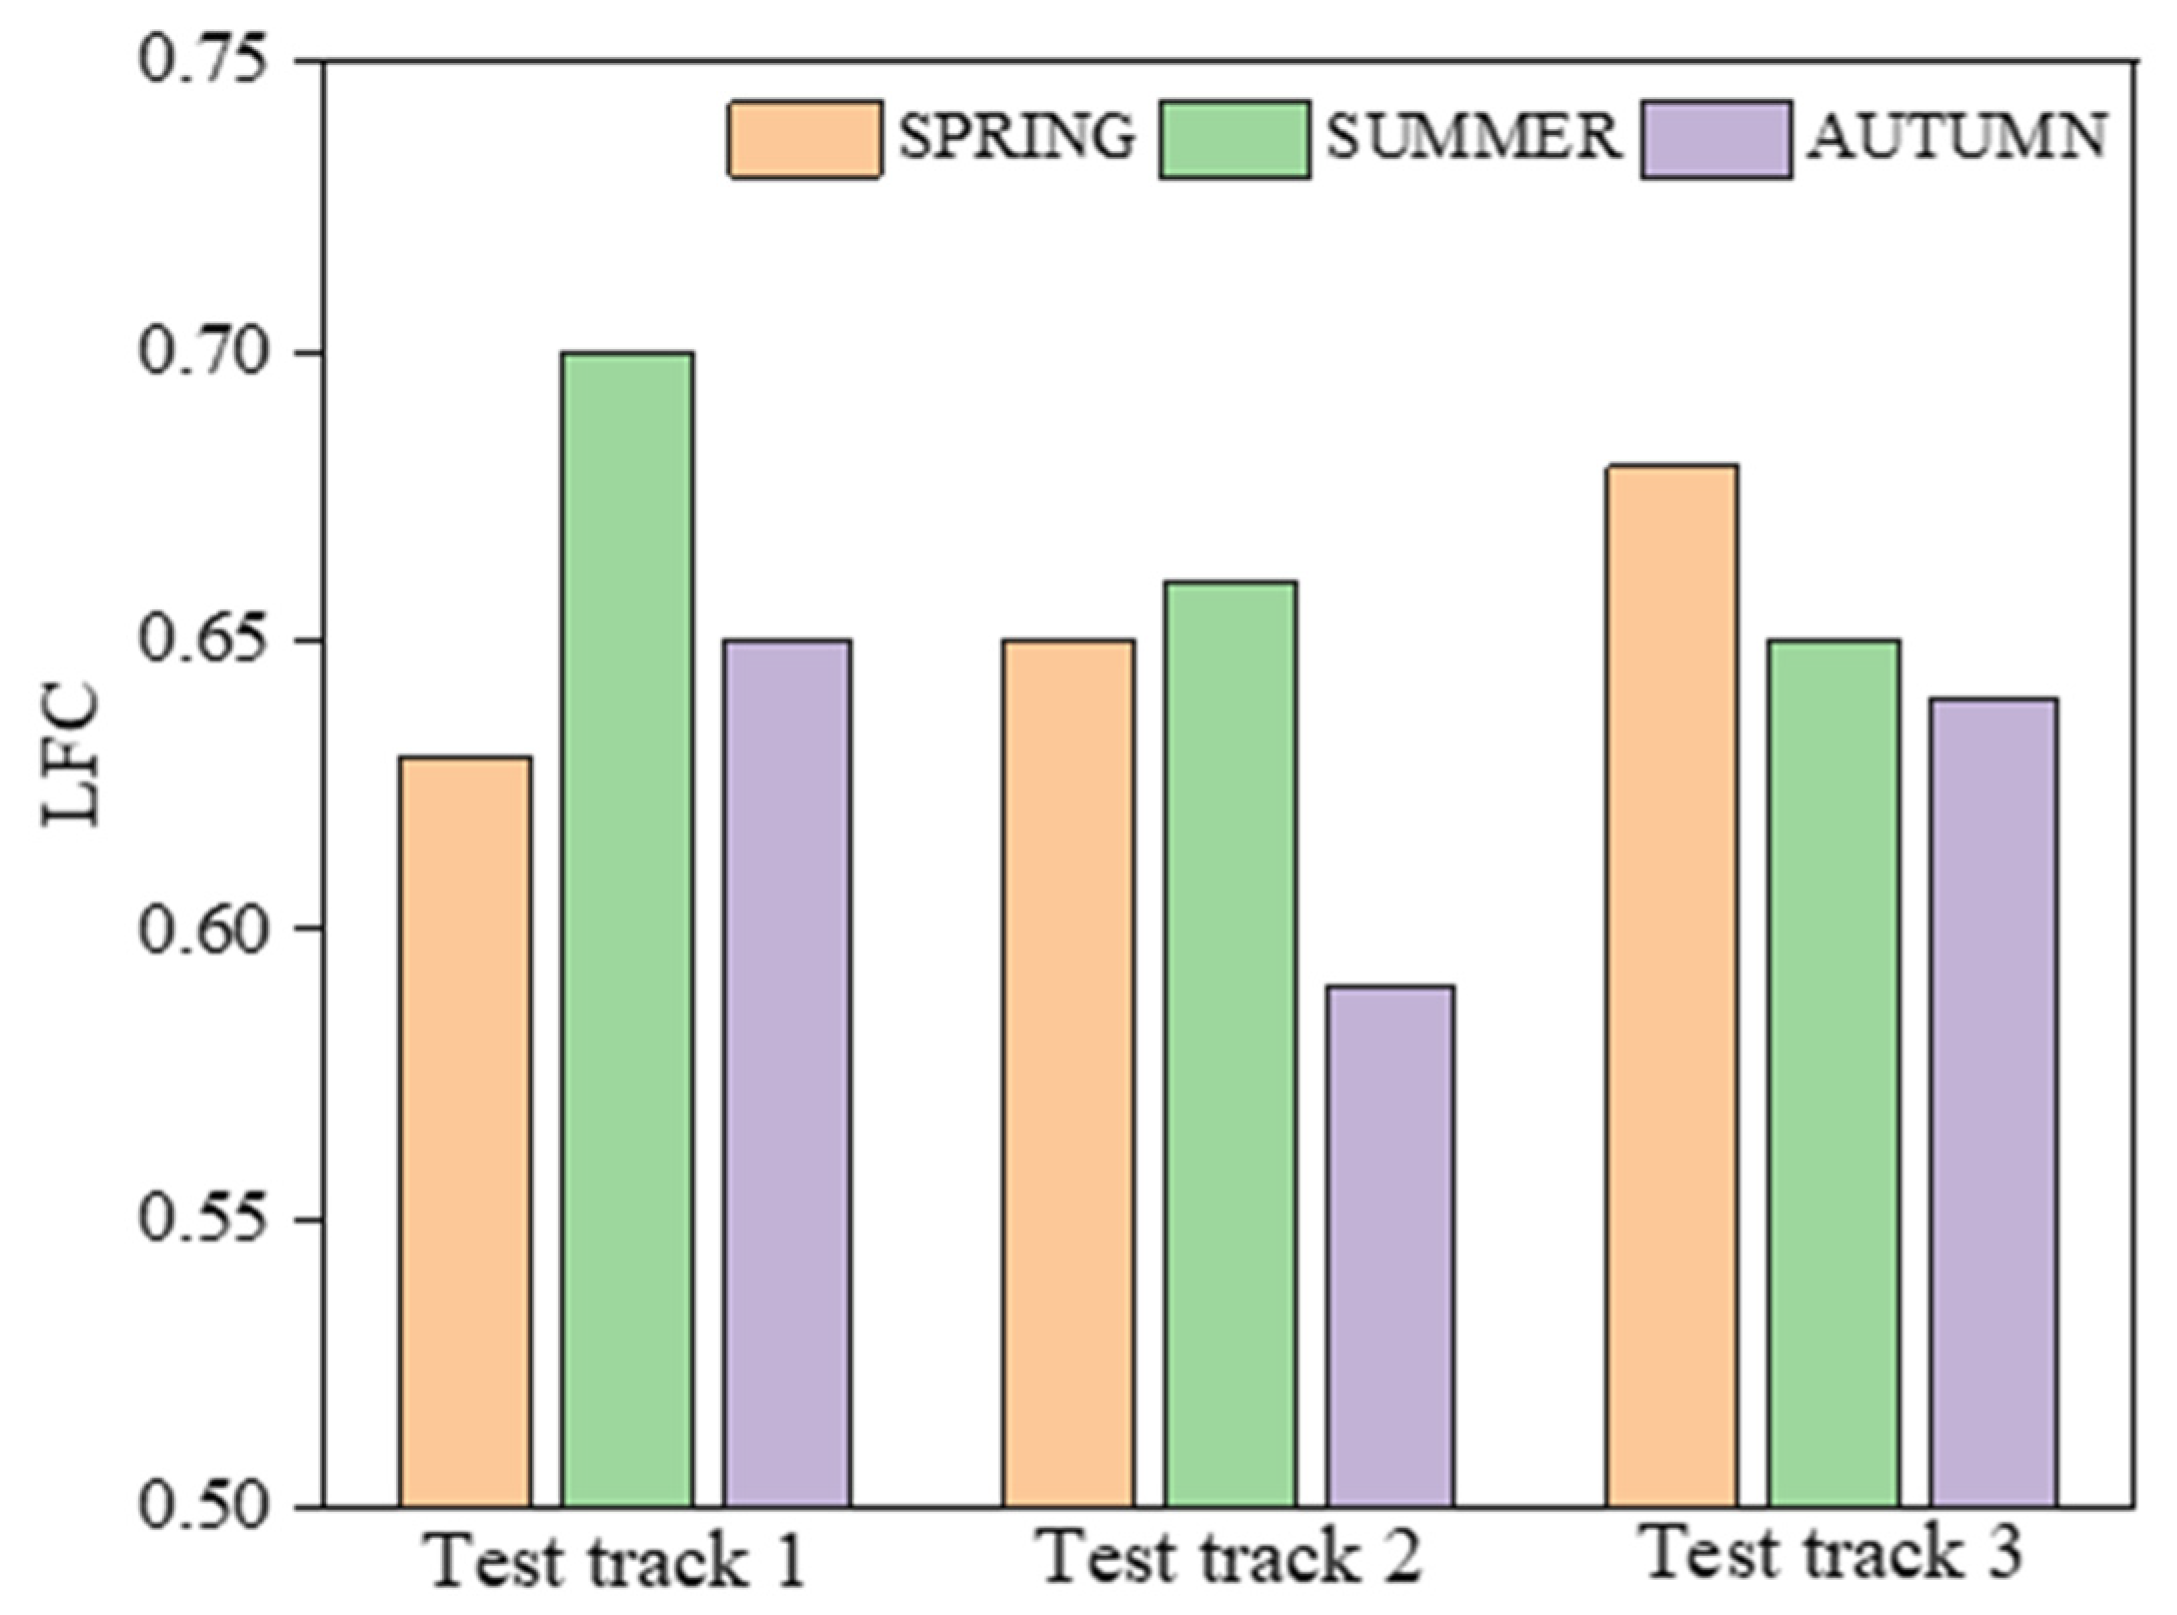
Figure 18.
Seasonal averaged LFC values of different test tracks.
Figure 18.
Seasonal averaged LFC values of different test tracks.
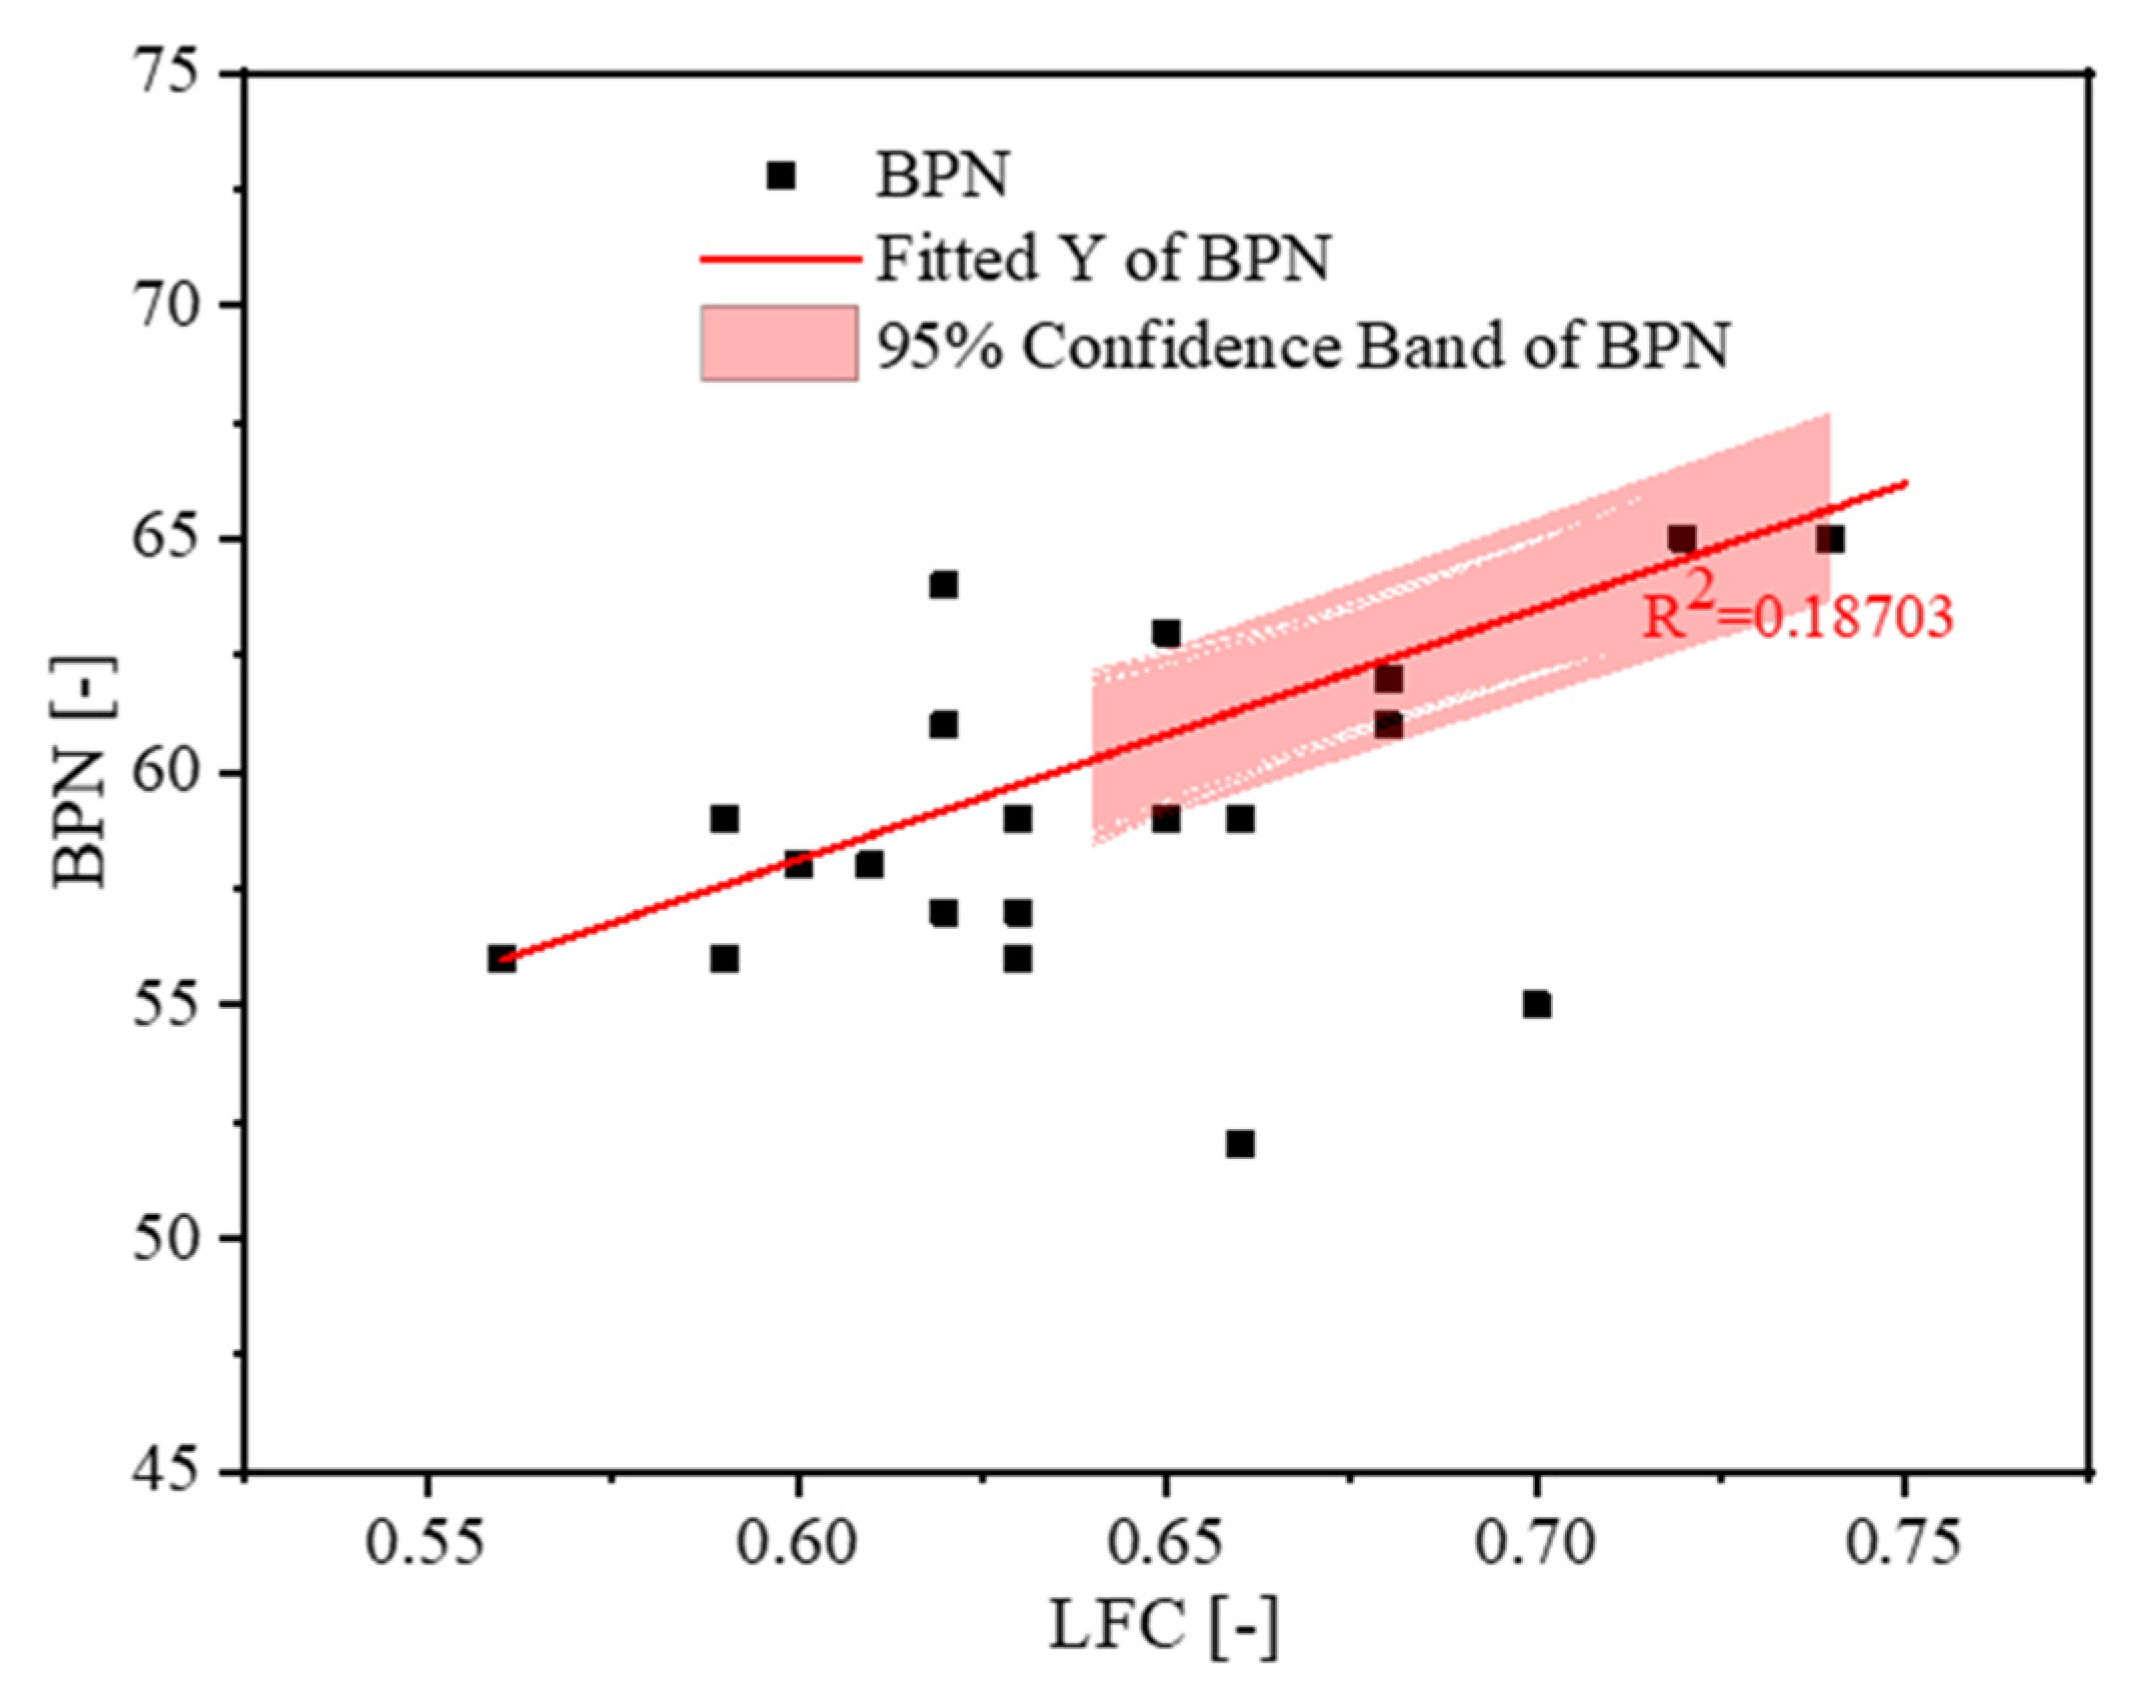
Figure 19.
Correlation analysis between LFC and BPN.
Figure 19.
Correlation analysis between LFC and BPN.
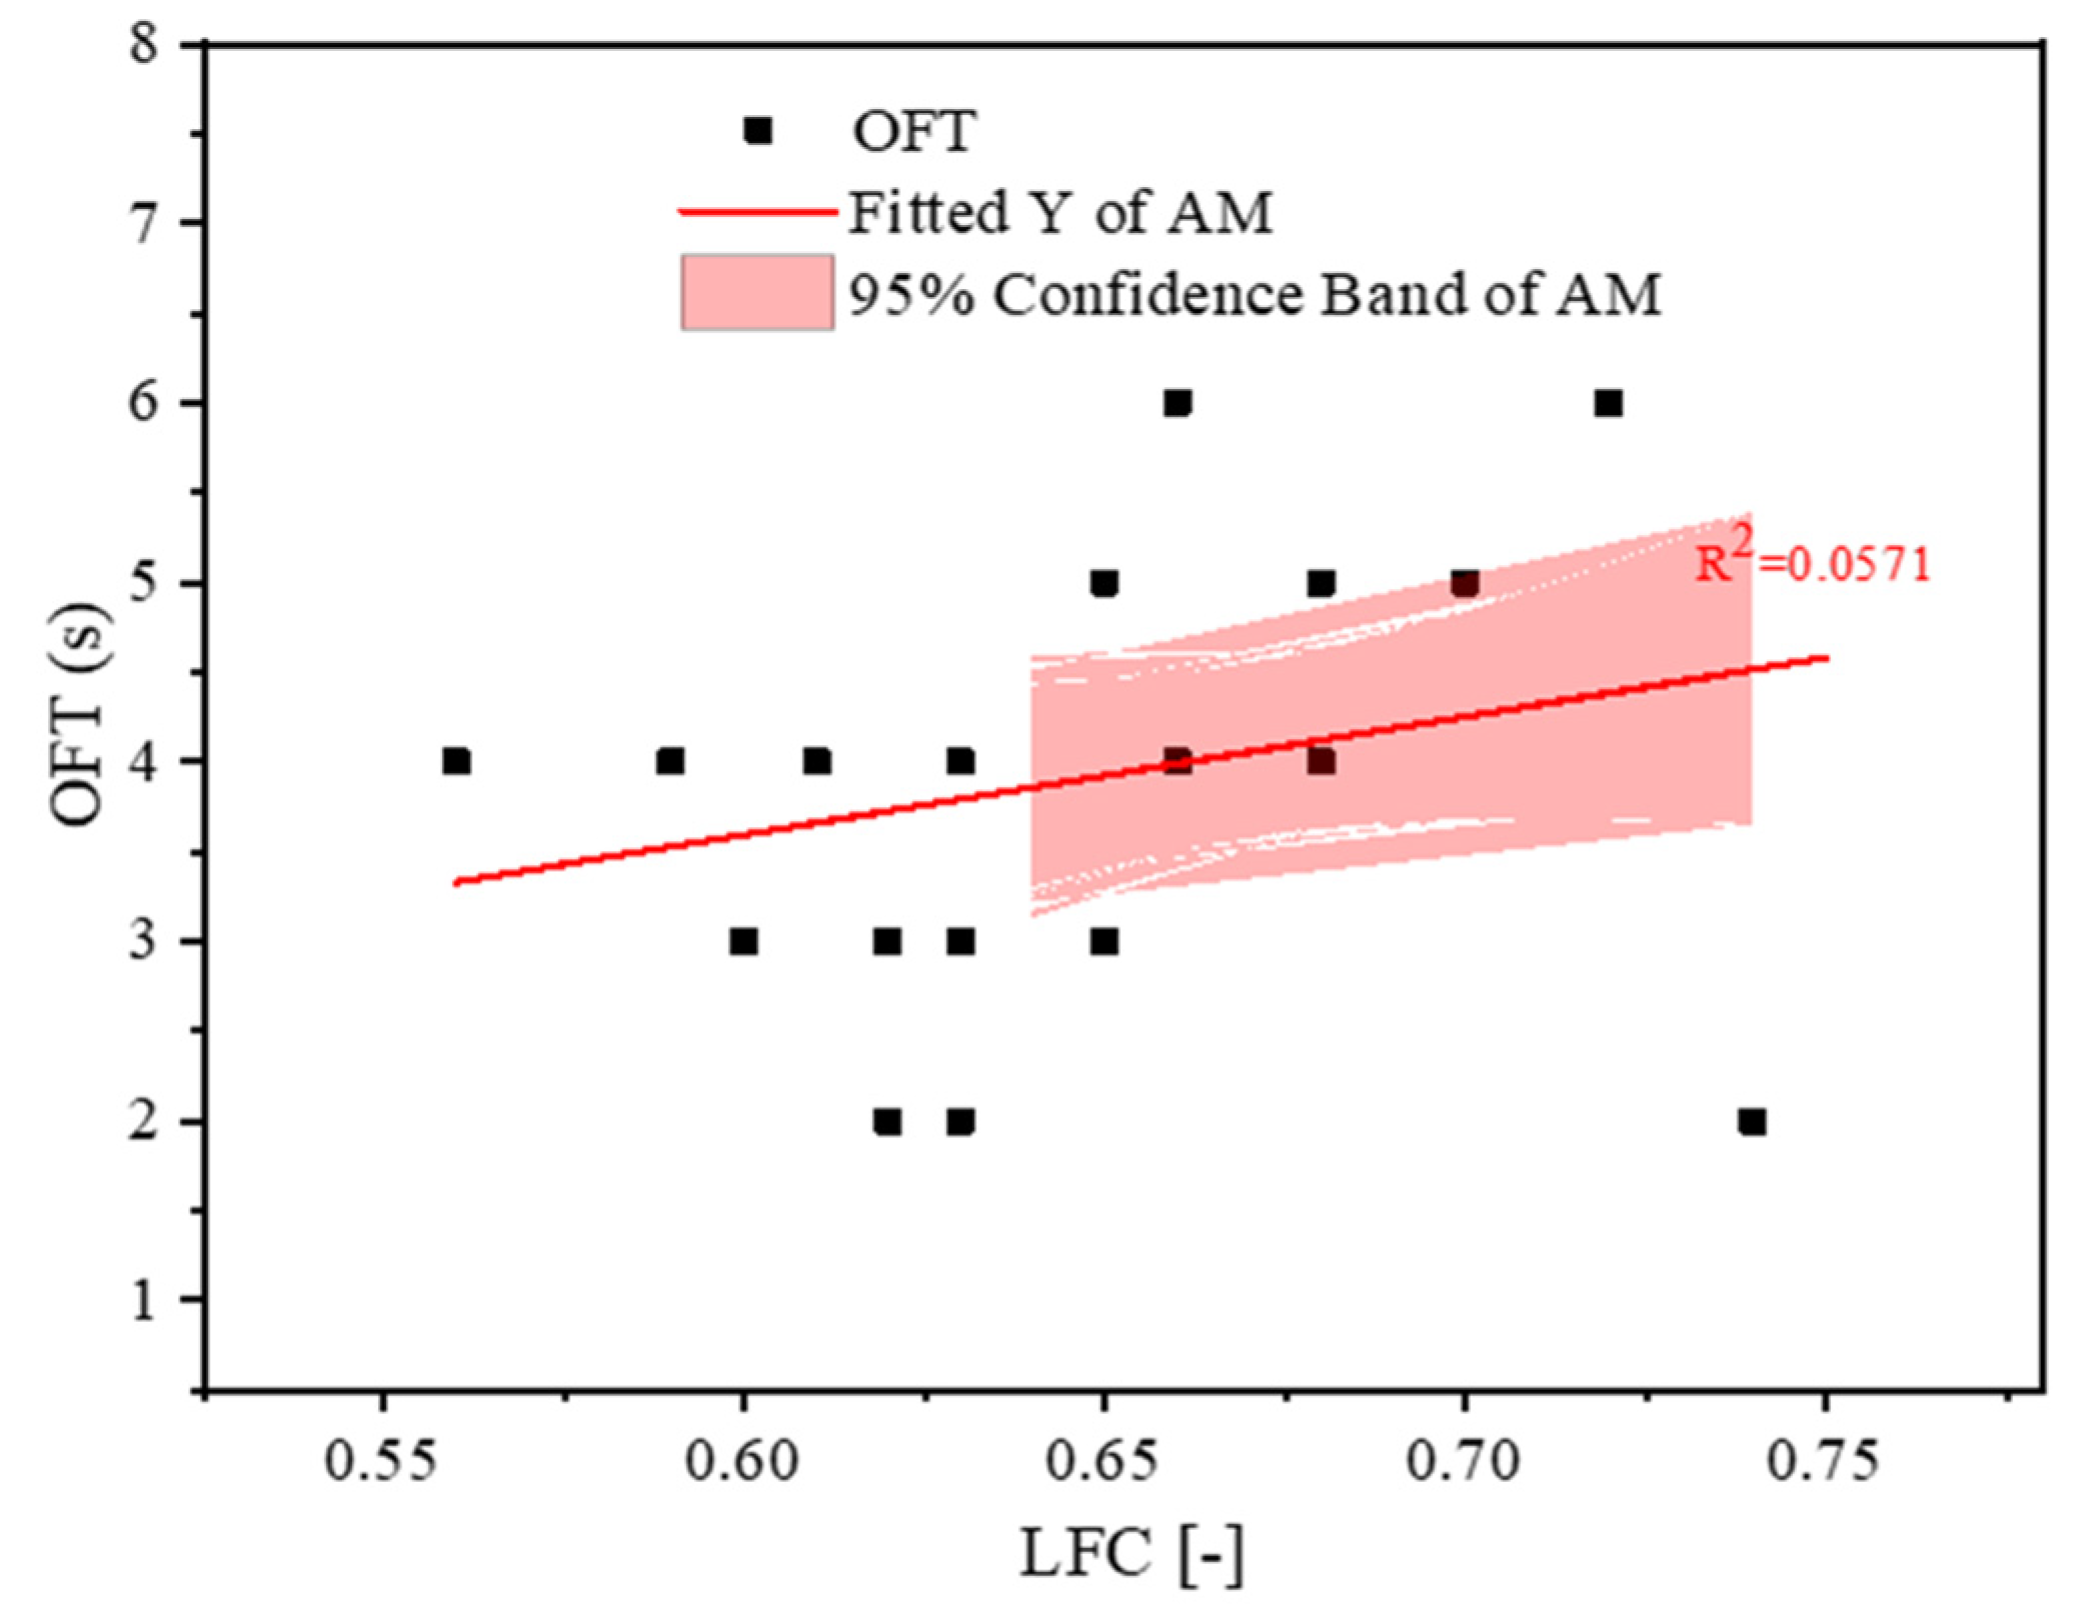
Figure 20.
Correlation analysis between LFC and OFT.
Figure 20.
Correlation analysis between LFC and OFT.
Figure 21.
Correlation analysis between LFC and MTD.
Figure 21.
Correlation analysis between LFC and MTD.
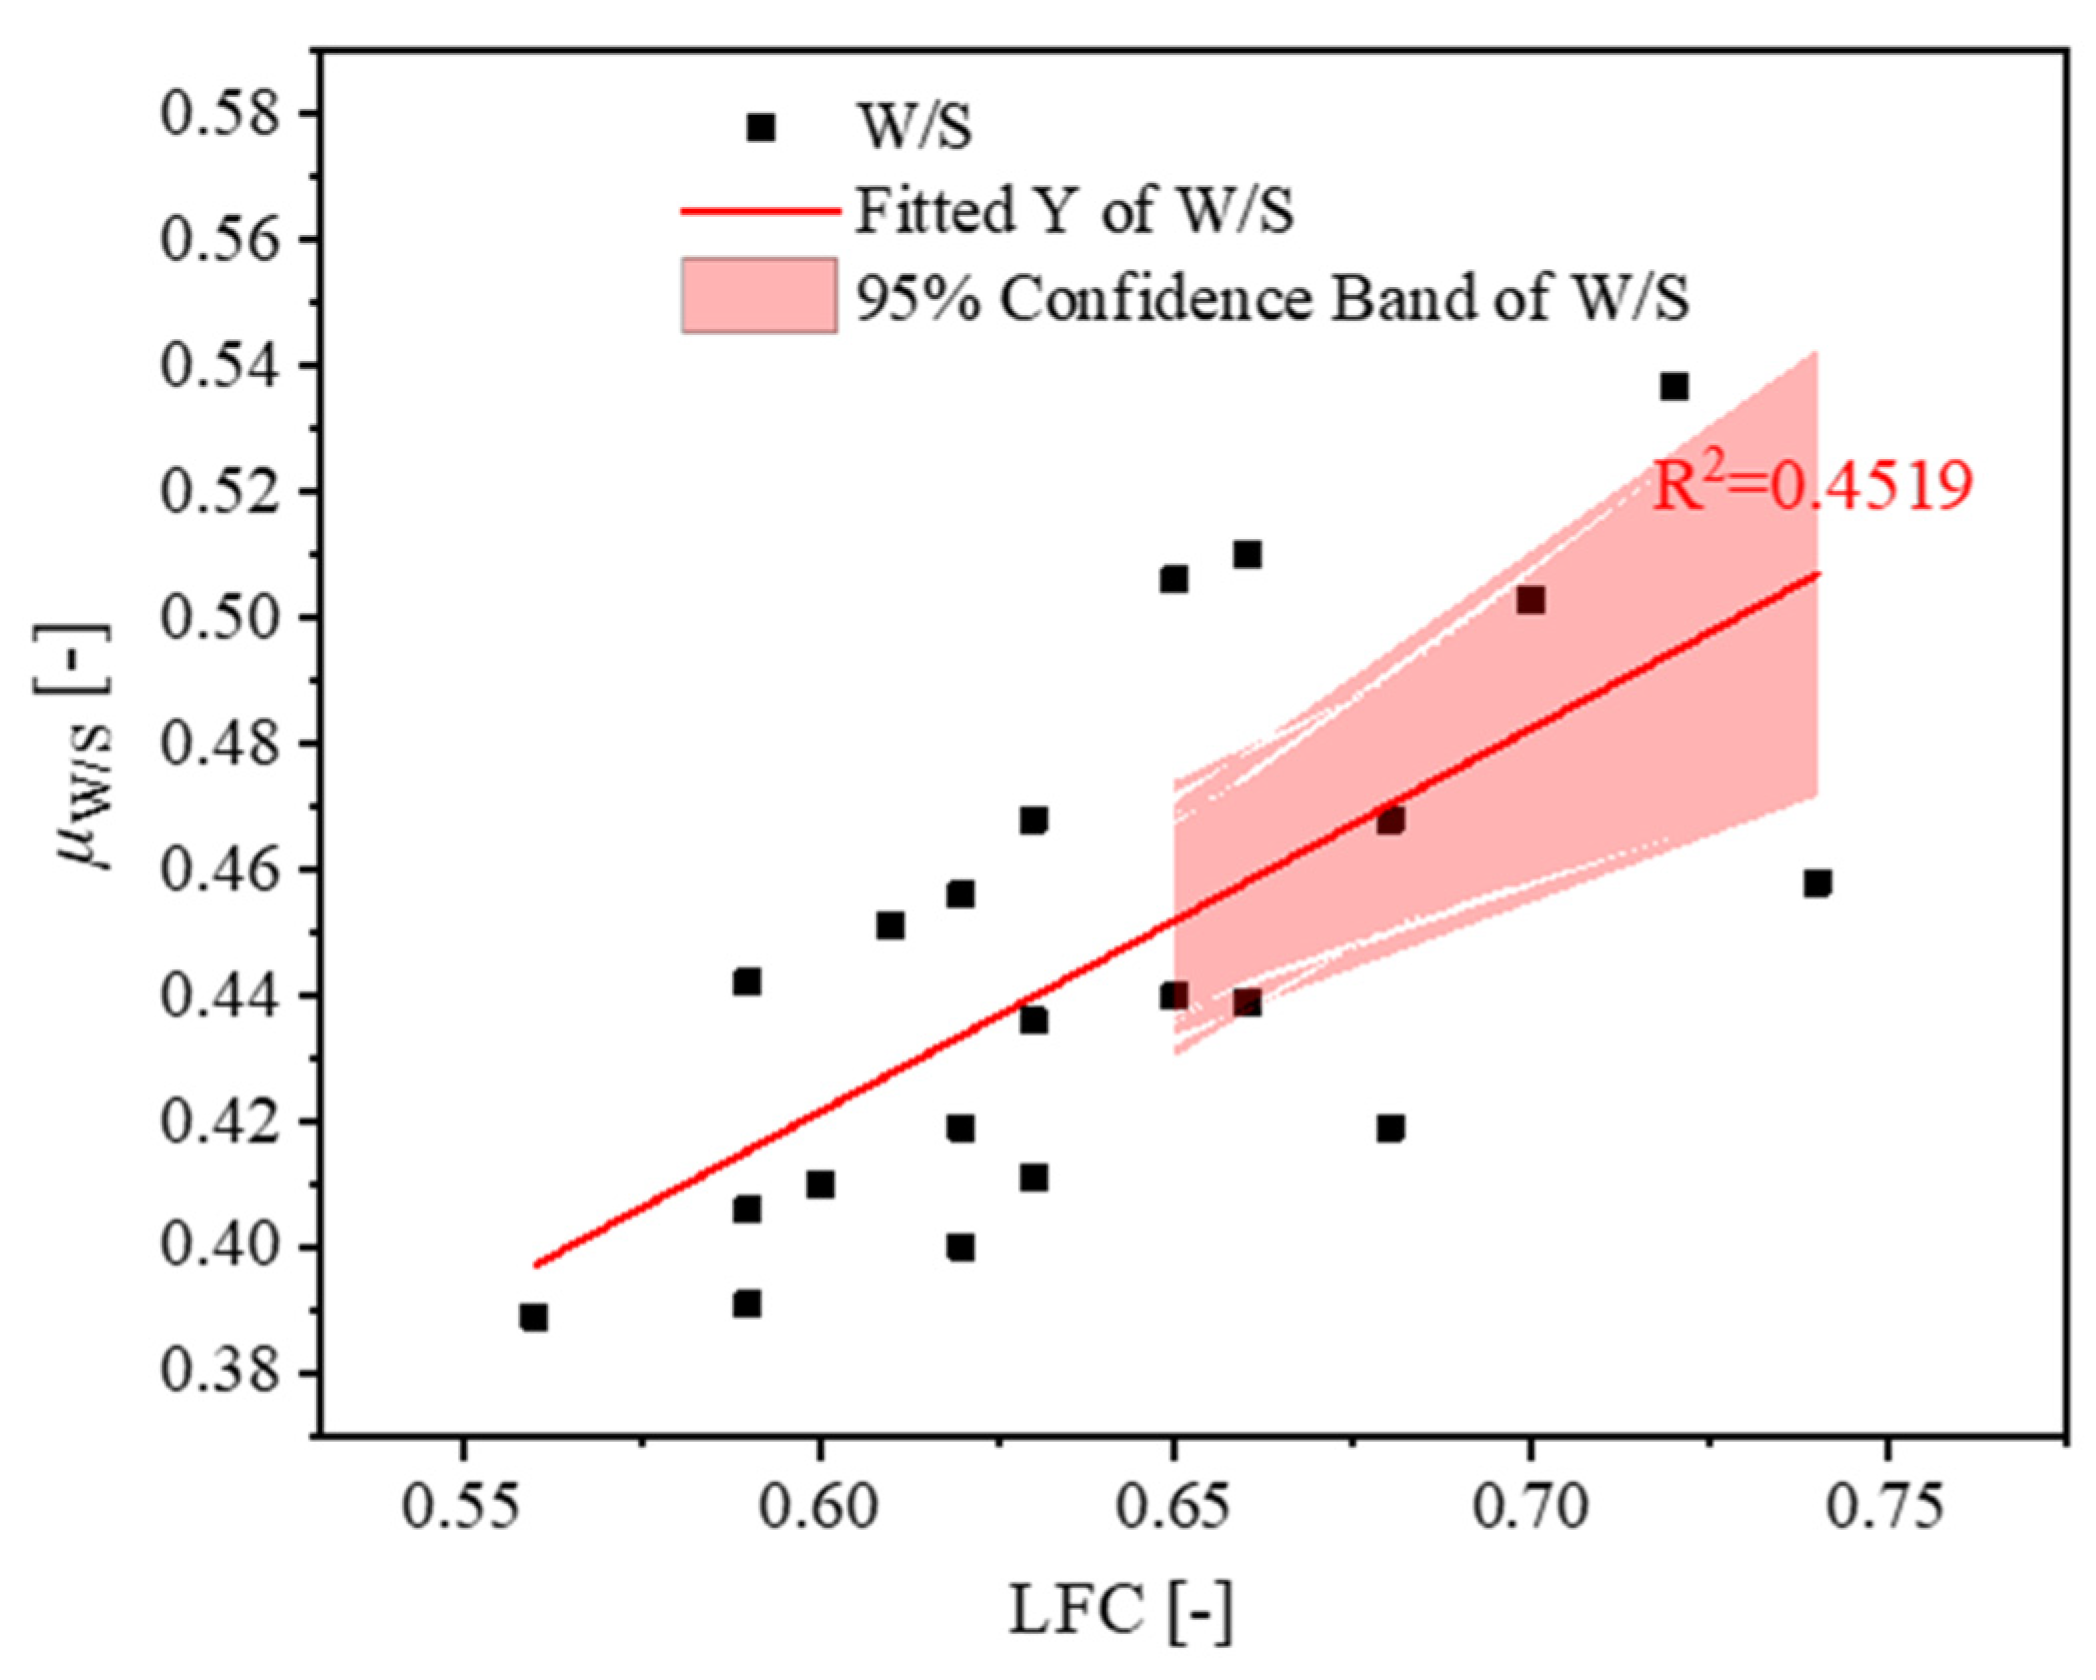
Figure 22.
Correlation analysis between LFC and μW/S.
Figure 22.
Correlation analysis between LFC and μW/S.
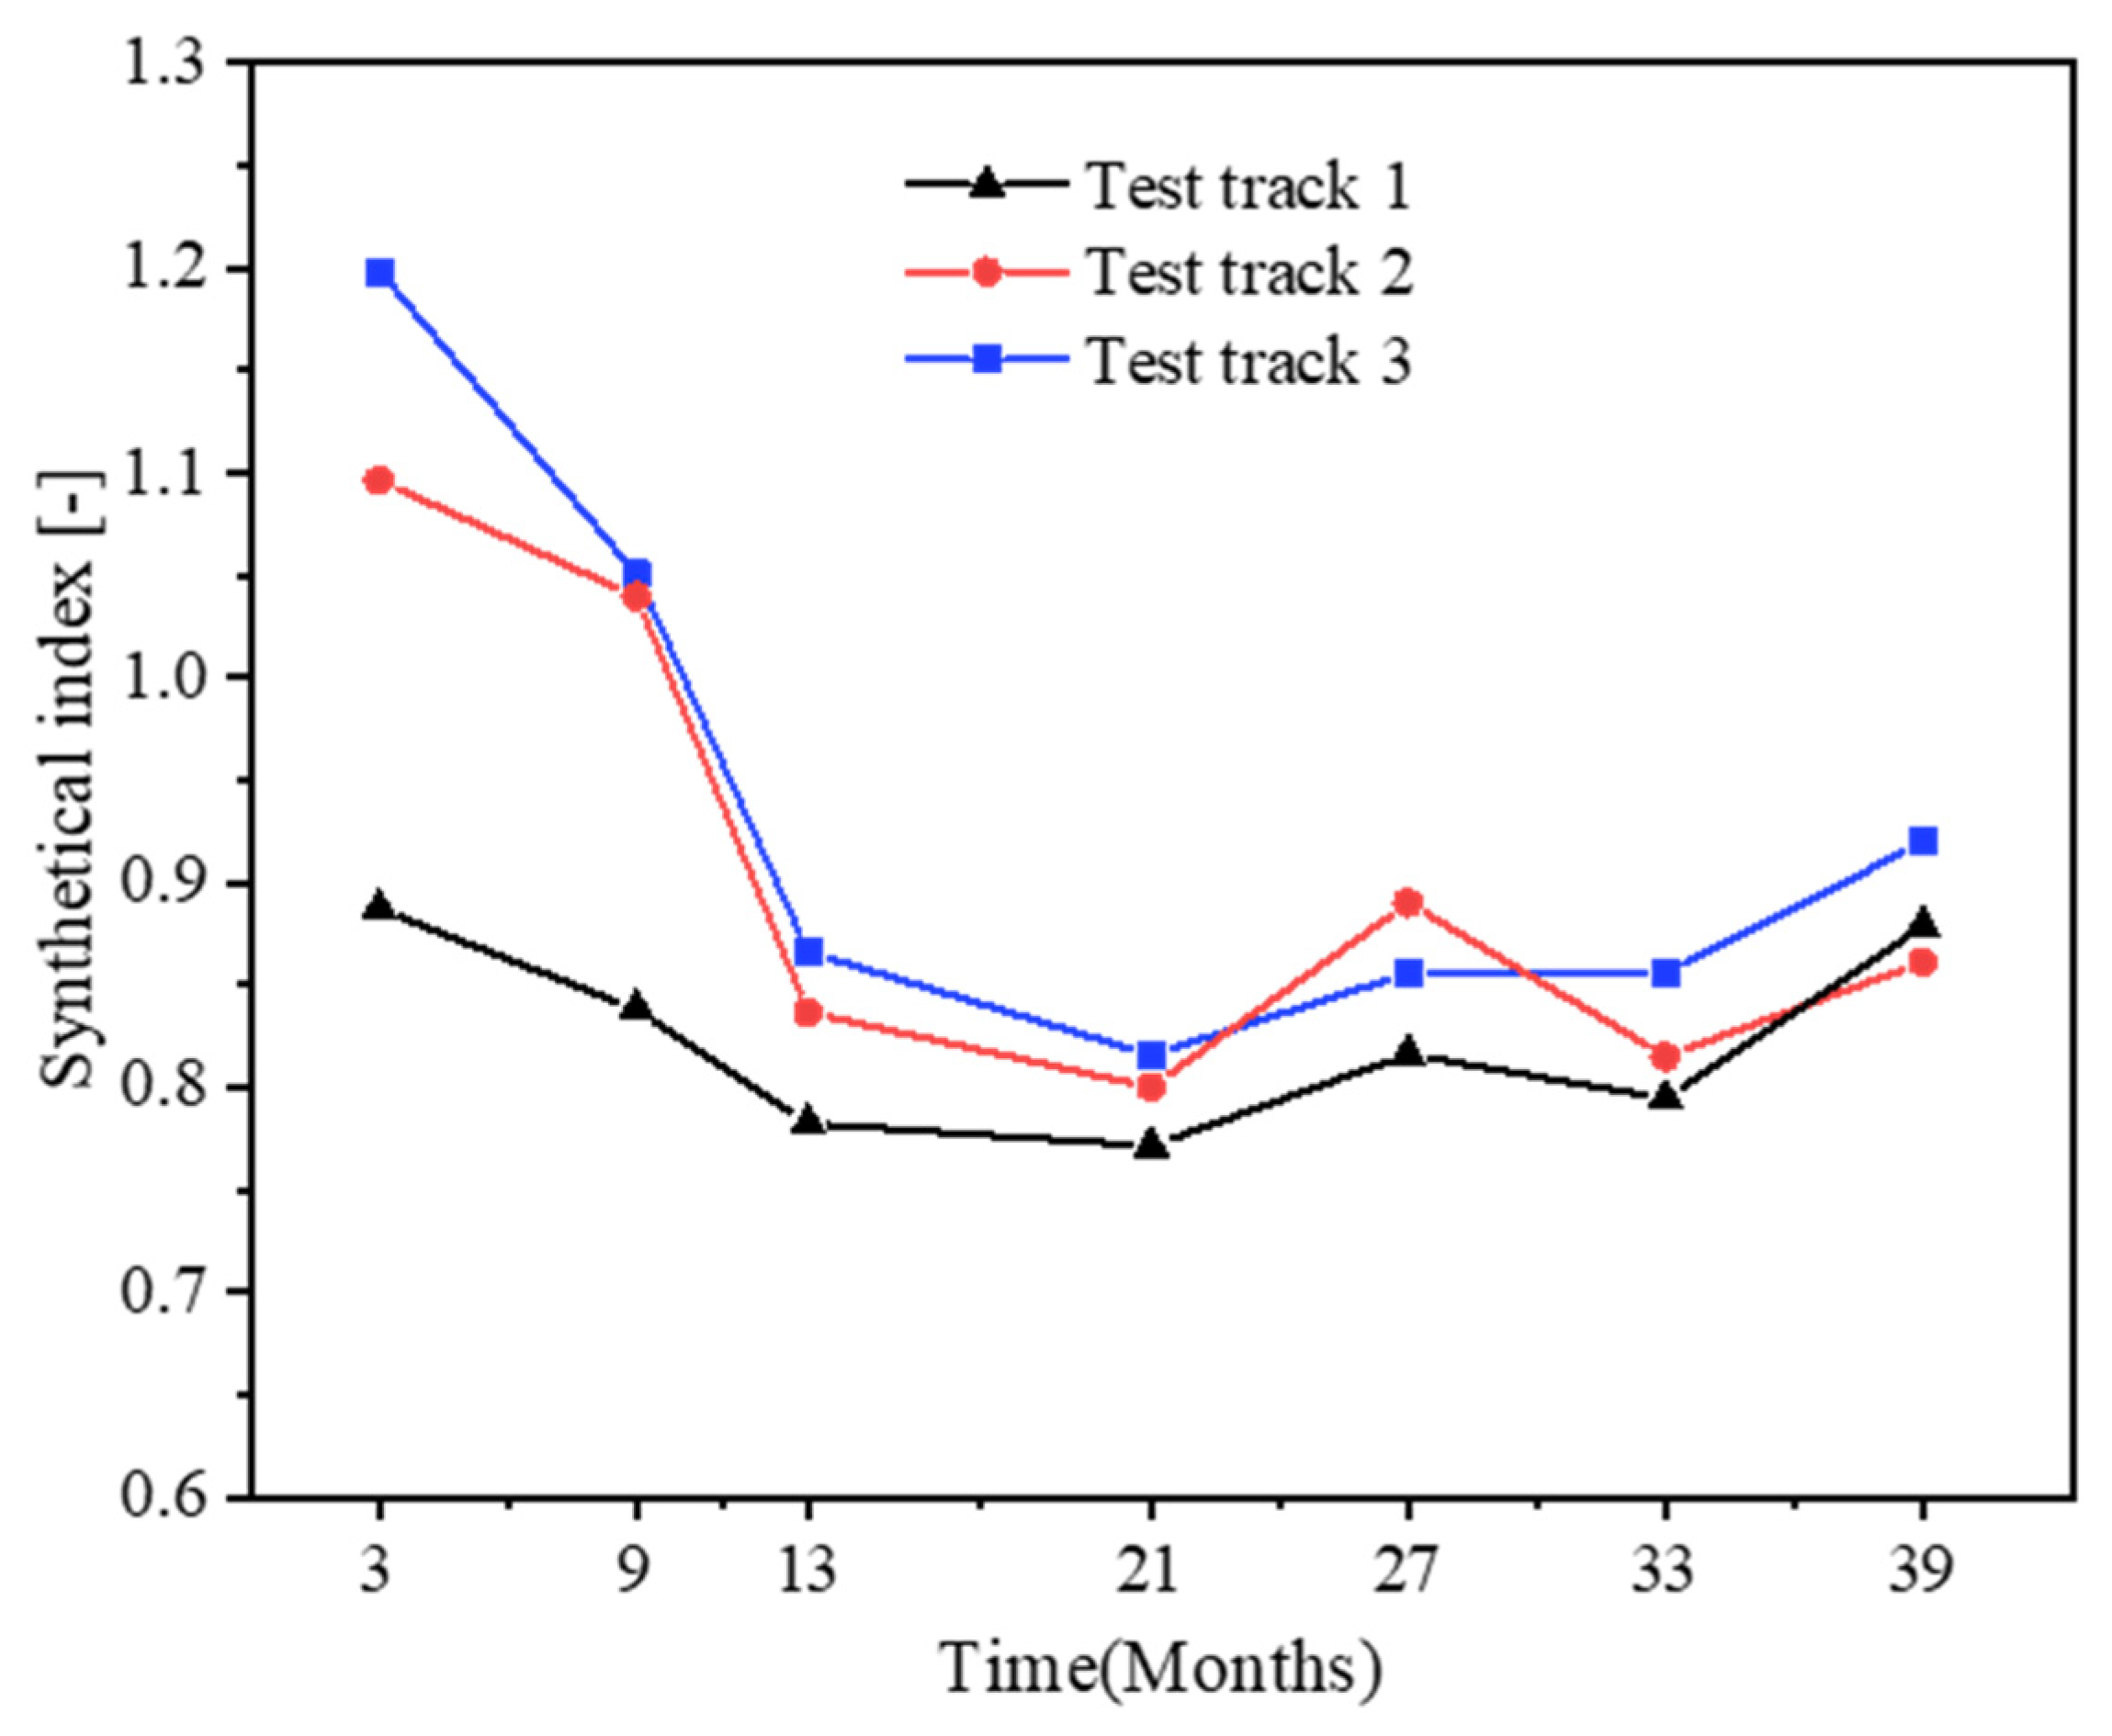
Figure 23.
The calculated synthetical indexes of the test tracks.
Figure 23.
The calculated synthetical indexes of the test tracks.
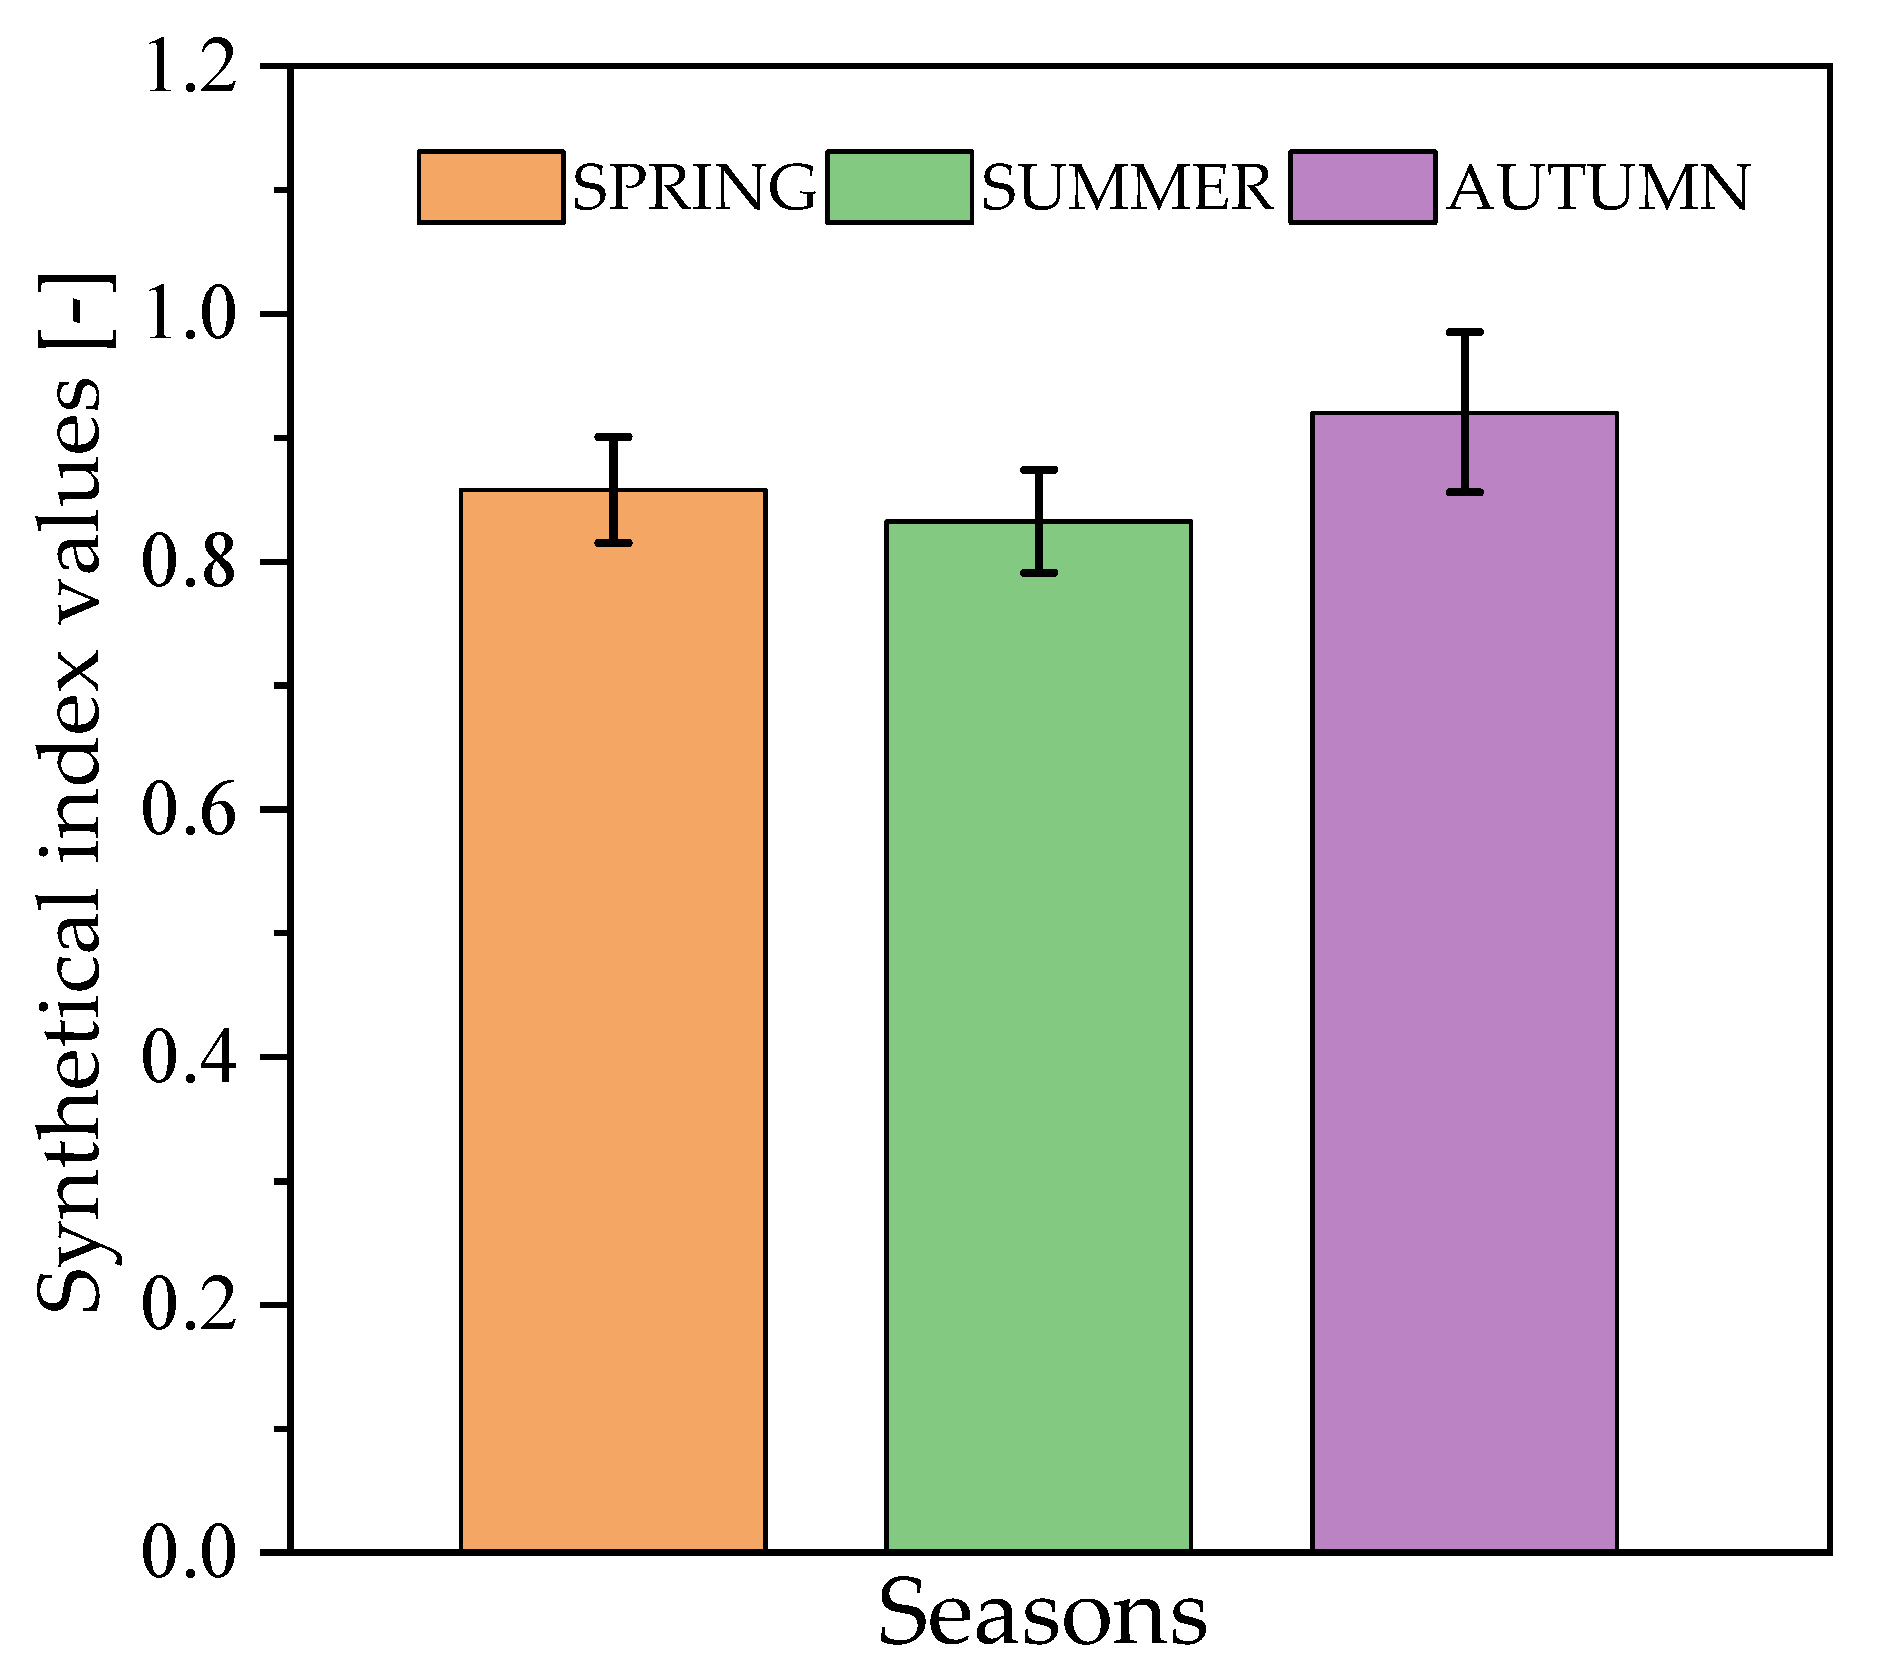
Figure 24.
The calculated synthetical indexes of different seasons.
Figure 24.
The calculated synthetical indexes of different seasons.
Table 1.
The fitting results of the W/S test for the selected aggregates.
Table 1.
The fitting results of the W/S test for the selected aggregates.
| Test Track | Aggregate Type | Fitting Function | R2 |
|---|
| 1 | Rhyolite | | 0.999 |
| 2 | Diabase | | 0.986 |
| 3 | Greywacke | | 0.981 |
Table 2.
The test methods and indexes of the pavement skid resistance.
Table 2.
The test methods and indexes of the pavement skid resistance.
| Test Method | Index | Reference |
|---|
| BPT | BPN | DIN EN 13036-4 |
| MTD | MTD | DIN EN 13036-1 |
| OFM | AM | ASTM E 2380-12 |
| W/S | μW/S | EN12697-49 |
| LFC | LFC | CEN/TS 15901-15 |
Table 3.
The fitting results of the BPN index.
Table 3.
The fitting results of the BPN index.
| Test Track | Logarithmic Fitting | Quadratic Polynomial Fitting |
|---|
| 1 | | |
| R2 = 0.43 | R2 = 0.68 |
| 2 | | |
| R2 = 0.25 | R2 = 0.33 |
| 3 | | |
| R2 = 0.50 | R2 = 0.66 |
Table 4.
The fitting results of the OFT index.
Table 4.
The fitting results of the OFT index.
| Test Track | Logarithmic Fitting | Quadratic Polynomial Fitting |
|---|
| 1 | | |
| R2 = 0.69 | R2 = 0.73 |
| 2 | | |
| R2 = 0.83 | R2 = 0.91 |
| 3 | | |
| R2 = 0.50 | R2 = 0.71 |
Table 5.
The fitting results of the MTD index.
Table 5.
The fitting results of the MTD index.
| Test Track | Logarithmic Fitting | Quadratic Polynomial Fitting |
|---|
| 1 | | |
| R2 = 0.76 | R2 = 0.93 |
| 2 | | |
| R2 = 0.68 | R2 = 0.77 |
| 3 | | |
| R2 = 0.84 | R2 = 0.83 |
Table 6.
The fitting results of the μW/S index.
Table 6.
The fitting results of the μW/S index.
| Test Track | Logarithmic Fitting | Quadratic Polynomial Fitting |
|---|
| 1 | | |
| R2 = 0.55 | R2 = 0.49 |
| 2 | | |
| R2 = 0.50 | R2 = 0.32 |
| 3 | | |
| R2 = 0.84 | R2 = 0.83 |
Table 7.
The fitting results of the LFC index.
Table 7.
The fitting results of the LFC index.
| Test Track | Logarithmic Fitting | Quadratic Polynomial Fitting |
|---|
| 1 | | |
| R2 = 0.89 | R2 = 0.86 |
| 2 | | |
| R2 = 0.30 | R2 = 0.18 |
| 3 | | |
| R2 = 0.43 | R2 = 0.63 |
Table 8.
Analysis of sensitivity factor.
Table 8.
Analysis of sensitivity factor.
| Sensitivity Factor | BPN | OFT | MTD | μW/S | LFC |
|---|
| Aggregate type | 0.686 | 0.003 | 0.063 | 0.186 | 0.543 |
| Load time | 0.051 | 0.176 | 0.020 | 0.905 | 0.312 |
| Season Type | 0.431 | 0.849 | 0.448 * | 0.714 | 0.236 |
Table 9.
Correlation of the between laboratory tests.
Table 9.
Correlation of the between laboratory tests.
| Sensitivity Factor | BPN | OFT | MTD | μW/S |
|---|
| BPN | 1.000 | −0.006 | 0.312 | 0.367 |
| OFT | | 1.000 | −0.848 | −0.590 |
| MTD | | | 1.000 | 0.418 |
| μW/S | | | | 1.000 |


 and
and 


