1. Introduction
The economic surplus method of impact assessment provides a valuable tool for evaluating the returns to agricultural research expenditures [
1,
2]. Early studies implementing this approach used principles of partial equilibrium analysis and welfare economics to quantify the benefits of agricultural research investments made in breeding the high-yielding crop varieties that brought about the Green Revolution [
3,
4]. Subsequent studies found positive and often sizable (>50%) returns to agricultural research expenditures on crop breeding over the following decades [
5,
6,
7]. The economic surplus method remains a standard tool for evaluating agricultural research impacts today, albeit with numerous methodological improvements [
1,
8]. Policy makers use information about the economic returns to agricultural research to allocate scare research funding and resources.
A subset of this literature applies the economic surplus method to agricultural research expenditures on plant breeding for disease resistance [
9,
10,
11]. Breeding for disease resistance offers a pathway to sustainable agricultural intensification, particularly for smallholder crop producers [
12,
13]. Central to this article, the potential avenues for research benefits from disease resistance breeding efforts differ from those for other modern crop varieties. High-yielding varieties, such as those that fueled the Green Revolution, typically sought to increase yields compared to local varieties, by increasing genetic yield potential, often in combination with increased fertilizer, water, and tillage. In contrast, improved resistant varieties (RVs) seek to increase yield productivity compared to traditional varieties (TVs), in cases where the latter is susceptible to pest pressure by providing damage control services. RVs will avert some yield loss in the face of pest pressure compared to TVs due to the embodied resistance traits and may also reduce the need for costly and potentially harmful chemical inputs.
However, challenges to accurately quantifying farm-level research benefits arise because RV adoption often occurs in combination with changes to pest management practices. Suppose pest control options other than genetic resistance are absent or infeasible. In that case, an estimate of the yield difference between RVs and TVs provides a sufficient basis to estimate research returns, as was the case for previous research on RVs bred to combat wheat foliar disease [
9,
11,
14]. In contrast, if RVs substitute for other pest control inputs, such that they reduce the quantities applied (that is, RVs are input-saving in addition to yield-increasing) then two avenues of potential benefits from disease resistance breeding research exist. Impact assessments of agricultural research expenditures to develop RVs must consider the effects of management behavior on input costs and yields. This observation is an extension of Morris and Heisey’s [
15] recommendation to separate the effects of genetic improvements and input management when assessing research returns.
In this article, we propose a unit cost model that controls for differences in farm-level yields and pesticide inputs. Previous approaches will poorly approximate actual benefits if non-RV pest management options exist, because they do not account for farmer pest control behavior. Management behavior is likely to be heterogeneous across producers due to differences in disease pressure or risk aversion, where some producers continue to apply pesticides despite the presence of embodied resistance traits. Ignoring the input-saving dimension of RV adoption altogether may result in underestimating the actual research benefits, on the one hand. In contrast, failure to account for heterogeneity in producer input responses to resistance traits (or lack thereof) may overestimate the actual level of benefits attributable to RVs, on the other. To our knowledge, no previous study has investigated the returns to disease resistance research in a context where detailed survey data on pest control practices are available.
We contribute to the literature on impact assessment and research on estimating the returns to disease-resistant breeding, more specifically, in three ways. First, we develop a conceptual framework for evaluating the returns to RV research, where pest management is an option. Second, we propose a unit variable cost (UVC) model to estimate farm-level differences for RV adopters and non-adopters, with and without disease pressure. Third, we illustrate the model using farm-level survey data from Ecuador to assess the economic impact of RV bean breeding (Phaseolus vulgaris), in a setting where fungicide use is widespread. The approach provides an improved measure of farm-level RV benefits compared to the conventional approach that uses experimental yield data alone, by accounting for heterogeneity in genetic yield potential, averted yield losses, and input cost savings across a sample of actual bean farmer households. We find that RVs in northern Ecuador provide substantial economic benefits at the farm level. The return to RV bean research expenditure is large and competitive with alternative investments. Analyzing yield differences alone overestimates research returns.
2. Returns to Disease Resistance Research When Pest Management Is an Option
The economic surplus approach to impact assessment measures the returns to crop breeding research by comparing the gross annual benefits of newly released crop cultivars to the incremental research costs incurred to develop those cultivars [
1,
2]. Gross annual research benefits equal the increase in economic surplus attributable to the diffusion of new crop cultivars, as determined by partial equilibrium analysis. Incremental research costs include expenses associated with breeding new cultivars (e.g., experimental trials, operating expenses, personnel salaries) that would not have been incurred otherwise. Some incremental costs arise before the release of a new cultivar and it begins to generate benefits. Therefore, assessing the returns to breeding research involves tracking annual net benefits over time, discounting into present values, and computing summary metrics, such as Net Present Value (NPV) or Internal Rate of Return (IRR).
2.1. Gross Annual Research Benefits
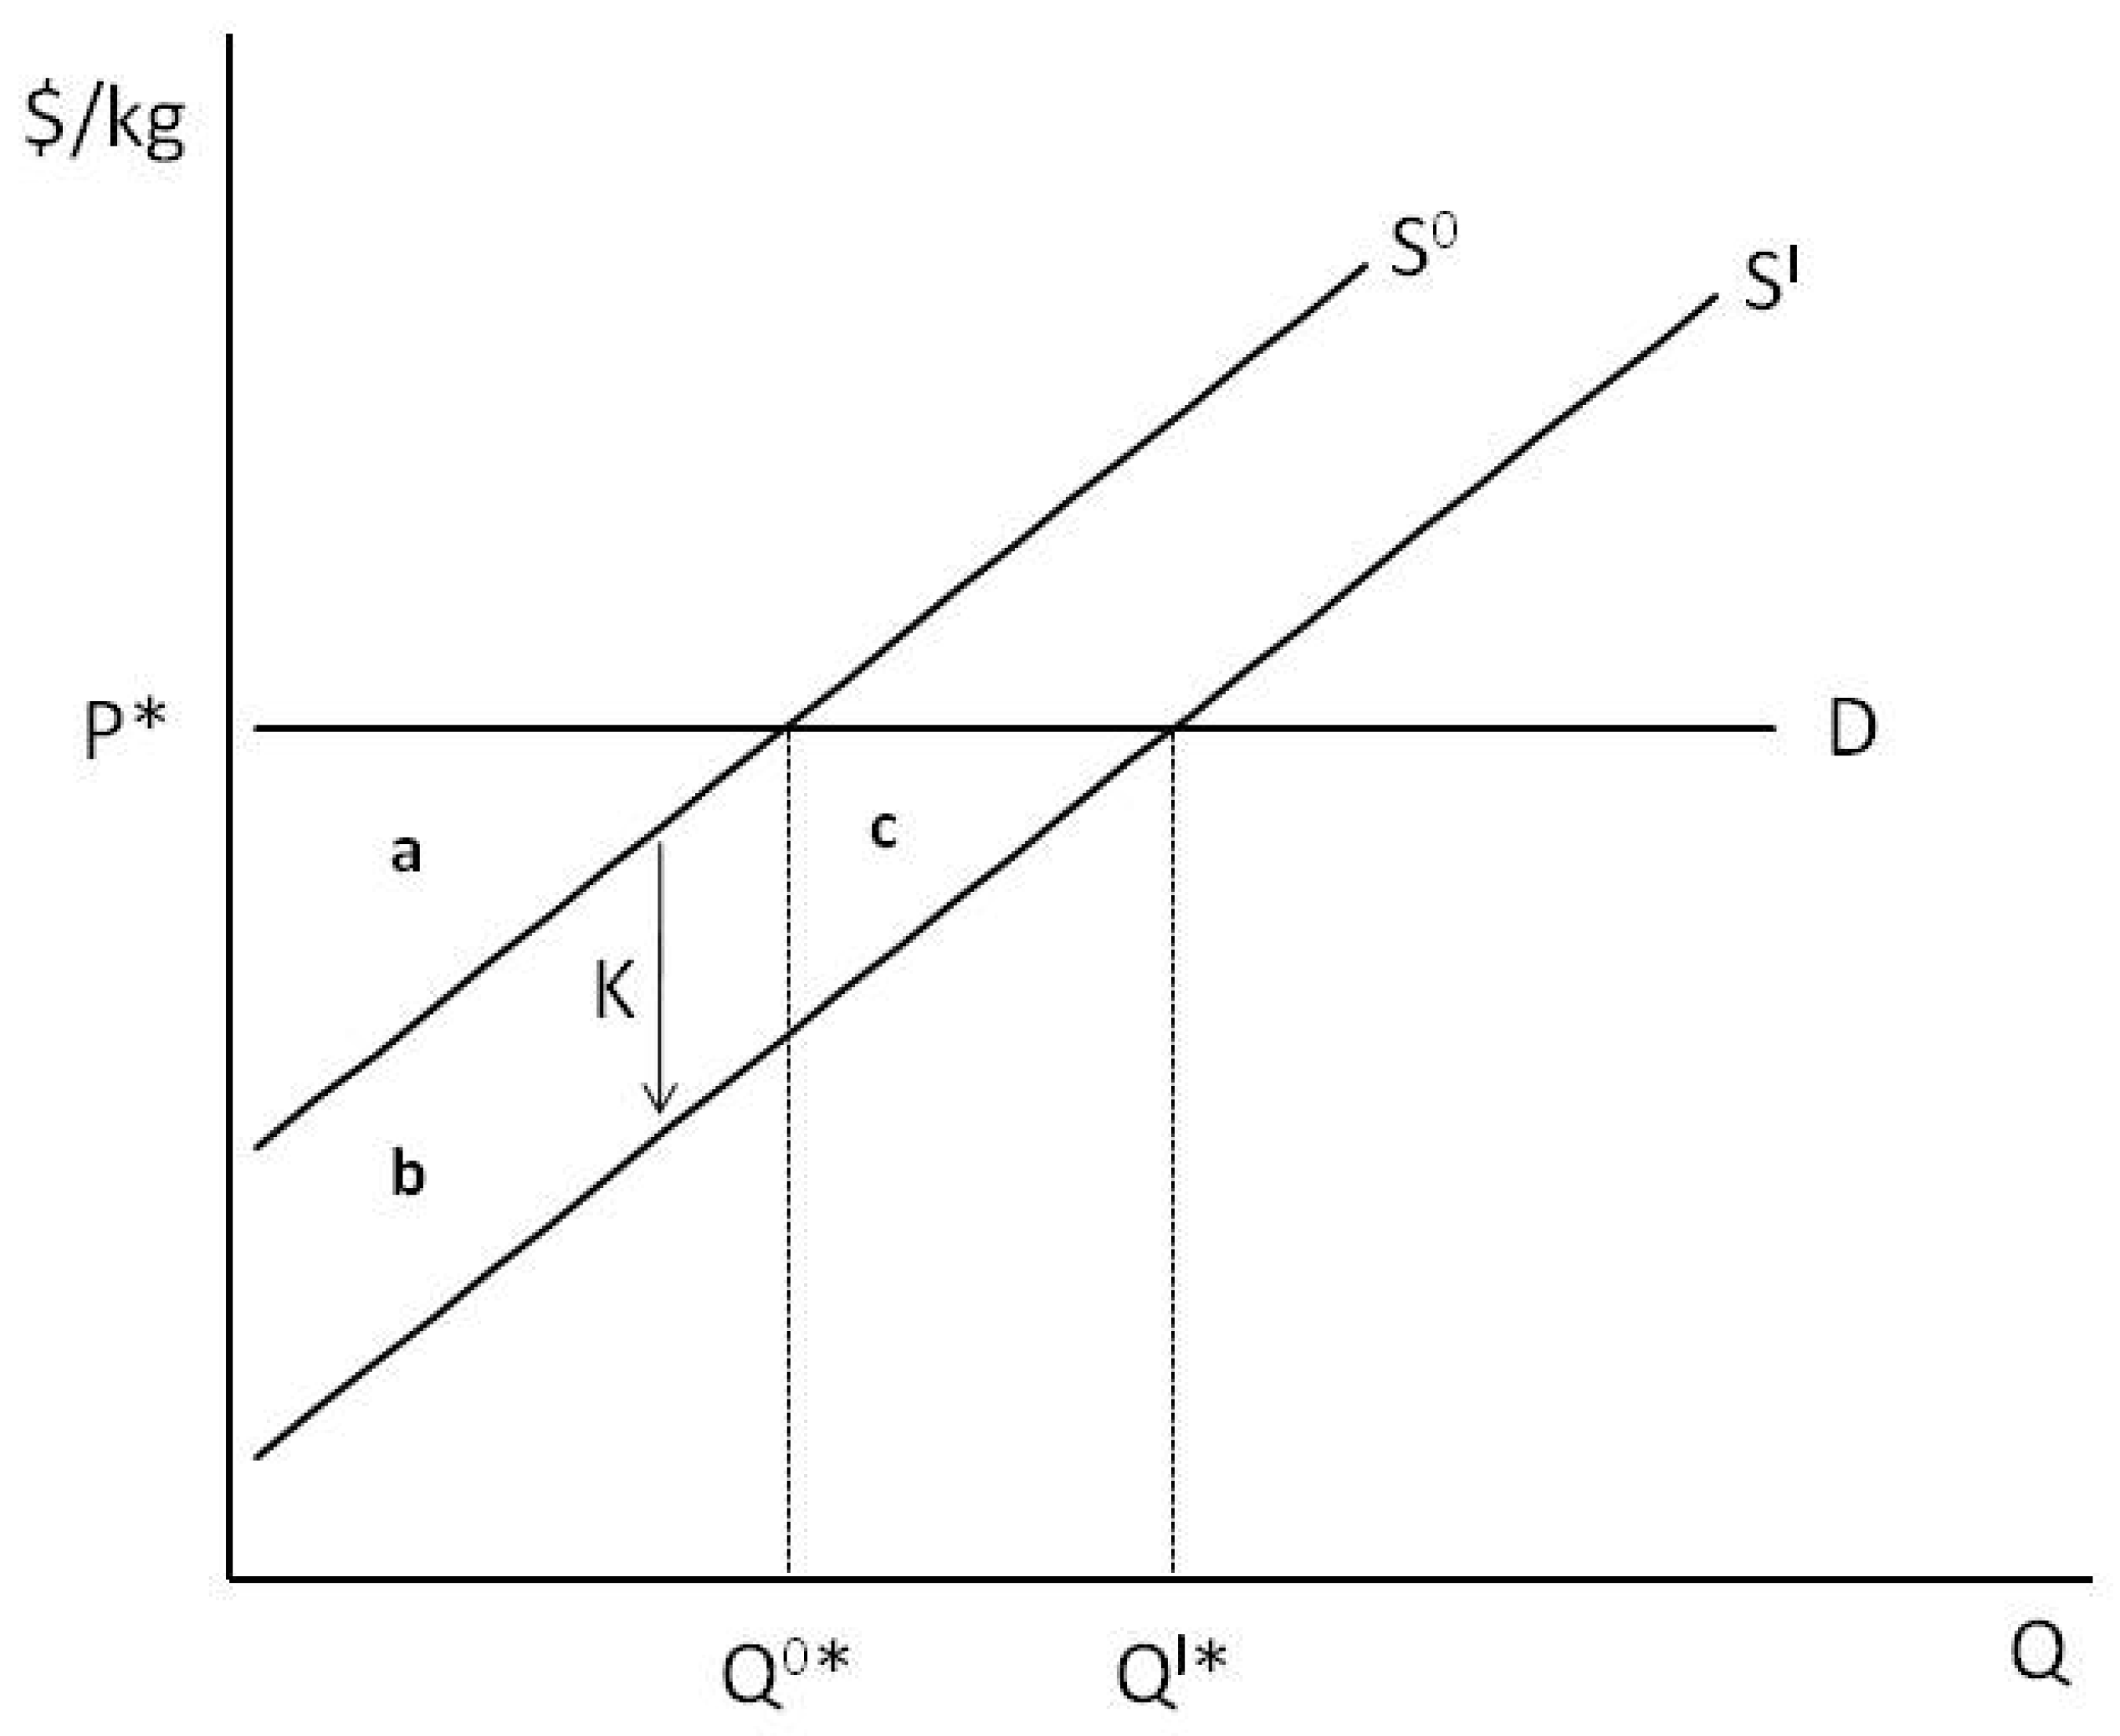
Figure 1 illustrates the gross annual research benefits for a single production cycle in a small open economy. The perfectly elastic demand curve is appropriate for export-oriented agricultural commodities in the context of less developed countries [
1] and we employ it here to match our case study of breeding research in Ecuador in
Section 3, below. Before the release of new cultivars, the market is in equilibrium, with price
and output
. Producers with a marginal cost of production below
realize benefits by selling at a higher price. The sum of these benefits is economic surplus and corresponds to the area above the without-research supply curve
but below
, denoted by area
a. Some producers only supply output at prices above
and do not produce.
Following their release, the diffusion of new cultivars increases productivity, and the supply curve shifts from to . Producers who sold output before can now sell more at a lower unit cost, and some new producers also enter the market, such that output increases from to . The elastic demand curve implies that total economic surplus increases by the area b + c. This increase entirely accrues to producers, with consumers left no better or worse off. In the economic surplus approach to impact assessment, this increase in surplus provides a direct measure of gross annual research benefits. The overall size of these benefits is determined by several factors, including the extent of cultivar diffusion, the price elasticities of supply and demand, and the magnitude of the supply shift parameter K. Whereas impact assessment studies typically draw diffusion and elasticity estimates from secondary sources; measuring K is often of interest to analysts.
2.2. Supply Shift Parameter
The direction of the supply shift in
Figure 1 can be stylistically interpreted as either horizontal or vertical. A horizontal shift implies an increase in output while production costs remain unchanged (e.g., due to the release of a “yield-enhancing” cultivar). In contrast, a vertical shift implies a decrease in production costs while output remains unchanged (e.g., due to the release of an “input-saving” cultivar). These single-factor explanations lend convenient interpretation to
K; however, assessing the returns to disease resistance research, when pest control is an option, requires a careful analytical approach.
Accurate determination of the supply shift parameter K depends on the empirical measure of farm-level RV research benefits used. Most previous impact assessments of crop genetic pest resistance research use experiment data comparing RV yields with those for local susceptible varieties. This approach is appropriate for the case where pest control options other than RVs do not exist or are not used, because the benefit of RV research will exactly equal the yield saved. The assumption implicit in these studies is that pest control costs for RVs and susceptible TVs are zero, or otherwise equal, and constant such that the difference in unit production cost between them offers an unbiased estimate of K.
By comparison, for the more general case, where RVs are used in combination with other pest control inputs, this approach may overestimate farm-level RV research benefits, because yield saved will be a function of both the RV adoption decision and the level of inputs applied. The actual incremental benefits of RV research would, thus, equal some combination of averted input costs and averted yield loss where the latter is less than if no pest control inputs had been available. To obtain an unbiased measure of K for use in an impact assessment, one must know both yields and pest control costs for the with- and without-research scenarios. The overestimate could be significant if a considerable proportion of the cropped area already receives pest control treatment.
2.3. Unit Variable Cost (UVC) Function
Indirect cost and profit functions are commonly used to evaluate the economic implications of emerging crop technologies and management practices [
16,
17]. The
UVC function (where UVC = VC/Y is the dependent variable (USD/kg), VC is variable cost (USD/ha), and Y is yield (kg/ha)) is one approach to integrating averted yield losses and input cost savings into a single measure of farm-level research benefits. Holding plot size fixed, the function is decreasing in total output and increasing in input prices. The approach is also advantageous because it captures tradeoffs between yield maintenance and input cost savings, as faced by real farmer decision makers. In particular, surveys give more accurate information on farm-level benefits than experimental data alone, especially in the frequent case where experiments fail to compare RVs to TVs under active pest management.
To model differences in
UVC for RV adopters and non-adopters, with and without disease pressure, other factors that also potentially influence production costs must be held constant. A conceptual model describing the UVC function follows:
where
W is a vector of input prices,
T is total bean output, and
A,
D,
L,
H, and
Z are covariate matrices representing the RV adoption decision (
A), pest pressure (
D), plot characteristics (
L), farm household characteristics (
H), and community-level fixed factors (
Z), respectively. The inclusion of
A and
D allows us to examine differences in
UVC for RV adopters and non-adopters, with and without disease pressure. The variables in
L and
H control for agronomic factors and cultural management practices that may influence production costs. Variables in
Z control for unobserved factors that differ between communities but remain constant within communities, such as infrastructure and market access.
3. Data and Methods
We use the model to assess the returns to Ecuador’s national bean breeding research program for the Mira and Chota river valleys from 1982 to 2006. While dated, we chose this timeframe based on the availability of unique survey data that includes information on field-level yields, input use, pest and disease pressure, and RV adoption status, in addition to farm and farm household characteristics. Moreover, Ecuador’s experience with breeding for disease resistance in the common bean is representative of efforts on highland food crops throughout the Andean region [
18].
3.1. Study Area Description
Dry bean production in the Mira and Chota river valleys of northern Ecuador historically accounts for over 40% of national production and constitutes the mainstay of household nutrition and cash income for bean-producing households [
19,
20]. Mono-cropped bush bean varieties dominate the area, rather than pole bean varieties that are grown in polyculture and are more typical of Ecuador’s other bean-producing regions. Area bean producers and consumers recognize several dry bean market classes that vary according to grain color, pattern, and size. The two most prominent are the red mottled and purple mottled classes, which have a high demand in export markets due to their popularity in neighboring Colombia.
In the early 1980s, Ecuador’s national agricultural research institute, the Instituto Nacional Autónomo de Investigaciones Agropecuarias (INIAP), initiated a maintenance breeding research program to increase bean productivity in the Mira and Chota valleys. In particular, they bred for resistance to bean rust (
Uromyces appendiculatus) and anthracnose (
Colletotrichum lindemuthianum) diseases, which had been identified as the principal production constraints [
21]. INIAP scientists obtained disease-resistant genetic parent material from the International Center for Tropical Agriculture (CIAT) and implemented trials at national experiment stations to evaluate their performance. Five RVs belonging to the red mottled market class were released from 1986 to 1995 (
Table 1).
3.2. Household Survey
The data come from a 2006 household survey. The population was bush bean-producing households in the Mira and Chota valleys 1200 to 2400 m above sea level. The survey was conducted from October to December 2006 with questions about the January to March production cycle of the same year. The instrument underwent two rounds of pre-testing before the survey, with pre-test participants excluded from the study population. The survey followed a clustered, double-stratified sampling design [
22]. This design provided two practical advantages over a purely random sample. First, village-level clustering was cost-effective given the rugged topography of Ecuador’s northern Andean sierra region. Traveling from village to village saved enumerator time and resources compared to visiting geographically dispersed households selected at random. Second, stratification permitted targeting sub-groups, such as households with previous interaction with INIAP’s breeding program, that are relatively rare in the population.
The first stratification was the degree of previous exposure to INIAP extension interventions. Four villages that hosted INIAP participatory research trials called CIALS, plus eight other villages with prior INIAP bean pest management training were automatically included. An additional 18 villages without prior INIAP intervention were also included and were selected at random from an area frame developed by the survey team. The second stratification occurred within CIAL villages and distinguished households by CIAL membership. In CIAL villages, three CIAL member households and four non-CIAL member households were interviewed. In non-CIAL villages, four households were interviewed. Specific households were selected at random from a list developed by enumerators with village leaders. Whenever this was not possible, households were selected from separate village sectors with households related to community leaders and other survey participants excluded. In total, 132 households from 30 village clusters were interviewed. All households solicited for interviews consented to participation in the study.
3.3. RV Adoption Rates
The survey recorded the bean varieties grown in 2006. The 132 surveyed households grew 26 distinct bush bean varieties from seven market classes, including all five red mottled RVs released by INIAP from 1986 to 2005. To corroborate that households correctly identified the variety planted, survey enumerators obtained visual confirmation by observing saved seed or visiting a bean plot planted from saved seed. Because the sampling design resulted in unequal household selection probabilities, adoption rates representative of the target population were obtained using survey weights following [
22].
Varieties belonging to the red mottled and purple mottled market classes accounted for over 78% of land area cultivated to beans (
Table 2). Among the land area sown to a red mottled variety, 45% was planted with an RV. Similarly, 10% of the land area sown to a purple mottled variety was planted with an RV. It is important to note that red mottled RVs (introduced in 1986) were near the saturation phase of their diffusion process at the time of data collection. In contrast, purple mottled RVs (introduced in 2004) were in the very early stages of diffusion.
Logistic functions are a widely used method of estimating diffusion rates for agricultural technologies, conditional upon the expectation that the S-shaped diffusion pattern holds [
15,
24]. A similarly shaped diffusion pathway is plausible for RVs in Ecuador, given that bean seed is self-pollinating, easily multiplied in producer fields, and frequently exchanged among farm households. To obtain annual estimated adoption rates, we used the transformed logistic expression
where
Ct is the cumulative adoption rate at time
t expressed as a proportion,
Cmax is the adoption ceiling (maximum cumulative adoption rate) also expressed as a proportion, and
and
are parameters to be estimated, respectively. The advantage of this approach is that annual adoption rates over time, i.e., the diffusion pathway, can be obtained using as few as two data points and an assumption of the maximum potential adoption ceiling.
3.4. Empirical Tests for Farm-Level RV Benefits
We estimated an empirical unit cost function that captures heterogeneity in yields and pest control costs among individual producers. This measure is advantageous because it captures the economic benefits of averted yield losses and input cost savings as observed by real farm decision-makers. It is also consistent with the use of fungicide as a damage control input [
25,
26]. Let the unit variable cost (UVC
i) (
$/kg) for household
I be defined as
where
j represents the set production inputs expected to vary with adoption and pest pressure,
xj is quantity of input
j applied (kg a.i. per hectare where a.i. is active ingredient),
wj is input price (
$/kg a.i.), and
Y is bean yield (kg/ha). Applied to the case of northern Ecuadorian dry bean producers who have long used fungicides to control bean rust and anthracnose, the set of inputs expected to vary includes bean seed, fungicide, and insecticide. Insecticides are included because most bean producers apply these inputs jointly with fungicides in a single application. All other inputs such as land preparation, fertilizer, and labor are not expected to vary based on the RV adoption decision and are treated as fixed.
Regression methods allow for differences in UVC for RV adopters and non-adopters to be compared, conditional upon a set of explanatory covariates. The dependent variable is
where
Ai is a binary indicator of RV adoption equal to one if adoption occurs and zero otherwise, UVC
i0 is unit variable cost without RV adoption, and UVC
i1 is unit variable cost with RV adoption. Next, UVC is modeled as a function of adoption status, disease pressure, and other covariates
where
A is as defined,
D is a disease pressure indicator, and
W,
T,
L,
H, and
Z are covariate matrices as defined in Equation (1), and
u is a random error with mean zero. To inform the economic impact assessment, we tested for differences in UVC with and without disease pressure separately for RV adopters and non-adopters. The parameter
β2 captures the difference in UVC with and without disease pressure for non-adopters (i.e., E[UVC|
A = 0,
D = 1]–− E[UVC|
A = 0,
D = 0] =
). Similarly, the linear combination
β2 +
β3 captures the difference in UVC with and without disease pressure for adopters (i.e., E[UVC|
A = 1,
D = 1]–− E[UVC|
A = 1,
D = 0] =
+
). Specifically, we test whether these estimates are different from zero as H1:
β2 = 0 versus
β2 ≠ 0 and H2:
β2 +
β3 = 0 versus
β2 +
β3 ≠ 0, respectively.
The parameter and linear combination + are also of interest and capture the difference in UVC between RV non-adopters and adopters with and without disease pressure, respectively. However, we do not estimate a causal model and cannot attribute differences in UVC to RV adoption alone. In addition to differences in observable covariates between adopters and non-adopters, unobserved factors (e.g., spatial plot distributions) may also affect adoption and unit costs.
3.5. Variable Descriptions
Data used to estimate farm-level RV research benefits are limited to the 73 households who reported planting a red mottled variety and who provided complete input application records.
Table 3 presents descriptive statistics for the dependent and explanatory variables grouped by conceptual categories from Equation (1). Explanatory variables included RV adoption (
A) and disease and insect pest pressure (
D). Information on disease and insect pest pressure was obtained via a survey question asking farmers to compare the level observed in 2006 to an average year. Responses are assigned a value of one if producers indicated 2006 was an above-average year for disease (insect) pressure and zero if they indicated 2006 was an average or below-average year for disease (insect) pressure.
Input price variables (W) include bean seed and fungicide and insecticide active ingredient. Fungicide and insecticide prices are calculated as input cost divided by the kilogram weight equivalent of active ingredients applied. Mean difference test results indicate that RV adopters paid less, on average, per kilogram of fungicide active ingredient and bean seed than did non-adopters. One explanation for why seed bought by RV adopters cost less is that some local, susceptible varieties are scarce but in high local demand due to local taste preferences. The output variable (T) is calculated as kilograms of bean produced per unit of land area.
Plot characteristics (L) control for plot size, altitude, soil type, and tenure arrangement. An increase in plot size holding output fixed may decrease unit costs due to economies of scale or reduced input intensity in larger fields. Altitude is correlated with precipitation, such that producers at higher altitudes may have lower unit costs from increased soil humidity. Land tenure variables indicate whether the plot is sharecropped or rented as opposed to owned. The only significant difference among plot characteristics is that a greater proportion of non-adopters have plots with a loam soil texture than a non-loam (e.g., clay or sandy soil) soil texture.
Household characteristics (F) include age of the household head and previous attendance at a pest management seminar, two observable factors that proxy for pest control management ability. Finally, community-level factors (Z) control for relative location within the study area and previous INIAP extension intervention within the community. Both locations in the Chota, as opposed to Mira, valley and exposure to INIAP extension may indicate improved access to information about RV performance.
3.6. Impact Assessment Analytical Framework
We next integrated the unit cost function into the established analytical framework for impact assessment of agricultural research. The diffusion of new crop varieties generally follows an S-shaped pattern. This observation was first recognized in early adoption analyses of hybrid corn [
27,
28]. The S-shaped pattern arises due to low but increasing initial adoption levels, followed by more rapid adoption as information about the technology spreads, and ending with a period of slowed adoption as the technology reaches its maximum level of acceptance. The logistic function expresses diffusion as:
where
Ct is the cumulative adoption rate at time
t expressed as a proportion,
Cmax is the adoption ceiling (maximum cumulative adoption rate) also expressed as a proportion, and
and γ are parameters that describe the intercept and curvature, respectively. A similarly shaped diffusion pathway is plausible for RVs in Ecuador, given that bean seed is self-pollinating, easily multiplied in producer fields, and frequently exchanged.
The incremental change in economic surplus following RV adoption for a small open economy (area b + c in
Figure 1) is given by
where Δ
ESt is the change in economic surplus observed at time
t,
P is the exogenous market price (USD/kg),
Q is beans produced (metric tons),
ε is the supply elasticity of demand (unitless), and
Kt represents the downward shift in the supply curve that results from RV adoption (USD/kg) [
1]. Furthermore, we define the time-path
Kt as
where Δ
UCt is the proportional change in farm-level unit costs,
It is the proportion of bean area afflicted by disease infestation, and
Ct is cumulative adoption in year
t.
The small open economy model is appropriate for the bean subsector in northern Ecuador, given the export-oriented nature and the relatively small quantity produced. For example, Ecuador exported to Colombia a total of 11,500 metric tons in 1998, or approximately 8% of Colombia’s total annual dry bean consumption [
29]. By comparison, total bean production in Ecuador’s Imbabura and Carchi provinces during this same year was only 5400 metric tons [
23]. Summary indicators of overall economic impact including NPV and IRR are calculated by comparing the increase in economic surplus with the proper research and outreach expenditures.
4. Results and Discussion
We report results in three sections, first focusing on the UVC regression results and implications for the farm-level benefits of RV adoption. Second, we report on the bean cultivar adoption survey and estimation of RV diffusion pathways. Finally, we calculate and discuss the estimated returns to Ecuador’s maintenance breeding research program.
4.1. Farm-Level Benefits
Farm-level differences between RV adopters and non-adopters are estimated using the UVC model in Equation (5) and covariates in
Table 3. The model is specified using a log–log functional form and coefficients are interpreted as elasticities. We selected the form based on a MacKinnon, White, and Davidson test that rejected the linear model in favor of the log–log model but not vice versa. A Bruesch–Pagan test for heteroskedasticity is not rejected at conventional levels (Chi-square statistic 1.89,
p-value 0.1693) and the regression results in
Table 4 are estimated using OLS. The results for the model with all respondents (N = 73) indicate that many factors influence UVC. The signs on adoption and disease pressure are positive, suggesting that these factors may increase UVC, although neither are significantly different from zero. For non-adopters, we do not observe significant differences in UVC, with and without disease pressure, and fail to reject H1:
(F-statistic 0.51,
p-value 0.48). A likely explanation is the tendency for producers to control for pests on a prophylactic or calendar basis, rather than in response to observed pest pressure.
In contrast, we found a significant difference in UVC, with and without disease pressure, for RV adopters and reject H2: (F-statistic 4.00, p-value 0.05). Combining the coefficients on disease pressure and RV adoption × disease pressure implies that RV adopters have 29% lower UVC when faced with disease pressure than without. As expected for a cost function, UVC is increasing in fungicide and seed price and decreasing in output when holding plot size is fixed. Given that the model controls for disease pressure, altitude likely serves as a proxy for the effect of precipitation. Communities exposed to prior INIAP extension also had lower UVC, on average, than did communities without prior extension. This may be a result of improved pest management practices due to INIAP intervention, or it may simply capture unobserved differences between communities visited and not visited by INIAP extension personnel.
The statistical significance of the regression coefficients is robust to estimation with heteroskedastic standard errors (results not shown). As indicated by the results in the final two columns of
Table 4, the results are also robust to the removal of influential observations, as identified using the Cook’s Distance statistic. In this later model, the positive coefficient on RV adoption without disease pressure becomes positive. The difference in UVC with and without disease pressure for RV adopters also declines, from 29% to 11%.
4.2. Ex-post Research Returns
Assessment of ex-post returns to RV research expenditures for the 25-year period from 1982 to 2006 includes a four-year lag (1982–1985), during which research costs were incurred but no benefits realized. Values for
Pt,
Qt, and
Ct are obtained from available data sources. Prices from 2000 to 2005 are from the wholesale market in Ibarra, located 30 km from the survey area [
30]. The USD 0.60/kg price represents the average price for the red mottled market class over this period, after adjusting for inflation, and a 20% mark-up by wholesalers. Production totals for the provinces of Carchi and Imbabura are from 1990 to 2005 [
23]. Production in prior years is assumed to equal the average production during 1990–1995, based on the experience of INIAP in the region. When estimating
Ct, we assume that the adoption rate is 45% in the year of the household survey (2006) (
Table 2) and 1% in its year of release (1986). Predicted adoption rates along the diffusion path are calculated using regression estimates for
and γ. This method ensures a lower-bound estimate of RV diffusion by restricting cumulative adoption to be increasing for all years [
1].
Expenditure records from 1982 to 1998 provided information to determine INIAP’s incremental research costs, attributable to the development and maintenance of disease-resistant bean cultivars. As described in [
31], input from senior INIAP staff allowed for a decomposition of these records into expenditure shares for operating costs and human resource costs (i.e., plant-breeders and support staff). We allocated 60% of INIAP’s total annual bean research expenditures to the RV breeding program and 40% to 80% of bean breeder and technical assistant salaries. These expenditures include financial support provided by CIAT for INIAP’s adaptive breeding program from 1990 to 1998.
Due to variability and uncertainty in the remaining impact assessment parameters, sensitivity analysis was conducted for a range of possible values. As reported in
Table 5, the baseline scenario represents the most likely parameter values. By contrast, parameter values used in the conservative and robust scenarios provide lower- and upper-bound return estimates, respectively. The baseline value for Δ
UC is set equal to the proportional reduction in UVC from
Table 4, multiplied by the proportion of total production costs, represented by seed, fungicide, and insecticide inputs. Previous research in the Mira and Chota valley indicates that these three cost components represent 46% of total bean production costs [
20].
Conservative and optimistic Δ
UC values are determined by setting Δ
UC at ±2 percentage points from the baseline value. Baseline values for discount rate,
r, and price elasticity of supply,
ε, are taken from the literature. The baseline value for
r is equal to that used by [
10,
11], who also evaluated ex-post returns to crop genetic pest resistance research. Baseline
ε is identical to [
10], who utilized the small open economy framework to assess bean RV research returns in Honduras. Baseline disease infestation incidence
I is determined by averaging the share of farmers who reported disease pressure from both bean rust and anthracnose (0.43) with the share who reported at least one of the diseases (0.89). Net annual research benefits for the baseline scenario are summarized in
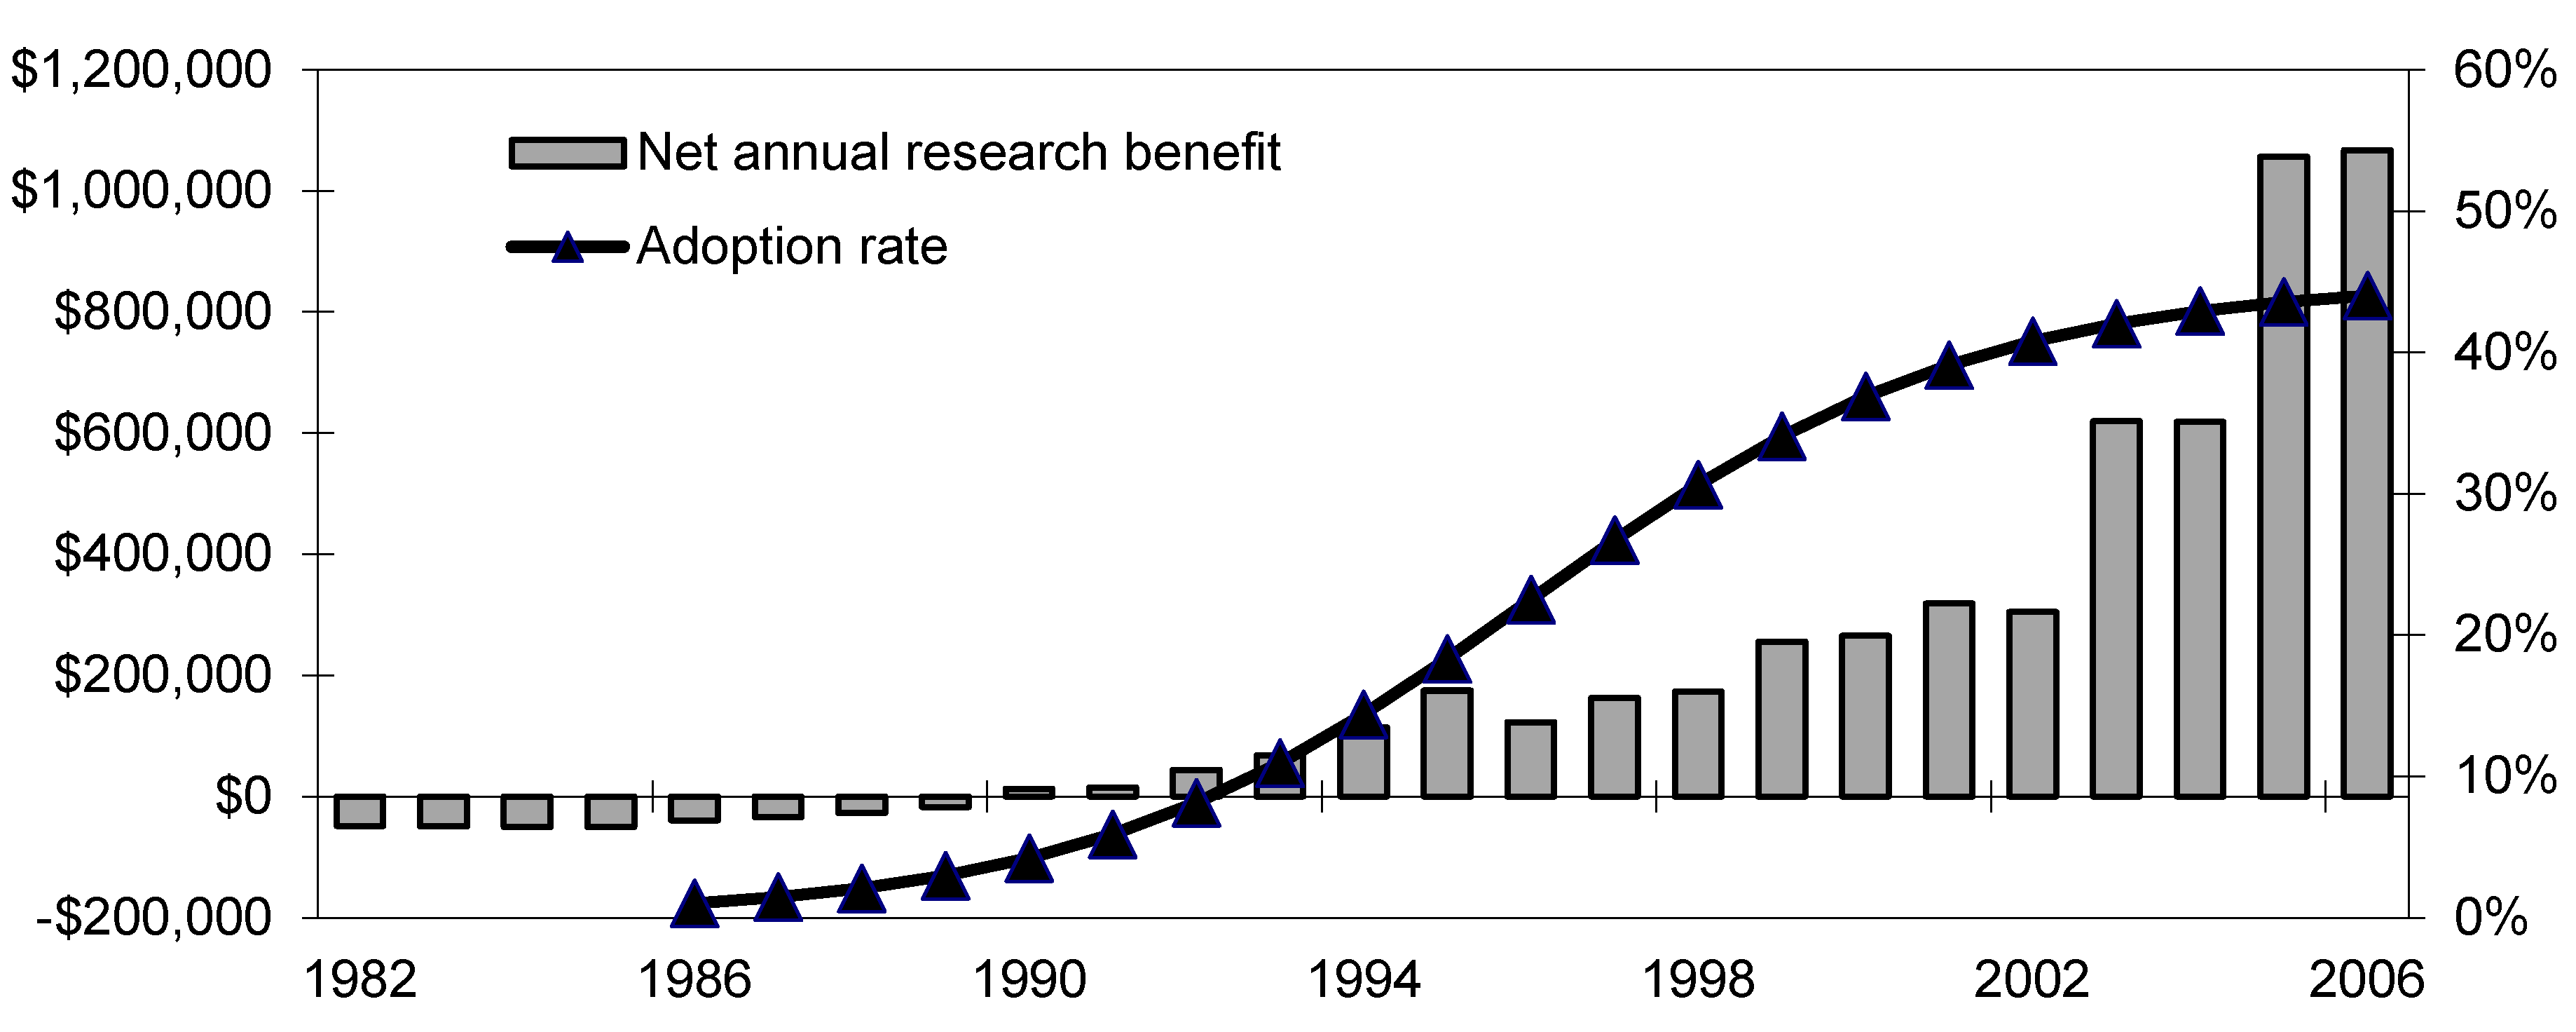
Figure 2.
We found that red mottled RV research for 1982 to 2006 provided a rate of return above the assumed real opportunity cost of capital of 8%. Baseline impact assessment results revealed an ex-post IRR of 17% and a payback period of 9 years. Results from the conservative and robust scenarios range in IRR values from 11% to 23%. Likewise, we found an NPV of USD 698,828, in constant dollar value, with a range from USD 38,357 to USD 2.16 million for the conservative and robust scenarios, respectively. A further consideration is that the evaluation period extends from 1982 to 2006, with no assumption regarding a continuation of benefits. Some decline in the area planted to red mottled RVs (i.e., dis-adoption) may occur as RVs for competing market classes are developed [
32]. Nevertheless, the stream of positive research benefits should continue for several years, making these estimates a lower bound on the ultimate cumulative returns to the research expenditures on RV red mottled beans.
4.3. Comparison to Unaccounted Pest Control Costs
These results from the field study of RV bean adoption in northern Ecuador provide pest control cost information that can be used to test the effect of omitting such information on the calculated return to RV bean research. We conducted a second ex-post impact assessment, using conventional methods for calculating returns to research with experimental data. Instead of estimating
K as in Equation (8), we used yield data alone. Mazon and Peralta [
33] reported a controlled experiment that compared the RV ‘Yunguilla’ with the local ‘Calima’ variety. The yield for Yunguilla was 1936 kg/ha, whereas Calima yielded 1598 kg/ha. On a proportional basis, the RV yield was 19% higher than the yield for the local susceptible variety.
The alternative time path for
K using experimental yield data is
where Δ
yt is the proportional yield difference between RVs and TVs from experimental data (0.19), and
ε,
It and
Ct are as previously defined and take on baseline values. By comparison with Equation (8), this formula for
K does not account for changes in input costs. Instead, it converts the difference in yield into a unit cost estimate by dividing by the supply elasticity of demand [
2]. Using this measure for
K in an analogous ex-ante impact assessment of red mottled RVs, we find an IRR of 29% and an NPV of USD 887,391. This IRR value is 12 percentage points higher in terms of IRR and nearly USD 200,000 higher in terms of NPV than the original baseline estimate that used the unit cost approach to measuring
K.
5. Summary and Conclusions
Economic impact assessments provide a tool to measure payoffs from alternative public investments that is comparable across disparate technologies. In particular, a subset of this economic impact assessment literature focuses on the returns to crop genetic pest resistance research. This article presents an analytical model for assessing the returns to crop genetic pest resistance research, where pest control is feasible. Most previous impact assessments of crop genetic pest resistance research have estimated the farm-level benefits of RV research based on experimental yield data alone. While appropriate in a setting where pest control costs are zero, or otherwise assumed equal and constant, such an approach may inadequately estimate RV research benefits when pest control is feasible and control costs are non-zero. Therefore, we proposed unit variable cost (UVC) as an alternative metric to evaluate farm-level RV research benefits, as it accounts for averted yield loss and input cost savings.
The results have important implications along conceptual and applied dimensions. First, ignoring farm-level pest management practices can bias estimates of returns to research. The UVC approach offers an approach to reduce this bias, relative to disregarding changes in management practices altogether. Resistance to pests and diseases represents a critical crop genetic improvement. Where no cost-effective pest management tools are available, as was the case with wheat rust in many parts of the world in the 1950s and 1960s, the gains from genetic research can be measured as the economic surplus due to yield improvement. However, when farmers employ chemical or mechanical pest management methods, they already capture some of the yield gains from pest control. The value of benefits is a weighted combination of averted pest control costs and incremental yield gains over what is possible without genetic improvements. The UVC13pproachch presented here integrates these elements into a single measure compatible with economic surplus calculations. Comparing ex-post returns to red mottled RV bean research in northern Ecuador using yield alone versus unit costs illustrates the potential overestimation that can result from ignoring farmers’ yield protection through non-genetic means.
The findings also demonstrate the value of INIAP’s bean research and outreach program contributions to sustainable agricultural intensification. We illustrated the model using farm-level survey data from Ecuador to assess the returns to RV bean breeding research and outreach, in a setting where fungicide use for disease control is widespread. We found that bean RVs in northern Ecuador provide substantial economic benefits at the farm level. The return to expenditures on INIAP’s bean research and outreach program in northern Ecuador is large and competitive with alternative investments. The most immediate implications regard INIAP’s bean research and outreach program. The IRR of 13% for red mottled RV beans places Ecuador’s breeding program within the range of comparable estimates from national and multi-national wheat disease-resistance breeding programs. For instance, [
11] assessed investments in wheat RV research in Mexico from 1970–1990 and estimated an economic return of 13–40%. In a multi-country impact assessment of wheat RV research, [
9] found an IRR of 41% from 1973 to 1990. The exception is [
14] who reported a much larger IRR of 80% for wheat breeding in Nepal from 1960 to 1990.
Finally, the potential for INIAP’s bean research and outreach program to contribute to other development goals also deserves consideration. First, consider health and environmental sustainability. Pesticides in the Mira and Chota valleys, including fungicides to reduce the level and severity of bean diseases, are traditionally applied on a prophylactic calendar spray basis, often with little to no protective clothing and without regard for observed pest infestation levels [
21,
34]. Significant health risk externalities posed by these agricultural chemicals are well documented in the region [
35]. While the sample size in this study precluded epidemiological conclusions about the effect of RVs on the incidence of acute pesticide-related illness, averted illnesses constitute another unmeasured benefit from the research and diffusion of RV beans. Second, and more recently, breeding programs in the Andean region have incorporated farmer participatory methods into their breeding programs to improve local acceptance, and future research could evaluate the economic impact of participatory breeding efforts [
36,
37]. Last, in a region with high indices of rural poverty, bean production contributes meaningfully to income. With poverty rates as high as 78% [
38], reductions in bean production costs will contribute to poverty reduction. While a formal treatment of such impacts on poverty lies beyond the scope of this article, others have analyzed this issue elsewhere with similar conclusions [
39,
40].
Author Contributions
Conceptualization, D.F.M., S.M.S., C.S. and E.P.; Investigation, D.F.M., S.M.S., C.S. and E.P.; Methodology, D.F.M., S.M.S., C.S. and E.P.; Writing—original draft, D.F.M., S.M.S., C.S. and E.P.; Writing—revised draft, D.F.M. All authors have read and agreed to the published version of the manuscript.
Funding
Research funding for the original data collection was provided by the U.S. Agency for International Development Bean-Cowpea Collaborative Support Project. Additional research support was provided by the USDA National Institute of Food and Agriculture and Michigan AgBioResearch.
Institutional Review Board Statement
The original data collection was conducted according to the guidelines of the Declaration of Helsinki and approved by the Institutional Review Board of Michigan State University.
Informed Consent Statement
Informed consent was obtained from all study subjects.
Data Availability Statement
Research cost data available from [
31].
Conflicts of Interest
The authors declare no conflict of interest.
References
- Alston, J.; Norton, G.; Pardey, P. Science Under Scarcity: Principles and Practice for Agricultural Research Evaluation and Priority Setting; CAB International: Wallingford, UK, 1998; p. 624. [Google Scholar]
- Masters, W.; Coulibaly, B.; Sanogo, D.; Sidibé, M.; Williams, A. The Economic Impact of Agricultural Research: A Practical Guide; Department of Agricultural Economics, Purdue University: West Lafayette, IN, USA, 1996. [Google Scholar]
- Akino, M.; Hayami, Y. Efficiency and Equity in Public Research: Rice Breeding in Japan’s Economic Development. Am. J. Agric. Econ. 1975, 57, 1–10. [Google Scholar] [CrossRef]
- Evenson, R.; Waggoner, P.; Ruttan, V. Economic Benefits from Research: An Example from Agriculture. Science 1979, 205, 1101–1107. [Google Scholar] [CrossRef] [PubMed]
- Alston, J.; Marra, M.; Pardey, P.; Wyatt, T. Research returns redux: A meta-analysis of the returns to agricultural R&D. Austr. J. Agric. Res. Econ. 2000, 44, 185–215. [Google Scholar]
- Evenson, R. Economic impacts of agricultural research and extension. In Handbook of Agricultural Economics; Gardner, B., Rauser, G., Eds.; Elsevier North-Holland: Amsterdam, The Netherland, 2001; Volume 1, pp. 573–628. [Google Scholar]
- Evenson, R.; Gollin, D. (Eds.) Crop Variety Improvement and Its Effect on Productivity: The Impact of International Agricultural Research; CABI Publishing: Wallingford, UK, 2003; p. 522. [Google Scholar]
- Norton, G.W.; Davis, J.S. Evaluating Returns to Agricultual Research. Am. J. Agric. Econ. 1981, 63, 685–699. [Google Scholar] [CrossRef]
- Marasas, C.; Smale, M.; Singh, R. The Economic Impact of Productivity Maintenance Research: Breeding for Leaf Rust Resistance in Modern Wheat. Agric. Econ. 2003, 29, 253–263. [Google Scholar] [CrossRef]
- Mather, D.; Bernsten, R.; Rosas, J.; Viana Ruano, A.; Escoto, D. The economic impact of bean disease resistant research in Honduras. Agric. Econ. 2003, 29, 343–352. [Google Scholar] [CrossRef]
- Smale, M.; Singh, R.; Sayre, K.; Pingali, P.; Rajaram, S.; Dubin, H. Estimating the economic impact of breeding nonspecific resistance to leaf rust in modern bread wheats. Plant Dis. 1998, 82, 1055–1061. [Google Scholar] [CrossRef]
- Food and Agriculture Organization. Save and Grow: A Policymaker’s Guide to the Sustainable Intensification of Smallholder Crop Production; Food and Agriculture Organization, United Nations: Rome, Italy, 2011. [Google Scholar]
- Peterson, B.; Snapp, S. What is sustainable intensification? Views from experts. Land Use Policy 2015, 46, 1–10. [Google Scholar] [CrossRef]
- Morris, M.; Dubin, H.; Pokhrel, T. Returns to wheat breeding research in Nepal. Agric. Econ. 1994, 10, 269–282. [Google Scholar] [CrossRef]
- Morris, M.; Heisey, P. Estimating the benefits of plant breeding research: Methodological issues and practical challenges. Agric. Econ. 2003, 29, 241–252. [Google Scholar] [CrossRef]
- Antle, J.; Pingali, P. Pesticides, productivity, and farmer health: A Philippine case study. Am. J. Agric. Econ. 1994, 76, 418–430. [Google Scholar] [CrossRef]
- Fernandez-Cornejo, J. Environmental and economic consequences of technology adoption: IPM in viticulture. Agric. Econ. 1998, 18, 145–155. [Google Scholar] [CrossRef] [Green Version]
- Lindhout, P.; Danial, D.; Parlevliet, J. Introduction: Focusing on breeding for durable disease resistance of the Andean highland food crops. Euphytica 2007, 153, 283–285. [Google Scholar] [CrossRef]
- Instituto Nacional de Estadística y Censos (INEC). III Censo Nacional Agropecuario; El Instituto Nacional de Estadística y Censos: Quito, Ecuador, 2001. [Google Scholar]
- Peralta, E.; Barrera, V.; Unda, J.; Guala, M.; Tacan, M. Estudio de la Producción, Poscosecha, Mercadeo y Consumo de Fréjol Arbustivo en el Valle del Chota; Publicación Miscelánea, Instituto Nacional Autónomo de Investigaciones Agropecuarias, Estación Experimental Santa Catalina, Programa Nacional de Leguminosas y Granos Andinos: Quito, Ecuador, 2001. [Google Scholar]
- Peralta, E. Subproyecto 6: Control Integrado de Plagas; Informe Técnico, Proyecto Frijol de la Zona Andina, Instituto Nacional Autónomo de Investigaciones Agropecuarias, Estación Experimental Santa Catalina, Programa Nacional de Leguminosas y Granos Andinos: Quito, Ecuador, 1991. [Google Scholar]
- Deaton, A. The Analysis of Household Surveys: A Microeconometric Approach to Development Policy; World Bank: Washington, DC, USA, 1997; p. 488. [Google Scholar]
- Servicio de Información y Censo Agropecuario (SICA). Superficie, Producción, Rendimiento Frejol Seco 1990–2005. Statistical Bulletin; Servicio de Información y Censo Agropecuario, Ministerio de Agricultura, Ganadería, Acuacultura y Pesca del Ecuador: Quito, Ecuador, 2007. [Google Scholar]
- Sunding, D.; Zilberman, D. The Agricultural Innovation Process: Research and Technology Adoption in a Changing Agricultural Industry. In Handbook of Agricultural and Resource Economics, Part 1; Gardner, B., Rausser, G., Eds.; Elsevier North-Holland: Amsterdam, The Netherland, 2001; Volume 1, pp. 207–261. [Google Scholar]
- Fox, G.; Weersink, A. Damage control and increasing returns. Am. J. Agric. Econ. 1995, 77, 33–39. [Google Scholar] [CrossRef]
- Lichtenberg, E.; Zilberman, D. The econometrics of damage control: Why specification matters. Am. J. Agric. Econ. 1986, 68, 261–273. [Google Scholar] [CrossRef]
- Griliches, Z. Hybrid Corn: An Exploration in the Economics of Technological Change.Econometrica. J. Econom. Soc. 1957, 25, 501–522. [Google Scholar] [CrossRef] [Green Version]
- Rogers, E.M. Diffusion of Innovations; Free Press of Glencoe: New York, NY, USA, 1962. [Google Scholar]
- Corporación Colombia Internacional (CCI). Inteligencia de Mercados: Frijol. Perfil de Producto No. 8; Corporación Colombia Internacional: Bogota, Colombia, 2000. [Google Scholar]
- Servicio de Información y Censo Agropecuario (SICA). Precios mayoristas del fréjol tipo rojo moteado en el mercado de Ibarra 2000–2005. Statistical Bulletin; Servicio de Información y Censo Agropecuario, Ministerio de Agricultura, Ganadería, Acuacultura y Pesca del Ecuador: Quito, Ecuador, 2007. [Google Scholar]
- Mooney, D.F. The Economic Impact of Disease-Resistant Bean Breeding Research in Northern Ecuador; Michigan State University, Department of Agrcultural, Food, and Resource Economics: East Lansing, MI, USA, 2007. [Google Scholar]
- Boys, K.; Faye, M.; Fulton, J.; Lowenberg-DeBoer, J. The economic impact of cowpea research in Senegal: An “ex-post” analysis with disadoption. Agric. Econ. 2007, 36, 363–375. [Google Scholar] [CrossRef]
- Mazón, N.; Peralta, E.; CIAL Cuenca del Río Mira. El Comité de Investigación Agrícola Local (CIAL), una Estrategia Para el Mejoramiento de la Producción Agrícola en Comunidades Rurales: La Experiencia del CIAL Cuenca del Río Mira; Publicación Miscelánea No. 131, Instituto Nacional Autónomo de Investigaciones Agropecuarias, Estación Experimental Santa Catalina, Programa Nacional de Leguminosas y Granos Andinos: Quito, Ecuador, 2005. [Google Scholar]
- Subía, C.; Peralta, E.; Falconí, E.; Pinzón, J.; Mooney, D.F.; Swinton, S.M. Diagnóstico Sobre el Cultivo de Fréjol Arbustivo y el Uso de Pesticidas en el Sistema de Producción, en los Valles del Chota y Mira, Provincias Imbabura y Carchi, Ecuador, 2000–2005; Publicación miscelánea 138; Programa Nacional de Leguminosas y Granos Andinos, Instituto Nacional Autónomo de Investigaciones Agropecuarias: Quito, Ecuador, 2007. [Google Scholar]
- Crissman, C.; Antle, J.; Capalbo, S. (Eds.) Economic, Environmental and Health Tradeoffs in Agriculture: Pesticides and the Sustainability of Andean Potato Production; Kluwer: Boston, MA, USA, 1998; p. 408. [Google Scholar]
- Morris, M.; Bellon, M. Participatory plant breeding research: Opportunities and challenges for the international crop improvement system. Euphytica 2004, 136, 21–35. [Google Scholar] [CrossRef]
- Witcombe, J.; Joshi, R.; Joshi, K.; Sthapit, B. Farmer Participatory Crop Improvement. I. Varietal Selection and Breeding Methods and Their Impact on Biodiversity. Exp. Agric. 1996, 32, 445–460. [Google Scholar] [CrossRef]
- Sistema Integrado de Indicadores Sociales de Ecuador (SIISE). Indicadores Sociales; CD- ROM, Ministerio de Coordinación de Desarrollo Social, Gobierno Nacional del Ecuador: Quito, Ecuador, 2001. [Google Scholar]
- Alwang, J.; Siegel, P. Measuring the impacts of agricultural research on poverty reduction. Agric. Econ. 2003, 29, 1–14. [Google Scholar] [CrossRef]
- Johnson, N.; Klass, J. The Impact of Crop Improvement Research on Rural Poverty: An Analysis of Bean Varieties Resistant to Bean Golden Mosaic Virus in Honduras. In Agricultural Research and Poverty Reduction Some Issues and Evidence; Mathur, S., Pachico, D., Eds.; International Center for Tropical Agriculture: Cali, Colombia, 2003; pp. 241–258. [Google Scholar]
| Publisher’s Note: MDPI stays neutral with regard to jurisdictional claims in published maps and institutional affiliations. |
© 2022 by the authors. Licensee MDPI, Basel, Switzerland. This article is an open access article distributed under the terms and conditions of the Creative Commons Attribution (CC BY) license (https://creativecommons.org/licenses/by/4.0/).


