1. Introduction
Most Southeast Asian developing countries have aging populations. (According to the UN’s classification of countries by region, Southeast Asian countries include Brunei Darussalam, Singapore, Cambodia, Indonesia, Lao Peoples Democratic Republic, Myanmar, the Philippines, Thailand, Timor-Leste, and Vietnam. However, for this study, we follow the Asian Development Bank’s regional classification of Southeast Asian developing countries, which does not include Brunei Darussalam and Singapore. An aging society refers to a society whose median age rises due to rising life expectancy and/or declining birth rates. According to the UN, an aging society is defined as a country or region in which the share of the population aged over 65 exceeds seven percent of the total population.) However, Southeast Asian countries are still regarded as being relatively youthful when compared with other countries in Asia. Recent statistics show that since 2020, the percentage of the elderly population (aged 65 and over) in Southeast Asia has been growing much faster than in other regions around the world, such as African countries located in the tropics. According to the UN [
1], by 2040, with the exception of Timor-Leste, all Southeast Asian developing countries will be classified as having aging societies. At the same time, sharp declines in fertility rates and a significant increase in life expectancy will exacerbate population aging further, shifts that will eventually slow economic growth across Southeast Asia’s developing countries.
For countries facing these aging population challenges, there are two important policy goals that they need to pursue over the medium and long term: (1) Sustaining economic growth under less benign demographic conditions and (2) mitigating the risks associated with population aging by maximizing the productivity especially via improving historically low levels of total factor productivity (TFP) to ensure more sustainable economic growth.
Overcoming the challenges that exist as countries transition towards increasingly aged populations requires rapid economic growth in order to generate the kinds of resources that are needed to provide appropriate levels of economic security. However, fiscal prudence is also required as overgenerous social welfare supplements may limit a country’s ability to grow sustainably.
Among many factors, low levels of total factor productivity (TFP) growth associated with the poor infrastructure and a lack of technological development can hinder sustainable economic growth outcomes for many Southeast Asian developing countries. In the face of demographic transition, countries also face a lack of production factors due to decreasing aggregate saving levels and labor shortage. If these developments are left unchecked, countries that fail to invest in and provide employment opportunities for their younger segments of the population can potentially face social and political unrest [
2]. Furthermore, it may be too late if the government waits until the demographic changes materialize before making the various structural reforms. Moreover, the elderly segments of society can also form interest groups that can potentially resist such reformative policies. For example, in Malaysia, a group of senior citizens recently put forward a proposal, recommending the government introduce a separate ministry to uphold the needs of the elderly [
3].
As a policy recommendation, we suggest facilitating TFP growth through the implementation of strategic public policy initiatives that transform the region’s service sectors and digital economy. Moving to such an economy can help address many of the chronic problems faced by developing countries in Southeast Asia, such as poor infrastructure, slow financial sector development, unbalanced trade and investment patterns, which concentrate only on the lower-skilled labor-intensive industries, poor institutional capacities, and lower levels of education attainment [
4,
5,
6]. For example, upgrading the information and communication technology (ICT) industry and pursuing technological development through increased research and development (R&D) investment will enable the population, especially its younger generations, to become more familiar with and easily adopt new forms of technology, to access vocation training, E-commerce and online transactions, and work-at-home practices, etc. Sachs et al. emphasized the importance of strong education and healthcare across a population so as to raise productivity and drive a digital revolution that can create the building blocks for more sustainable economic development [
7]. Moreover, as Mazzucato stated, the government can play an active role in general-purpose technological innovation [
8].
Our study has several important objectives. Firstly, it assesses the ways in which developing Southeast Asian countries are managing their demographic transitions toward population aging. Secondly, we examine the impact of population aging on TFP growth, which plays an important role in economic growth. Thirdly, we analyze the impact of public R&D investment and ICT trade on TFP growth. Finally, we propose demographic and economic integrated policy options to ensure robust mechanisms of economic growth that effectively deal with the challenges that such demographic transitions present in Southeast Asian developing countries. With an accelerating transition towards a fully integrated digital economy, which has, in no small part, been facilitated through a series of global lockdowns and work-from-home notices brought about by the current COVID-19 pandemic, the time has never been better to implement new policy tools and measures in the ICT space. Despite these important contributions, a lack of developing country data, particularly R&D data, meant we were not able to run the separate TFP empirical analyses for each of the Southeast Asian developing countries.
In order to comply with our research objectives, we will address the following research questions (R1–R4) throughout this study:
- R1.
Are Southeast Asian developing countries encountering a demographic transition towards an aging society?
- R2.
What is the impact of population aging on TFP growth?
- R3.
Do public R&D investment and ICT trade have a positive impact on TFP growth?
- R4.
What kind of demographic and economic integrated policy options are available for aging Southeast Asian developing countries that can drive sustainable economic growth?
The rest of this study is arranged as follows.
Section 2 summarizes the demographic transition to population aging for Southeast Asian developing countries and its implications for the region. In the same section, we will briefly review the related literature on population aging and the importance of TFP growth in developing economies, as well as the importance of transforming to a Digital Economy.
Section 3 reports and discusses the main empirical results regarding the importance of R&D investment and the expansion of ICT trade for facilitating TFP growth for developing countries.
Section 4 summarizes the key findings and draws relevant conclusions.
2. Demographic Transition of Southeast Asian Developing Countries
2.1. The Fast Demographic Transition in Southeast Asian Developing Countries
Like many countries around the world, the Southeast Asian region is experiencing significant demographic changes in the age structure of their populations. The economic challenges that these changes bring differ by country.
In the pre-1950 period, the Asian region was characterized by high fertility and death rates, with populations that grew relatively slowly or stayed at the same level. However, in the 1950s and 1960s, these mortality rates started to fall. Reduced mortality, especially among infants and children, led to considerable increases in the size of the region’s young populations. After all, birth rates contracted too. As a result, because the sizeable birth cohorts of the 1950s and 1960s reached their prime working ages in the 1970s, the population share of the workforce swelled.
Over time, the decreased death rates extended to the older aged populations, resulting in continual increases in life expectancy. In addition to achieving a higher survival rate of child death, people could maintain a very healthy status further than the retirement age. Old-age populations began to demonstrate accelerating growth (See
Table 1). The population shares of the elderly in Indonesia, Thailand, Vietnam, and Myanmar, for instance, were projected to reach such high levels by 2020, primarily as the extremely decreased fertility rates of these countries would lead to substantial falls in the population shares of working-age populations.
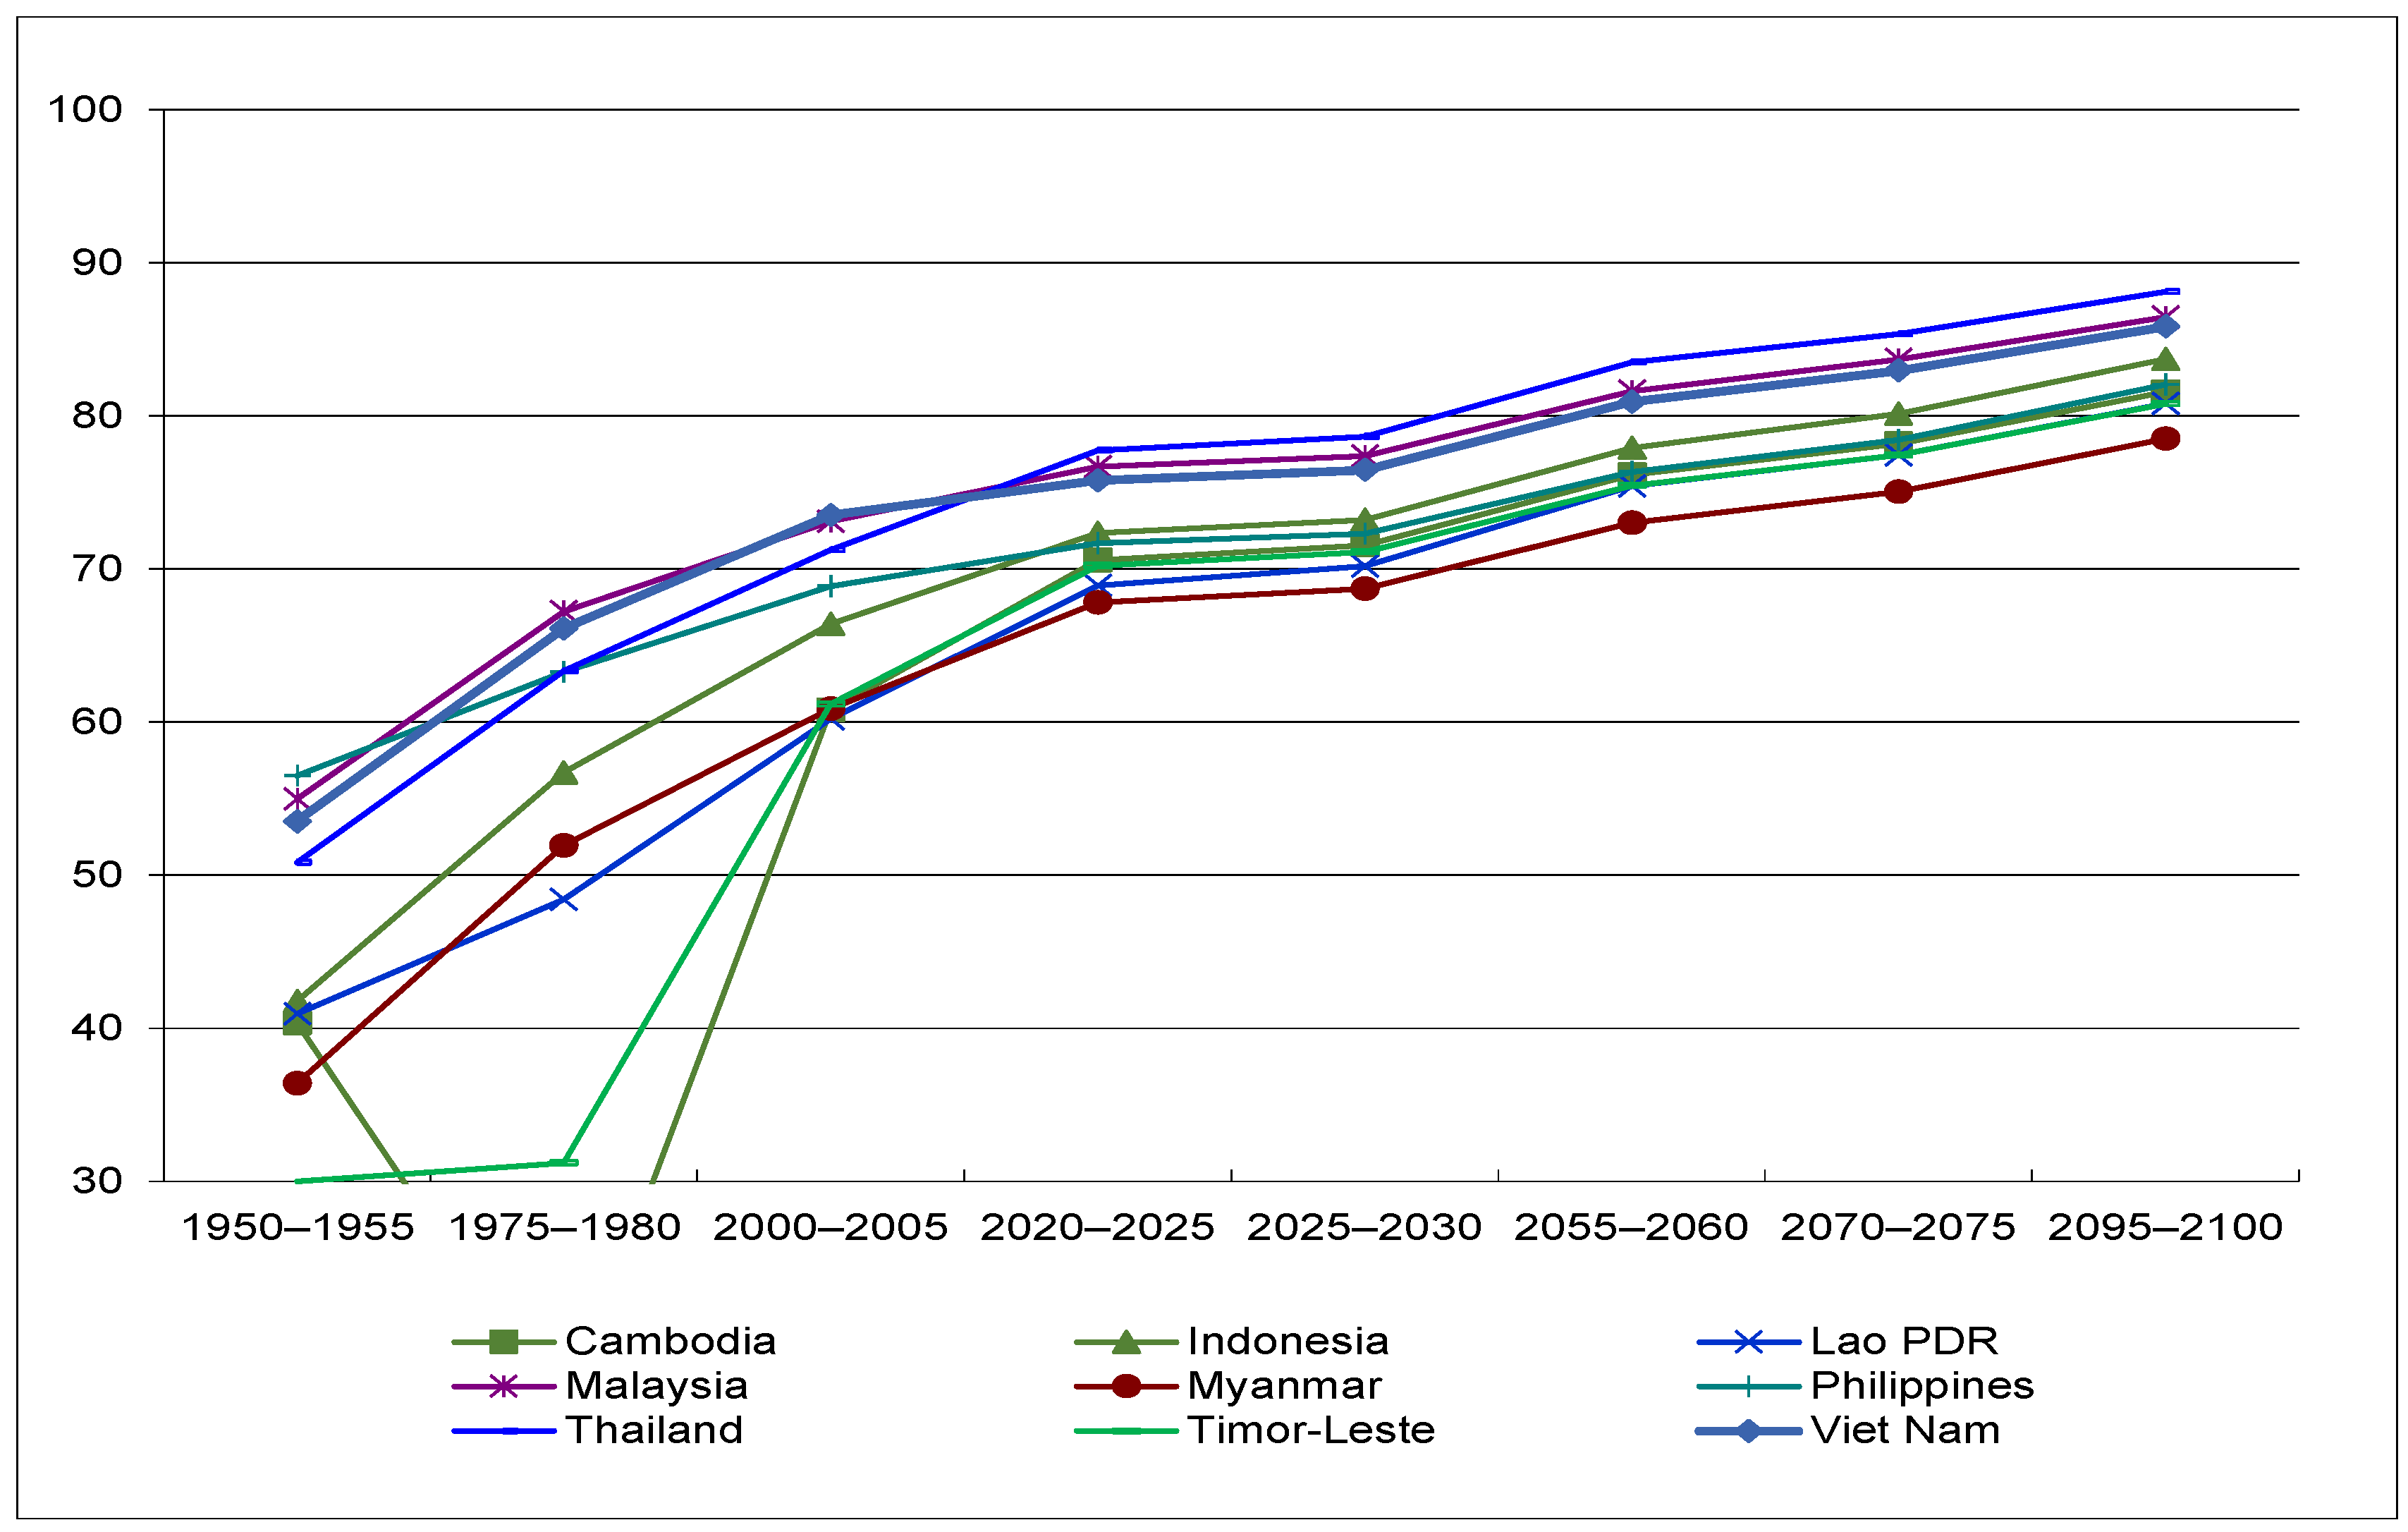
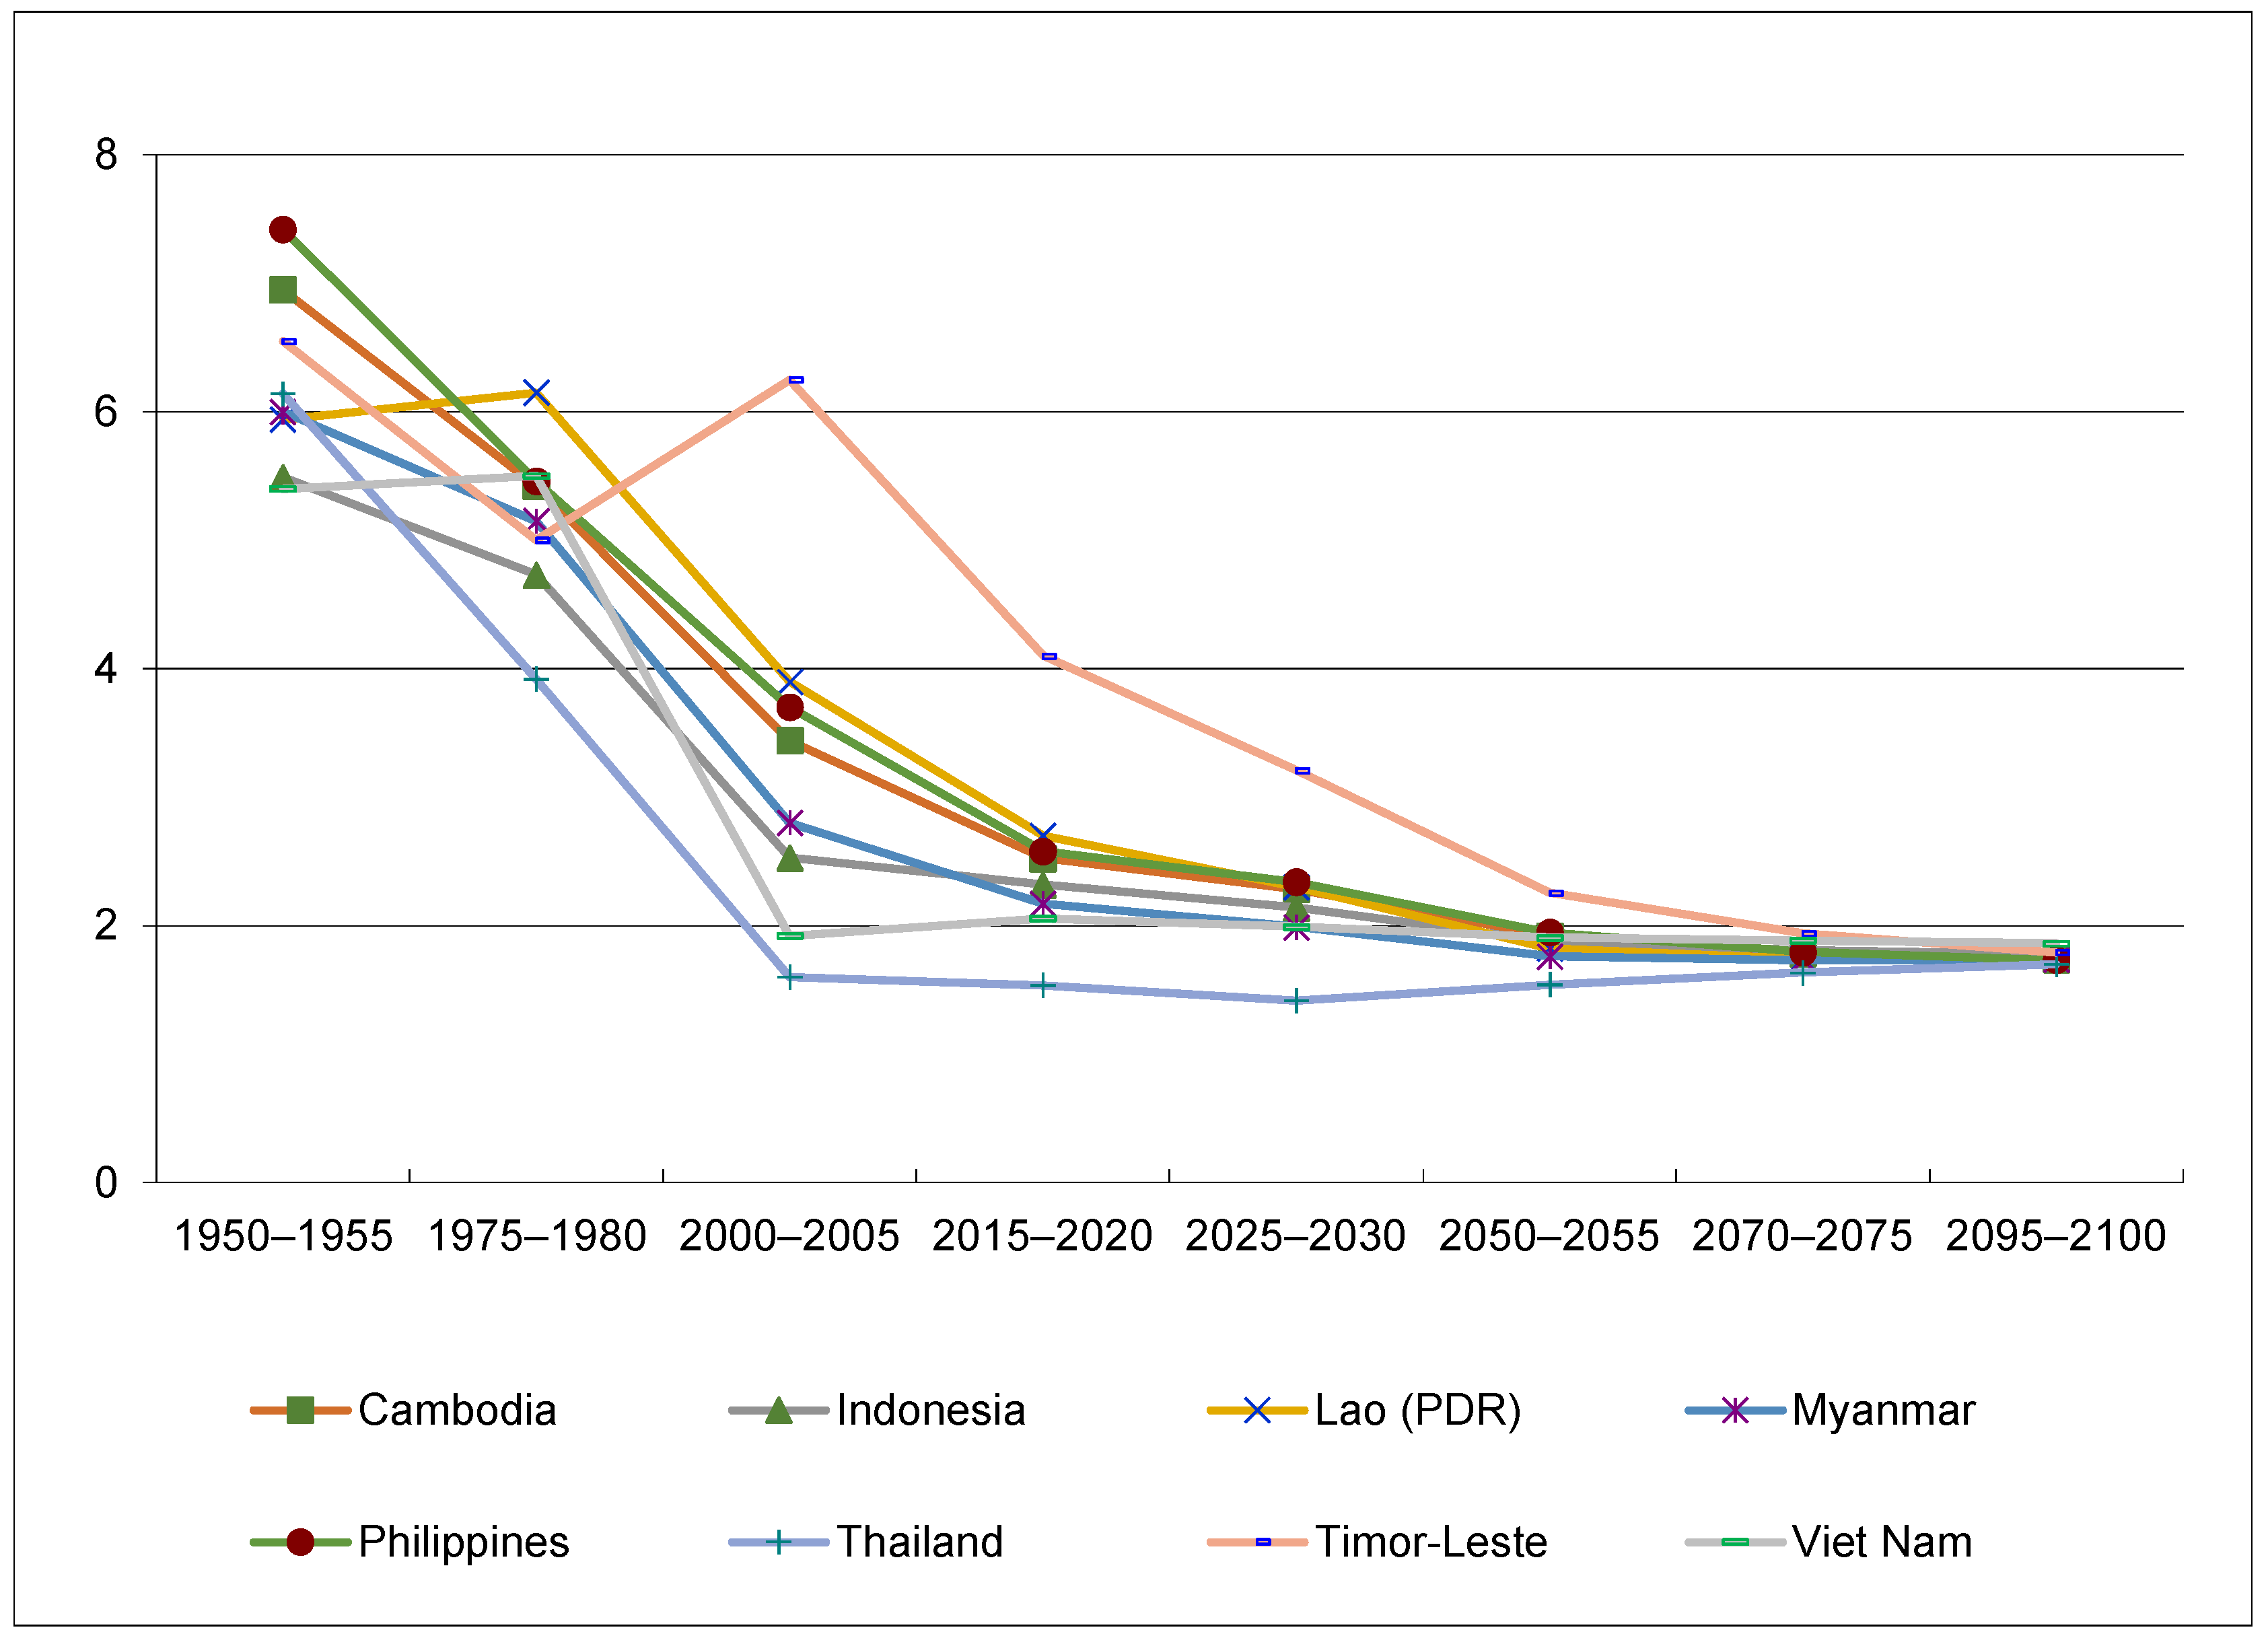
The rate at which the elderly population in Southeast Asian developing countries is increasing, however, has been more directly linked to the precipitous declines in fertility (see
Figure 1) rather than increases in life expectancy (See
Figure 2).
2.2. The Implications of Population Aging
When countries have an increasingly aged population, labor force shortages and decreased investment levels due to a decline in aggregate saving can hinder sustainable economic development opportunities in these countries. Furthermore, the tax burden that falls on the working-age population to support the growing number of retirees grows heavier. Although the broad impact from the changing population age structure is similar for most Southeast Asian developing countries, individual countries will face their own unique situations. The age dependency ratios for the working-age population in Southeast Asian developing countries are summarized below.
High life expectancy and very low levels of the fertility rate, for example in Vietnam, contributed to the relatively high increase in the old-age dependency ratio of Southeast Asian developing countries (See
Table 2).
An obvious implication of the demographic transition described above is that it affects the economy’s capacity to meet its members’ consumption needs, and it is directly linked to the pattern of transfers among different age groups. As the median age of a country’s population increases, the society’s burden shifts from raising the youth of society toward supporting the older generations. The consumption demands of children and the young generation are obviously very different from those of the elderly. When we want to gauge the effects of changes in the age composition on the economy, we also need to take into account the changes in the basket of goods and services consumed.
The economic support ratio provides a good summary indicator for showing the effect of demographic change on a society’s total economic support burden, incorporating both the age structure of the labor force and the age profile of consumption at the same time. According to the National Transfer Account’s (NTA) description, the support ratio is defined as “the effective number of workers divided by the effective number of consumers” [
9]. When the ratio increases, society’s burden of supporting the population’s consumption expenditure is reduced because we have a larger number of effective workers per effective consumer. The measure of effective workers captures the productivity and other important labor force characteristics, such as labor income, educational attainment, work experience, and the distribution of workers across industries and occupations, for each age group. It also reflects various labor market conditions, for example, labor force participation rates, unemployment rates, hours of working, stock of assets, and labor protection arrangements. The timings of entering and leaving the labor force are also considered. When we have the number of effective workers for each age, we can calculate the total number of effective workers for the economy by simply summing them up. If we fix the age profile of effective workers at a given base year and change only the demographic structure, we can measure the impact of the demographic change on the total size of effective workers or the labor income.
The effective number of consumers is calculated in a similar way. Here the age profile of consumption expenditure plays an important role in calculating the denominator of the ratio. The most notable change in the consumption basket is, when the average consumer gets older, the level of healthcare expenditure increases. The more expensive the health and long-term care of the elderly is, the steeper the declining slope of the economic support ratio becomes, as the whole population becomes older [
10].
Table 3 tracks the economic support ratios of Southeast Asian developing countries from 1950 to 2100. The estimates are constructed using UN population estimates and projections, based on the medium-fertility scenario. The age profiles of labor incomes and consumption expenditures are from the National Transfer Accounts (NTA) database. The pattern is not uniform—many countries, including Vietnam, illustrate a decreasing support ratio after 2020, while Myanmar’s support ratio increases until 2060 and Timor-Leste’s support ratio increases until 2070. All of the countries will eventually experience population aging and a decreasing economic support ratio. However, the negative effects of the aging process can be postponed if a country can boost labor productivity and raise the labor market participation rate, etc., so that the effective number of workers is increased for a longer period of time than others.
2.3. Literature Review
2.3.1. Demographic Changes Impact on Economic Growth
A range of literature indicated that the age structure of the population has a significant impact on economic growth [
11,
12,
13]. A young population with an expanding workforce is closely associated with accelerating economic growth—a phenomenon commonly known as the “demographic dividend”. It is projected that almost 33% of the growth in East Asia during 1965–1990 can be attributed to favorable demographics [
14]. With population aging, the demographic transition process can change the trajectory of economic development that sees a lowering of productivity and reduced consumer market size, which results in slower growth [
11,
13,
15,
16]. Some studies showed that a higher share of the old population reduces productivity and savings, and increases government expenditures [
11,
17,
18,
19] while others argued that in the case of China, PRC, population aging is unlikely to cause significant economic problems [
20]. The bottom line is that the current demographic shift in Southeast Asian developing countries is very likely to be an amplifier of the old-age dependency ratio, implying that a smaller working-age group supports a larger elderly segment [
21,
22].
The empirical evidence of saving and demography seems ambiguous as saving will be very context dependent [
23] while behavioral reactions to population aging are quite complex. Increases in life expectancy and the duration that people now spend in retirement may influence the age at which they choose to retire [
24], the extent to which the elderly can rely on family members for support and the level of public transfer systems [
25]. Lee and Mason, for example, found that shifts in the age structure represent one of the most important reasons behind US saving trends. However, such structural shifts are not a key driver in the rapid increases in savings experienced in Taipei, China. In this instance, such trends can be explained by changes in the population age structure in conjunction with a rapid transition of the old population assistance schemes from family transfers to lifecycle savings [
26].
Maestas et al. analyzed US state-level panel data to determine where any negative relationship between aging and state output per capita can be found [
27]. The results revealed that a 10% increase in the population aged 60 and above led to a 5.5% decline in the growth rate of gross domestic product (GDP) per capita by state. Further analysis of this effect showed that only one-third of this decline is due to slower labor force growth, while two-thirds of the decline is attributed to slower labor productivity growth.
2.3.2. Demographic Changes and Productivity
Some studies show that a higher share of the older population in the workforce leads to lower productivity [
28,
29], hence lower growth [
30,
31]. Wasiluk projected a 0.25 percentage point decrease in the annual productivity growth rate for Germany, due to labor-force aging [
32]. In a cross-country study including data from the 1960–1990 period, Feyrer examined different age groups to ascertain the relationship between demographic changes and aggregate productivity. Using the 40–49-year-old age group as a base, the research estimated that a 5% increase in this cohort over a ten-year period is related to a 1–2% rise in productivity per year for that period [
33].
Intuitively, older workers may be more prone to skill obsolescence and an aging workforce has often been associated with lower productivity [
34]. This seems the case in 10 Canadian provinces during the 1981–2001 period, when Tang and MacLeod noted that the productivity of older workers is, on the whole, lower than younger workers, thus labor force aging has negatively affected productivity [
28]. Firms with older workers are not incentivized to update their technologies as often as they would if they had employed younger workers [
32,
35].
Alesina et al., however, presented another view that aggregate productivity would be higher in a country with aged, more experienced workforces [
36]. Since productivity grows fastest and reaches its highest among the 35–54-year age group, the productive capacity of a country with a large percentage of prime-age workers should be distinctly superior to that of other countries with a relatively larger portion of younger or older workers. Using panel data from 84 countries, Gómez and Hernández de Cos noticed that an increase in the proportion of the prime-age working population has a positive but curvilinear effect on per capita GDP [
37]. A truck assembly plant study by Börsch-Supan and Weiss in Germany observed that even in an environment where physical skills are more relevant, individual-level average productivity increases up to the age of 60 due to an individual’s improved health status [
38]. Burtless’ study in the US found that there is no clear evidence that aging led to lower productivity, and the elderly workers of today are not comparable to those of earlier generations because the current elderly are more educated than before [
39].
Evidence suggests that countries are mitigating the effects of a decreasing share of the working-age population by increasing human capital investments and the gains from the second demographic dividend that have been generated by higher savings stemming from adult longevity. To improve productivity among the elderly workforce, making appropriate adjustments in the workplace such as lighting improvements or providing ergonomically designed desks can help. A common finding from Meyer [
35] and Zwick and Göbel [
40] cites that cultivating diversity in teams while toning hierarchy based on seniority may also contribute to boosting relative productivity and greater adoption of new productivity-enhancing technologies. Cylus and Tayara’s GDP growth study of 180 countries across the 1990–2017 period showed that aging does not result in economic decline if older workers are in good health [
41]. The rising share of the old-age population may also change the structure of demand toward goods and services for the elderly, which, in turn, may induce increases in the investment rate to bring about the required structural changes in production. Research has shown that the causes of TFP change represent structural changes in the economy, such as responding to changes in demographic structure, often through other types of innovation. For example, Acemoglu and Restrepo argued that a shortage of young and middle-aged labor, a consequence of aging, can in fact induce the adoption of robots and automation [
31]. Their study estimated, using cross-country data from 1993–2014, that a 10-percentage-point increase in the share of aged workers (56 years old and above) led to the adoption of robots by up to 0.25 installations per thousand workers on average. In Europe, higher government spending on research and development reduced the negative effect of aging on TFP growth [
29]. Technological changes and innovation tend to take place or get induced as responses to relative resource endowments, hence the increased adoption of technology among aged and aging countries is not coincident but likely endogenous in nature [
42].
2.3.3. Demographic and Economic Integrated Policy Options
Another possible response to population aging is to scale up investments in human capital. Children rely almost exclusively on transfers to fund their lifecycle deficit in any country [
43]. However, countries differ in the extent to which those resources are provided through the public sector rather than the private sector. They also vary significantly in terms of the types of transfers that contribute to the funding for the human capital, i.e., education and healthcare. Total labor productivity could be increased by increasing the quality of the labor force through investments in human capital [
44,
45]. An analysis by Lee and Mason showed that the impact of spending on education is robust enough to compensate for the unfavorable effects of population aging, but this conclusion relies on the effectiveness of the investment [
46].
Developing countries can tap into investments from ‘older’ countries that may seek to tap their ‘younger’ growth potential. For example, Johnston argued that China’s increased investments in Southeast Asia and Africa through the “one belt one road initiative” is an example of how economic and demographic change policy can be used to overcome the challenges within China’s demographic transition [
47,
48,
49].
2.4. Demographic Transition and Total Factor Productivity
Total factor productivity (TFP), as first espoused by Tinbergen and widely developed by Domar and others, is the residual after accounting for the growth of real output by all measurable factor inputs [
50,
51]. It is well-established that the growth of TFP is a key determinant of the long-term growth of per-capita GDP. A developing country can expand its output by accumulating physical capital, mobilizing labor inputs, and educating workers for a while, especially in the early stages of its economic development. However, the law of diminishing marginal product places a hard limit on this kind of factor-driven economic growth. In order to achieve long-term sustainable economic growth, a country needs to raise its TFP through structural changes and technological innovations. Kim and Park [
44] and Kim et al. [
13] show that physical capital accumulation and TFP growth played major roles in most countries’ history of economic growth.
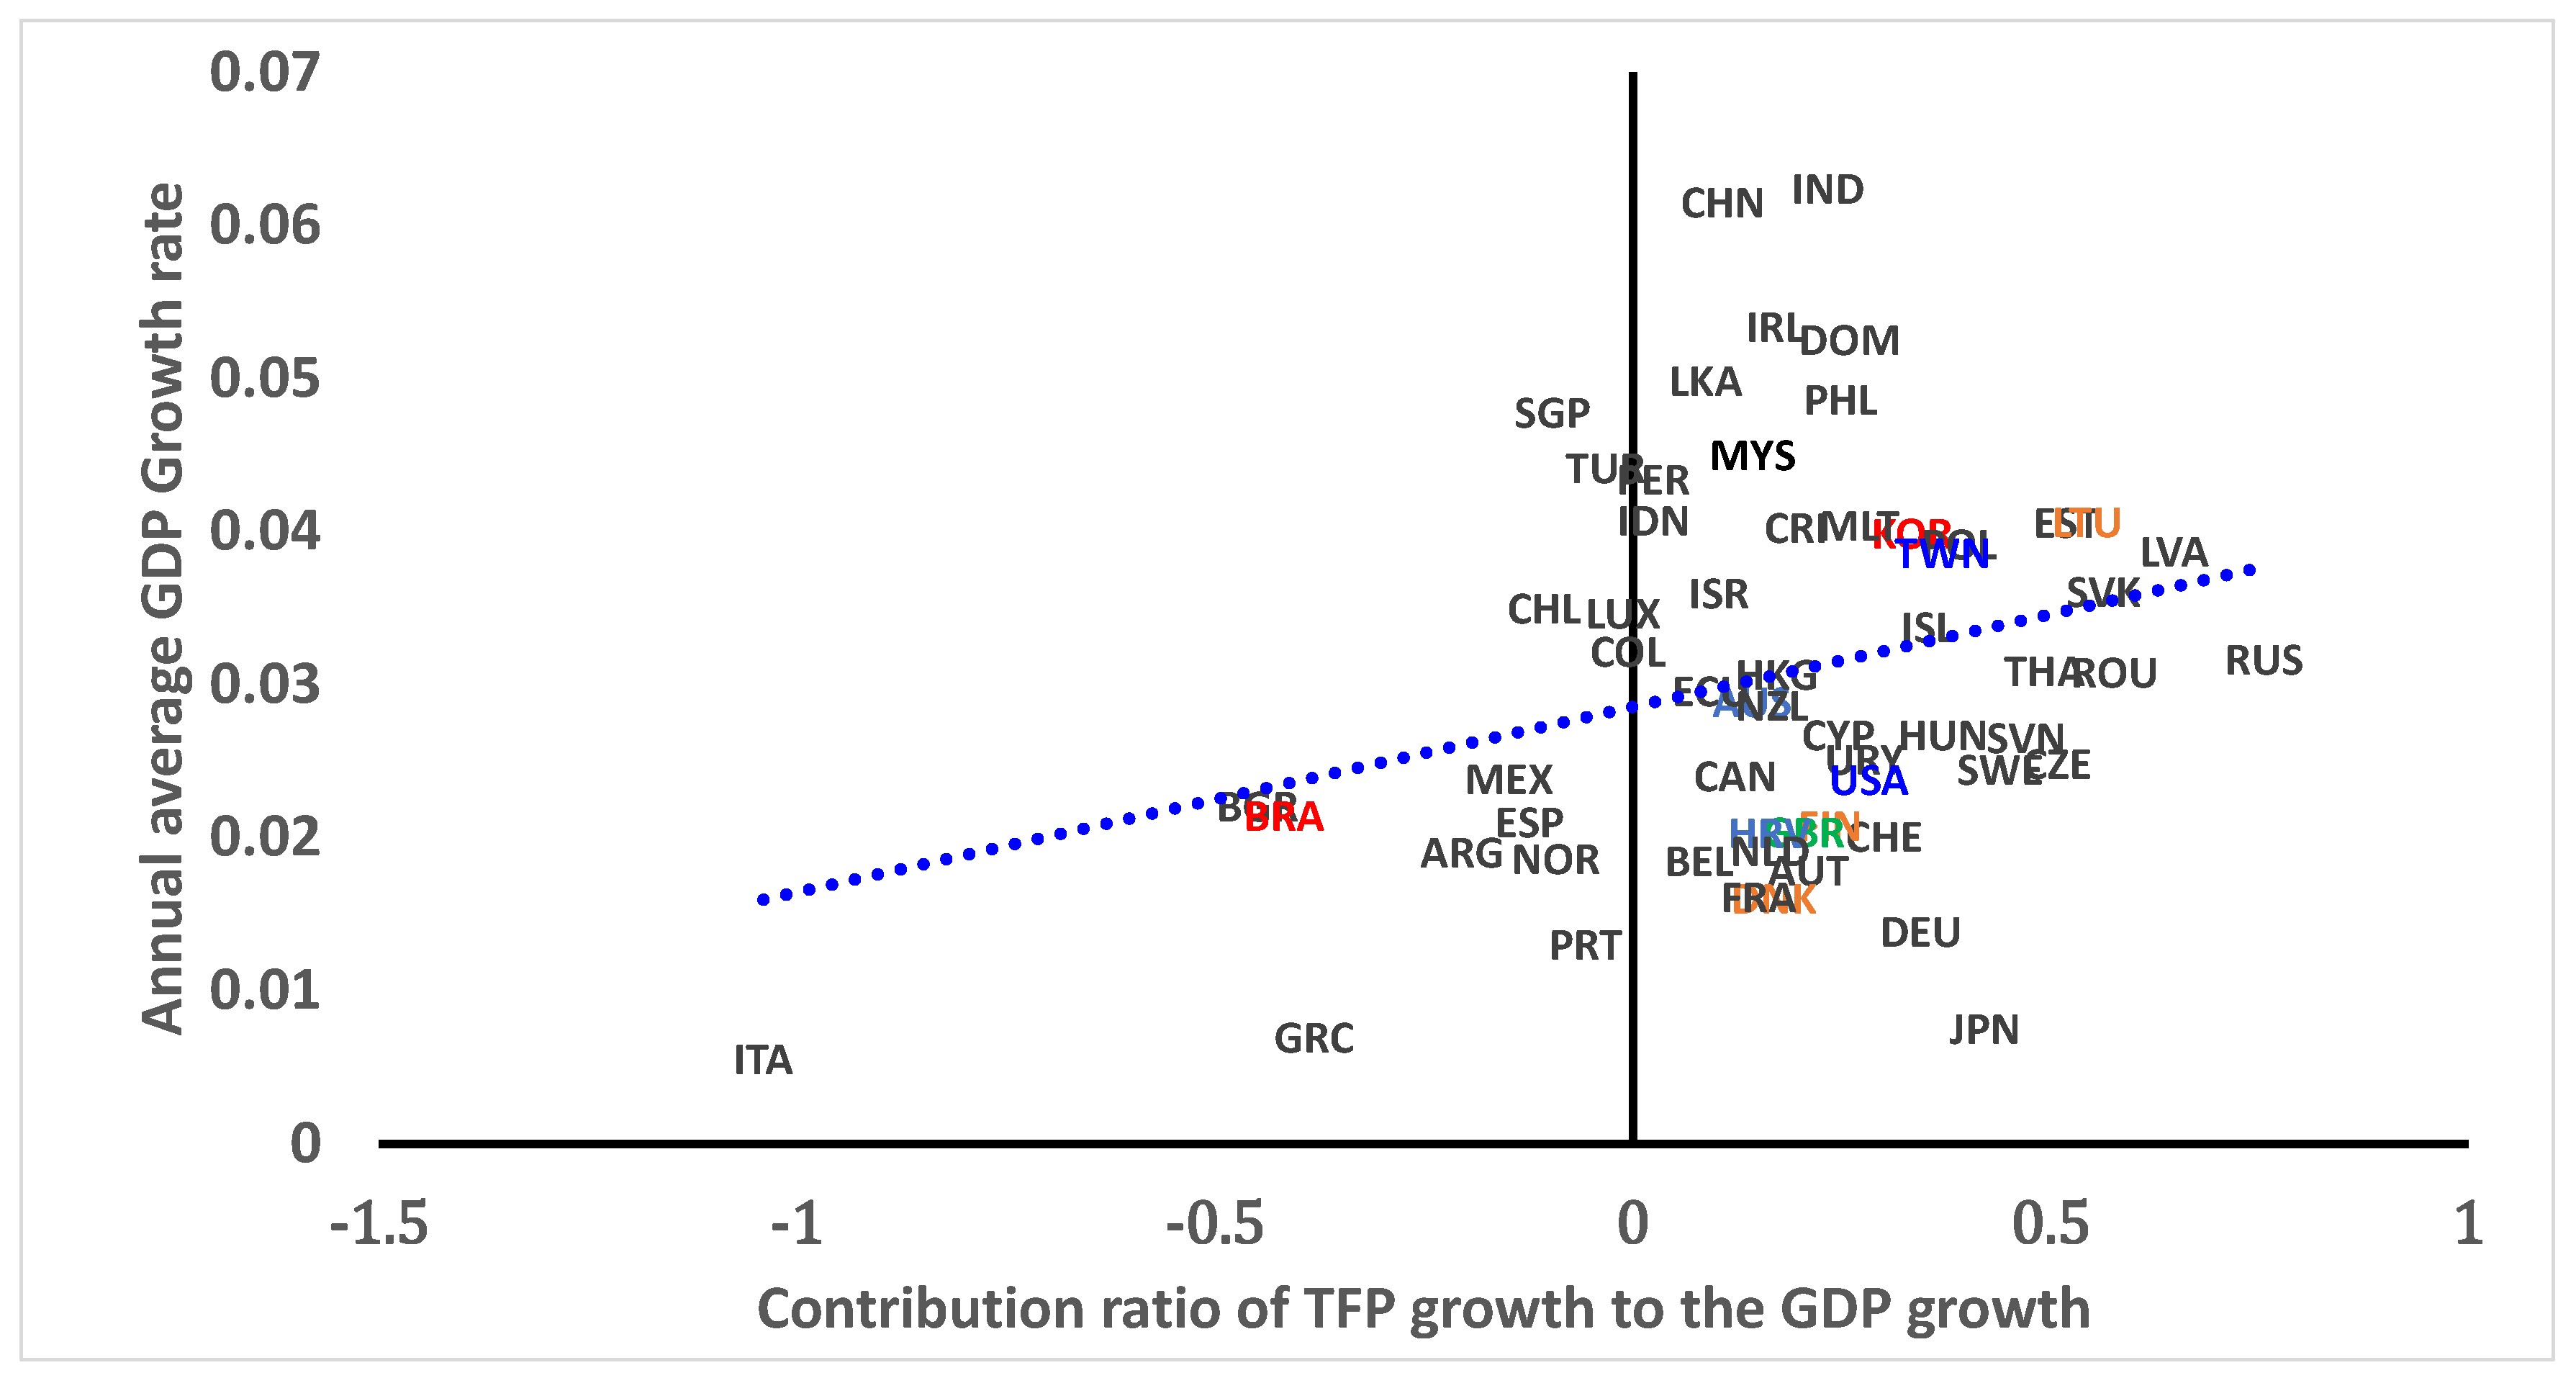
Figure 3 confirms the importance of TFP in long-term economic growth. Among the 60 countries with TFP estimates and the real GDP data available for the 1996 to 2019 period in the Penn World Table 10.0, the contribution ratio of TFP growth to GDP growth has a clear positive correlation with the annual average GDP growth rate.
Avenues of effectively coping with population aging—investing in physical capital and human capital—should be simultaneously pursued. An appropriate approach to sustaining economic growth and providing economic protection for the elderly would create the right balance between physical investment and public transfers, i.e., accumulating public physical capital while promoting human capital investment through government spending and transfers for education and healthcare. Since population aging is enduring, it is important that countries do not delay the implementation of necessary policies and practices, so that continued economic growth is ensured.
2.5. Transformation to Digital Economy
2.5.1. Digital Economy as a Solution
Despite the various trials, there has been no global consensus on how the concept of the digital economy should be defined. For instance, according to the OECD [
52], “The Digital Economy incorporates all economic activity reliant on, or significantly enhanced by the use of digital inputs, including digital technologies, digital infrastructure, digital services and data.” According to Buhkt and Heeks [
53], the digital economy is referred to as “that part of economic output that is derived solely or primarily from digital technologies with a business model based on digital goods or services.” According to the analysis of Google, Temasek Holdings Pte Ltd., and Bain & Co., Southeast Asia’s growing digital economy is expected to reach
$363 billion by 2025. E-commerce, travel, media, transport, and food are driving the region’s digital growth, with online spending rising 49% in 2021 to
$174 billion [
54]. Bloomberg reported that the region added 60 million new digital consumers since the start of the pandemic, especially led by Thailand and the Philippines [
55].
The animated development of the digital economy will convey various opportunities for Southeast Asian developing countries by empowering the potential of TFP increases in these countries. As addressed by several studies, developing countries have faced many challenges, including a lack of information technology infrastructure and poor digital ecosystems, which usually depend on the quality of human resources, finance, and governmental institutions [
56,
57,
58]. Among them, the most serious factor undermining developing countries’ sustainable economic growth would be their unskilled human resources, mainly due to the insufficient provision of quality education.
As for the remedies, a remarkable improvement can be made if the countries are successfully transformed into more digitalized economies. For example, various types of online vocational education can be granted to people in developing countries with relatively small budgets. The emergence of block-chain technology in trade and financial transactions can imply easier access to both domestic and international digital trade. The expansion of digital trade will eventually motivate the developing countries to go through a domestic restructuring of the inefficient industries because of active international competitions, which in turn increases investment flows by attracting more capital to the economy.
In Southeast Asian developing countries, a digital transformation is already happening through the introduction of retail payment systems. With the expansion of e-commerce services, digital payments and online trades are expected to grow rapidly, which in turn will motivate countries in the region to upgrade their payment infrastructures and update their supervision and regulatory frameworks [
59,
60,
61].
Digital transformation can also decrease financial barriers. Around 73% of the total population in Southeast Asia, including Singapore and Brunei, are estimated to be unbanked as late as 2019 [
62]. Online payment platforms, such as Indonesia-based Gojek, are expected to increase financial inclusion by allowing consumers who do not have actual bank accounts to participate in the financial system. According to a recent survey conducted in 2019, among the unbanked borrowers, a great portion of consumers and suppliers showed their willingness to utilize unconventional data-based services, such as e-commerce transactions, to prove their credit worthiness [
62]. Digitalization is creating new market accesses in this region by bringing financial services to people’s hands through mobile phones. Luckily, according to the latest available data of the WDI 2019, the number of mobile cellular subscriptions (per 100 people) in the Southeast Asian developing countries in 2019 has almost reached 100%, except in Lao PDR where there is only 60.8%. Thus, the basic infrastructure needed for the application of a digital economy is secure and able to provide a solid basis on which governments can attract additional investments that can further accelerate their digital transformation.
2.5.2. Digital Economy Transformation and TFP
There are many reasons to believe that digital transformation can improve the overall productivity of an economy. Among these are transaction costs, which can be greatly reduced through the digitalization process and the use of information technologies. Global supply chains can therefore become a lot easier to manage through the use of electronic telecommunication platforms [
63,
64,
65]. Moreover, many meetings and education services can be delivered through the Internet. Still, the actual impact of digital transformation depends on the development and readiness of the technologies available, along with relevant policy designs and their successful implementation. The digital transformation process also increases the possibility of a productivity paradox. Productivity effects would not be produced if digital technology is still in an installation phase, during which new technologies are driven by the creation of new infrastructure and superior ways of production. Productivity growth usually only occurs during the deployment phase when a new paradigm is widely diffused and becomes common practice across organizations, enabling it to fully drive increases in economic and business growth, productivity, and profitability [
66].
As such, Southeast Asian developing countries need to fully focus on overcoming existing capacity limitations while also stimulating the development of the digital economy. Increases in public R&D investment in digital infrastructure, which includes investments in information and communication technology infrastructure, energy infrastructure, technology transfer, and human capital, will play an important role in developing the digital economy [
67].
Although the digitalization impact on jobs is still not clear, there are studies suggesting that increased investment in digitalization would have a positive impact on high-skilled workers’ employment, while negatively affecting low-skilled workers’ jobs [
68,
69]. According to these studies, governments in Southeast Asian developing countries should increase investment in the creation of high-skilled jobs. Studies by Acemoglu and Restrepo or by Curtis and Lugauer argued that the increased investment in capital-intensive industries with the rapid adoption of automation technologies would have a positive impact on the labor productivity in countries with an aged population [
70,
71].
3. Empirical Analysis
3.1. Data
As discussed, Southeast Asian developing countries are facing rapid population aging in the near future. It is therefore imperative that the governments of these respective nations are prepared for the types of challenges these structural changes will bring in maintaining strong levels of economic growth over the long term. Sustainable growth can only be achieved by raising TFP, which in turn can be boosted by active R&D or by evolving into a more digitalized economy. To assess such arguments, a series of empirical analyses were conducted below, the results of which helped to illustrate the key determinants of the TFP growth.
Table 4 summarizes the variables and the data sources we used to conduct the regression analyses. We use the Penn World Table (PWT) version 10.0 to obtain the TFP levels of various countries. The annual growth rate of TFP is the main dependent variable. The level of real GDP, which is used as the main control variable, is also taken from the PWT. In order to understand the key determinants of the growth of TFP in the context of a digital economy, we use the GERD database to obtain the annual levels of gross domestic expenditure on R&D (GERD) activities for 82 countries across a 24-year period from 1996 to 2019. As a proxy for the digital transformation, we need a measure of the intensity of the information and communication technology (ICT) industry in the composition of each country’s economy. We propose to use the share of ICT goods in international trade for this measure. If a country has a high intensity of the ICT industry, we can expect that the ICT share of its exports will also be high. On the other hand, if a country works as an ICT manufacturing factory in the global supply chain or it invests heavily in the ICT industry, then we can expect that the ICT share of its imports will be high. We use either the ICT share in the total exports or the ICT share in the total imports, with these data obtained from the World Bank.
3.2. Empirical Model and Estimation Results
To determine the effect of R&D on productivity, we propose a simple linear model for our baseline empirical analysis:
where TFP is the level of total factor productivity, GDP is the level of real gross domestic products, GERD is the level of gross domestic expenditure on R&D, and
is the year controlling time trend.
is the coefficient of interest, which shows the partial correlation between the growth rate of GERD and the growth rate of TFP. If the growth rate of R&D expenditure has a positive effect on the TFP growth rate, we expect
to be positive. For the type of GERD, we utilize three different measures of the GERD variables—the real total expenditure on R&D, the real per-capita expenditure on R&D, and the real public expenditure on R&D. The public GERD is calculated as the sum of government expenditure and the expenditure by higher-education institutions, such as universities, following the OECD Frascati Manual [
72].
As a control variable, we use the natural log of lagged real GDP, following the convention in growth accounting literature. Considering the stylized fact that economic growth slows down with higher levels of GDP, we expect the coefficient to be negative. We also capture the time trends by including the calendar year, and we expect the coefficient to be negative.
The estimation result of this benchmark model is shown in
Table 5. The growth rates of all the three measures of GERD—GERD (the real total expenditure on R&D), GERD_pc (the real per-capita expenditure on R&D), and GERD_pub (the real public expenditure on R&D)—illustrate a positive correlation with the dependent variable
(growth rate of TFP measured as log-difference). The real per-capita expenditure on R&D shows the largest and the most significant coefficient among the three. The control variable
(log of lagged real GDP) shows a negative and significant coefficient in each of the three cases. Such results highlight the positive return that domestic R&D expenditure can have. When the countries spend more on R&D, especially in per-capita terms, the TFP growth rate is positively and significantly affected. It seems that it does not matter who spends the money, though. The estimated coefficient on GERD_pub is not significant. As long as there are larger amounts of R&D spending, either from the public sector or from the private sector, the level of TFP can be increased.
Now we add the ICT trade intensity as another explanatory variable. The estimation model becomes:
where ICT is either ICT-export or ICT-import. ICT-export is defined as the information and communication technology sector’s exports as a percentage of total goods exports. ICT-import is the ICT sector’s imports as a percentage of total goods imports. For this exercise, we use either GERD_pc or GERD_pub for the GERD variable.
Table 6 illustrates the estimation results with both the GERD and either one of the ICT-export or the ICT-import variables. When we add the ICT intensity variable, the GERD_pc stays positive and significant. The 1-period lag of ICT-import growth rate also shows a positive and strongly significant correlation with the growth rate of TFP. The coefficient of the 1-period lag of the ICT-export growth rate is also estimated as being positive; however, it is significant only at the 10% level.
When we use the GERD_pub together with the ICT intensity variables, the estimated coefficient on GERD_pub becomes positive and significant at the 1% level. With GERD_pub, the ICT intensity variables behave similarly to the previous case—the lagged ICT-import growth rate shows a positive and strongly significant correlation with the growth rate of TFP, while the ICT-export’s coefficient is estimated to be positive but insignificant.
These results show us that the intensity of the ICT industry is also important in boosting total factor productivity, and that the import channel seems more important than the export channel. It might be the case that importing ICT goods for domestic investment or importing intermediate goods with advanced technology to be incorporated in domestic production is directly linked to the productivity-enhancing activities of a country.
To understand the regional implication more closely and to also check the robustness of our analysis, we re-estimate Equation (2) with additional country-group dummies. We add a dummy variable for OECD member countries and check the interaction of this OECD dummy with the GERD variable. Considering that the OECD members are mostly advanced countries, we expect the coefficient on the dummy variable to be negative, meaning that the TFP growth rates are lower on average for more advanced economies. If the R&D investment is more effective in advanced economies, the interaction term will have a positive coefficient. We also add a dummy variable for the Southeast Asian countries and check the interaction of this Southeast Asian dummy with the ICT intensity variables. We expect the coefficient on the dummy variable to be positive and the coefficient on the interaction term to also be positive, implying that raising the level of ICT trade can be even more helpful in increasing TFP for these Southeast Asian countries. For this exercise, we use GERD_pc for the R&D variable.
Table 7 summarizes some of the important estimation results of our regional analysis. Not so many coefficients are significantly estimated, but the signs are all in alignment with our expectations. The Southeast Asian country dummy has a positive sign, meaning that these countries are still relatively young and have higher TFP growth rates on average. The ICT import is positive with a strong level of significance. The interaction term between the SE Asian dummy and ICT imports or exports is always estimated to be positive, with some level of marginal significance. This weakly supports our proposition that raising the level of trade of ICT products can provide an extra boost to the TFP growth rates of Southeast Asian countries. The OECD countries have lower TFP growth rates on average, which makes it even more important that the interaction between the OECD dummy and GERD_pc is estimated to be positive and significant. The advanced economies can provide an extra boost to their TFP growth by investing in R&D.
The policy implication of these empirical analyses is that to promote productivity, the governments need to increase expenditure on R&D activities and accelerate the level of digital transformation. Well-focused public R&D expenditures can significantly boost the level of TFP, as is clearly shown in
Table 6. Increasing the ICT shares of the total imports is also positively correlated with that of TFP growth. Developing countries can expedite the digital transformation process by learning from more advanced economies. Importing ICT goods and using them as either intermediate or investment goods can increase the ICT intensity of the overall economy and increase productivity standards. The enhanced total factor productivity will then lead Southeast Asian developing countries onto a more sustainable long-term path of economic growth.
4. Findings and Conclusions
In terms of our first research question (R1), as to whether Southeast Asian developing countries are encountering a demographic transition toward population aging, we find most developing Southeast Asian countries have increasingly aged populations although they are still regarded as being relatively youthful when compared to other countries in Asia. Recent statistics reveal that the demographic transition toward population aging, i.e., a growing share of the elderly in the total population, began around 2020, with the speed of this growth being much faster than in other developing regions, such as African countries in the Tropics. In conjunction with a sharp decline in fertility rates and significant increases in life expectancy, which are the distinctive indicators of population aging, the fast demographic transition towards an aging population will eventually lead to stagnations in economic growth among Southeast Asian developing countries. Secondly, as we have seen in
Section 2, the impact of population aging on TFP growth is negative in most cases, and through the various literature studies, we found support for R2 that TFP does play an important role in economic growth for developing countries. In terms of R3, our empirical analysis showed that public R&D investment and ICT trade have a positive impact on TFP growth. These fast-moving demographic transition trends require immediate and decisive policy actions to ensure a more sustainable path of economic growth. Finally, in terms of R4, which assessed the demographic and economic integrated policy options that are needed to achieve sustainable economic growth for aging Southeast Asian developing countries, we discussed the importance of facilitating TFP growth through the rapid transformation toward the digital economy in this region. Moving towards a digital economy can act as an important means for addressing the chronic problems that most developing countries have long been facing, such as poor infrastructure, slow financial-sector development, unbalanced trade and investment practices, which center on the lower-skilled labor-intensive industries, poor institutional capabilities, and inadequate levels of education attainment. For example, the development of the ICT industry and pursuing technological development through increased R&D investment can facilitate the adoption and support of new technological innovations, access to vocation training, E-commerce and online transactions, and work-from-home practices, especially among the younger generations.
During the COVID-19 global pandemic, digital technologies have become a critical factor of connectivity, thereby enhancing the continuity of people’s daily lives. When countries impose lockdowns and implement stay-at-home regulations, the majority of people seek comfort from their digital communication devices. Digital technologies support a wide range of in-person activities, including telework, telemedicine, food and necessities delivery, logistics, online payments, online summits, remote learning, and entertainment options. Although the current expansion of digital activities with online arrangements will be reduced once the pandemic is contained, the large-scale natural experiment of digitalization will no doubt fundamentally change the conventional way of living and working practices for a long time to come. Hence, the need for reliable and sustainable digital telecommunications and Internet infrastructure is greater than ever before. From this point of view, the current prevalence of the digital economy can act as a very important mechanism for driving economic growth opportunities across Southeast Asia’s developing countries.
As history has repeatedly revealed, e.g., the industrial revolution in Great Britain in the 18th century, the rapid rise of West Germany and Japan after World War II in the 20th century, the remarkable economic growth of the four Asian tigers between the early 1960s and 1990s, and the emergence of China, PRC in the global economy since 2000, the challenges the world encounters are indispensable opportunities for revolution and innovation. Such moments act as an important gateway for many countries to reach new heights of economic prosperity. Just like the historic events of the past, the COVID-19 pandemic will bring about new economic opportunities for Southeast Asian countries if the right policy tools and measures can be implemented.
Our empirical assessment also confirmed that when countries spend more on R&D, especially in per-capita terms, the TFP growth rate is positively and significantly affected. We find that the growth rate of the total per-capita expenditure on R&D is more important than who actually initiates the R&D investment. As long as there are increased R&D investments, either from the public or private sector, TFP can be boosted. The intensity of the ICT industry is also found to be important in facilitating TFP growth, and the impact of the import channel seems more significant than that of the export channel. It might be the case that importing ICT goods for domestic investment or importing intermediate goods with more advanced technology to be incorporated in domestic production is directly linked to the productivity-enhancing activities of a country. In the face of the demographic transition toward population aging, Southeast Asian developing countries still have many policy options available to them in which they can prepare for eventual economic slowdowns that may occur. They must utilize their relatively youthful population now and place a stronger emphasis on making structural reforms that break capacity limits and stimulate the development of the digital economy. Increasing public R&D investment in digital infrastructure, which includes investment in ICT infrastructure, energy infrastructure, technology transfer, and human capital, as well as appropriate tax incentives, is highly recommended. ICT trade will also play an important role in attracting more foreign direct investment, which is needed to finance the required expenditure for increased public R&D.
Finally, how Southeast Asian developing countries, with chronically weak government revenues, can finance public investment should be further discussed. Among many policy solutions, accepting Official Development Assistance (ODA) or Aid for Trade (AfT) that is focused on improving R&D in basic science is highly recommended. At the same time, they should actively promote foreign direct investment (FDI), which can provide vocational education to the labor force and enhance the technological infrastructure of countries. Although all research questions were addressed, a lack of available developing country data, especially R&D-related data, meant that we were not able to run separate TFP empirical analyses for the respective countries. When the full-scale transition to the digital economy is made in the future, analyzing the impacts of the demographic and economic integrated policy, such as the impact of digitalization on TFP growth in Southeast Asia, will be an important area of further research.


