Article

Relationship between Related Party Transactions and the Social Contribution Activities of South Korean Chaebol Companies

1
Department of Business Administration, Hansei University, Gunpo-si 15852, Korea
2
Department of Business Administration & Accounting, Kangwon National University, Chuncheon-si 24341, Korea
*
Author to whom correspondence should be addressed.
Sustainability 2022, 14(5), 2834; https://doi.org/10.3390/su14052834
Submission received: 18 January 2022 / Revised: 22 February 2022 / Accepted: 25 February 2022 / Published: 28 February 2022
(This article belongs to the Section Economic and Business Aspects of Sustainability)

Abstract

:
Corporate social responsibility (CSR) encompasses activities through which a firm ultimately achieves sustainable management by improving the society and environment. Contrary to the general perception that CSR activities can improve only the enterprise value (EV), they can also be strategically deployed based on agency problems (situational factors). Specifically, by focusing on the nature of related party transactions that exhibit high tendencies to introduce agency problems, this study analyzes whether South Korean firms that engage in such transactions perform CSR activities more actively than those that do not. The empirical analysis reveals that firms that engage in related party transactions exhibit increased CSR activity scores, indicating that managers are more likely to deploy CSR activities as a tool for managing their image and concealing or embellishing illicit corporate transactions. Hence, CSR activities undertaken at the expense of shareholders may be opportunistically exploited as a tool for positively embellishing a firm’s image. However, it is observed that chaebol companies do not strategically exploit CSR activities, despite being engaged in related party transactions. Thus, chaebol companies that are registered with a large business group and under the supervision system of the government are unlikely to opportunistically exploit CSR activities.

1. Introduction

Studies have reported mixed results regarding the impact of corporate social responsibility (CSR) activities on enterprise value (EV). On the one hand, the research supporting the positive impact of CSR reported that companies that actively perform CSR activities conduct transparent financial reporting and strive to comply with the applicable laws [1,2]. Thus, capital market investors rate such companies highly and apply low capital costs; this implies that CSR activities may ultimately increase EV. On the other hand, other studies have generated skepticism. For example, Hemingway and Maclagan argued that firms may pursue CSR activities to conceal their illicit conduct from external stakeholders [3]. Considering the cost of performing CSR activities, these activities may act as a factor that reduces EV if a manager nurtures opportunistic intentions. In particular, researchers have observed that managers of firms with severe agency problems will most likely perform CSR activities to pursue personal interests or opportunistically manage their images amid the consequent relatively large information asymmetry between them and their shareholders [4].
An agency problem arises when an individual or a group facilitates decision-making processes that are directly related to their interests. Dissimilar to the situation in developed countries with widely dispersed stock ownership, systematic laws, and institutional mechanisms for minority shareholders, the agency problem between controlling and minority shareholders, rather than between managers and shareholders, is attracting attention as a factor that impedes EV in South Korea and other East Asian countries. Contrary to previous studies that focused on the agency problem between professional managers and external shareholders, this study examines the relationship between the agency problems and CSR of companies in emerging Asian countries, thereby establishing the originality of this study. Researchers have reported that controlling shareholders in companies in emerging Asian countries are infringing on the interests of minority shareholders by transferring corporate assets and profits to other affiliates under their control [5]. In South Korea, controlling shareholders exploit related party transactions (RPTs) as a tool for pursuing their interests. RPTs are the transactions between a firm and its principal shareholders, directors, or affiliated companies [6].
Employing RPT as a proxy variable of the agency problem, this study investigates the impact of RPTs on a firm’s CSR activities. To verify this, regression analysis was performed employing RPTs as an independent variable; the CSR scores of each company, as announced by the Korea Economic Justice Institute (KEJI), were employed as a dependent variable. The results revealed a significantly positive (+) relationship between RPTs and CSR activities. This result indicates that the management, i.e., the controlling shareholder of a company dealing with related parties, employs CSR activities strategically to package the company with a transparent and trustworthy image, while simultaneously protecting their reputations or private interests. Concurrently, the effective supervision of a firm can impede the opportunistic behaviors of its management [7,8]. Accordingly, this study analyzed South Korean chaebol companies (designated as a large business group and subjected to monitoring and supervision by the Fair Trade Commission), thus confirming the decrease in the significantly positive (+) relationship between RPTs and CSR activities. These findings can help investors make informed decisions employing information regarding a firm’s CSR activity by verifying whether external supervision suppresses the opportunistic exploitation of these activities, even for firms with severe agency problems.
The remainder of this study is structured thus: Section 2 reviews the previous studies on CSR and RPTs to formulate the related research hypotheses; Section 3 describes the sampling process and research method; and Section 4 presents the results of the empirical analysis, as well as the discussion. Finally, Section 5 summarizes the research findings and concludes the study.

2. Literature Review and Hypothesis Development

2.1. CSR Activities

CSR activities are the activities through which a for-profit company aims to increase its ethical, legal, social, and environmental value beyond the original purpose of pursuing profit. These activities can contribute to the firm and improve its social development and EV. However, there are two opposing views regarding the impact of CSR activities on firms. First, Jones argued that firms are incentivized to engage actively in CSR activities because of the perception that honest, trustworthy, and ethical firms ultimately enjoy enhanced EVs [9]. Similarly, Waddock and Graves reported that firms target increased sales and enhanced EVs by building a positive image via CSR activities [10]. Furthermore, Chih et al. noted that firms that engage actively in CSR activities exhibit low incentives toward engaging in earnings management because they do not intentionally aim to conceal unfavorable information [2]. Finally, Kim et al. also indicated that firms with excellent CSR activities conduct less accrual-based and real earnings management compared with those without excellent CSR activities [11].
Second, previous analyses from the agency cost perspective negatively portrayed the motives behind CSR activities [4,12]. For instance, Barnea and Rubin argued that managers of firms with high agency costs may overspend on CSR because they are responsible for the final decisions, even though such expenditures are borne by the shareholders [4]. Comparably, Prior et al. observed a significantly positive relationship between CSR activities and earnings management, and reported that firms with severe agency problems opportunistically engage in earnings management while employing CSR activities as a tool to evade stakeholders’ supervision [13]. By analyzing companies in Bangladesh, Muttakin et al. [14] established a positive (+) relationship between a company′s CSR disclosure level and its earnings management. They argued that companies whose managers undertake CSR for opportunistic incentives exhibit a high tendency to engage in earnings management. Salewski and Zulch [15] analyzed the relationship between CSR and earnings management in European countries that follow International Financial Reporting Standards (IFRS), and observed that the companies with higher CSR levels were engaged in earnings management and did not promptly disclose unfavorable news. Overall, previous studies revealed that managers of firms with high agency costs are more likely to strategically engage in CSR activities as a tool to manage their corporate image and build or maintain their reputations than those of firms with low agency costs [16,17].

2.2. RPT

In South Korean, as well as other East Asian companies, stock ownership is limited to a few individuals, and this controlling family (the controlling shareholders and managers) exercises tremendous control over the company. Specifically, beyond direct ownership, the controlling shareholders exercise pyramidal governance and have a mutual cross-ownership of company stocks [18,19,20,21,22,23]. In the event of a gap between ownership and control, these shareholders can enjoy decision-related benefits that are commensurate with their controlling interests, while only bearing decision-related risks that are commensurate with their owned shares, thus raising the likelihood that managers and controlling shareholders would make decisions that contradict their EVs [21]. Simultaneously, internal control systems, such as the board of directors and audit committees, cannot effectively perform their functions if the controlling shareholders gain control of the firm, and this will impede the proper supervision of managers and controlling shareholders [18,24].
Furthermore, these shareholders employ RPTs as a tool for moving funds from a low-level firm to a higher-level firm (tunneling) or supporting another company (propping). Tunneling, which infringes on the interests of non-controlling shareholders, is more common than propping [5,25]. These transactions between related parties include the sales and purchases of products (although this is its most widely employed form), as well as service and asset transactions, such as real estate, loans, payment guarantees, and collateral. The Korean International Financial Reporting Standards 1024 define a related party as a related company that exerts a significant influence on the business policies and corporate management of the reporting entity. This includes individuals, such as the shareholders and executives of related companies and individuals’ relatives, who exhibit a close transactional relationship with the reporting entities. As unfair insider transactions can be due to RPTs, current accounting standards require companies to disclose the details of related parties and transactions in their consolidated and separate financial statements. Nevertheless, a large information asymmetry emerges because of the challenge of elucidating the nature of RPTs, which are disclosed in the footnotes of the financial statements, to external investors, such as the minority shareholders.

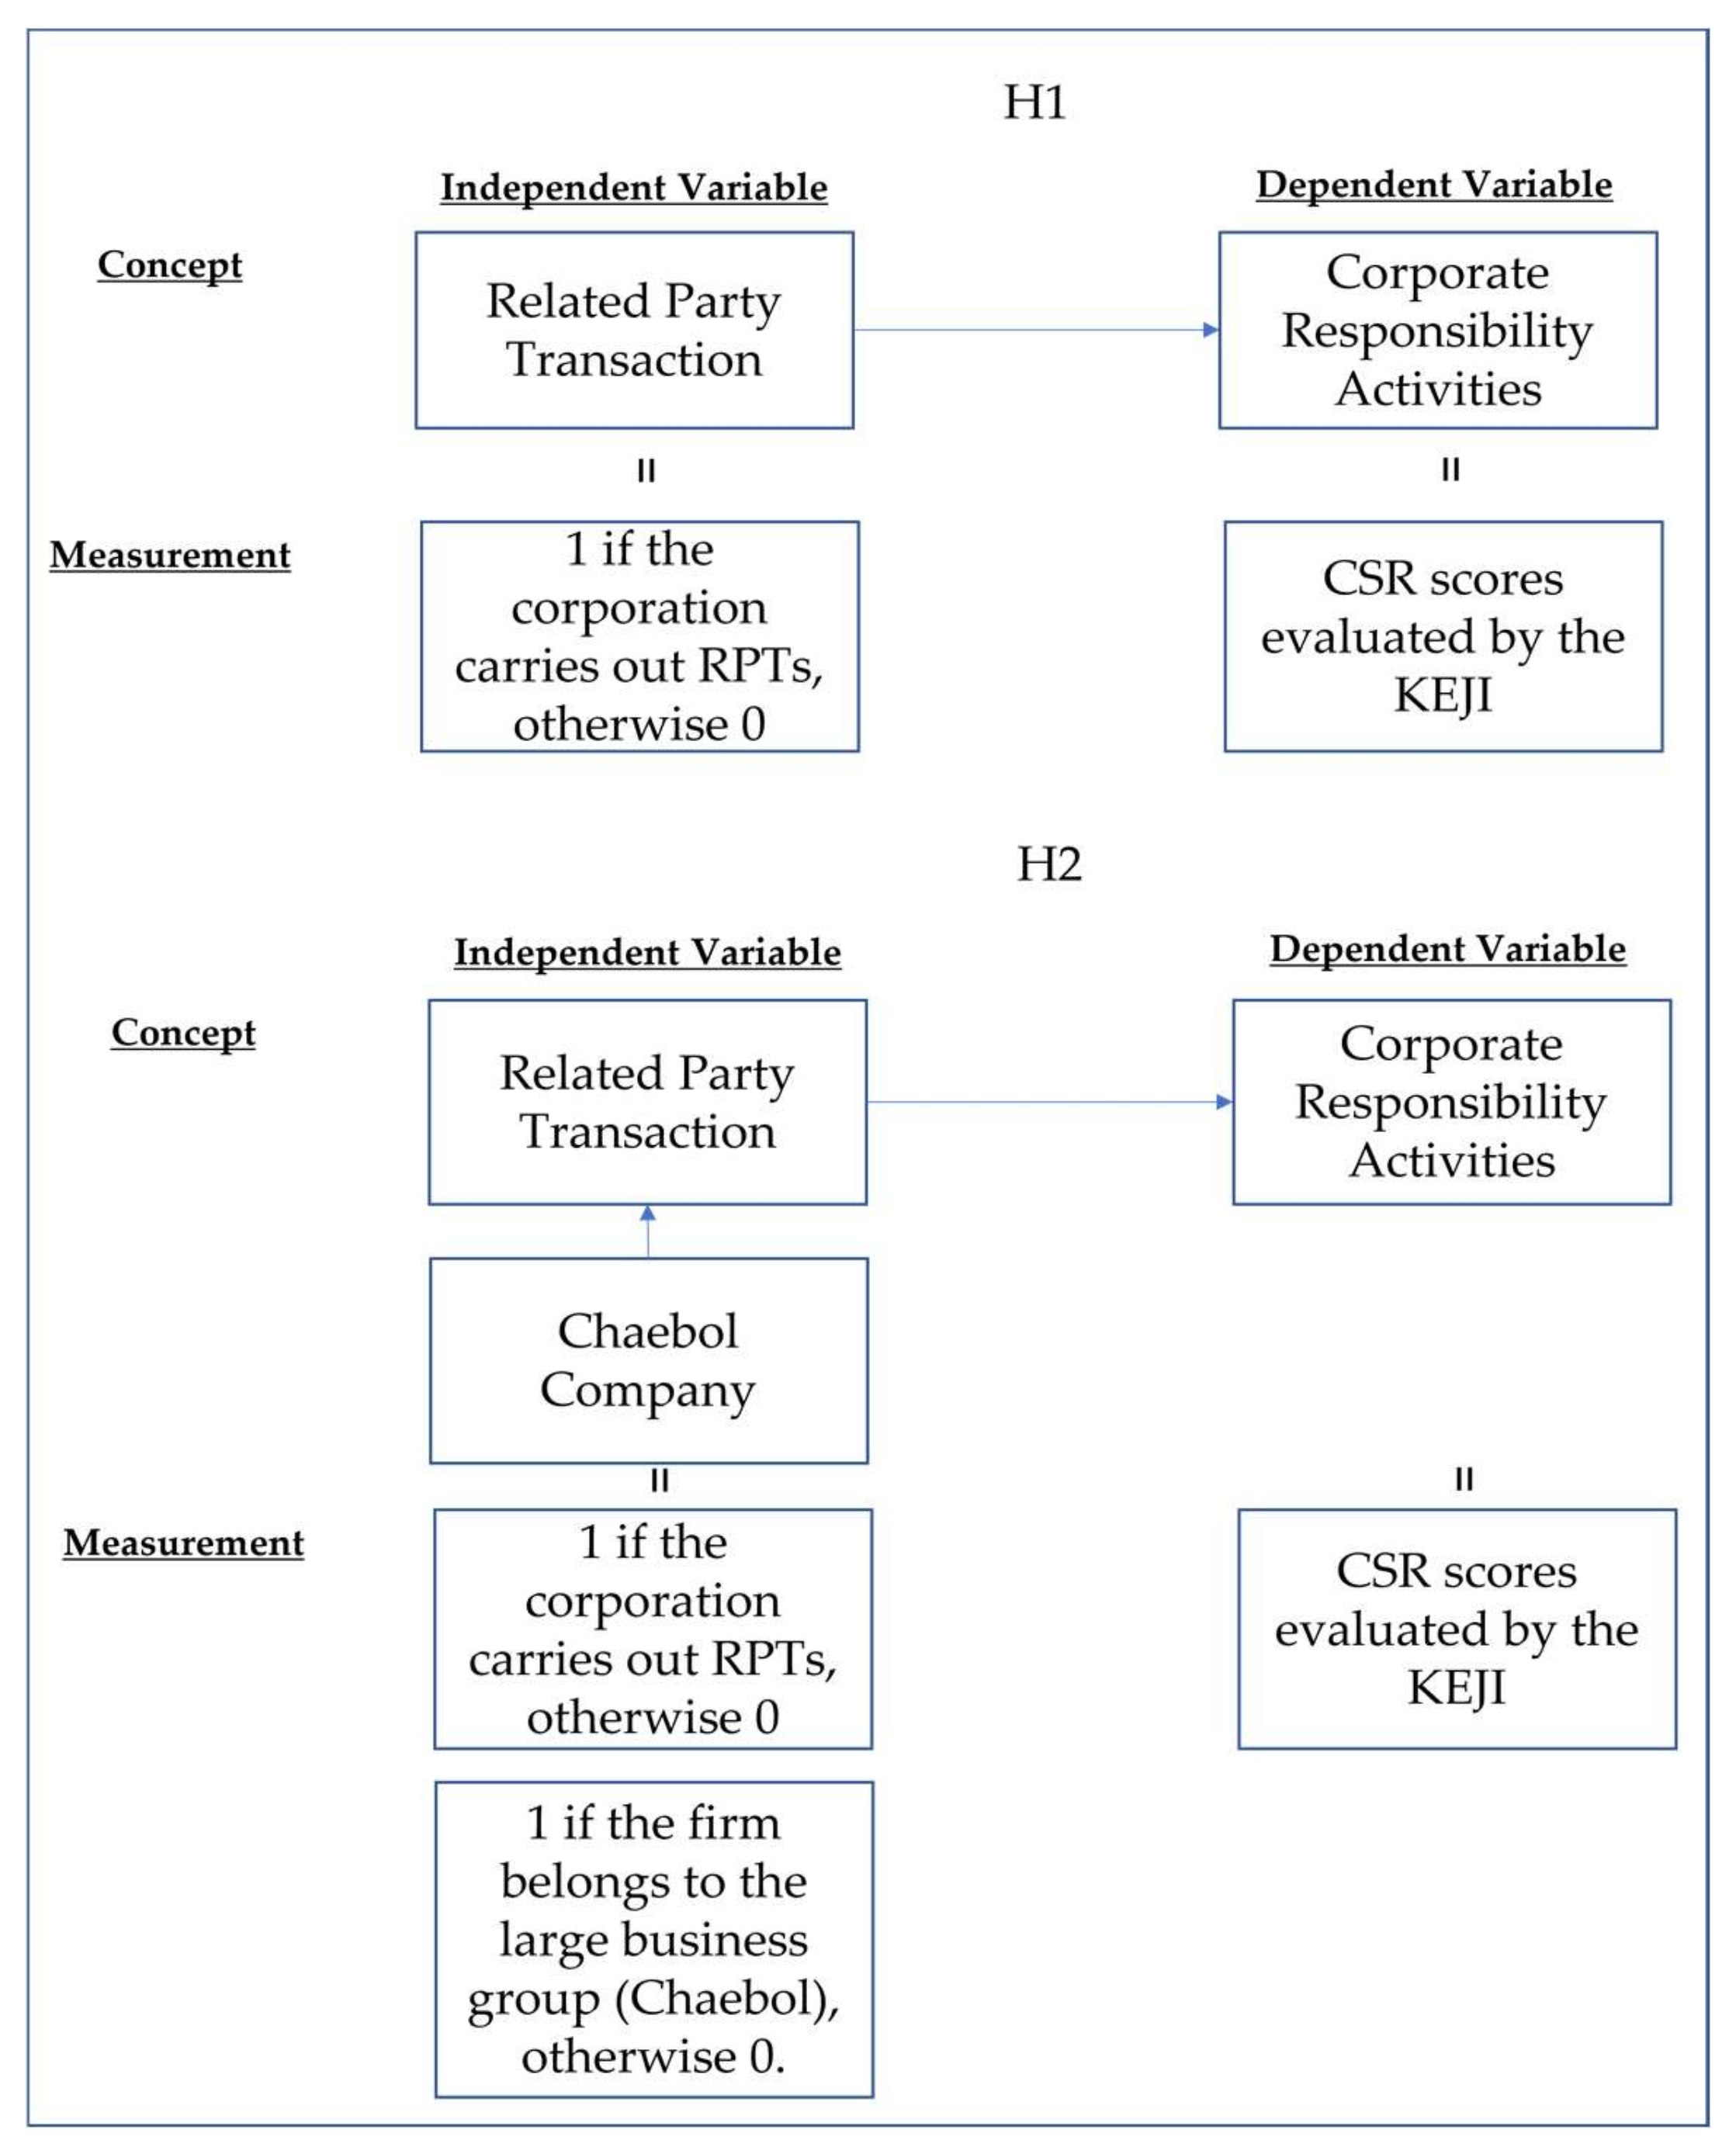
2.3. Hypothesis Formulation

The controlling shareholders might pursue their interests by moving funds to other affiliates under their control, thus infringing on the interests of the minority shareholders [19,24,26]. As it is challenging for minority shareholders to directly supervise and control RPTs, the controlling shareholders can readily utilize these transactions as a tool for transferring funds. Concurrently, CSR activities can be opportunistically deployed as a tool for image management [4]. A firm can portray itself as transparent and trustworthy through CSR activities, while also ulteriorly exploiting them to hide the management’s pursuit of personal interests or inappropriate behaviors. Although shareholders bear the cost of CSR activities, the managers of firms exhibiting a large information asymmetry between managers and shareholders would likely strategically engage in CSR activities to pursue their interests or enhance their reputation [27].
Moreover, the controlling shareholders of a firm that engages in RPTs do not want the disclosure of the company’s information, related to their interests, to the market. Accordingly, Verrecchia reported that these shareholders tended to lower the firm’s disclosure level [28]. Thus, present accounting standards in South Korea require the full disclosure of such related details, because it is clear that individuals who exert a significant influence or exercise substantial control over a firm might obtain unfair benefits through RPTs. CSR activities might exhibit a positive relationship with RPTs if the CSR activities are abused as a tool to conceal illicit corporate conducts, pursue personal interests, or increase the reputations of the controlling shareholders and managers under their control. When engaging in transactions that are accompanied by agency problems, such as RPTs, firms would engage in CSR activities much more actively than other firms if such firms intend to embellish their corporate image and if their managers intend to build their reputation through CSR activities. Thus, the following hypothesis is formulated:
Hypothesis 1:
Firms that engage in RPTs are more likely to actively conduct CSR activities.
Furthermore, a chaebol, representing a group of companies whose ownership is concentrated in a specific person or their relatives, owns multiple affiliates and exercises direct control over the management. South Korean chaebols comprise numerous companies operating in different markets; many of these member companies exhibit monopolies over their respective markets. Individual owners, as well as their families or blood relatives, control these member companies and achieve early growth owing to the protection and support of the government. As South Korean chaebols participate actively in the economic development policies, they contribute greatly to the growth and development of the national economy by accumulating capital and developing technology. However, they are also criticized for their excessive weight on the economy, government-dependent growth, irrational management methods, market monopolization, real estate speculations, and environmental pollution. Thus, the Fair Trade Act implemented the “large business group system” to promote the balanced development of the national economy by suppressing the over-concentration of economic power in chaebols. In this context, companies that are designated as part of a business group are subjected to restrictions on mutual investments and debt guarantees, thus controlling the concentration of economic power through RPTs.
Previous studies have reported that the effective supervision and monitoring of firms can control and inhibit the opportunistic behaviors of their managers [7,8]. Specifically, researchers have observed that the controlling shareholders of South Korean chaebol companies engaged in RPTs to pursue personal interests. However, as they are under strict government supervision as a large business group, their managers have fewer incentives to deploy CSR activities to pursue personal interests and corporate image management. Therefore, the second hypothesis is formulated:
Hypothesis 2:
Chaebol companies will not actively engage in CSR activities based on RPTs.

3. Methodology

To test the hypotheses, linear regression analyses were performed by employing RPT and the chaebol company as the independent variables, while the CSR score was employed as the dependent variable. Figure 1 illustrates the research framework of this study.
First, the collection method, as well as the sources of the related party transactions (RPTs) and corporate social responsibility (CSR) scores, are presented, after which the regression analysis models, including the control variables, are explained.

3.1. RPTs

As noted above, South Korean firms disclose their RPTs in the footnotes of their financial statements. Such related parties include the parent company, the subsidiaries, the associated companies, the major shareholders, their relatives, and the companies they own, as well as the key management and their relatives. RPTs include sales, purchases, and borrowing or lending. A firm must disclose all such transactions or face relevant sanctions if discovered by the Financial Supervisory Service. This study extracted information on company-specific related party sales, purchases, other revenues, and other expenses disclosed in the footnotes of financial statements from the database of the Korea Listed Companies Association (TS2000). Although the information on RPTs was presented as monetary amounts, the composition of the related parties, as well as the nature of the transactions, differed from firm to firm, and their contents were not clearly disclosed. Thus, this study determined the level of each firm’s agency problem based on whether it engaged in RPTs, thus making RPT a dummy variable. The agency costs and lack of information transparency due to RPTs were relatively high if a firm had an RPT value of 1.

3.2. CSR

To measure the level of a firm’s CSR activity, this study employed the firm-specific scores that were calculated employing the Korea Economic Justice Institute (KEJI) index. Since 1991, KEJI, which is a subsidiary of the Korean civic group, Citizens’ Coalition for Economic Justice, has evaluated and scored the social contribution activities of publicly listed companies and published lists, as well as scores, of the top 200 companies. The KEJI Index comprises six indicators that sum up to 100 points: (1) soundness, 25 points; (2) fairness, 20 points; (3) social contribution, 15 points; (4) consumer protection, 15 points; (5) environmental management, 10 points; and (6) employee satisfaction, 15 points. KEJI conducts quantitative and qualitative assessments of firms′ CSR activities. Annually, it selects firms with an excellent CSR for the “CCEJ Excellent Company Award”, and distributes the related data. To ensure data objectivity in the regression analysis, this study employed firm-specific assessment scores that were calculated during quantitative evaluation. Specifically, to test the hypotheses, the scores of the top 200 firms in the KEJI index were set as the dependent variable. In the additional analysis, the scores of the six sub-indicators were employed as the dependent variables.

3.3. Research Design and Sample Selection

Equation (1) was established to investigate whether a firm’s engagement in RPTs affects its social contribution activity levels and how it does so. Here, RPT is a dummy variable that indicates whether the firm conducted RPTs; the coefficient value of RPT, β1, is the coefficient of interest. The level of CSR activity, which is the dependent variable, was measured employing the total scores on the KEJI index. The interaction variable (RPT × CHA) is introduced in Equation (2) to investigate whether a firm, being a chaebol company (CHA), impacts the relationship between RPTs and CSR activities. Owing to the significant influence of chaebols on the economy of South Korea, the levels of CSR activities must change based on whether the firm is a chaebol. The latter are classified based on their mutual investment limitations, as disclosed by the Korea Fair Trade Commission; conglomerates with mutual investment limitations have assets exceeding 10 trillion KRW between all their affiliates. For Korean chaebol companies that are registered as part of a large business group and consequently subjected to supervision and monitoring, there must be a reduced or insignificant relationship between their RPTs and CSR activities.
CSR i , t = β 0 + β 1 RPT i , t + β 2 CHA i , t + β 3 SIZE i , t + β 4 LEV i , t + β 5 MB i , t + β 6 ROE i , t + β 7 LAR i , t + β 8 FOR i , t + IND + YR + ε i , t
CSR i , t = β 0 + β 1 RPT i , t + β 2 RPT × CHA i , t + β 3 CHA i , t + β 4 SIZE i , t + β 5 LEV i , t + β 6 MB i , t + β 7 ROE i , t + β 8 LAR i , t + β 9 FOR i , t + IND + YR + ε i , t   ,
where CSR indicates the CSR scores, evaluated by the KEJI index: RPT equals 1 if the corporation conducted RPTs, otherwise it was 0, and CHA equals 1 if the firm belonged to a large business group (chaebol), otherwise it was 0. SIZE represents the log(total assets), LEV is the total liabilities/total assets, MB reflects the ratio of the market value to the book value (market-to-book ratio) of the total assets, return on equity (ROE) is the net income/total equity, and LAR indicates the largest shareholder ownership. Furthermore, FOR represents the foreign investor ownership, ∑IND reflects the industry dummies, and ∑YR represents the year dummies. ε, i and t represent the error term, firm, and period, respectively.
Variables that generally influence CSR activities were included as control variables, following previous studies [29,30,31]. As large companies attract increased attention from the markets and are more motivated to actively engage in CSR than small companies, firm size (SIZE) was utilized as a control variable. Companies with high debt-to-equity ratios (LEV) cannot invest in CSR activities because of the financing costs. However, firms with a high growth and profitability have the wherewithal to engage in such activities. Thus, the MB and ROE ratios were also considered control variables. Additionally, LAR and FOR were utilized as corporate governance structure variables. The year and industry dummy variables were included to control the effects of their differences.
Finally, this study employed publicly listed firms whose RPT data between 2016 and 2018 were available. These data were limited to corporations that end their fiscal year in December; financial companies whose financial statement structures differ from those of other industries were excluded. The monetary amount of RPTs and the financial data were collected from the TS2000 and Kis value. Thus, the final analysis sample contained 689 firm years.

4. Results and Discussion

4.1. Descriptive Statistics and Correlation

Table 1 summarizes the descriptive statistics of the key variables utilized in this study. CSR, the dependent variable, represents the scores of the 200 firms with the best CSR activities, as published in the KEJI index. The RPT results indicated that ~85% of the sampled firms engaged in RPTs. For the control variables, the mean values of LAR and FOR revealed that they averaged 46% and 11%, respectively.
Table 2 illustrates the correlations between the variables. Specifically, the variables of interest (RPT and CSR activity levels) exhibited a positive but statistically insignificant correlation. Regarding the control variables, the CSR activity scores exhibited significant positive correlations with SIZE, growth (MB), and FOR, but significant negative correlations with LAR. Considering the challenge of verifying the validity of the hypotheses via bivariate correlation only, a multivariate regression analysis was conducted in the following section, considering the effects of the other variables.

4.2. Main Results

Impact of RPT on CSR

To test the hypotheses, this study first investigated the relationship of RPT with the CSR activity scores for the entire sample before introducing RPT × CHA (the interaction term between CHA and RPT) to perform the analysis. To determine whether a firm belonged to a chaebol, the firms were divided into two groups: (1) the chaebol group under the control of an external monitoring system, and (2) the non-chaebol group not under an external control. Table 3 presents the results of the empirical analysis for the entire sample. On the left column, the coefficient value of RPT (whether the firm engaged in RPTs) was a significant positive value. Thus, firms that engaged in transactions that might cause agency problems, e.g., RPTs, actively conducted CSR activities to obtain high CSR activity scores, indicating that they might have performed such activities strategically. Hence, regarding firms with high agency costs, CSR activities were externally exploited to manage the corporate images presented to stakeholders. Internally, such activities were potentially employed as opportunistic tools to pursue the private interests of the controlling shareholders and managers under their control or to conceal their illicit dealings. Additionally, the results of the RPT × CHA coefficient indicated that chaebol companies did not actively undertake CSR based on whether they engaged in RPTs.
These results correspond to previous findings, which noted that internal control systems, such as the board of directors and audit committees, do not generally function effectively in firms where the controlling shareholders exert control [18,24]. Thus, implementing an external monitoring system, such as the large business group system, can positively affect the agency problem between the controlling and minority shareholders. Furthermore, larger firms (SIZE) with higher growth rates (MB) are very likely to perform CSR activities and obtain improved CSR scores. However, firms with increased LEV and LAR are very passive about investing in CSR activities.
Table 4 presents the results of the group-specific analysis. The coefficient value of RPT was not significant for the chaebol group, but was significant for the non-chaebol group. This indicates that firms in the latter group invested more funds in CSR activities when they engaged in RPTs. The results reported in Table 4 are consistent with those reported in Table 3.

4.3. Further Analysis

Carroll, as well as Blindheim and Langhelle, defined CSR as a multilayered concept and categorized it into economic, legal, ethical, and philanthropic responsibilities [32,33]. CSR emphasizes a firm’s duties and responsibilities to impact society, while social contribution activities highlight the philanthropic aspects of CSR. Hence, CSR is a higher-level concept that encompasses social contribution activities. As described above, the KEJI index comprises six indicators, which include social contribution. The additional analysis employed the scores of these six indicators as the dependent variables.
Based on the analysis results in Table 5 and Table 6, only column (3) confirmed significant results for the hypotheses. In Table 5, the RPT coefficient value was only significantly positive in column (3), where the social contribution score was set as the dependent variable. This result confirmed that the firms engaged in RPTs invested considerably in philanthropic activities, and this result is consistent with the results of the main analysis. Thus, among the six factors (soundness, fairness, social contribution, consumer protection, environmental management, and employee satisfaction), firms engaged in RPTs focused on social contribution because it could produce positive results with a single investment. In Table 6, which includes the interaction term between RPT and CHA, the coefficient value of RPT was significantly positive only in column (3), whereas the coefficient value of RPT × CHA was significantly negative.

5. Implication, Conclusions, and Future Research

This study examines the relationship between a firm that engages in RPTs and its level of CSR activities from the agency cost perspective. Specifically, this study confirms that the information asymmetry between a firm’s internal and external parties accounts for the main situational factor that enables managers to conduct opportunistic CSR activities.
The empirical analysis results are as follows: firms that engage in RPTs have higher CSR scores than those that do not. Additionally, the positive relationship between the occurrence of RPTs and the levels of CSR activity decreases when the firm is part of a chaebol. To ensure the robustness of the research results, the entire sample was divided into chaebol and non-chaebol company groups to investigate the relationship between RPTs and the levels of CSR activities for each. Consistent with the main analysis results, only the non-chaebol group exhibited a significantly positive relationship.
The former result theoretically indicates that firms with high agency costs may exploit CSR activities as a tool for pursuing private interests or concealing the illicit conduct of the controlling shareholders and managers under their control. The latter result practically indicates that an external monitoring system can help prevent the controlling shareholders’ and managers’ opportunistic intentions in making CSR-related decisions. Overall, this study demonstrates that CSR activities may be opportunistically employed by firms with potential agency problems; in this case, the sustainability of companies and society may be undermined. Follow-up research on CSR is required, considering that CSR can exert two-way effects on sustainability.

Author Contributions

Conceptualization, S.-J.C. and H.R.; methodology, S.-J.C. and H.R.; formal analysis, S.-J.C. and H.R.; writing—original draft, S.-J.C. and H.R.; writing—review and editing, S.-J.C. and H.R.; funding acquisition, H.R. All authors have read and agreed to the published version of the manuscript.

Funding

This work was supported by the Ministry of Education of the Republic of Korea and the National Research Foundation of Korea (NRF-2021S1A5A8070518).

Institutional Review Board Statement

Not applicable.

Informed Consent Statement

Not applicable.

Data Availability Statement

Not applicable.

Conflicts of Interest

The authors declare no conflict of interest.

References

  1. Beaudoin, C.A. Earnings Management: The Role of the Agency Problem and Corporate Social Responsibility; Drexel University: Philadelphia, PA, USA, 2008. [Google Scholar]
  2. Chih, H.L.; Shen, C.H.; Kang, F.C. Corporate social responsibility, investor protection, and earnings management: Some international evidence. J. Bus. Ethics 2008, 79, 179–198. [Google Scholar] [CrossRef]
  3. Hemingway, C.A.; Maclagan, P.W. Managers’personal values as drivers of corporate social responsibility. JBE 2004, 50, 33–44. [Google Scholar]
  4. Barnea, A.; Rubin, A. Corporate social responsibility as a conflict between shareholders. J. Bus. Ethics 2010, 97, 71–86. [Google Scholar] [CrossRef]
  5. Jian, M.; Wong, T.J. Propping through related party transactions. Rev. Account. Stud. 2010, 15, 70–105. [Google Scholar] [CrossRef]
  6. Kang, M.J.; Lee, H.Y.; Lee, M.G.; Park, J.C. The association between related-party transactions and control-ownership wedge: Evidence from Korea. Pac. Basin Financ. J. 2014, 29, 227–296. [Google Scholar] [CrossRef]
  7. Ho, S.S.; Wong, K.S. A study of the relationship between corporate governance structures and the extent of voluntary disclosure. JIAAT 2001, 10, 139–156. [Google Scholar] [CrossRef]
  8. Karamanou, I.; Vafeas, N. The association between corporate boards, audit committees, and management earnings forecasts: An empirical analysis. J. Account. Res. 2005, 43, 453–486. [Google Scholar] [CrossRef]
  9. Jones, T.M. Instrumental stakeholder theory: A synthesis of ethics and economics. AMR 1995, 20, 404–437. [Google Scholar] [CrossRef]
  10. Waddock, S.A.; Graves, S.B. The corporate social performance–financial performance link. Strateg. Manag. J. 1997, 18, 303–319. [Google Scholar] [CrossRef]
  11. Kim, Y.; Park, M.S.; Wier, B. Is earnings quality associated with corporate social responsibility? Account. Rev., 2012, 87, 761–796. Account. Rev. 2012, 87, 761–796. [Google Scholar] [CrossRef]
  12. Jensen, M.C.; Meckling, W.H. Theory of the firm: Managerial behavior, agency costs and ownership structure. JFE 1976, 3, 305–360. [Google Scholar] [CrossRef]
  13. Prior, D.; Surroca, J.; Tribó, J.A. Are socially responsible managers really ethical? Exploring the relationship between earnings management and corporate social responsibility. Corp. Govern. Int. Rev. 2008, 16, 160–177. [Google Scholar] [CrossRef] [Green Version]
  14. Muttakin, M.B.; Khan, A.; Azim, M.I. Corporate social responsibility disclosures and earnings quality. Manag. Aud. J. 2015, 30, 277–298. [Google Scholar] [CrossRef]
  15. Salewski, M.; Zulch, H. The Impact of Corporate Social Responsibility (CSR) on Financial Reporting Quality-Evidence from European Blue Chips; HHL Leipzig Graduate School of Management: Saxony, Germany, 2012. [Google Scholar]
  16. Verschoor, C.C. Is there financial value in corporate values? Strateg. Financ. 2005, 87, 17–18, Gale Academic OneFile. Available online: link.gale.com/apps/doc/A133858703/AONE?u=anon~3e1d4d99&sid=googleScholar&xid=0ea1a0b7 (accessed on 10 February 2022).
  17. Linthicum, C.; Reitenga, A.; Sanchez, J. Social responsibility and corporate reputation: The case of the Arthur Andersen Enron audit failure. J. Account. Public Policy 2010, 29, 160–176. [Google Scholar] [CrossRef]
  18. La Porta, R.; Lopez-de-Silanes, F.; Shleifer, A. Corporate ownership around the world. J. Finance 1999, 54, 471–517. [Google Scholar] [CrossRef]
  19. Claessens, S.; Djankov, S.; Lang, L. The separation of ownership and control in East Asian corporations. JFE 2000, 58, 81–112. [Google Scholar] [CrossRef]
  20. Classens, S.; Djankov, S.; Fan, J.; Lang, L. Disentangling the incentives and entrenchment effects of large shareholdings. J. Financ. 2002, 57, 2741–2771. [Google Scholar] [CrossRef]
  21. Fan, J.; Wong, T.J. Corporate ownership structure and the informativeness of accounting earnings in East Asia. JAE 2002, 33, 401–425. [Google Scholar]
  22. La Porta, R.; Lopez-de-Silanes, F.; Shleifer, A.; Vishny, R. Investor protection and corporate valuation. J. Financ. 2002, 57, 1147–1170. [Google Scholar] [CrossRef]
  23. Gwon, J.H. Formation of corporate governance in Korea: The rise of chaebols (1910–1980). EAJBM 2015, 5, 67–72. [Google Scholar] [CrossRef]
  24. Shleifer, A.; Vishny, R.W. A survey of corporate governance. J. Financ. 1997, 52, 737–783. [Google Scholar] [CrossRef]
  25. Cheung, Y.; Qi, Y.; Rau, P.R.; Stouraitis, A. Buy high, sell low: How listed firms price asset transfers in related party transactions. JBF 2009, 33, 914–924. [Google Scholar] [CrossRef]
  26. Johnson, S.; Boone, P.; Breach, A.; Friedman, E. Corporate governance in the Asian financial crisis. JFE 2000, 58, 141–186. [Google Scholar] [CrossRef] [Green Version]
  27. Harjoto, M.A.; Jo, H. Corporate governance and CSR nexus. JBE 2011, 100, 45–67. [Google Scholar] [CrossRef]
  28. Verrecchia, R. Discretionary disclosure. JAE 1983, 5, 179–194. [Google Scholar] [CrossRef]
  29. Amato, L.H.; Amato, C.H. The effects of firm size and industry on corporate giving. J. Bus. Ethics 2007, 3, 229–241. [Google Scholar] [CrossRef]
  30. Kim, B.; Pae, J.; Yoo, C. Business groups and tunneling: Evidence from corporate charitable contributions by Korean companies. J. Bus. Ethics 2017, 154, 1–24. [Google Scholar]
  31. Yoo, C.; Pae, J. Corporate charitable contributions: Business award winners’ giving behaviors. Bus. Ethics Euro. Rev. 2016, 25, 25–44. [Google Scholar] [CrossRef]
  32. Carroll, A.B. A three-dimensional conceptual model of corporate performance. AMR 1979, 4, 497–505. [Google Scholar] [CrossRef]
  33. Blindheim, B.T.; Langhelle, O. A reinterpretation of the principles of CSR: A pragmatic approach. Corp. Soc. Responsib. Environ. Manag. 2010, 17, 107–117. [Google Scholar] [CrossRef] [Green Version]
Figure 1. Flow diagram for hypothesis testing.
Sustainability 14 02834 g001
Table 1. Descriptive statistics (n = 689).
VariableMeanSDMin25%Median75%Max
CSR62.3432.95952.86360.32862.48464.26972.264
RPT0.8450.3620.0001.0001.0001.0001.000
CHA0.1840.3880.0000.0000.0000.0001.000
SIZE26.8191.11324.46126.07826.68227.43730.864
LEV0.7640.7580.0010.2490.5800.9836.867
MB1.3021.1080.2790.6480.9651.5107.131
ROE0.0550.092−1.0680.0210.0480.0870.632
LAR0.4550.1680.0750.3460.4610.5492.493
FOR0.1100.1290.0000.0250.0640.1490.771
CSR: CSR scores evaluated by the KEJI index (RPT = 1 if the corporation conducted RPTs, otherwise 0 and CHA = 1 if the firm belonged to a large business group (chaebol), otherwise 0), SIZE: ln(total assets); LEV: total liabilities/total assets, MB: market-to-book ratio of the total assets, ROE: net income/total equity; LAR: largest shareholder ownership; FOR: foreign investor ownership.
Table 2. Pearson correlation (n = 689).
CSRRPTCHASIZELEVMBROELARFOR
CSR1.0000.043−0.0450.065−0.0630.1430.062−0.1730.107
(0.2647)(0.2358)(0.089)(0.1011)(0.0002)(0.1045)(<0.0001)(0.0051)
RPT 1.0000.0280.1120.021−0.098−0.0500.0750.024
(0.4609)(0.0034)(0.5772)(0.01)(0.1868)(0.0484)(0.5213)
CHA 1.0000.4520.074−0.1070.024−0.0060.137
(<0.0001)(0.0516)(0.0048)(0.534)(0.8681)(0.0003)
SIZE 1.0000.158−0.0770.0990.0670.426
(<0.0001)(0.044)(0.0091)(0.0804)(<0.0001)
LEV 1.0000.074−0.185−0.050−0.117
(0.0509)(<0.0001)(0.1928)(0.0021)
MB 1.0000.118−0.1430.032
(0.002)(0.0002)(0.3959)
ROE 1.000−0.0180.123
(0.6397)(0.0012)
LAR 1.000−0.075
(0.0498)
FOR 1.000
The p-values are given in parentheses. Please refer to Table 1 for the definition of variables.
Table 3. Effect of RPT on CSR.
Variables(1) Y = CSR(2) Y = CSR
Coef.t-ValueCoef.t-Value
Intercept52.747(16.15) ***52.365(16.09) ***
RPT0.610(2.00) **0.947(2.86) ***
CHA−0.605(−1.9) *1.168(1.53)
RPT × CHA −2.055(−2.55) **
SIZE0.359(2.86) ***0.362(2.89) ***
LEV−0.493(−3.05) ***−0.465(−2.88) ***
MB0.315(3.09) ***0.314(3.1) ***
ROE0.314(0.25)0.353(0.29)
LAR−2.160(−3.2) ***−2.232(−3.31) ***
FOR0.102(0.11)0.137(0.14)
Σ IND, ΣYRIncludedIncluded
Adjusted R20.11160.1189
F Statistics5.32 ***5.42 ***
Sample Size689689
For variable definitions, please refer to Table 1. ***, **, and * represent the significances at the 1%, 5%, and 10% levels, respectively.
Table 4. Chaebol vs. non-chaebol sample.
Variables(1) Chaebol Sample(2) Non-Chaebol Sample
Coef.t-ValueCoef.t-Value
Intercept68.604(8.75) ***48.236(12.29) ***
RPT−0.813(−1)0.915(2.75) ***
SIZE−0.282(−0.94)0.526(3.51) ***
LEV−0.109(−0.26)−0.547(−3.1) ***
MB1.152(2.36) **0.264(2.55) **
ROE−1.056(−0.25)−0.171(−0.13)
LAR−1.829(−0.92)−1.885(−2.59) ***
FOR2.510(0.96)−0.673(−0.64)
Σ IND, ΣYRIncludedIncluded
Adjusted R20.12880.1246
F Statistics2.03 **5.20 ***
Sample Size127562
Please refer to Table 1 for variable definitions. ***, **, and * represent the significance at the 1%, 5%, and 10% levels, respectively.
Table 5. Additional analysis 1.
Variables(1) Y = CSR1(2) Y = CSR2(3) Y = CSR3(4) Y = CSR4(5) Y = CSR5(6) Y = CSR6
Coef.t−ValueCoef.t-ValueCoef.t-ValueCoef.t-ValueCoef.t-ValueCoef.t-Value
Intercept7.583(3.27) ***16.979(10.64) ***1.193(0.66)10.250(17.26) ***3.515(6.71) ***12.559(8.52) ***
RPT−0.063(−0.29)0.019(0.13)0.535(3.19) ***−0.019(−0.35)−0.001(−0.04)0.112(0.82)
CHA0.301(1.33)−1.116(−7.16) ***0.000(0) **0.008(0.15)0.197(3.88) ***−0.015(−0.11)
SIZE0.352(3.94) ***−0.038(−0.62)0.170(2.46) ***−0.008(−0.39)0.050(2.5) **−0.137(−2.41) **
LEV−0.285(−2.48) **−0.124(−1.58)−0.134(−1.51) **0.000(0.01)0.017(0.69)−0.006(−0.09)
MB0.172(2.38) **0.069(1.4)0.138(2.48)−0.038(−2.08) **−0.028(−1.78) *−0.001(−0.04)
ROE−1.158(−1.32)0.032(0.05)0.353(0.52) **0.166(0.74)0.578(2.86) ***0.063(0.11)
LAR−2.213(−4.61) ***−0.052(−0.16)0.347(0.94)−0.241(−1.97) **−0.153(−1.42)0.101(0.33)
FOR0.605(0.88)0.197(0.42)0.310(0.58)−0.262(−1.5)0.163(1.05)−0.767(−1.76) *
Σ IND, ΣYRIncludedIncludedIncludedIncludedIncludedIncluded
Adjusted R20.09240.08810.04610.07920.13620.0254
F Statistics4.50 ***4.33 ***2.66 ***3.96 ***6.34 ***1.90 **
Sample Size689689689689689689
Please refer to Table 1 for variable definitions. ***, **, and * represent the significances at the 1%, 5%, and 10% levels, respectively.
Table 6. Additional analysis 2.
Variables(1) Y = CSR1(2) Y = CSR2(3) Y = CSR3(4) Y = CSR4(5) Y = CSR5(6) Y = CSR6
Coef.t-ValueCoef.t-ValueCoef.t-ValueCoef.t-ValueCoef.t-ValueCoef.t-Value
Intercept7.600(3.27) ***16.919(10.59) ***0.974(0.54)10.214(17.19) ***3.495(6.67) ***12.521(8.48) ***
RPT−0.078(−0.33)0.072(0.44)0.729(4.01) ***0.011(0.19)0.018(0.34)0.146(0.97)
RPT × CHA0.092(0.16)−0.322(−0.81)−1.183(−2.67) ***−0.190(−1.3)−0.120(−0.94)−0.203(−0.56)
CHA0.221(0.4)−0.838(−2.23) **1.021(2.43) **0.173(1.24)0.301(2.47) **0.160(0.46)
SIZE0.352(3.93) ***−0.037(−0.61)0.172(2.5) **−0.008(−0.38)0.050(2.5) **−0.136(−2.41) **
LEV−0.286(−2.49) **−0.120(−1.51)−0.117(−1.33)0.003(0.1)0.019(0.75)−0.004(−0.05)
MB0.172(2.38) **0.069(1.4)0.138(2.48) **−0.038(−2.09) **−0.029(−1.78) *−0.002(−0.04)
ROE−1.160(−1.32)0.038(0.06)0.375(0.55)0.169(0.75)0.580(2.87) ***0.067(0.12)
LAR−2.210(−4.59) ***−0.063(−0.19)0.306(0.83)−0.248(−2.02) **−0.157(−1.46)0.094(0.31)
FOR0.603(0.88)0.202(0.43)0.330(0.63)−0.259(−1.48)0.166(1.07)−0.763(−1.75) *
Σ IND, ΣYRIncludedIncludedIncludedIncludedIncludedIncluded
Adjusted R20.09110.08770.08360.08010.13610.0244
F-Statistics4.28 ***4.15 ***2.90 ***3.85 ***6.08 ***1.82 **
Sample Size689689689689689689
Please refer to Table 1 for variable definitions. ***, **, and * represent the r-significance at the 1%, 5%, and 10% levels, respectively.
Publisher’s Note: MDPI stays neutral with regard to jurisdictional claims in published maps and institutional affiliations.

