Article

The Codevelopment of Mangroves and Infaunal Community Diversity in Response to the Natural Dynamics of Mud Deposition in French Guiana

1
University Brest, CNRS, IRD, Ifremer, LEMAR, 29280 Plouzané, France
2
Laboratoire Ecologie Fonctionnelle et Environnement, Université de Toulouse, CNRS, INP, 31062 Toulouse, France
3
School of Marine and Atmospheric Science, Stony Brook University, Stony Brook, New York, NY 11794-5000, USA
4
Aix-Marseille Université, CNRS, IRD, INRA, Coll France, CEREGE, 13545 Aix-en-Provence, France
5
USR LEEISA, 97334 Cayenne, France
6
University Brest, CNRS, IRD, Observatoire OSU-IUEM, 29280 Plouzané, France
*
Author to whom correspondence should be addressed.
Sustainability 2022, 14(5), 2829; https://doi.org/10.3390/su14052829
Submission received: 10 December 2021 / Revised: 10 February 2022 / Accepted: 24 February 2022 / Published: 28 February 2022
(This article belongs to the Special Issue Mangrove Ecosystem Ecology, Conservation and Sustainability)

Abstract

:
The sustainability of mangrove ecosystems requires a knowledge of their spatiotemporal variability as a function of regional properties. The unique coastal ecosystems of the mangrove belt along the coast of the Guianas in South America are influenced by cycles of a massive accretion of mud supplied by the Amazon River and wave induced erosion. This study characterized, for the first time, how benthic infaunal assemblages, as proxies of mechanisms of mangrove resilience, were structured by the natural growth track of Avicennia germinans dominated mangroves in French Guiana. We sampled 4 mobile mud stations and 27 consolidated mud stations distributed over 9 tidal transects from bare to vegetated mudflats colonized by young mangroves during the dry season. We collected a complete dataset of sediment and vegetation variables together with the benthic meso- (>0.25 mm) and macrofauna (>1 mm). We used a combination of eigenvector based multivariate analyses and variance partitioning on this multiple set of variables to identify which environmental variables likely drive the benthic diversity patterns. Mangrove early development increased the alpha and beta diversities of the infaunal communities for the two size classes. A total of 20–30% and 7–12% of the beta diversity are explained by linear and nonlinear spatial variables, respectively. However, 7% to 9% of the variance partioning could be determined by other biotic/abiotic variables, biological interactions or neutral processes, not described here. This study has highlighted the necessity of taking into account mangrove dynamics at suitable spatial scales for benthic biodiversity evaluation and mangrove management or restoration plans.

1. Introduction

Mangroves are one of the most productive ecosystems along subtropical and tropical coastlines. These systems are threatened by a range of anthropogenic pressures, including deforestation, pollution, and urbanization, and by climate changes, including recurrent droughts, sea level rise, cyclones, and coastal erosion [1]. It has been estimated that 35% of the world’s mangroves are degraded or have been lost [2]. Key ecosystem services provided by mangroves (i.e., feeding areas, nurseries, blue carbon, sediments and contaminants retention, bioremediation), and strongly aided by benthic biodiversity [3,4,5], are thus weakened [6]. One of the main difficulties for mangrove management and restoration strategies, however, is the lack of knowledge regarding mangrove ecosystem functioning and its spatial and temporal variabilities. This lack of knowledge often leads to a selection of small numbers of sites based on poorly defined criteria/variables, and, ultimately, to monospecific plantations that reduce biotic interactions between animal and plant species, and the diversity of ecological functions [7,8]. The efficient sustainability of mangroves requires better characterization of these spatial and temporal variabilities as a function of regional characteristics, and in response to the various environmental and anthropogenic pressures that constraint mangrove functioning [9].
Mangrove forest structure is characterized by specific zonation along the intertidal gradient, each plant belt dominated by a tree species [10]. The composition and structure of macrobenthic faunal communities change with this succession of the mangrove forest, in response to variations in substrate elevation, local geomorphology, salinity, predation, food resources and hydroperiod within each plant zone [5,11,12,13,14,15]. This pattern suggests that several benthic species may be good indicators of successional stages [16,17]. The main taxa of mangrove benthic assemblages within sediments are annelids, crustaceans, mollusks and insects, but their respective abundances and species richness are highly variable between and within the same mangrove area due to local habitat heterogeneity [3,18]. Benthic species richness is known to be lower in mangroves than in adjoining habitats such as seagrass beds or sandy beaches [19]. However, benthic infaunal biodiversity is often under-estimated in mangroves and not easily compared both among mangrove zones and with adjoining habitats because of different sampling strategies and taxonomic resolutions [5]. Despite low benthic species richness in mangroves, communities are composed of highly abundant small sized individuals [20]. Indeed, Dittmann [21,22] emphasized the need to consider mesofauna (0.25 < x < 1 mm; [23]) in addition to macrofauna (x > 1 mm) to describe the whole benthic infaunal assemblage in tropical intertidal mudflats and mangroves.
The French Guiana (FG) coast in northeastern South America is controlled by a mud supply from the Amazon River and it’s alongshore transport. In addition to coastal FG, the 1500 kilometer-long muddy tract includes the coast of Brazil west of the mouths of the Amazon River, the coasts of Surinam and Guyana, and the mouths of the Orinoco River in eastern Venezuela, collectively referred to as the Guianas coast. Mangrove distribution and dynamics on the Guianas coast are constantly affected by an alternation of accretion and erosion phases determined by the onshore welding of mud banks and their reworking by waves [24,25,26]. Shore attached mud banks periodically migrate along the coast (i.e., mobile muds), become topographically elevated during continuous mud accretion, and consolidate, allowing pioneer mangroves to colonize the substrate and develop extremely rapidly. Vast monospecific Avicennia germinans dominated forests have developed in FG, contrary to other worldwide mangroves that display specific tree succession over short (<km) distances [27,28]. Rates of mud consolidation and mangrove development previously measured (tree growth up to ~2 m.yr−1) are probably the fastest worldwide [27,29].
Previous studies of the benthic infaunal communities in the mobile muds and newly accreted bare sediments along the north Brazil, FG, and Surinam coasts have shown a low taxonomic richness of macrofauna (>1 mm) [30,31,32,33]). Two recent studies in FG demonstrated that mesofauna (>0.25 mm) was abundant in consolidated bare muds, with bioturbation activity as high as that of macrofauna in young mangroves [34,35]. However, the spatial distribution of benthic meso- and macrofaunal communities along the mangrove age gradient and the environmental variables that drive them remain to be determined. This information is essential to better characterize the functioning of this ecosystem and necessary for designing sustainable coastal zone management under the influence of the Amazon River discharge. This knowledge is particularly critical, given the fact that the FG coast is still largely exempt from the impacts of human activities and thus could, provide insight into benthic community responses to natural disturbance cycles. Unlike FG, where mangrove removal by humans has been extremely limited [36], Surinam, and especially Guyana, have been drastically affected, leading to enhanced land erosion and flooding, and the natural loss of resilience [37,38]. Mangroves in neighbouring Brazil are also threatened by deforestation and pollution [39]. These regional threats are exacerbated by climate change and predicted sea level rises [40].
Although FG mangroves are Avicennia germinans dominated, benthic biodiversity is expected to respond rapidly to mangrove maturation at both the α and β diversity levels. α diversity refers to the number of species/taxa in communities, whereas β diversity relates to changes in community composition and structure among localities or along a gradient [41]. We hypothesized that the natural mangrove development associated with changes in the physical and biogeochemical properties of the sediments would increase both benthic α and β diversities. Specifically, this study aimed to: (1) characterize the vegetation and sediment variables, from bare sediment though young mangrove stages, (2) identify which environmental variables likely drive benthic community structure along the mangrove growth gradient, and (3) describe how benthic communities are modified along this gradient on the FG coast, under the influence of mud supply from the Amazon and periodic erosion.

2. Materials and Methods

2.1. Study Area and Sampling Sites

The present study was conducted during the dry season months of October and November 2013 on a mud bank located northwest of the Sinnamary estuary (5°28′41″ N, 53°02′05″ W; Figure 1a). We used a time series of PLEIADE satellite images (0.5 m.pixel−1; https://www.intelligence-airbusds.com/geostore) (accessed on 19 September 2013) to observe the accretion and elevation processes of this mudbank from a bare mudflat stage that started in 2009. As the mud consolidated, the substrate elevation and the aerial exposure time increased. Mangroves colonized the intertidal and consolidated mud in early 2012 and the oldest trees were just under two years when the study commenced. The saplings spread southwestward onto the adjacent consolidated bare sediments.
Tides are semidiurnal in the area, with high spring and neap tide levels of up to 3.2 m and 2.5 m, respectively, and a mean tidal range of 1.68 m (SHOM, 2013). The entire study area was inundated during spring tides whereas the higher substrates remained aerially exposed for up to 4–5 days during neap tides.
Average values of air temperature (27.05 ± 1.2 °C), humidity (88.7 ± 3.8%) and wind speed (15.8 ± 6.8 km.h−1) during the sampling period were recorded from a weather station (Vantage Pro) deployed in situ.
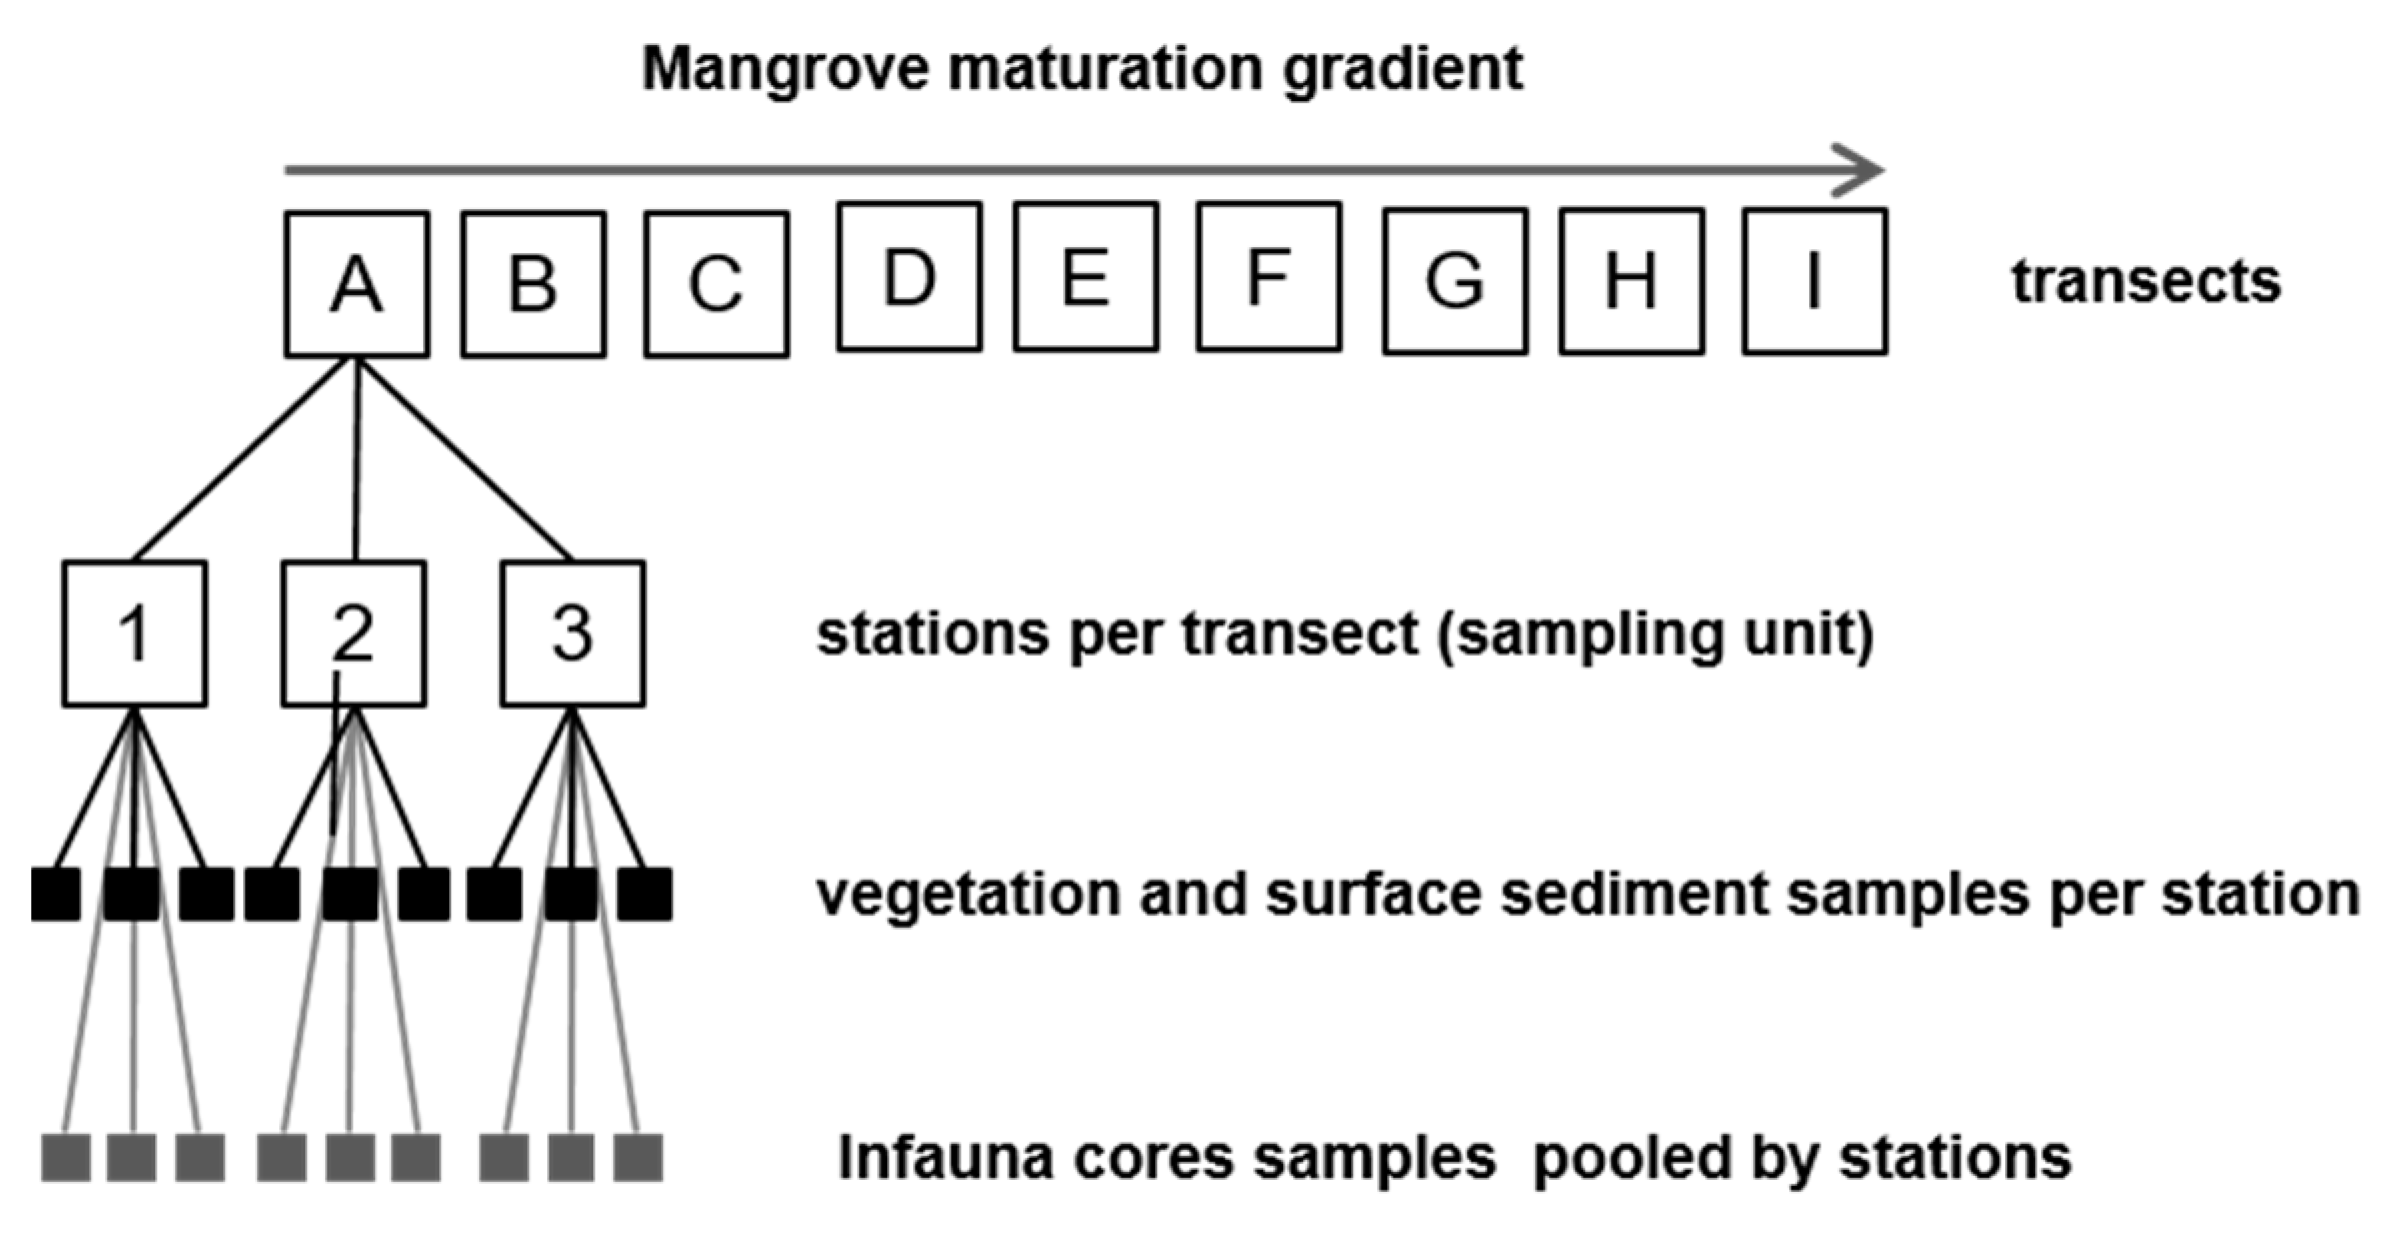
The subtidal and mobile parts of the mud bank were sampled at four stations (AA, J, K, L) (Figure 1b). The mangrove area was investigated during low spring tides. A ca. 450 m × 50 m grid was set up, and consisted of 9 equidistant (ca. 50 m) shore parallel transects (from A to I; Figure 1c). Three stations, about 25 m apart, were investigated per transect (stations 1, 2 and 3; Figure 1c). As the three stations of each transect were parallel to the shoreline, they were subjected to the same tidal level simultaneously.

2.2. Field Measurements and Analyses

2.2.1. Topographic Measurements

In order to evaluate the topographic modifications that match mangrove development, we built a digital elevation model (DEM) using a Real-Time Kinematic Differential GPS (RTK-DGPS) Trimble R8. Measurements were obtained in the Universal Transverse Mercator (UTM) 22 North zone combined with the WGS 84 datum, using the Earth Gravitational Model 1996 (EGM96) geoid as the vertical datum. We carried out 51 measurements over the grid (from transects A to G) within the same day in early October, using a mobile GNSS antenna mounted on a kayak at high tide to prevent disturbance of the mud. High tree density precluded measurement at transects H and I, where the elevations were estimated.
The topographic values were meshed using the classical Delaunay triangulation method in GIS software ESRI ArcGIS desktop 10.1, and interpolated in the DEM on a grid (resolution of 2 m). The DEM portion at transects H and I was estimated from linear regression interpolations yielded by stations 1, 2 and 3, along the gradient from D to G (to avoid overestimation) with Z = aD + b, where Z is the elevation (m), D the distance in the slope direction (m), and a and b the regression coefficients.

2.2.2. Hydrodynamic Measurements

Since small differences (e.g., 10 cm) in substrate elevation with mangrove development induce a difference in emersion/immersion time between the bare sediments and the vegetated sediments, we calculated flood durations for each transect. The mean flood durations during spring and neap tidal cycles were evaluated from a combination of in situ water level measurements at Sinnamary and offshore tide gauge records at the Salvation Islands, 50 km offshore southeast of the Sinnamary estuary. The latter were downloaded from the free data portal of the French Marine Hydrographic Office (SHOM) (https://data.shom.fr, 19 September 2013), whereas the in situ water levels were recorded with a NKE Ltd. ALTUS submersible altimeter deployed on the consolidated mudflat in the pioneer mangrove stage, 100 m south of the study grid (5°28′33″ N, 53°02′03″ W). Data were collected from 4th October to 11th November 2013 at a frequency of 1 min.
A mean offset of −0.425 ± 0.012 m was detected between the water levels measured in situ (Sinnamary) and those routinely recorded by the Salvation Islands tide gauge. Local water elevations at any tidal phase were retrieved by subtracting this offset from the water level tables (15 min step) calculated at the Salvation Islands using the following: ϕ   ( t ) = π   ( t T 1 T 2 T 1 + 1 ) and h ( t ) = H 2 + H 1 2 + H 2 H 1 2   cos [ ϕ ( t ) ] , where ϕ (second) is the tide phase; T1, and T2, the tidal cycle initiation and ending times, respectively; t the tidal time (from the cycle initiation) corresponding to the sought water level h(t); and H1 and H2 the high and low tide water levels, respectively. A half tide cycle of 6 h 10 min was considered from mean flooding/immersion duration recorded by a pressure sensor and in accordance with the classical semidiurnal tide duration. Finally, the flooding duration at each station was evaluated from the number of 15-minute periods, during which the water level was above the elevation of the studied stations.

2.2.3. Vegetation Structure

At the end of the benthic sampling phase (3rd–5th November), we described the vegetation structure of each stand age during low tides. We defined the vegetation plots in terms of number and surface area as a function of stem density, as previously recommended and applied [35,42]: a large plot area of 27,500 m2 covering the three stations of transects A to D with bare sediment, one plot of 400 m2 per station for transects E and F, and one plot of 100 m2 per station at transect G. Three 1-m2 plots per station were inventoried for transects H and I because of the very high tree density. Tree species and abundances, stem diameters (cm), tree heights (m) and the number of pneumatophores were measured in each plot and then normalized to a square meter scale. Tree height and diameter at breadth height were measured and used for above ground biomass (AGB) calculation following allometric equations (expressed in tondw.ha−1; [27,42]). Stem diameter was measured at breast height (~1.3 m) for trees > 2 m, and at half height for trees < 2 m. Mangrove litter (i.e., fresh and decaying leaves, flowers, twigs) was hand collected at the surface of each plot and then stored in plastic bags to evaluate plot biomass standardized to one square meter.

2.2.4. Sediment Bulk Variables

Abiotic (i.e., grain size, sediment bulk density, water content, porosity and salinity) and biotic variables related to the fauna’s food (i.e., total carbon (TC), total nitrogen (TN), photosynthetic pigments and benthic microalgae composition) were sampled within the intertidal sediments. Variables were measured in the surface sediments of each station on the consolidated mudbank (stations A to I). We collected three surface sediment samples (3 cm Ø cut off syringes, 1 cm depth) within 10 m of each GPS marked station (Figure 2) for all variables except for grain size (1 sample) and microalgae composition (2 cores, 1.6 cm Ø cut off syringes, 1 cm depth). The 1-centimeter depth maximizes the quantification of benthic microalgal biomass which does not migrate deeper in sediment during high tides [43]. The samples dedicated to carbon, nitrogen and pigment analyses were frozen immediately in the field (dry ice). Those dedicated to the composition of microphytobenthos were fixed with 1 mL of Lugol and stored in the dark at 4°C in a cooler. Due to accessibility and in order to prevent sediment disturbance, sediment samples were collected at high tide from a kayak at all sites (13th–17th October) except for transect H (19th October) which was only accessible on foot at low tide. Pore-water salinity was determined from three additional surface sediment samples taken at each station at low tide (LT), between LT −3 h and LT + 3 h.
Surface sediment has the advantage of being quickly sampled and replicated over large areas. However, some surface variables such as salinity can be tide dependent. In order to check how the abovementioned variables collected at the sediment surface represented benthic habitat over depth, we compared surface sediment variables with depth averaged sediment variables that integrate the tidal processes. Three additional sediment cores (10.4 cm inner diameter, 18 cm height, 84.9 cm2 area) were collected at transects A, E and I (i.e., one core per station). These transects were assumed to be representative of the three main mangrove ages (“0” month, 6 months, 2 years old). Core sediments were sliced into 0.5-centimeter layers from 0 to 5 cm depth, 1-centimeter layers from 5 to 10 cm depth, and 2-centimeter layers from 10 to 18 cm depth. One additional core per selected transect was collected for deep pore-water salinity and divided into 0–10 cm and 10–20 cm horizons. For each core, sedimentary variables were averaged over depth.
The wet and dry (60 °C, 24 h) sediment densities (m/V) were obtained by weighing the wet and dried sediment (m), respectively, of a known volume (V) of the initial wet sample. Water content, WC (%), was calculated from the weights of sediment using: WC = [(wet weight—dry weight)/wet weight] × 100. Then, the sediment porosity was estimated as (wet density × water content)/100 (the small salinity correction was ignored). Pore-water salinity was measured using a refractometer (±1 ppt; practical salinity scale) after extracting a drop of filtered interstitial water from the sediment [44]. Grain size fractions in the range 0.05 µm to 2000 μm were analyzed with a Malvern Mastersizer-S2000 (Malvern Instruments Ltd., Malvern, UK) after deflocculating the aggregated particles [45]. The median grain sizes (diameter) were separated as clay, mud (very fine, fine and medium silts), coarse silt, very fine sand and sand.
The biomass of mangrove litter collected in each vegetation plot was estimated by weighing collected dried matter to constant weight. Total carbon (TC) and nitrogen (TN) were analyzed by combustion at 930 °C using a CHN carbon analyzer (FLASH-2000, Thermo Fisher Scientific Inc., Milan, Italy). Due to the lack of carbonates on the FG coast, the organic fraction largely dominates total carbon [29]. TC and TN were thus used as proxies of the organic matter, and the molar TC:TN ratio (mol:mol) was calculated to infer a proxy of the refractory versus labile nature of the organic matter. Sedimentary pigment concentrations were determined by fluorimetry [46]. The chlorophyll-a to phaeopigment ratio was used to assess the degradation state of phytodetritus.
Samples for identification and counting of microphytobenthos were collected using a 10 mL syringe (diameter 1.6 cm) cut at its end. The surface sample (0–1 cm of sediment) was then fixed immediately with 1 mL of Lugol’s and kept cold and in the dark. The composition of the microphytobenthos was determined later in the lab, after staining the sample with a solution of rose bengal diluted in filtered seawater (30 µL/3 mL). Counts were performed using an inverted microscope (Zeiss Observer A1), on one or more sedimentation dish diameters for the most abundant species, or on the entire surface for the rarest [47,48]. The number of cells counted was ratioed to the total volume of sediment, and to the area sampled, to determine the total concentrations of each species per m2 of sediment. The identification of diatoms was carried out using SEM after cleaning the frustules (with H2O2 at 60 °C).

2.2.5. Benthic Infauna

For the study of the benthic fauna, three additional sediment cores (10.4 cm diameter, 18 cm depth, 84.9 cm2 area) were collected at each of the 3 stations in each transect along the mangrove grid. Cores were pooled within stations, giving a single sampling unit with an area of 254.7 cm2 per station (Figure 2). Sampling was performed depending on site accessibility during high tides (transects A, B, C, F, G and I) and low tides (transects D, E and H) on 9th–19th October. In order to distinguish the infaunal size structure (meso- vs. macrofauna), sediments were sieved through 0.25 mm and 1 mm meshes, and the organisms were fixed in a 4% buffered formaldehyde solution until identification.
Meso- and macro-organisms were sorted and identified to the lowest possible taxonomic level (hereafter referred to as the operational taxonomic unit, OUT, based on the morphological criteria) and counted. Image based measurements of organism length and width (Visilog® software, Noesis, France, 1 px equals to 1.0–12.4 μm depending on the magnification used) taken under a binocular microscope were converted into biovolume (mL) by relating the smallest organisms to geometrical forms and by immersing the largest organisms in graduated filled containers [35]. For the rarest taxa, the biovolume of each individual was recorded, whereas for the dominant taxa (oligochaetes, ostracods, copepods, tanaids and nematodes), average individual biovolume was calculated from the total biovolume measurement of 100 individuals per size range (0.25 < x < 1 mm and x > 1 mm). For small sized organisms that cannot be weighed, the measurement of biovolume is useful as a proxy for biomass (e.g., meiobenthos in [49]). For unified comparisons with data from the literature, abundance and biovolume values were standardized per square meter for the entire benthic communities, and specifically for the benthic meso and macrofauna.
Additional small sized sediment cores (3 cm diameter, 5 cm depth) were collected for a preliminary analysis of the meiofauna structure (>62 µm) at a few consolidated mud stations, A (6 cores), B (3 cores), E (1 core), F (9 cores), G (9 cores), H (1 core), I (3 cores), and at mobile mud stations AA (1 core), J (3 cores), K (3 cores) and L (3 cores). Sediments for the meiofauna analysis were fixed in a 10% buffered formaldehyde solution until identification. Before sorting, meiofauna samples were stained with rose bengal, washed onto a 0.062 µm mesh sieve, and sorted under a dissecting microscope to the class level. Meiofaunal abundances were normalized to the weight of dry sediment after noting porosity ranges [31].

2.3. Statistical Analyses

A principal components analysis (PCA) on the correlation matrix was conducted to determine which environmental variables (among tree biomass and density, pneumatophores and litter biomasses, substrate elevation, porewater content, salinity, porosity, sediment grain size, pigments, Chla:Phaeo, TC and TN contents, TOC:TN and C-Chla:TC ratios) explained the most variability between the transects. Then, statistical differences in the environmental variables were tested between transects with PERMANOVA analysis with 999 permutations and threshold of probability at 0.05 [50]. The differences in microphytobenthic composition (diatoms versus cyanophycae) between transects were tested using a nonparametric one way analysis of variance (Kruskal–Wallis) followed by a post hoc Wilcoxon test for pairwise comparisons.
Regarding the environmental variables sampled at the surface (i.e., C:N and Phaeo:Chl-a ratios, salinity, and median grain size), we tested their reliability in representing the infaunal habitats during high versus low tides. We examined the hypothesis of “no effect of sampling time on surface sediment parameters” in these mangrove stations. The variables that fulfilled the normality and homoscedasticity criteria were tested with an ANOVA and log transformed when necessary (C:N, log transformed Phaeo:Chl-a), while the others were analyzed with a nonparametric Kruskal–Wallis test setting the tide effect as a fixed factor (two conditions: low tide for transect H and high tide for transects G and I). The patterns of surface sediment variables on the one hand, and sediment depth averaged variables on the other, were compared both as a function of transect using graphical analysis and analyses of covariance (ANCOVA). Nonparametric ANCOVAs [51] were chosen to verify the hypothesis of curve parallelism. ANCOVA was, however, not applied to salinity because there was no core replication per transect.
The effects of transects were tested on the α diversity for the entire benthic infauna (i.e., total OTUs richness, Shannon’s entropy and Pielou evenness (J) indexes, density and biovolume) by using parametric one way variance analysis (ANOVA). We also compared the α diversity per size class (mesofauna versus macrofauna) depending on the transect, by using two way variance analysis (ANOVA). All of these ANOVA were followed by post hoc Tukey tests.
A permutational multivariate analysis of variance, using a Bray–Curtis dissimilarity index (PERMANOVA; [50]), based on density and biovolume per matrix of OTUs, was computed to test the multivariate response of OTU assemblages to the transect location after verifying the multivariate homogeneity of group dispersions.
In order to visualize the overall β diversity and the contribution of OTUs in the differentiation of stations among transects, two principal components analysis (PCA) based on total density and biovolume were performed on the Hellinger transformed data to avoid giving excessive weight to rare OTUs [52].
Redundancy analysis (RDA) was used to quantify the effect of spatial structure and abiotic and biotic environmental variables on infaunal β diversity. Distance based Moran’s eigenvector maps (dbMEMs; [53]) and variation partitioning [54], were combined in order to isolate the specific and shared spatial and environmental variance fractions of abundance and biovolume infaunal communities in terms of beta diversity. Only the dbMEMs corresponding to positive spatial autocorrelation were used as spatial variables. Any significant linear spatial trend was first identified and removed with multiple linear regressions. Redundancy analysis was used to model beta diversity in terms of spatial and environmental variables. For each subset (dbmems, abiotic and biotic) of explanatory variables, a global model was first computed and subsequently tested. If significant, and in order to optimize the predictive power of the model [55], forward selection of explanatory variables (dbMEMs, biotic and abiotic environmental variables) was carried out in each subset according to [56] (see Appendix A for more details). All analyses were conducted within the R environment (R Development Core Team 2021; [57]) and relied on the FactoMineR [58], vegan [59], adespatial [60] packages.

3. Results

3.1. Environmental Variables

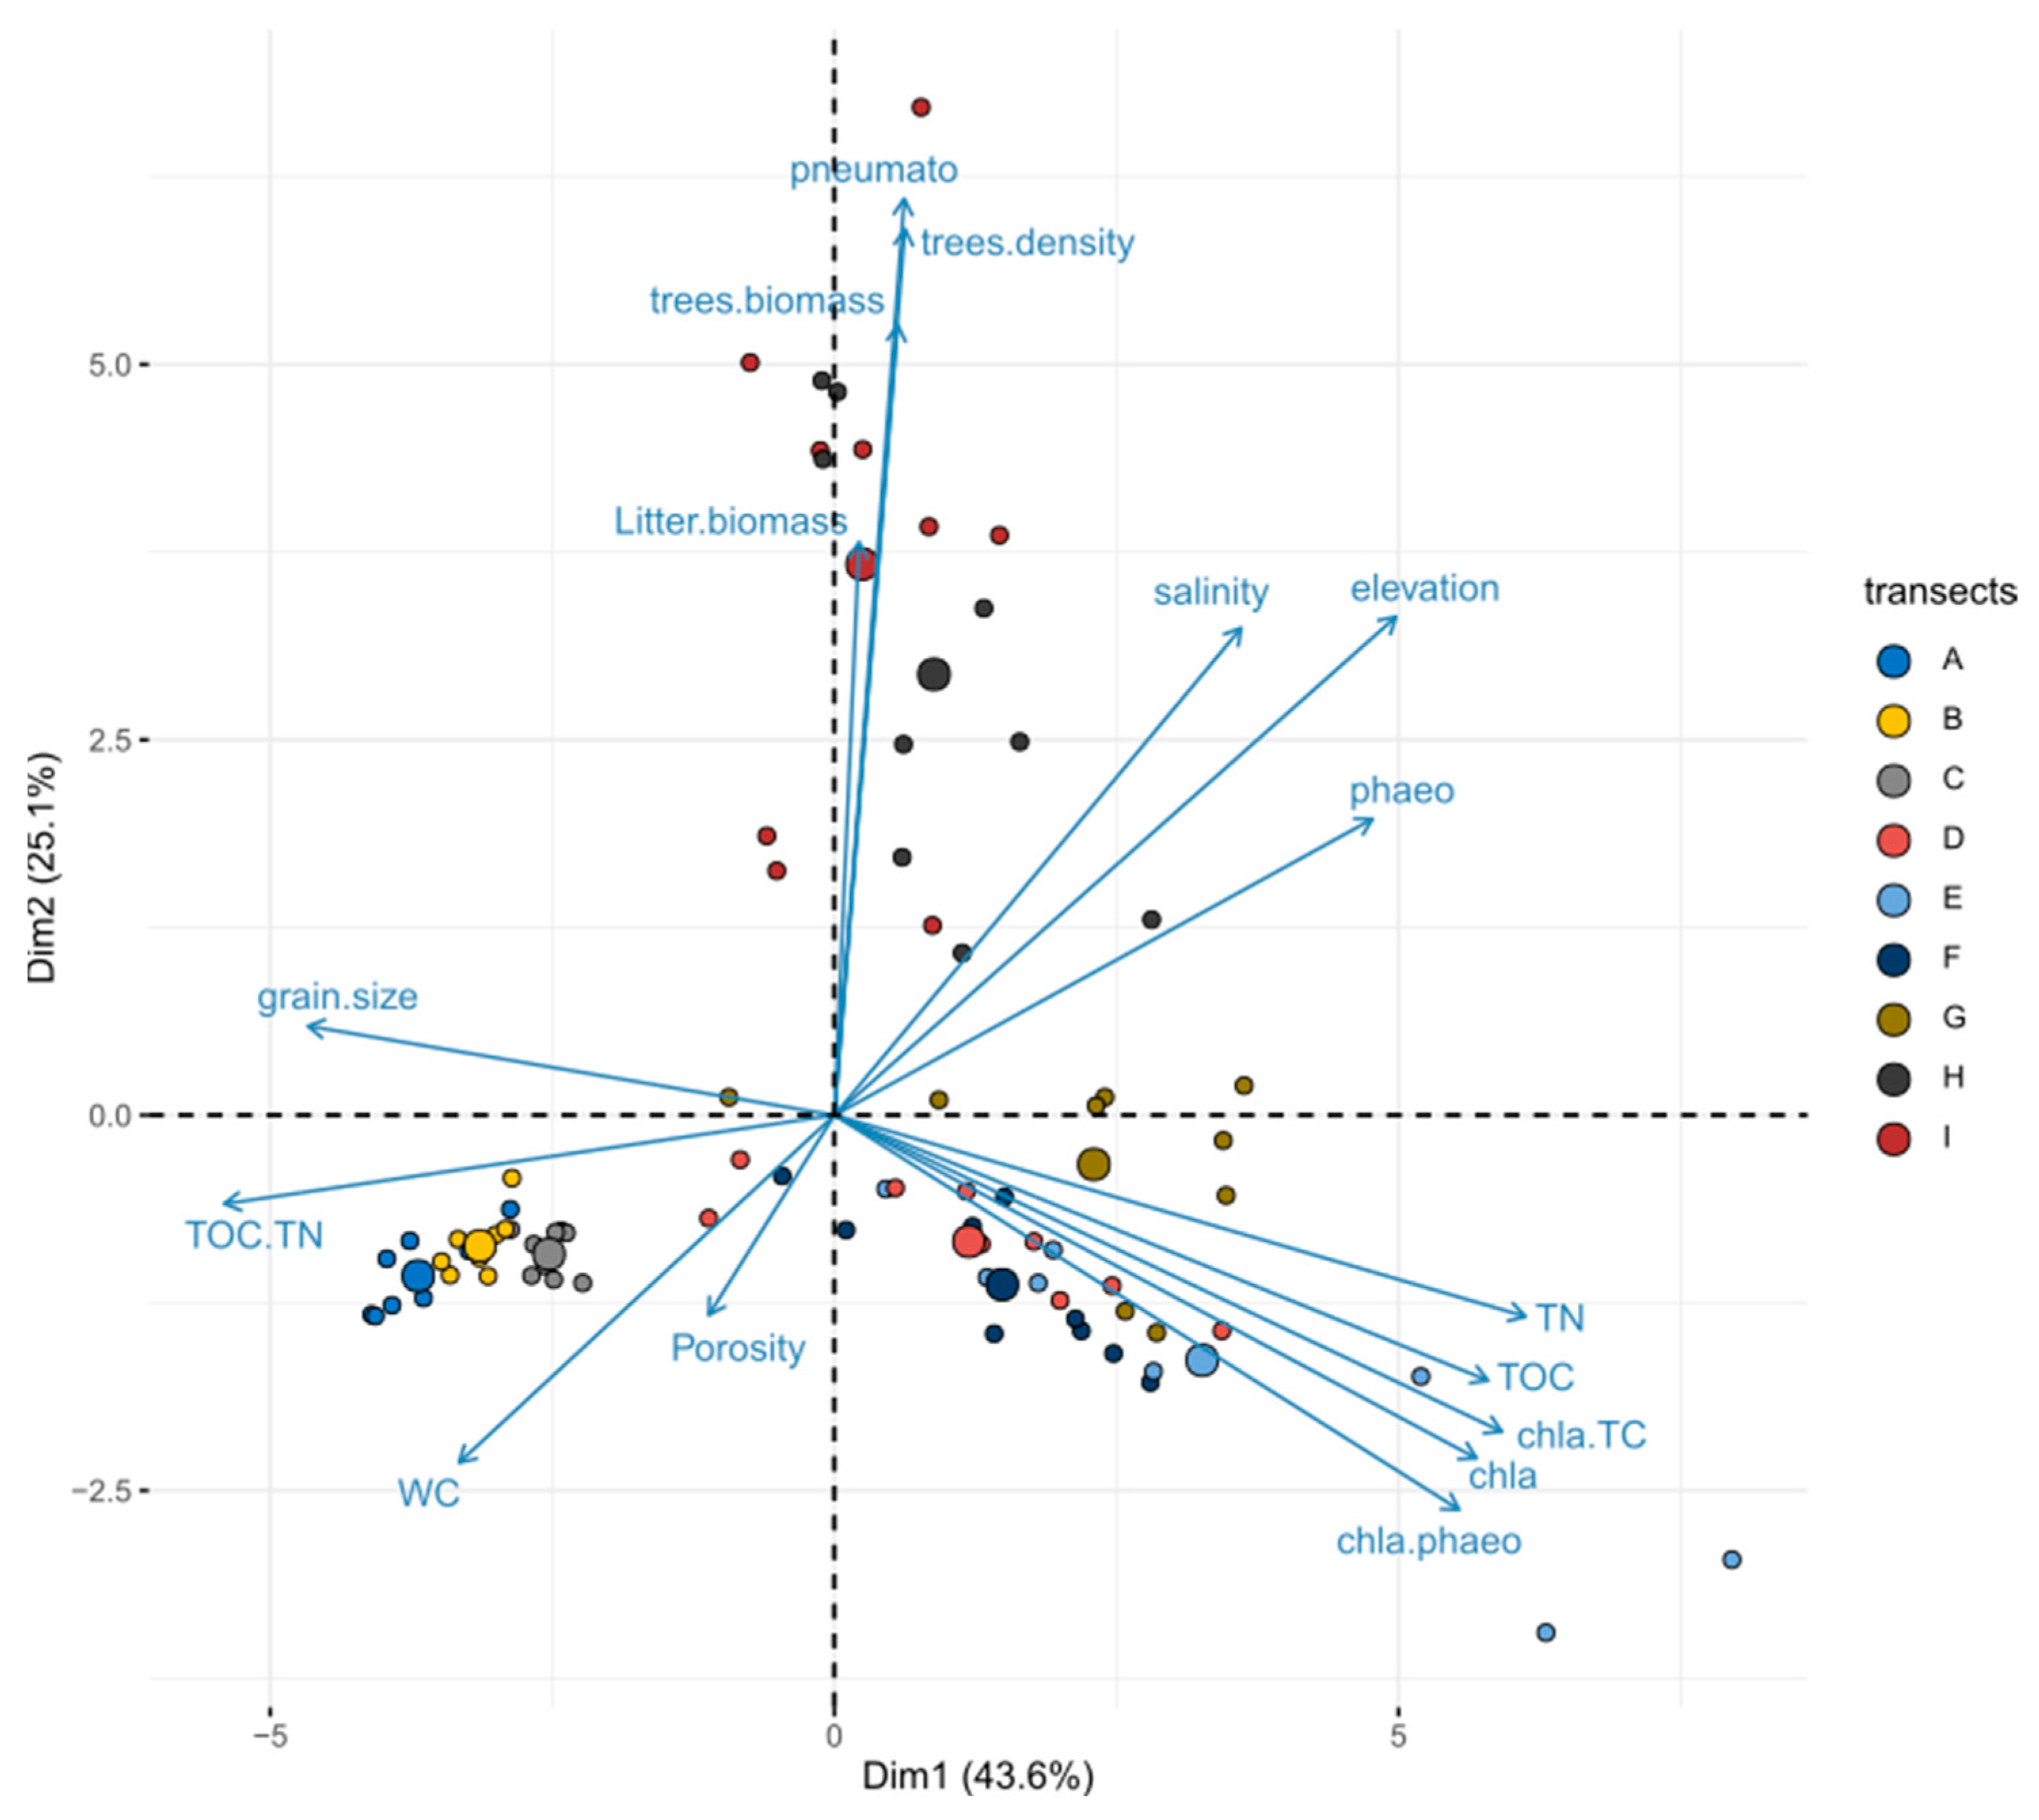
The environmental PCA analysis explained 68.7% of the variability among transects along the mangrove maturation gradient: the first axis explained 43.6% and the second axis 25.1% (Figure 3). The most important variables defining the first axis were TN, C-chla:TOC, TC, chla, chla:phaeo, elevation, phaeo, salinity, and grain size and TC:TN, while pneumatophore density, tree density, tree biomass, litter biomass and elevation defined the second axis. Transects were separated into three groups based on PCA results: group 1 (transects A, B, C), group 2 (transects D, E, F, G), and group 3 (transects H and I). The PERMANOVA analysis showed that environmental variables were significantly different between the groups of transects (p < 0.001).
Group 1 included transects with the lowest values of salinity, elevation, C-chla:TOC and chla:phaeo ratios and the highest values of sediment water content, median grain size and TC:TN ratio (Figure 3, Figure 4 and Figure 5). Group 2 exhibited the highest chla and TC contents, and C-chla:TOC and chla:phaeo ratios (Figure 3, Figure 4 and Figure 5). Group 3 was associated with mangrove biological variables (pneumatophore density, litter biomass, tree biomass and density) and increasing substrate elevation, salinity, and pheophytin content (Figure 3, Figure 4 and Figure 5).
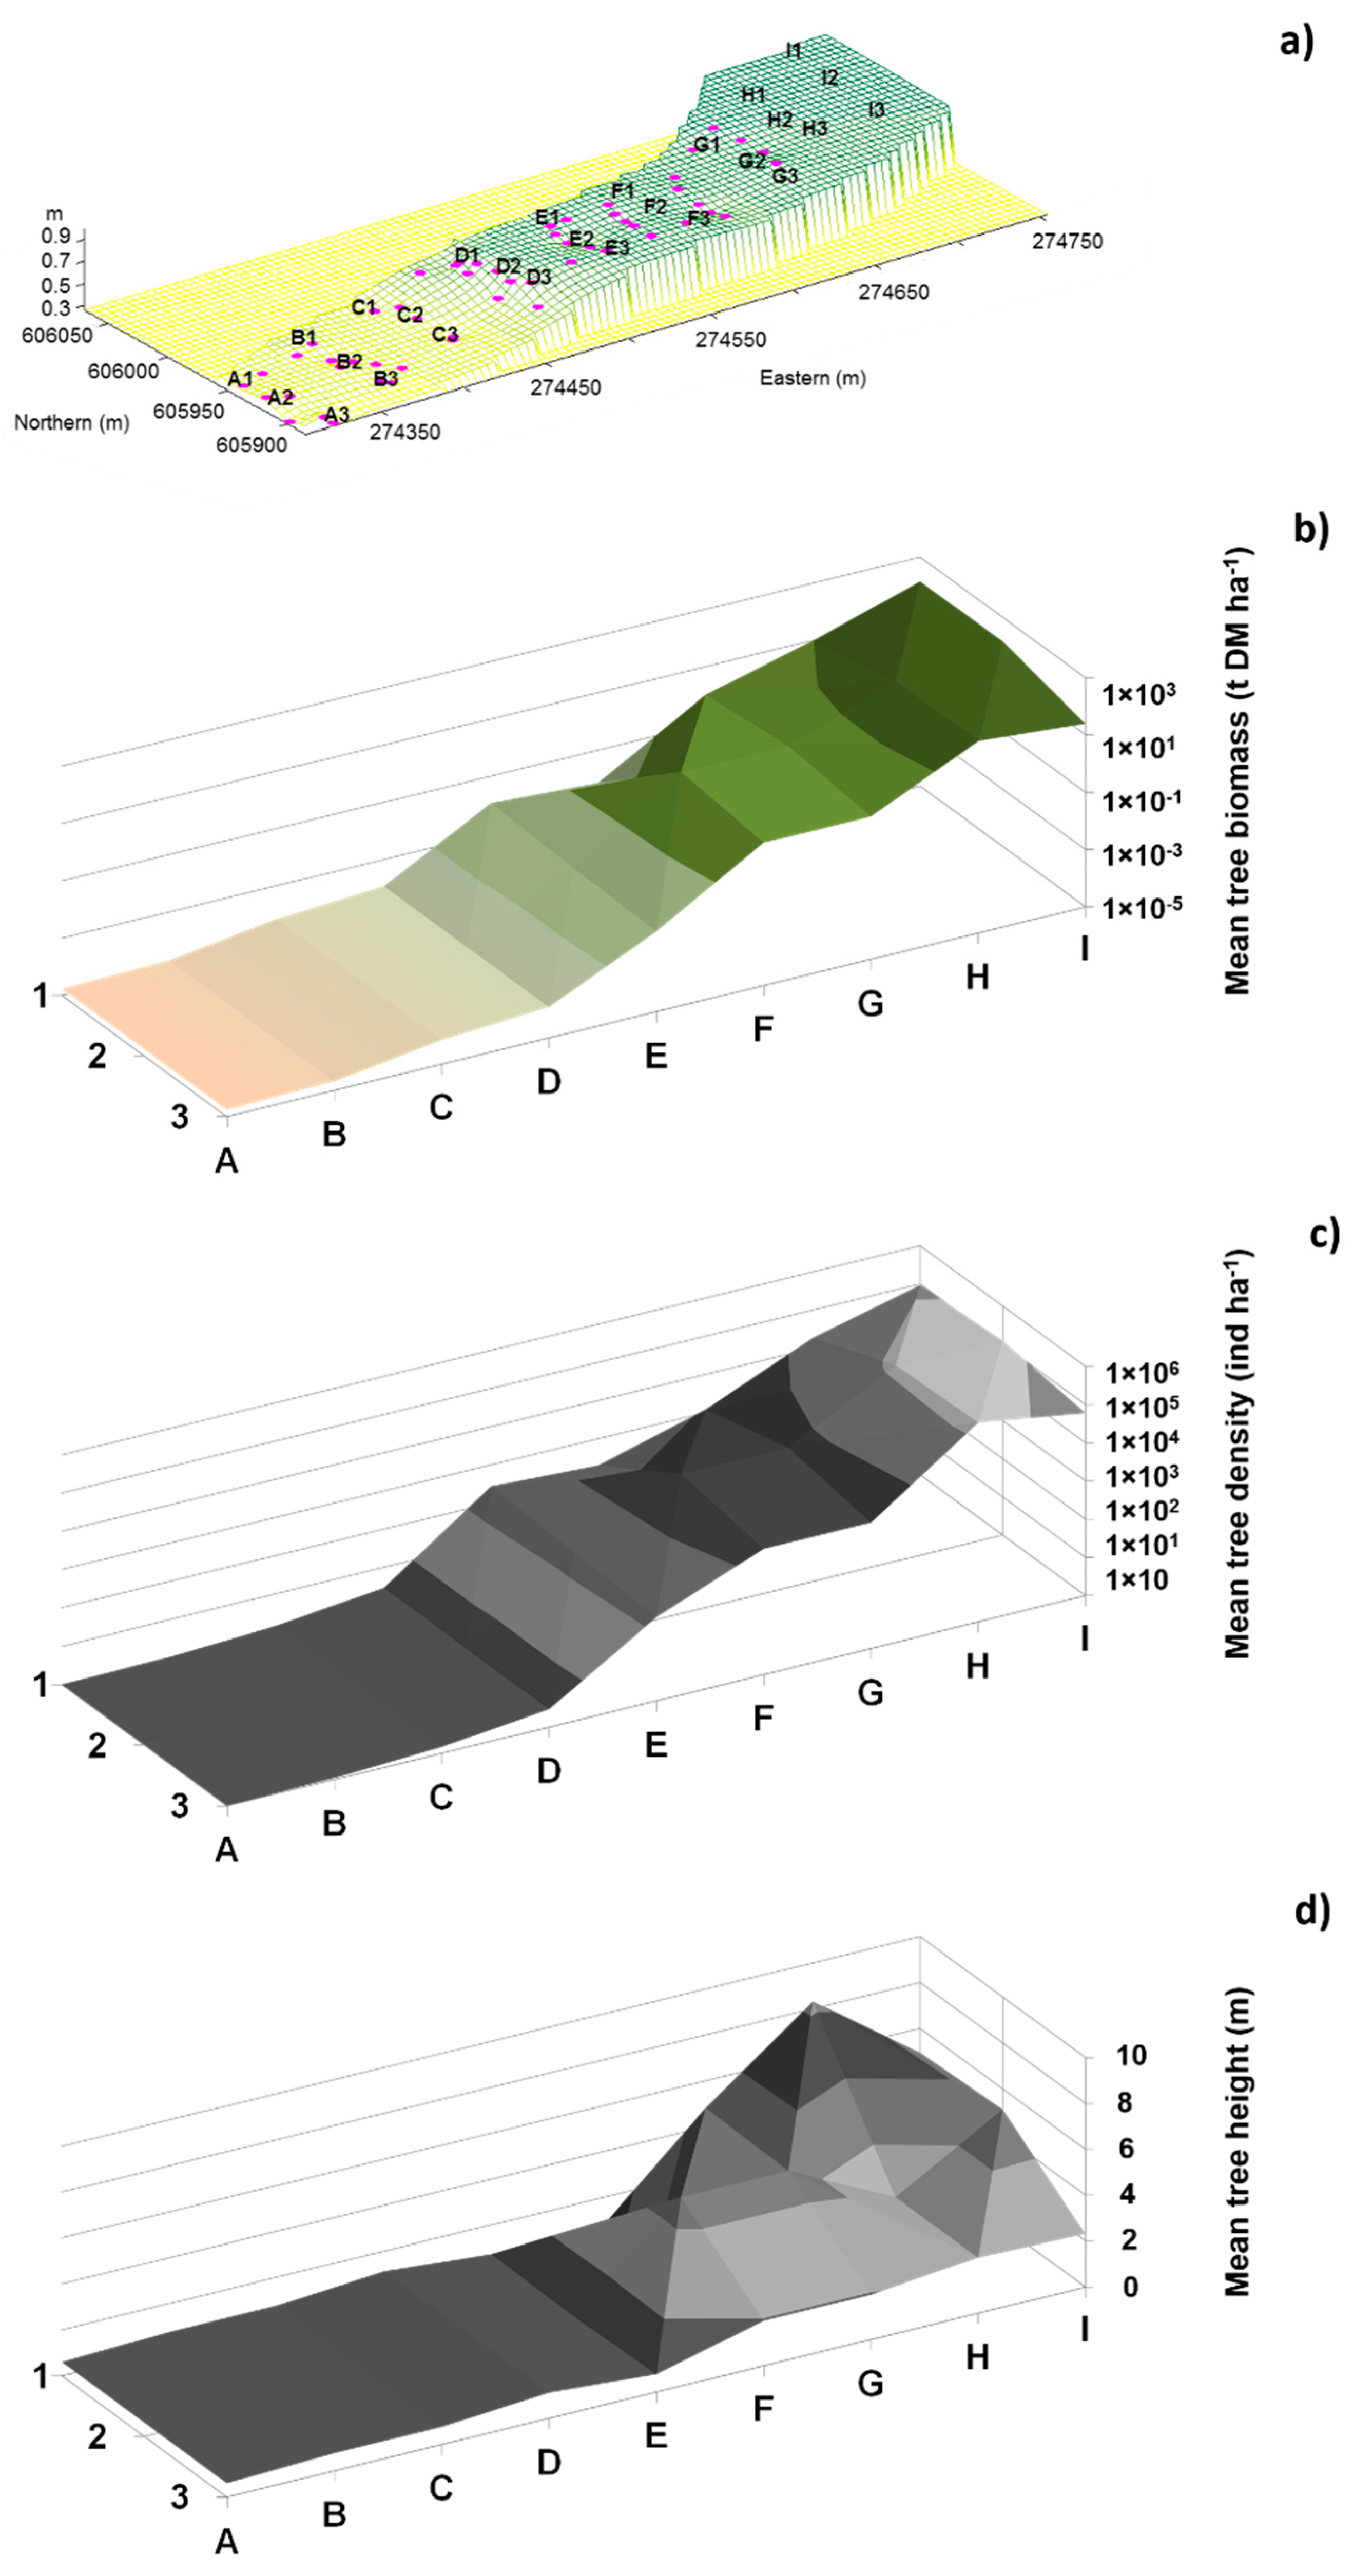
Substrate elevation decreased slightly (from 1 to 5 cm) along a north–south axis (i.e., from stations 1 to 3) in most of the shore parallel transects (A, B, C, F and G) and showed a significant increase in the order D, E, F, G (60 cm) and H, I (83 cm). Transects of groups 2 (D to G) and 3 (H, I) were always exposed to air during neap tides (nil flood duration) whereas group 1 (A to C) was flooded for 2.5 to 3.5 h per tidal cycle. During spring tides (i.e., sampling time), the flooding duration decreased from group 1 (5–5.5 h) to group 2 (4–4.5 h), and group 3 (3–4 h).
Avicennia germinans dominated mangrove tree density (93.7%) over Laguncularia racemosa (5.5%) and Rhizophora spp. (0.8%). The mean tree height, biomass and density significantly increased from group 2 to 3, but were highest at group 3 (Figure 3 and Figure 4; p< 0.001). Within group 3, trees measured 1.8–8 m in height and had a high density (ca. 50,000–190,000 ind.ha−1), which resulted in high above ground biomass (from ca. 10 to 145 t DM.ha−1). Litter biomass (from 0 to 7 gdw.m−2) and pneumatophore density (from 0.07 to 199 pneumatophores.m−2) significantly increased with distance from group 1 to 3 (p < 0.001) and were both positively related to the density and biomass of mangrove trees (Spearman’s rank correlation: ρ > 0.84, p < 0.001).
The total abundance of microphytobenthos (MPB) significantly increased in transects of groups 1 and 2 (p < 0.001, KW). This trend was explained by higher cyanobacteria abundances in the vegetated sediments (p < 0.0001, KW; Figure S1A, Supplementary Materials), except for transect I, whereas diatom abundances remained similar along the mangrove maturation gradient (p > 0.12, KW; Figure S1A). Relative abundances of diatoms were higher than those of cyanobacteria in group 1 (>90%), whereas cyanobacteria dominated in groups 2 and 3 (>80%; Figure S1B). The same trends were observed for the MPB biovolumes (data not shown).

3.2. Validity of the Selected Surface Sediment Variables

Surface sediment biogeochemical variables (Phaeo:Chl-a, C:N; ANOVA, p > 0.3), and median grain size (ANOVA, p > 0.9) did not significantly differ between the low and high tides within transects A, E, I. Graphical and ANCOVA analyses showed that these variables, measured at the sediment surface and depth averaged over 18 cm, exhibited similar trends between the three transects. The slopes of the regressions of the surface and depth averaged variables as a function of mangrove stages did not violate the assumption of parallelism for median grain size and C:N ratio (p > 0.05), i.e., both curves had the same shape (Figure S2). The curves representing the surface and depth averaged Phaeo:Chl-a were not parallel (p < 0.05), though they showed relatively comparable patterns along the mangrove development gradient (Figure S2). ANCOVA was not applied to salinity, but the graph (Figure S2) clearly showed the same pattern at the sediment surface and at depth between the three transects.

3.3. Infaunal Alpha Diversity

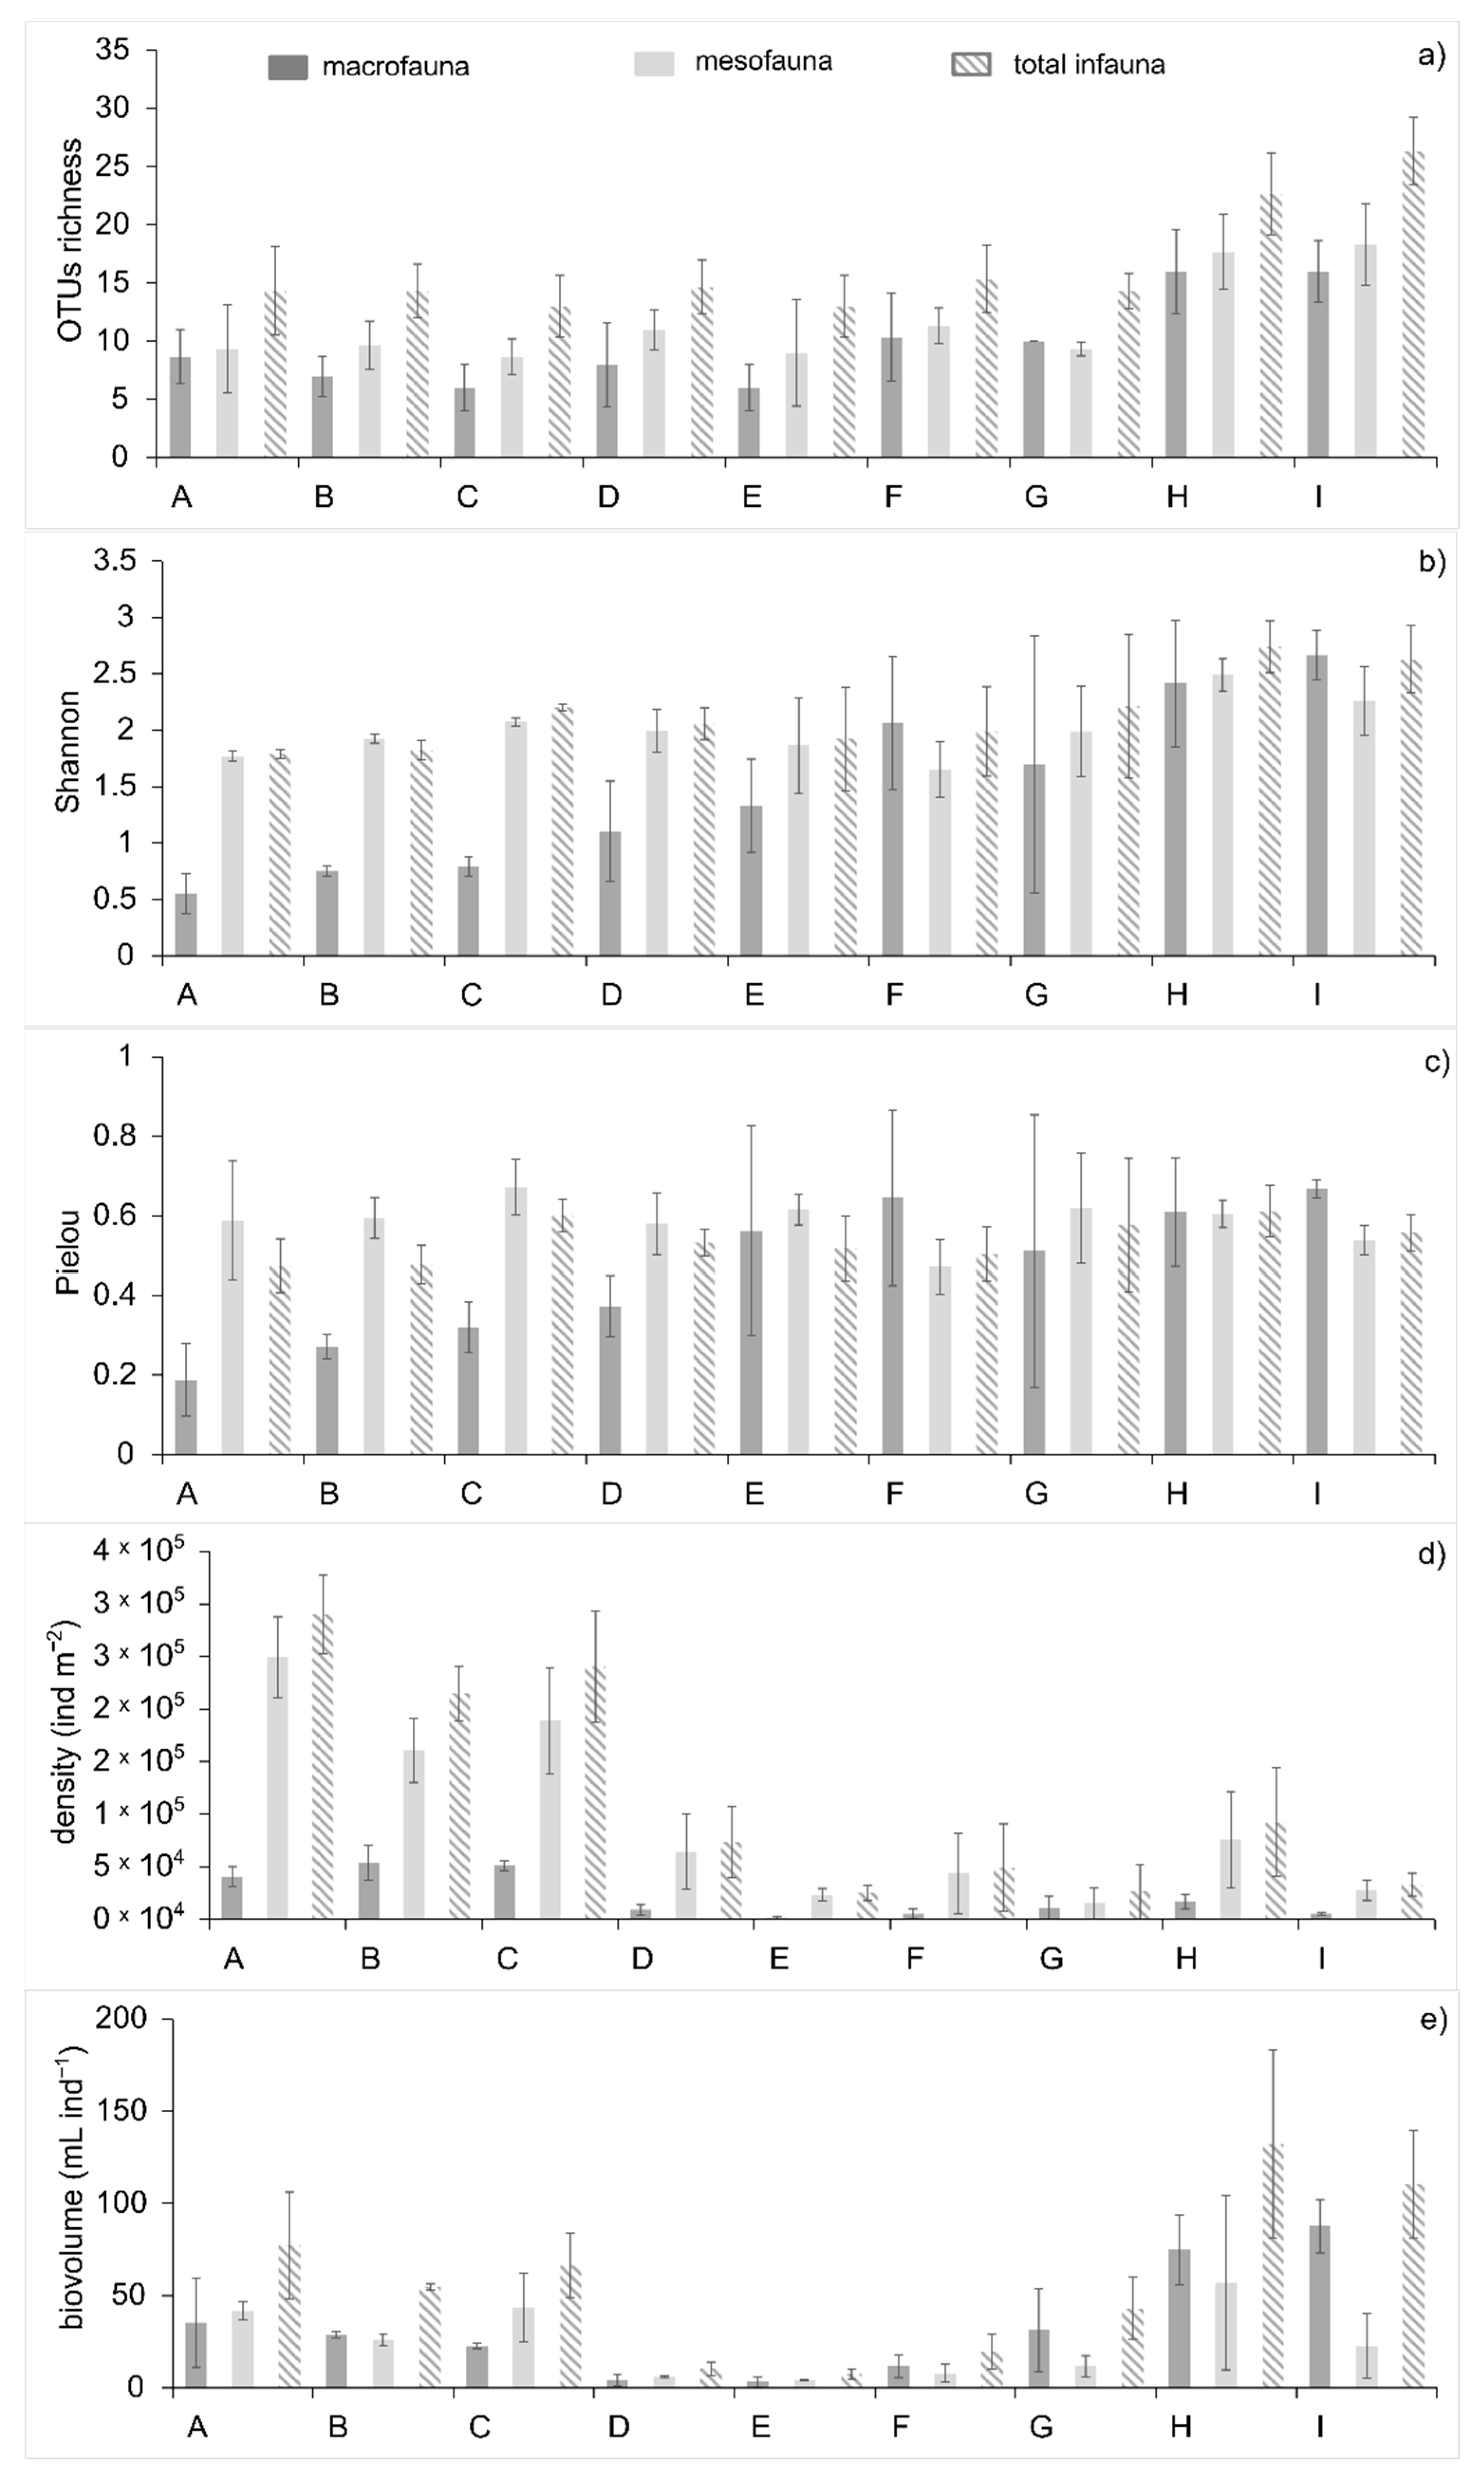
A total of 56 infaunal taxa belonging to 16 classes were identified across all stations (Table S1). Total OTU richness and the Shannon index significantly increased along the mangrove maturation gradient, reaching the highest values at the vegetated stations H and I (p < 0.02, Figure 6a,b). OTU richness was higher for mesofauna at all stations. At the low elevation stations (A to D), the Shannon index was higher for mesofauna (1.5–2). Intermediate stations (E–G) were characterized by a similar Shannon index between meso and macrofauna, while values were significantly higher (>2) for macrofauna at vegetated stations. The Pielou index (J) of the total infauna remained similar along the mangrove transects, and it only differed in terms of the infaunal size category (p < 0.05, Figure 6c). The Pielou index for mesofauna was significantly higher than that of macrofauna in low elevation bare mud transects (A–D), whereas the opposite trend was found in the upper vegetated transects (H–I). Differences in the Pielou index were not significant between the two infaunal size categories in intermediate transects (E–G). Only the macrofaunal Pielou index significantly increased along the mangrove maturation gradient, from stations A to F (similar values from stations F to I).
The total density and biovolume of the infaunal communities (meso + macro) ranged from 25 to 300.103 ind.m−2 and from 5 to 130 mL.m−2, respectively, across transects (Figure 6 d,e). Total densities significantly decreased from the bare sediments to the most vegetated sediments (F = 12.63; p < 0.0005; Figure 6d). Mesofauna significantly dominated macrofauna in density in each transect (Anova, F = 101; p < 0.0005). Total biovolumes differed significantly among transects (ANOVA, F= 25.72; p < 0.0005; Figure 6e), and were lowest at the transects of group 2 (D, E, F; Tukey, p < 0.05). Biovolumes remained similar between the two size categories within a given transect.
The total abundance of the overall meiofauna ranged from 0.5 to 130 ind.g−1 dry weight of sediment, with the lowest values at the mobile mud stations (AA, J, K, L; KW test: 16.769, p < 0.005). Nematodes were the exclusive taxa in density in AA and L stations, dominant in B and H stations and equal to polychaete taxa in the station I (Figure S4A). The relative proportions of tanaids and ostracods increased at stations A, B, J and K (Figure S4A). Vegetated sediments were characterized by copepods mainly in transect E, and juvenile polychaetes and insects. Juvenile decapods were only observed at station K (Figure S4A). The tanaid population of the intertidal bare sediments (A-B) was dominated by individuals with body length comprised between 1 and 5 mm, whereas those of the mobile mud stations (J-K) were smaller (<2 mm in J; 2 to 3.5 mm in K) (Figure S4B).

3.4. Infaunal Beta Diversity

OTU compositions of the total benthic infauna were different between transects (PERMANOVA; p < 0.001). PCA performed on total infaunal densities explained 64.5% of the variability among sampling stations: the first axis explained 49.9% and the second axis 14.6% (Figure 7a). The most important variables defining the first axis were H. spansi, Ostracoda, Adenophorae, Oligochaeta, Chironomidae larvae, Ceratopogonidae larvae, Capitella sp1, Namalycastis sp.1, and P. aquilatera, while Copepoda, Namalycastis sp.1 and Gastropoda defined the second axis. The first axis distinguished the infaunal community of group 1 transects (A to C; H. spansi, Ostracoda spp., Adenophorae) from those of group 3 transects (H, I; Oligochaeta spp., Namalycastis sp., Capitella sp1, P. aquilatera, Chironomidae and Cerotopogonidae larvae). The second axis separated the infaunal community of group 2 transects (D to G; Copepoda, Oligochaeta) from that of group 3 (H, I) which had a higher density of insecta larvae (Chironomidae and Ceratopogonidae), Polychaeta (Namalycastis sp.1, Capitella sp1) and Mollusca (Gastropoda and P. aquilatera).
PCA performed on total biovolumes explained 49.2% of the variability among sampling stations: the first axis explained 33.6% and the second axis 15.6% (Figure 7b). The PCA first axis still opposed the biovolumes of H. spaansi and Ostracoda spp. of group 1 transects (A to C), to those of Ceratopogonidae and Namalycastis sp.1 in the vegetated transects (groups 2 and 3; D to I). The second axis mainly explained the variability among the vegetated stations due to high biovolumes of the malacostracean decapod Uca cumulanta and of adult insects (Coleoptera sp.4) at I transect.

3.5. Disentangling the Effects of Environment Variables on Infaunal Multivariate Responses

Appendix A specifies how the variables were selected prior to the variance partitioning analysis. The variable selection process ended up with a dataset of 10 explanatory variables (spatial: dbMEMs 1, 5, 6 and 7, Figure S4; environmental: elevation, pneumatophore density, C:N, Phaeo:Chl-a, salinity and median grain size) used in the variation partitioning analyses.
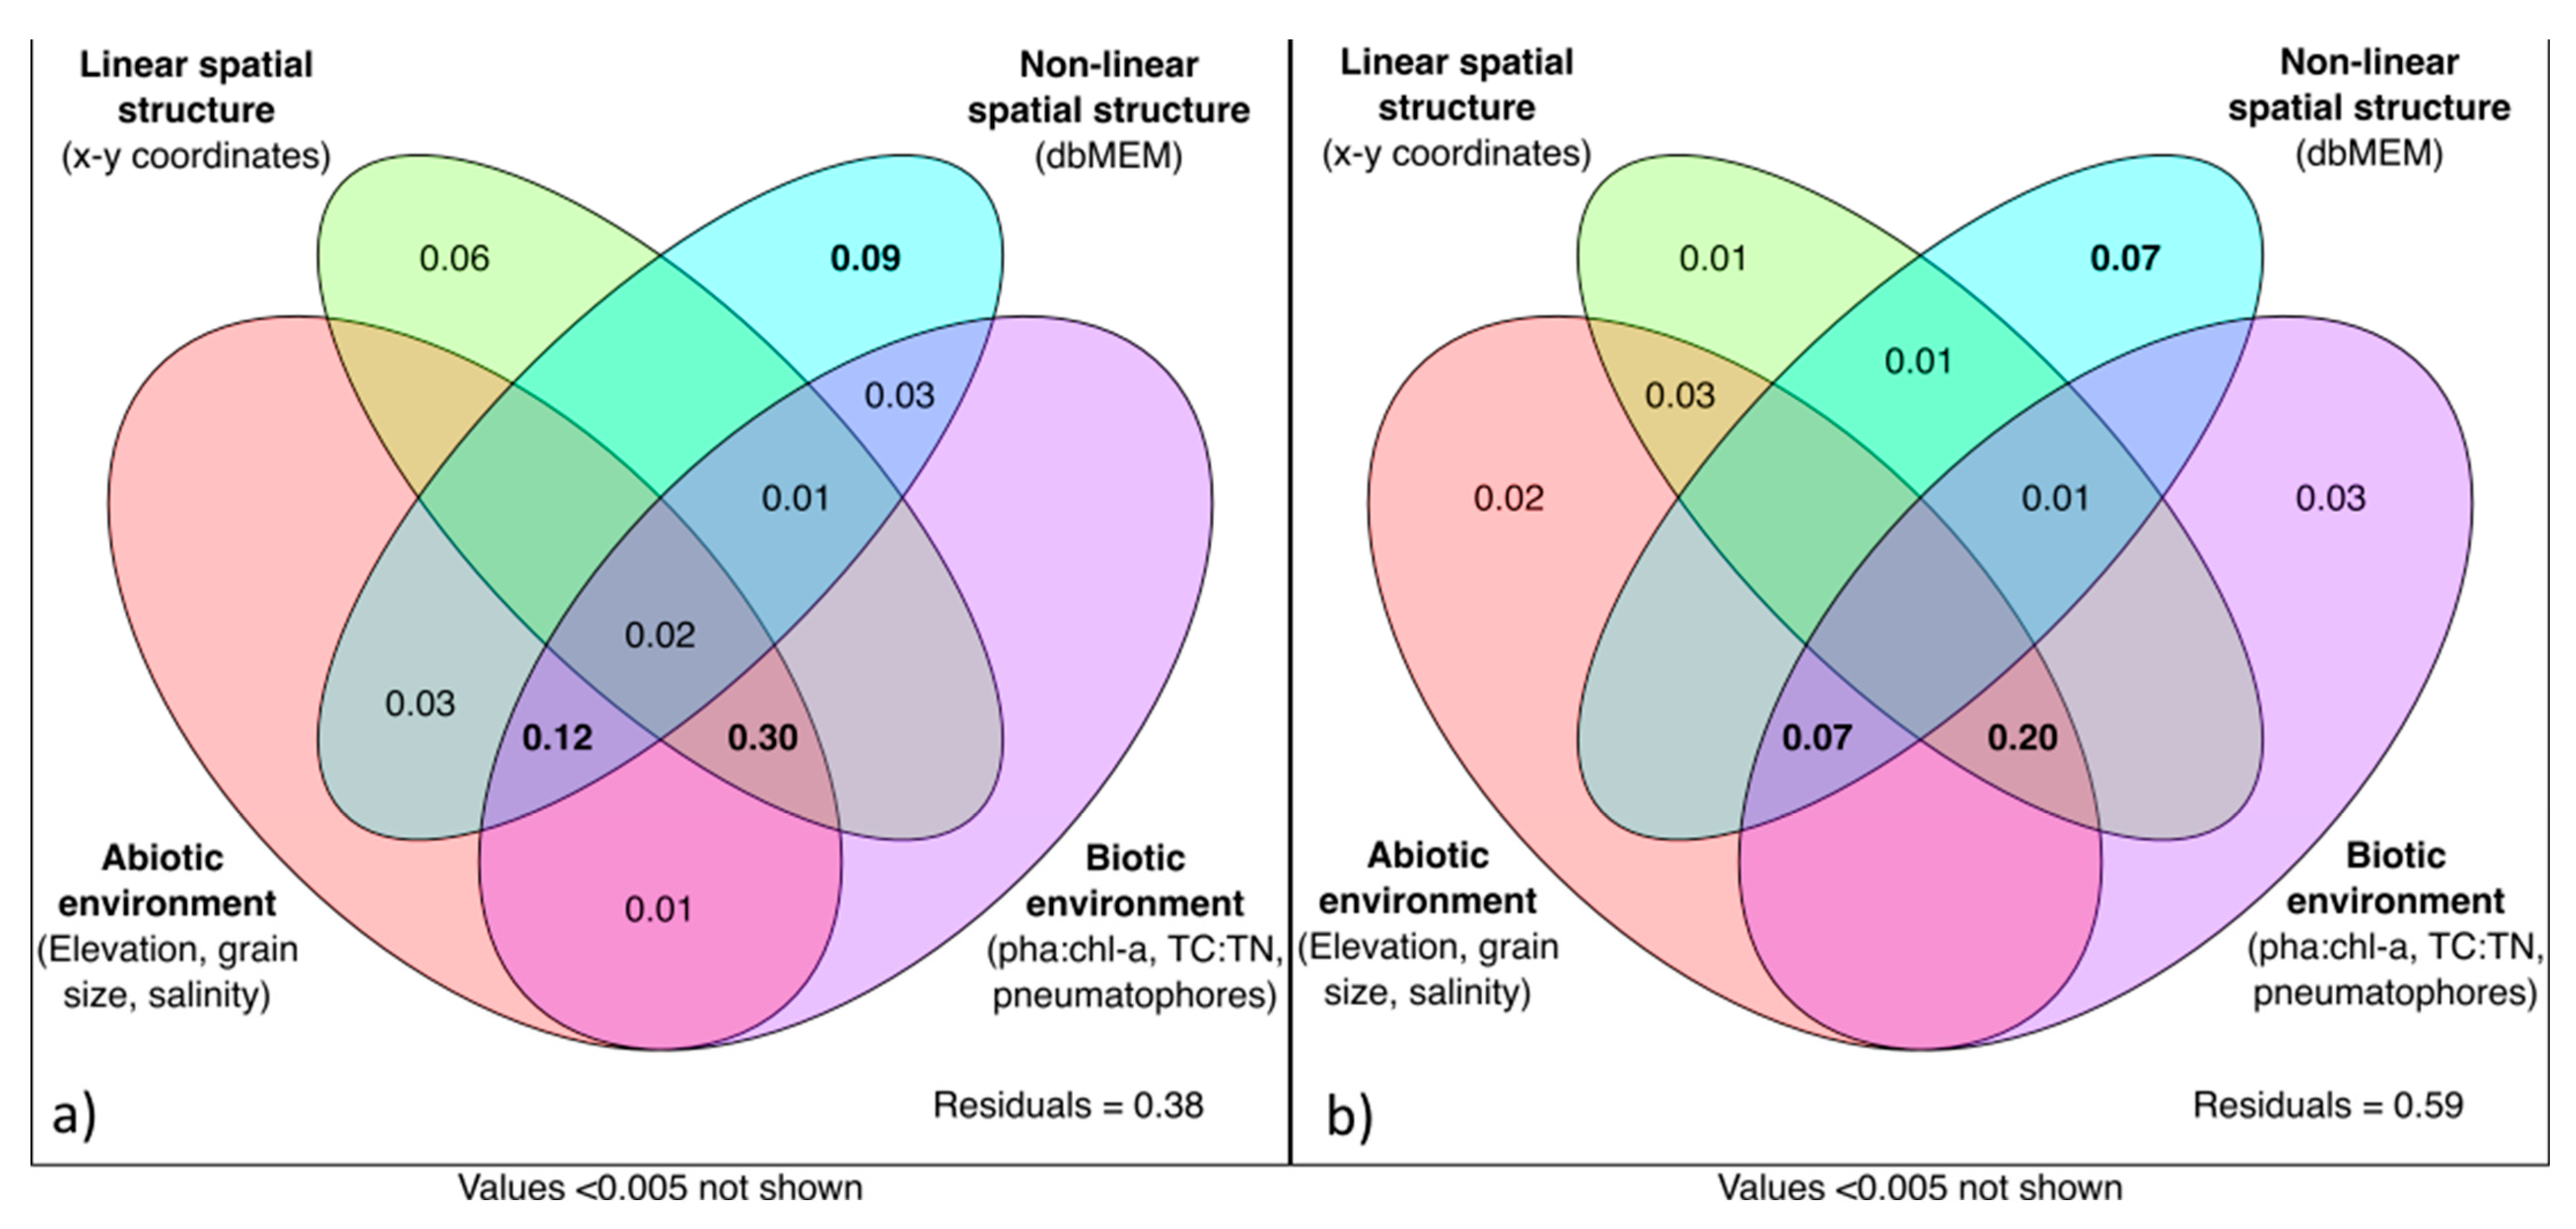
Linear spatial predictors (XY coordinates) significantly explained the total abundance variations (R2Adj = 0.34, F = 7.811; p < 0.001) and total biovolume variations (R2Adj = 0.24, F = 5.135, p < 0.001; 9999 perm.) along the south–north and east–west directions (Appendix A2). The south–north effect was stronger (abundances: R2Adj = 0.33, F = 13.887, p < 0.001; biovolumes: R2Adj = 0.24, F = 9.030, p < 0.001; 9999 perm.) than the east–west one (abundances: R2Adj = 0.13, F = 4.811, p = 0.0029; biovolumes: R2Adj = 0.12, F = 4.659, p < 0.001; 9999 perm.). We partitioned the beta diversity of benthic faunal communities according to four sets of explanatory environmental variables: linear spatial structures, nonlinear spatial structures (dbMEMs), abiotic and biological variables, (Figure 8). Together, these variables explained 67% (R2adj total = 0.67) and 45% (R2adj total = 0.45) of the variations in the total abundance and biovolume, respectively.
Among the abiotic and biological variables, substrate elevation, grain size, salinity, TC:TN and Phaeo:Chl-a ratios, and pneumatophore density had little to no effect (<5%) on the benthic community structure, as they act synchronously with the spatial variables. The linear spatial structure, together with the abiotic and biological variables, jointly explained most of the variations in the infaunal structure (30% for abundances and 20% for biovolumes). Likewise, the nonlinear spatial structures and the abiotic and biological variables jointly explained a non-negligible part of the variations in the infaunal structure (12% for abundances and 7% for biovolumes). Part of the variations in infaunal structure (9% for abundances and 7% for biovolumes) is only attributable to nonlinear spatial structures (dbMEMs), without any relation to the measured variables (Figure 8).
The two correlation triplots of RDA (based on OTU abundance and biovolume data; Figure S5) shows how the selected biotic and abiotic variables constrained the infaunal structure.

4. Discussion

4.1. Environmental Changes versus Young Mangrove Development

Mangroves grow rapidly along the French Guiana coast as an adaptative response to the natural and recurrent cycles of accretion/erosion phases [27,42]. In our study area, mangrove growth began when the mud was consolidated at 600 g.L−1, physically stable, and at a substrate elevation of 30 cm (transects D–F, group 2). These values are in agreement with those found previously [28]. The oldest trees, composed solely of A. germinans, were 2 years old with a height of 8 m. This growth rate averaged 4 meters a year and was superior to the previous studies in FG (~2 meters a year) and is a worldwide record for mangrove forests. A previous study has shown that Avicennia growth and biomass are widely enhanced in low latitude areas with high precipitation amounts [61]. Such conditions result in diminished water salinity (<30), a condition suitable for Avicennia to thrive. This high growth rate yields an above ground biomass of 145 t DM.ha−1 and density of 190,000 ind.ha−1, for a substrate elevation of 45 cm (H–I, group 3). This elevation decreased the flooding time in the west–east direction (A–I, groups 1 to 3), thus enhancing porewater evaporation and salinity in the eastern part (H–I, group 3) of the study area. Seedling settlement and development started within the D–F transects of group 2. A previous study from the same area found that remineralization rates in initially deposited fluid muds had demonstrated that the initially deposited sediments were extremely nutrient rich [62]. Thus, mangroves can take advantage of the high reactivity of the substrate when the deposits are physically stabilized (group 2). We surmise that mangrove growth is enhanced by sediment stability, dominant suboxic conditions (Fe rich sediments) associated to high sediment reactivity (i.e., remineralization rates), and by nutrients uptake (i.e., phosphorus), the concentrations of which are important in resuspended sediments and in the overlying water column according to previous studies in the same area [29,44,62,63]. Such uptake may be more important during spring tides, when the vegetated sediments were completely flooded for hours, but should also be possible during neap tides, when the creeks are continuously flooded [64]. Flooding processes favor exchanges of dissolved nutrients between sediments and water. This relationship between nutrients, mangrove substrate elevation and creek dynamics was hypothesized from the morphology and stand structure of west African mangroves but not directly demonstrated from measurements [65]. Mangroves are typically plastic in their ability to use nutrients opportunistically as they become available [66]. For example, phosphorus, a limiting nutrient for mangroves, was measured in low concentrations in the pioneer mangrove stage, probably due to repeated P desorption from the resuspended sediments to the coastal seawater, thus rendering this element available for primary production (i.e., microphytobenthos and mangroves; [63]). The same authors measured higher percentages of sedimentary org-P phosphorus in the mixed and mature mangrove stages, which correspond to the most important mangrove biomass. In the same way, the benthic microalgae, making up the photosynthetic component of the biofilm, developed to very great abundances (>100.103 cells mL−1) in near surface sediments, rapidly increasing the sediment Chl-a content (~53 µg Chl-a g−1 DW). This surface biofilm was composed of diatoms within the bare low elevation sediments (A–C, group 1), as also identified in other FG mudbanks [67], but it was dominated by cyanobacteria in the mangrove swamp stabilized by vegetation (D–I, groups 2 and 3). Decreasing oxic conditions within mangrove sediments [29] could explain the cyanobacteria dominance, the latter often taking advantage under nutrient stress conditions [68,69]. However, the biomass of benthic microalgae was found to decrease (~26 µg Chl-a g−1 DW) where the trees densities were highest (H–I, group 3), probably due to reduced sunlight at the sediment surface (shading). We hypothesize that the higher Chl-a:Phaeo and Chl-a:TC ratios at intermediate vegetated stages (D–G, group 2) indicate fresh benthic phytopigments and ungrazed litter. Conversely, the decrease in these ratios in the denser mangrove reflects a greater fraction of relatively degraded organic matter. Vegetation development was also associated with an increase in litter deposits and pneumatophore density. We surmise that enhanced root transpiration raised sediment porewater salinity (13 instead of 4 in the bare sediments).

4.2. Benthic Biodiversity Spatial Structure versus Young Mangrove Growth

Benthic biodiversity correlated with mangrove development. The linear spatial variables along the west–east axis, associated with environmental variables, explained most of the variation in infaunal structure (30% for the abundances and 20% for the biovolumes, Figure 8). More specifically, the gradual increases in substrate elevation, sediment aerial exposure time and porewater salinity, and vegetation and pneumatophore densities with mangrove development (Figure 3, Table S1), were the main variables that explained benthic community variations along this west–east axis (Figure S5A). These variables are usually important drivers in structuring mangrove benthic communities [5,13]. Our study showed that they changed linearly along the west–east mangrove gradient. The linear modification of infaunal community structure along the north–south axis, however, is more difficult to explain with our data. It could be influenced by the study grid design that shifted northward the two most vegetated stations (within H-I transects, group 3), both of which have a distinct infaunal composition, compared to the other stations (Figure 1, Figure 5 and Figure S5B), and by the slight northward increase in substrate elevation (from 1 to 5 cm).
Next, our measurements showed that 7% to 12% of the beta diversity was determined by nonlinear spatial variables jointly with biotic and abiotic sediment variables (Figure 8). Here, the infaunal structure correlated with an oscillation model along the west–east axis, differentiating the three groups of transects (dbMEM 1, Figure S5C). This is consistent with the biological PCA analyses showing that the benthic abundances and biovolumes were clustered according to these same groups of transects (Figure 7). In these conditions, the benthic community structure was related to the quality of sediment organic matter (i.e., TC:TN, Chl-a:Phaeo and Chl-a:TC ratios), which changed between the groups of transects.
A remaining part of the beta diversity (7% to 9%) was only defined by nonlinear spatial structures (dbMEMs) and, thus, not explainable by the variables used in our analysis. Other biotic or abiotic variables related to microscale heterogeneity, biological interactions or neutral processes, not described here, could explain this tendency.
It is likely that the soft and brackish sediments of the western consolidated part of the mudbank (group 1, A to C) were suitable substrates for the burrowing activities of Halmyrapseudes spansii (tanaid, family Parapseudidae) and Ostracod spp. [35,70,71,72]. The latter would benefit from low wave induced shear stress resulting from the attenuation of wave energy by the vegetated mudbank in the eastern sector. The presence of tanaids and ostracods only in the meiofaunal samples from stations J and K led us to conclude that the sediments at these stations were more stabilized than those at stations AA and L. These last stations were located in the western part of the mud bank which was still likely to be highly mobile. This highlighted the strong sensitivity of tanaids and ostracods to the sediment consolidation state. Another study also noticed the absence of tanaid species in highly unstable and dynamic sediments along the FG coast [33]. Being herbivores on attached algae or detritivores, tanaids and ostracods preferentially feed on diatoms [73,74,75], which is consistent with their distribution in the consolidated bare sediments. Studies in Egypt and Turkey [76,77] found high abundances of ostracods usually associated with well oxygenated sediments due to diatom photosynthetic activities, and to areas of coarse silt and fine sand, consistent with our measurement in the bare sediment areas.
Although we did not take any porewater oxygen measurements, it is likely that sediments from group 2 (D to G) were suboxic—anoxic, given the greater proportion of cyanobacteria relative to diatoms and the dominance of Oligochaeta spp. Previous studies have shown the ecological preferences and physiological adaptations of Oligochaeta spp. to oxygen poor environments [78,79]. In this study, the dominance of oligochaetes may result from organic matter enrichment by microalgal mats [80,81] and probably by pioneer mangrove seedlings. Oligochaeta spp., first considered as deposit feeders, would also be able to feed on dissolved organic substances, particularly sugars and amino acids [79]. Dissolved organic matter can be released as exopolysaccharides from the benthic biofilm [82,83] following high frequent deposition at immersed tidal periods during spring tides [84,85]. Although algal mats are known to inhibit copepod larval settlement in other ecosystems [86], we argue that the copepods we observed in greatest abundances at the sediment surface of the early vegetated transects have adapted their grazing activity to concentrate on cyanobacteria [87,88].
Desiccation is known to be an important factor limiting polychaete populations in consolidated bare tidal flats bordering mangroves [18], likely explaining their absence in group 2 transects (D–G). Polychaetes were mainly represented in this study by Capitellidae and Nereididae within the most vegetated transects (group 3, H–I), where degraded organic matter enrichment associated with higher silt clay fractions and substrate elevation became favorable for the growth of polychaete larvae and juveniles and for their burial [15,18,89]. The benthic assemblages in group 3 (H–I) differed from the others by having higher densities of insect larvae (Cerotopoginidae and Chironomidae) the development of which was favored by a low wave energy habitat, substrate humidity and litter detritus as food resources [90,91].
Finally, 7–9% of infaunal beta diversity was correlated with nonlinear spatial variables unrelated to the mangrove gradient (Figure 8). This variation is related to small scale spatial heterogeneity, i.e., changes in the morphology and elevation of the order of meters between creeks, flat areas, and depressions [64], but also changes in root density, canopy cover and food resources [12,14,92]. Likewise, such spatial heterogeneity is known to influence crab distributions in the study area [34,64]. In this study, this may explain the patchy distribution of some taxa of the mesofauna (i.e., ostracods and tanaids) and of the macrofauna (i.e., Uca cumulanta and Coleoptera sp.4), particularly in some vegetated sediments. For instance, roots provide hard substrates for specific arthropod assemblages such as insect larvae or crabs [12]. The strong association found in this study between pneumatophores and annelid (Capitellidae and Nereididae) occurrences (Figure 7) is likely to be due to deep sediment oxidation by roots, thus favoring worm burial. Roots can also offer refuges from predators [93]. Although we did not study biotic relationships, our findings are consistent with the conclusions of [94], that brachyurans, fishes and birds can also directly (by predation) or indirectly (by competition or habitat physical disturbance) impact the small sized infauna distribution.

4.3. Benthic Biodiversity Patterns in Highly Dynamic Amazon Influenced Mangroves

Low alpha diversity values (0.5 < ENS < 3; 0.2 < J < 0.7) were observed overall, as classically and naturally found in benthic communities of transitional waters in estuaries, deltas or lagoons [95]. In tropical areas, these communities are usually homogeneous with high infaunal densities and the dominance of a few OTUs referring to pioneer like species [20]. In our study, this was more marked within the intertidal bare mud for the macrofaunal community (ENS < 1; J < 0.4) than for the mesofaunal ones (ENS > 1.5; J > 0.5). We explain this difference by the omnipresence of tanaids (H. spansii) within the macrofauna of bare sediments, while the mesofauna was a mix, in variable abundances, of “real mesofauna” (mature in this size class; e.g., H. spansii), permanent meiofauna (e.g., nematodes, ostracods, copepods) and temporary meiofauna (juveniles of a few OTUs of macrofauna, e.g., bivalves or polychaetes). The tanaid species (>0.5 mm) of the Sinnamary estuary would be more resistant and opportunistically developed according to their smaller size and earlier adulthood [33]. Previous studies [30,32] also showed low macrofaunal diversity composed by small sized (mostly < 10 mm in length) polychaetes, bivalves, gastropods and a large fraction of tanaids in bare intertidal mudflats in Surinam and FG. They attributed the low diversity and small size of the macrofauna to unstable bare sediments along the Guianas coast. However, these authors analyzed macrofauna > 0.5 mm without taking into account the 0.25–0.5 mm size fraction, thus underestimating the mesofaunal component. Yet, another study in the Amazon influenced mobile muds found more than 50% of all infauna in the size range 0.3–0.5 mm while a large part of the remaining benthic biomass was attributed to the meiofauna and bacteria [31]. The present study confirmed the dominance of mesofauna (>74%) and emphasized the fact that the mesofaunal communities (>0.25 mm) were more heterogeneous and diverse than the macrofaunal ones (>1 mm), and likely more adapted to such unstable mudbanks. It has been shown that intertidal bare muds preceding mangrove development in Australia are characterized by a more diverse mesofauna in the mudflat than at mangrove sites [21,22]. Since we did not identify the most abundant mesofauna OTUs (nematodes, ostracods, copepods) at the level of families, genus or species, it is likely that we underestimated their species richness within FG bare muds. We know, for instance, that several nematode genera are specific to adult mangrove stands in another FG area (Cayenne estuary), thus reflecting the influence of differences in physical and biogeochemical composition of mangrove sediments [96].
The increases in the alpha diversity (OTU richness, diversity indices) and beta diversity (variance of the community, i.e., its heterogeneity) with mangrove growth emphasized the fact that macrofaunal communities become more heterogeneous at vegetated transects. This trend was explained mainly by the appearance of new OTUs with lower abundances but large sizes (Chironomidae and Ceratopogonidae larvae, Coleoptera sp., Polychaeta, Namalycastis sp., Uca sp.). The same OTUs occurred within the mesofauna, indicating the presence of juvenile macrofauna (low biovolumes). Mangrove roots and mudflat geomorphological variations associated with creeks and depressions created a variety of ecological niches including crab burrows and mounds [5,97], enhancing benthic diversity [98]. Habitat complexity also favored the multiplicity of food resources for the invertebrates (litter, cyanobacteria, diatoms), their trophic modes and the associated food webs. We suppose this was suitable for the establishment of specialist species (longer life cycle species generally characterized by larger body size and low densities) as observed in subtropical mangroves of the Persian Gulf [15], but also for maintaining species with a wide range of life strategies [99]. Large sized macrofaunal taxa were also observed during the development of restored young Indo-Pacific mangroves [97,100,101,102].
As the FG coast is part of a unique sedimentary system influenced by the tremendous volumes of mud discharged from the Amazon River, the comparisons with mangroves from other biogeographical regions facing less dynamic environmental conditions remains difficult. Moreover, very few studies of benthic infauna have been carried out on the Guianas coast, and those studies concerned the bare intertidal mud flats but not the mangrove covered upper part of the mudbanks. This underscores the difficulty Alongi [20] encountered when he attempted a comparison between Amazon influenced mangroves and Australian bare tidal flats and mangroves facing the Great Barrier Reef. The main differences in infaunal abundances between these biogeographical regions come from the very great abundances that we measured in FG. At similar mesh sizes and sampling area units, the total densities of mesofauna (0.25 mm < x < 1 mm) were 18-fold higher compared to those of tropical tidal flats in Australia, Thailand and Chile [21]. Considering the similar ages of mangroves and only macrofaunal densities (>1 mm), the latter were at least 11-fold higher than in areas of restored pioneer and young mangroves [97,100,102] and in naturally developing mangroves in Malaysia and China [16]. Although we know that the vegetation structure impacts benthic composition, we contend that the persistently high and reoccurring sediment inputs and the exceptionally rapid environmental changes associated with mangrove development promote the unique characteristics of the infaunal benthic succession in FG. The exceptionally high abundances have not been observed in the mangroves east of the Amazon delta, an area of the coast of Brazil not influenced by the Amazon system, and depleted of mud [39].
The diversity indices and the OTU richness that we measured at the vegetated stages are similar to those of other mangrove benthic assemblages not influenced by the Amazon muds [16,39,100]. Clearly, benthic species diversity in FG mangroves is not impoverished compared with the other regions, despite the regional sediment dynamics, rapid mangrove growth, and monospecific mangrove forests. However, further studies are needed on the benthic diversity within muds associated with older stages of mangroves in FG in order to verify this hypothesis. Indeed, sediments associated with mature mangroves are generally characterized by harsh conditions (long substrate air exposure times, sediment compaction and drought, dense root networks and low redox conditions) potentially reducing the infaunal density, and stabilizing or decreasing the OTUs richness [16,103].
The unique “mangrove belt” ecosystem along the coasts of the Guianas in South America is the result of sediment accretion and erosion phases and model ecological resilience [38]. The benthic diversity of FG mangroves follows the succession of repetitive erosion/accretion phases. In his renowned study on the resilience and stability of ecological systems, Holling [104] highlighted the importance of knowing the amplitude and frequency of oscillations to understand the behavior of particular systems. Whether benthic infaunal assemblages tend toward a persistent structure or permanently adjust to this constantly evolving environment [105] remains to be determined, given the long term oscillation of erosion/accretion phases along the FG coast [25]. Long term temporal monitoring of growing mangroves (including the oldest stands, and seasonal variability with potential effects of rain and freshwater inputs) is thus required to validate the hypothesis of permanent benthic adaptability to constantly varying environmental conditions in these coastal mangrove systems.

5. Conclusions

This study is the first to quantify variance partitioning (i.e., beta diversity) in benthic community structure in response to mangrove development. We showed that, on the Amazon River influenced coast of the Guianas, during the dry season, four sets of variables can explain the spatial structure of the benthic infaunal communities. The single most important one was a linear spatial structure associated with changes in substrate elevation, porewater salinity, TC content and pneumatophore density, which explained 20–30% of the infaunal structure variations along a west to east gradient of mangrove maturation. Up to 7–12% of the variance partitioning was attributable to nonlinear spatial patterns and sediment organic matter quality changes between the three main mangrove stages (bare sediments, pioneer and young mangroves). However, 7% to 9% of the beta diversity was not explainable by the variables used in our analysis, and, rather, could be the result of other biotic or abiotic variables, biological interactions or neutral processes, likely related to small scale spatial heterogeneity (i.e., substrate geomorphology, pneumatophores and crab burrows), but not described here. This study has highlighted initial hypotheses that are relevant to initiatives on biodiversity evaluation or the success of mangrove restoration through monitoring of benthic biodiversity. Variables do not change only linearly with mangrove growth, but they also depend strongly on microhabitat (along with sediment parameters). Scientists and managers involved in such initiatives are urged to identify the spatial heterogeneity of their marine area and should identify the kind of microhabitats they could include in their monitoring designs.
By examining two infaunal size structures, we demonstrated that the mesofaunal communities (0.25 mm) were more heterogeneous and diverse than the macrofaunal ones (>1 mm) in the bare sediments. On the contrary, the macrofaunal communities became heterogeneous and diversified in the vegetated sediments. Overall, mangrove early development increased the alpha and beta diversities of the infaunal communities for the two size classes.
This study raises questions regarding the meso- and macro infaunal benthic community composition and structure within older stages of mangroves. Whether this community structure is repeated at each new mangrove cycle or is permanently modified along the FG coast, depending on local environmental conditions and seasonal variables, remains to be determined. In a global context of threats to mangroves worldwide, future studies in FG should consider additional sampling of young and older mangrove stands over both the wet and dry seasons, in order to be able to generalize patterns in infaunal succession associated with the entire mangrove community life cycle.

Supplementary Materials

The following are available online at https://www.mdpi.com/article/10.3390/su14052829/s1. Figure S1: Microphytobenthos (diatoms and cyanobacteria) (a) mean abundances (Cells mL−1) and (b) mean relative density (%) along the mangrove maturation gradient (transects B–I; mean ± SD, 2 < n < 6). Figure S2: Relationships between mangrove stages and surface sediment (black symbols) and 18 centimeter-depth averaged (grey dots) parameters at transects A, E and I. Empty and filled dots denote replicates and means, respectively. The significance values of the ANCOVAs are shown on the graphs. ANCOVA was not applied to salinity (no core replicates per transect). Figure S3: (A) mean relative density (n ≤ 9; %) of the meiofauna OTUs at mobile mud stations (AA, J, K and L) and at some consolidated stations of the mangrove maturation gradient (A, B, E, F, G, H and I). (B) mean abundances of tanaids (No.g−1 DW) per size class (1 to 6 mm) at the stations (A, B, J, K) containing tanaids (mean ± SD, n ≤ 6). Figure S4: Bubble plot of predicted position (linear constraints) on the only canonical axis for the linear models of Hellinger transformed abundances as a function of (A) east–west and (B) south–north coordinates. (C) Bubble plots depicting the selected positive dbMEM spatial Eigen functions after forward selection. The dbMEM1, dbMEM5 and dbMEM6 were included in the models for detrended Hellinger transformed abundances and biovolumes. The dbMEM7 was only included in the model of abundances. Figure S5: RDA correlation triplot of infaunal community data and selected environmental variables based on Hellinger transformed (A) abundance and (B) biovolume infaunal data. Stations of the three groups of transects are represented by specific colored circles (white: A–C, group 1; grey: D–G, group 2; black: H–I, group 3). “Grain size” refers to median grain size, “Pneumatophore” refers to roots density, “Elevation” refers to substrate height. In the top graph “Gr” denotes three taxa clustered too close to be distinguished Gastropoda sp.1, Bivalvia sp.1 and Melitidae sp.1. Table S1: Taxonomic list of the OTUs (nd: not defined).

Author Contributions

Conceptualization, E.M., A.A., O.G., F.F., R.C.A. and G.T.; methodology, E.M., A.A., O.G., F.F., J.Y.A., R.C.A., G.B., E.J.A., A.G. and G.T.; software, E.M., A.A., O.G. and G.B.; validation, E.M., A.A., O.G., F.F., G.B., E.J.A. and G.T.; formal analysis, E.M., A.A., O.G., F.F., J.Y.A., R.C.A., G.B., E.J.A., A.G., V.L.G. and A.L.; investigation, E.M., A.A., O.G., F.F., J.Y.A., R.C.A., G.B., E.J.A., A.G., V.L.G., A.L. and G.T.; resources, E.M., A.A., O.G., F.F., J.Y.A., R.C.A., G.B., E.J.A., A.G. and A.L.; data curation, E.M., A.A., O.G., F.F., J.Y.A., R.C.A., G.B., E.J.A., A.G., V.L.G., A.L. and G.T.; writing—original draft preparation, E.M., A.A., O.G. and G.T.; writing—review and editing, E.M., A.A., O.G., F.F., J.Y.A., R.C.A., G.B., E.J.A., A.L. and G.T.; visualization, E.M., A.A., O.G. and G.B.; supervision, E.M., A.A., O.G., F.F. and G.T.; project administration, E.M.; funding acquisition, E.M. All authors have read and agreed to the published version of the manuscript.

Funding

This research was mainly funded by French National Agency (ANR-12-JSV7-0012-01, ANR-10-LABX-19), and co-funded by French national program EC2CO-Biohefect/Ecodyn/Dril/McrobiEn (MAGUY project). The APC was funded by the French Institute for sustainable development (IRD). A. Aschenbroich’s PhD thesis was funded by the Université de Bretagne Occidentale (UBO). R.C.A. and J.Y.A. were additionally funded by NSF grants OCE 1737749, 1332418, and 1060915.

Institutional Review Board Statement

Not applicable.

Informed Consent Statement

Not applicable.

Data Availability Statement

The data presented in this study are available on request from the corresponding author.

Acknowledgments

We thank Erwan Aublet, Frederic Baltzer, Claire Bear, Beatriz Beker, Isabelle Bihannic, Florian de Bettignies, Katia Christos dos Santos, Elise Desoche, Vivien Hulot, Sylvain Orseau, Romain Walcker, Yann Rousseau, Max Sarrazin, and Quinn Plunkett for their help in the field and with laboratory analyses. Two anonymous reviewers provided insightful comments for revision. This paper is a GDR Liga’s contribution.

Conflicts of Interest

The authors declare no conflict of interest. The funders had no role in the design of the study; in the collection, analyses, or interpretation of data; in the writing of the manuscript, or in the decision to publish the results.

Appendix A. Explanation Selection of Variables Prior to Variance Partitioning Analysis

Appendix A.1. Selection of Spatial Variables

Of the 26 dbMEM spatial eigenfunctions identified, 10 were related to positive spatial autocorrelation and retained. Positive autocorrelation implies that the closer observations are made in space, the closer their values are for what is observed. They accounted for 40% of variation in community composition (abundances: 9999 permutations, R2Adj = 0.40, F = 2.771, p < 0.001) but only 12% of variation in biovolume (9999 perm., R2Adj = 0.12, F = 1.338, p < 0.05). Forward selection of dbMEMS resulted in models with 4 (dbMEM 1, 5, 6, 7; 9999 perm., R2Adj = 0.34, F = 4.426, p < 0.001) and 3 (dbMEM 1, 5, 6; 9999 perm., R2Adj = 0.15, F = 2.546, p < 0.001) explanatory variables for abundance and biovolume, respectively. These dbMEMs are shown in Appendix A2 and were retained for spatial modelling in the variation partitioning analysis.

Appendix A.2. Selection of Abiotic Variables

The full abiotic environmental model accounted for nearly 50% of variation in community composition abundances (abundance, 9999 perm., R2Adj = 0.49, F = 6.032, p < 0.001) but only 30% of variation in biovolumes (9999 perms., R2Adj = 0.30, F = 3.188, p < 0.001). Forward selection of variables resulted in a model with elevation, median grain size and salinity for abundances (9999 perm., R2Adj = 0.46, F = 8.496, p < 0.001), whereas only elevation and grain size were selected for biovolumes (9999 perm., R2Adj = 0.30, F = 6.474, p < 0.001).

Appendix A.3. Selection of Biotic Variables

In a similar way, all biotic environmental variables accounted for nearly 50% of variation in community composition data (9999 perm., R2Adj = 0.49, F = 9.230, p < 0.001) and a little over 30% of variation in biovolume (9999 perm., R2Adj = 0.33, F = 3.590, p < 0.001). Forward selection of variables resulted in a model with C:N ratio, pneumatophore density and Phaeo:Chl-a ratio for abundances (9999 perm., R2Adj = 0.49, F = 9.230, p < 0.001), whereas only C:N ratio and pneumatophore density were selected for biovolumes (9999 perm., R2Adj = 0.29, F = 6.401, p < 0.001). The selected biotic and abiotic environmental variables were retained for variation partitioning analysis.

References

  1. Duke, N.C. Mangrove Floristics and Biogeography Revisited: Further Deductions from Biodiversity Hot Spots, Ancestral Discontinuities, and Common Evolutionary Processes. In Mangrove Ecosystems: A Global Biogeographic Perspective: Structure, Function, and Services; Rivera-Monroy, V.H., Lee, S.Y., Kristensen, E., Twilley, R.R., Eds.; Springer International Publishing: Cham, Switzerland, 2017; pp. 17–53. ISBN 978-3-319-62206-4. [Google Scholar]
  2. Polidoro, B.A.; Carpenter, K.E.; Collins, L.; Duke, N.C.; Ellison, A.M.; Ellison, J.C.; Farnsworth, E.J.; Fernando, E.S.; Kathiresan, K.; Koedam, N.E.; et al. The Loss of Species: Mangrove Extinction Risk and Geographic Areas of Global Concern. PLoS ONE 2010, 5, e10095. [Google Scholar] [CrossRef] [PubMed]
  3. Cannicci, S.; Burrows, D.; Fratini, S.; Smith, T.J.; Offenberg, J.; Dahdouh-Guebas, F. Faunal impact on vegetation structure and ecosystem function in mangrove forests: A review. Aquat. Bot. 2008, 89, 186–200. [Google Scholar] [CrossRef]
  4. Kristensen, E. Mangrove crabs as ecosystem engineers; with emphasis on sediment processes. J. Sea Res. 2008, 59, 30–43. [Google Scholar] [CrossRef]
  5. Lee, S.Y. Mangrove macrobenthos: Assemblages, services, and linkages. J. Sea Res. 2008, 59, 16–29. [Google Scholar] [CrossRef]
  6. Lee, S.Y.; Primavera, J.H.; Dahdouh-Guebas, F.; McKee, K.; Bosire, J.O.; Cannicci, S.; Diele, K.; Fromard, F.; Koedam, N.; Marchand, C.; et al. Ecological role and services of tropical mangrove ecosystems: A reassessment. Glob. Ecol. Biogeogr. 2014, 23, 726–743. [Google Scholar] [CrossRef]
  7. Hai, N.T.; Dell, B.; Phuong, V.T.; Harper, R.J. Towards a more robust approach for the restoration of mangroves in Vietnam. Ann. For. Sci. 2020, 77, 18. [Google Scholar] [CrossRef] [Green Version]
  8. Kodikara, K.A.S.; Mukherjee, N.; Jayatissa, L.P.; Dahdouh-Guebas, F.; Koedam, N. Have mangrove restoration projects worked? An in-depth study in Sri Lanka. Restor. Ecol. 2017, 25, 705–716. [Google Scholar] [CrossRef]
  9. Worthington, T.A.; zu Ermgassen, P.S.E.; Friess, D.A.; Krauss, K.W.; Lovelock, C.E.; Thorley, J.; Tingey, R.; Woodroffe, C.D.; Bunting, P.; Cormier, N.; et al. A global biophysical typology of mangroves and its relevance for ecosystem structure and deforestation. Sci. Rep. 2020, 10, 14652. [Google Scholar] [CrossRef]
  10. Ellison, A.M. Foundation Species, Non-trophic Interactions, and the Value of Being Common. iScience 2019, 13, 254–268. [Google Scholar] [CrossRef] [Green Version]
  11. Chapman, M.G.; Tolhurst, T.J. The relationship between invertebrate assemblages and bio-dependant properties of sediment in urbanized temperate mangrove forests. J. Exp. Mar. Biol. Ecol. 2004, 304, 51–73. [Google Scholar] [CrossRef]
  12. Procheş, Ş.; Marshall, D.J.; Ugrasen, K.; Ramcharan, A. Mangrove pneumatophore arthropod assemblages and temporal patterns. J. Mar. Biol. Assoc. UK 2001, 81, 545–552. [Google Scholar] [CrossRef]
  13. Dahdouh-Guebas, F.; Verneirt, M.; Cannicci, S.; Kairo, J.G.; Tack, J.F.; Koedam, N. An exploratory study on grapsid crab zonation in Kenyan mangroves. Wetl. Ecol. Manag. 2002, 10, 179–187. [Google Scholar] [CrossRef]
  14. Kon, K.; Kurokura, H.; Tongnunui, P. Influence of a microhabitat on the structuring of the benthic macrofaunal community in a mangrove forest. Hydrobiologia 2011, 671, 205. [Google Scholar] [CrossRef]
  15. Delfan, N.; Shojaei, M.G.; Naderloo, R. Patterns of structural and functional diversity of macrofaunal communities in a subtropical mangrove ecosystem. Estuar. Coast. Shelf Sci. 2021, 252, 107288. [Google Scholar] [CrossRef]
  16. Chen, Q.; Li, J.; Zhang, L.; Lu, H.; Ren, H.; Jian, S. Changes in the Macrobenthic Faunal Community during Succession of a Mangrove Forest at Zhanjiang, South China. Coas 2015, 31, 315–325. [Google Scholar] [CrossRef]
  17. Chen, Q.; Zhao, Q.; Chen, P.; Lu, H.; Jian, S. Eco-exergy based self-organization of the macrobenthic faunal assemblage during mangrove succession in Zhanjiang, China. Ecol. Indic. 2018, 95, 887–894. [Google Scholar] [CrossRef]
  18. Metcalfe, K.N.; Glasby, C.J. Diversity of Polychaeta (Annelida) and other worm taxa in mangrove habitats of Darwin Harbour, northern Australia. J. Sea Res. 2008, 59, 70–82. [Google Scholar] [CrossRef]
  19. Alfaro, A.C. Benthic macro-invertebrate community composition within a mangrove/seagrass estuary in northern New Zealand. Estuar. Coast. Shelf Sci. 2006, 66, 97–110. [Google Scholar] [CrossRef]
  20. Alongi, D.M. Ecology of tropical soft-bottom benthos: A review with emphasis on emerging concepts. Rev. Biol. Trop. 1989, 37, 85–100. [Google Scholar]
  21. Dittmann, S. Benthos structure on tropical tidal flats of Australia. Helgo. Meeresunters 1995, 49, 539–551. [Google Scholar] [CrossRef] [Green Version]
  22. Dittmann, S.; Vargas, J.A. Tropical Tidal Flat Benthos Compared Between Australia and Central America. In Ecological Comparisons of Sedimentary Shores; Reise, K., Ed.; Ecological Studies; Springer: Berlin/Heidelberg, Germany, 2001; pp. 275–293. ISBN 978-3-642-56557-1. [Google Scholar]
  23. Reise, K.; Herre, E.; Sturm, M. Biomass and abundance of macrofauna in intertidal sediments of Konigshafen in the northern Wadden Sea. Helgo. Meeresunters 1994, 48, 201–205. [Google Scholar] [CrossRef] [Green Version]
  24. Anthony, E.J.; Gardel, A.; Gratiot, N.; Proisy, C.; Allison, M.A.; Dolique, F.; Fromard, F. The Amazon-influenced muddy coast of South America: A review of mud-bank–shoreline interactions. Earth-Sci. Rev. 2010, 103, 99–121. [Google Scholar] [CrossRef]
  25. Walcker, R.; Anthony, E.J.; Cassou, C.; Aller, R.C.; Gardel, A.; Proisy, C.; Martinez, J.-M.; Fromard, F. Fluctuations in the extent of mangroves driven by multi-decadal changes in North Atlantic waves. J. Biogeogr. 2015, 42, 2209–2219. [Google Scholar] [CrossRef]
  26. Orseau, S.; Abascal Zorrilla, N.; Huybrechts, N.; Lesourd, S.; Gardel, A. Decadal-scale morphological evolution of a muddy open coast. Mar. Geol. 2020, 420, 106048. [Google Scholar] [CrossRef] [Green Version]
  27. Fromard, F.; Puig, H.; Mougin, E.; Marty, G.; Betoulle, J.L.; Cadamuro, L. Structure, above-ground biomass and dynamics of mangrove ecosystems: New data from French Guiana. Oecologia 1998, 115, 39–53. [Google Scholar] [CrossRef] [PubMed]
  28. Proisy, C.; Gratiot, N.; Anthony, E.J.; Gardel, A.; Fromard, F.; Heuret, P. Mud bank colonization by opportunistic mangroves: A case study from French Guiana using lidar data. Cont. Shelf Res. 2009, 29, 632–641. [Google Scholar] [CrossRef]
  29. Marchand, C.; Lallier-Vergès, E.; Baltzer, F. The composition of sedimentary organic matter in relation to the dynamic features of a mangrove-fringed coast in French Guiana. Estuar. Coast. Shelf Sci. 2003, 56, 119–130. [Google Scholar] [CrossRef] [Green Version]
  30. Swennen, C.; Duiven, P.; Spaans, A.L. Numerical density and biomass of macrobenthic animals living in the intertidal zone of Surinam, South America. Neth. J. Sea Res. 1982, 15, 406–418. [Google Scholar] [CrossRef]
  31. Aller, J.Y.; Stupakoff, I. The distribution and seasonal characteristics of benthic communities on the Amazon shelf as indicators of physical processes. Cont. Shelf Res. 1996, 16, 717–751. [Google Scholar] [CrossRef]
  32. Jourde, J.; Dupuy, C.; Nguyen, H.T.; Mizrahi, D.; de Pracontal, N.; Bocher, P. Low Benthic Macrofauna Diversity in Dynamic, Tropical Tidal Mudflats: Migrating Banks on Guiana’s Coast, South America. Estuaries Coasts 2017, 40, 1159–1170. [Google Scholar] [CrossRef]
  33. Nguyen, H.T.; Dupuy, C.; Jourde, J.; Lefrançois, C.; Pascal, P.-Y.; Carpentier, A.; Chevalier, J.; Bocher, P. Persistent benthic communities in the extreme dynamic intertidal mudflats of the Amazonian coast: An overview of the Tanaidacea (Crustacea, Peracarida). Mar. Biodivers. 2018, 48, 1841–1853. [Google Scholar] [CrossRef]
  34. Aschenbroich, A.; Michaud, E.; Stieglitz, T.; Fromard, F.; Gardel, A.; Tavares, M.; Thouzeau, G. Brachyuran crab community structure and associated sediment reworking activities in pioneer and young mangroves of French Guiana, South America. Estuar. Coast. Shelf Sci. 2016, 182, 60–71. [Google Scholar] [CrossRef] [Green Version]
  35. Aschenbroich, A.; Michaud, E.; Gilbert, F.; Fromard, F.; Alt, A.; Le Garrec, V.; Bihannic, I.; De Coninck, A.; Thouzeau, G. Bioturbation functional roles associated with mangrove development in French Guiana, South America. Hydrobiologia 2017, 794, 179–202. [Google Scholar] [CrossRef] [Green Version]
  36. Brunier, G.; Anthony, E.J.; Gratiot, N.; Gardel, A. Exceptional rates and mechanisms of muddy shoreline retreat following mangrove removal. Earth Surf. Processes Landf. 2019, 44, 1559–1571. [Google Scholar] [CrossRef]
  37. Anthony, E.J.; Gratiot, N. Coastal engineering and large-scale mangrove destruction in Guyana, South America: Averting an environmental catastrophe in the making. Ecol. Eng. 2012, 47, 268–273. [Google Scholar] [CrossRef]
  38. Toorman, E.A.; Anthony, E.; Augustinus, P.G.E.F.; Gardel, A.; Gratiot, N.; Homenauth, O.; Huybrechts, N.; Monbaliu, J.; Moseley, K.; Naipal, S. Interaction of Mangroves, Coastal Hydrodynamics, and Morphodynamics along the Coastal Fringes of the Guianas. In Threats to Mangrove Forests: Hazards, Vulnerability, and Management; Makowski, C., Finkl, C.W., Eds.; Coastal Research Library; Springer International Publishing: Cham, Switzerland, 2018; pp. 429–473. ISBN 978-3-319-73016-5. [Google Scholar]
  39. Filho, J.S.R.; Aviz, D. Macrobenthic communities of an Amazonian estuary (Guajará Bay, Brazil): Temporal and spatial changes. Coas 2013, 65, 123–128. [Google Scholar] [CrossRef]
  40. Bernardino, A.F.; Netto, S.A.; Pagliosa, P.R.; Barros, F.; Christofoletti, R.A.; Rosa Filho, J.S.; Colling, A.; Lana, P.C. Predicting ecological changes on benthic estuarine assemblages through decadal climate trends along Brazilian Marine Ecoregions. Estuar. Coast. Shelf Sci. 2015, 166, 74–82. [Google Scholar] [CrossRef]
  41. Whittaker, R.H. Evolution and Measurement of Species Diversity. Taxon 1972, 21, 213–251. [Google Scholar] [CrossRef] [Green Version]
  42. Fromard, F.; Vega, C.; Proisy, C. Half a century of dynamic coastal change affecting mangrove shorelines of French Guiana. A case study based on remote sensing data analyses and field surveys. Mar. Geol. 2004, 208, 265–280. [Google Scholar] [CrossRef]
  43. MacIntyre, H.L.; Geider, R.J.; Miller, D.C. Microphytobenthos: The ecological role of the “secret garden” of unvegetated, shallow-water marine habitats. I. Distribution, abundance and primary production. Estuaries 1996, 19, 186–201. [Google Scholar] [CrossRef]
  44. Marchand, C.; Baltzer, F.; Lallier-Vergès, E.; Albéric, P. Pore-water chemistry in mangrove sediments: Relationship with species composition and developmental stages (French Guiana). Mar. Geol. 2004, 208, 361–381. [Google Scholar] [CrossRef] [Green Version]
  45. Riviere, A. Méthodes Granulométriques-Techniques et Interprétations; Masson: Paris, France, 1977. [Google Scholar]
  46. Riaux-Gobin, C.; Klein, B. Microphytobenthic Biomass Measurement Using HPLC and Conventional Pigment Analysis. In Handbook of Methods in Aquatic Microbial Ecology; CRC Press: Boca Raton, FL, USA, 1993; ISBN 978-0-203-75274-6. [Google Scholar]
  47. Lund, J.W.G.; Kipling, C.; Le Cren, E.D. The inverted microscope method of estimating algal numbers and the statistical basis of estimations by counting. Hydrobiologia 1958, 11, 143–170. [Google Scholar] [CrossRef]
  48. Hasle, G.R. Using the Inverted Microscope. In Phytoplankton Manual; Sournia, A., Ed.; UNESCO: Paris, France, 1978; pp. 191–196. [Google Scholar]
  49. Warwick, R.M.; Gee, J.M. Community structure of estuarine meiobenthos. Mar. Ecol. Prog. Ser. 1984, 18, 97–111. [Google Scholar] [CrossRef]
  50. Anderson, M.J. Permutational Multivariate Analysis of Variance (PERMANOVA). Wiley StatsRef Stat. Ref. Online 2017, 1–15. [Google Scholar] [CrossRef]
  51. Young, S.G.; Bowman, A.W. Non-Parametric Analysis of Covariance. Biometrics 1995, 51, 920–931. [Google Scholar] [CrossRef]
  52. Legendre, P.; Gallagher, E.D. Ecologically Meaningful Transformations for Ordination of Species Data. Oecologia 2001, 129, 271–280. [Google Scholar] [CrossRef]
  53. Dray, S.; Legendre, P.; Peres-Neto, P.R. Spatial modelling: A comprehensive framework for principal coordinate analysis of neighbour matrices (PCNM). Ecol. Model. 2006, 196, 483–493. [Google Scholar] [CrossRef]
  54. Borcard, D.; Legendre, P. Environmental control and spatial structure in ecological communities: An example using oribatid mites (Acari, Oribatei). Environ. Ecol Stat. 1994, 1, 37–61. [Google Scholar] [CrossRef]
  55. Gauch, H.G. Prediction, Parsimony and Noise. Am. Sci. 1993, 81, 468–478. [Google Scholar]
  56. Blanchet, F.G.; Legendre, P.; Borcard, D. Forward Selection of Explanatory Variables. Ecology 2008, 89, 2623–2632. [Google Scholar] [CrossRef]
  57. R: A language and Environment for Statistical Computing. Available online: https://www.gbif.org/tool/81287/r-a-language-and-environment-for-statistical-computing (accessed on 29 November 2021).
  58. Lê, S.; Josse, J.; Husson, F. FactoMineR: An R Package for Multivariate Analysis. J. Stat. Softw. 2008, 25, 1–18. [Google Scholar] [CrossRef] [Green Version]
  59. Oksanen, J.; Blanchet, F.G.; Friendly, M.; Kindt, R.; Legendre, P.; McGlinn, D.; Minchin, P.R.; O’Hara, R.B.; Simpson, G.L.; Solymos, P.; et al. Vegan: Community Ecology Package R; R Package Version 2.5-7. 2020. Available online: https://CRAN.R-project.org/package=vegan (accessed on 15 February 2022).
  60. Dray, S.; Bauman, D.; Blanchet, G.; Borcard, D.; Clappe, S.; Guenard, G.; Jombart, T.; Larocque, G.; Legendre, P.; Madi, N.; et al. Adespatial: Multivariate Multiscale Spatial Analysis; R Package Version 0.3-14. 2021. Available online: https://CRAN.R-project.org/package=adespatial (accessed on 15 February 2022).
  61. Saenger, P.; Snedaker, S.C. Pantropical Trends in Mangrove Above-Ground Biomass and Annual Litterfall. Oecologia 1993, 96, 293–299. [Google Scholar] [CrossRef] [PubMed] [Green Version]
  62. Aller, R.C.; Heilbrun, C.; Panzeca, C.; Zhu, Z.; Baltzer, F. Coupling between sedimentary dynamics, early diagenetic processes, and biogeochemical cycling in the Amazon–Guianas mobile mud belt: Coastal French Guiana. Mar. Geol. 2004, 208, 331–360. [Google Scholar] [CrossRef]
  63. Fabre, A.; Fromard, F.R.; Trichon, V. Fractionation of phosphate in sediments of four representative mangrove stages (French Guiana). Hydrobiologia 1999, 392, 13–19. [Google Scholar] [CrossRef]
  64. Brunier, G.; Michaud, E.; Fleury, J.; Anthony, E.J.; Morvan, S.; Gardel, A. Assessing the relationship between macro-faunal burrowing activity and mudflat geomorphology from UAV-based Structure-from-Motion photogrammetry. Remote Sens. Environ. 2020, 241, 111717. [Google Scholar] [CrossRef]
  65. Anthony, E.J. Sediment dynamics and morphological stability of estuarine mangrove swamps in Sherbro Bay, West Africa. Mar. Geol. 2004, 208, 207–224. [Google Scholar] [CrossRef]
  66. Reef, R.; Feller, I.C.; Lovelock, C.E. Nutrition of mangroves. Tree Physiol. 2010, 30, 1148–1160. [Google Scholar] [CrossRef] [Green Version]
  67. Sylvestre, F.; Guiral, D.; Debenay, J.P. Modern diatom distribution in mangrove swamps from the Kaw Estuary (French Guiana). Mar. Geol. 2004, 208, 281–293. [Google Scholar] [CrossRef]
  68. Alvarenga, D.O.; Rigonato, J.; Branco, L.H.Z.; Fiore, M.F. Cyanobacteria in mangrove ecosystems. Biodivers. Conserv. 2015, 24, 799–817. [Google Scholar] [CrossRef]
  69. Rigonato, J.; Kent, A.D.; Alvarenga, D.O.; Andreote, F.D.; Beirigo, R.M.; Vidal-Torrado, P.; Fiore, M.F. Drivers of cyanobacterial diversity and community composition in mangrove soils in south-east Brazil. Environ. Microbiol. 2013, 15, 1103–1114. [Google Scholar] [CrossRef]
  70. Bacescu, M.; Gutu, M. A new genus (Discapseudes N.G.) and three new species of Apseudidae (Crustacea, Tanaidacea) from the Northeastern coast of South America. Zool. Meded. 1975, 49, 95–113. [Google Scholar]
  71. Raffaelli, D.; Hawkins, S. Intertidal Ecology; Chapman and Hall: London, UK; Cambridge University Press: London, UK, 1996; Volume 77. [Google Scholar]
  72. de Lucas Pardo, M.A.; Bakker, M.; van Kessel, T.; Cozzoli, F.; Winterwerp, J.C. Erodibility of soft freshwater sediments in Markermeer: The role of bioturbation by meiobenthic fauna. Ocean. Dyn. 2013, 63, 1137–1150. [Google Scholar] [CrossRef]
  73. Thorp, J.H.; Covich, A.P. Ecology and Classification of North American Freshwater Invertebrates, 3rd ed.; Elsevier Academic Press: Amsterdam, The Netherlands, 2009; ISBN 9780080889818. [Google Scholar]
  74. Blazewicz-Paszkowycz, M.; Bamber, R.; Anderson, G. Diversity of Tanaidacea (Crustacea: Peracarida) in the World’s Oceans–How Far Have We Come? PLoS ONE 2012, 7, e33068. [Google Scholar]
  75. Drumm, D.T. Comparison of Feeding Mechanisms, Respiration, and Cleaning Behavior in Two Kalliapseudids, Kalliapseudes Macsweenyi and Psammokalliapseudes Granulosus (Peracarida: Tanaidacea). J. Crustacean Biol. 2005, 25, 203–211. [Google Scholar] [CrossRef] [Green Version]
  76. Hussain, S.M.; Noohu Nazeer, M.; Radhakrishnan, K.; Rajkumar, A.; Sivapriya, V. Mangrove Ostracoda species fluctuations, habitual adaptation, and its environmental implications—A review. In Holocene Climate Change and Environment; Kumaran, N., Damodara, P., Eds.; Elsevier: Amsterdam, The Netherlands, 2022; pp. 429–440. ISBN 978-0-323-90085-0. [Google Scholar]
  77. Helal, S.A.; El-Wahab, M.A. Distribution of podocopid ostracods in mangrove ecosystems along the Egyptian Red Sea Coast. Crustaceana 2012, 85, 1669–1696. [Google Scholar]
  78. Erséus, C. Mangroves and marine oligochaete diversity. Wetl. Ecol. Manag. 2002, 10, 197–202. [Google Scholar] [CrossRef]
  79. Giere, O. Ecology and Biology of Marine Oligochaeta–an Inventory Rather than another Review. Hydrobiologia 2006, 564, 103–116. [Google Scholar] [CrossRef]
  80. De Wit, R.; Jonkers, H.M.; Van Den Ende, F.P.; Van Gemerden, H. In situ fluctuations of oxygen and sulphide in marine microbial sediment ecosystems. Neth. J. Sea Res. 1989, 23, 271–281. [Google Scholar] [CrossRef]
  81. Stal, L.J.; van Gemerden, H.; Krumbein, W.E. Structure and development of a benthic marine microbial mat. FEMS Microbiol. Lett. 1985, 31, 111–125. [Google Scholar] [CrossRef]
  82. Brown, M.R. The amino-acid and sugar composition of 16 species of microalgae used in mariculture. J. Exp. Mar. Biol. Ecol. 1991, 145, 79–99. [Google Scholar] [CrossRef]
  83. Rossi, F.; De Philippis, R. Role of Cyanobacterial Exopolysaccharides in Phototrophic Biofilms and in Complex Microbial Mats. Life 2015, 5, 1218–1238. [Google Scholar] [CrossRef] [PubMed] [Green Version]
  84. Debenay, J.-P.; Jouanneau, J.-M.; Sylvestre, F.; Weber, O.; Guiral, D. Biological Origin of Rhythmites in Muddy Sediments of French Guiana. Coas 2007, 2007, 1431–1442. [Google Scholar] [CrossRef]
  85. Gensac, E.; Gardel, A.; Lesourd, S.; Brutier, L. Morphodynamic evolution of an intertidal mudflat under the influence of Amazon sediment supply–Kourou mud bank, French Guiana, South America. Estuar. Coast. Shelf Sci. 2015, 158, 53–62. [Google Scholar] [CrossRef]
  86. Norkko, A.; Bonsdorff, E. Population responses of coastal zoobenthos to stress induced by drifting algal mats. Mar. Ecol. Prog. Ser. 1996, 140, 141–151. [Google Scholar] [CrossRef] [Green Version]
  87. DeMott, W.R.; Moxter, F. Foraging Cyanobacteria by Copepods: Responses to Chemical Defense and Resource Abundance. Ecology 1991, 72, 1820–1834. [Google Scholar] [CrossRef]
  88. Hogfors, H.; Motwani, N.H.; Hajdu, S.; El-Shehawy, R.; Holmborn, T.; Vehmaa, A.; Engström-Öst, J.; Brutemark, A.; Gorokhova, E. Bloom-Forming Cyanobacteria Support Copepod Reproduction and Development in the Baltic Sea. PLoS ONE 2014, 9, e112692. [Google Scholar] [CrossRef] [Green Version]
  89. To-orn, N. Distribution and Density of Polychaetes in Tha Chin Mangrove Estuary, Samut Sakhon Province. Burapha Sci. J. 2020, 25, 1120–1135. [Google Scholar]
  90. Odum, W.E.; Heald, E.J. Trophic analyses of an estuarine mangrove community. Bull. Mar. Sci. 1972, 22, 671–738. [Google Scholar]
  91. Torreias, S.R.S.; Ferreira-Keppler, R.L.; Ronderos, M.M. Biting midges (Ceratopogonidae: Diptera) present in aquatic macrophytes from wetlands of Marchantaria Island, Iranduba, Central Amazonia, Brazil. J. Nat. Hist. 2014, 48, 109–122. [Google Scholar] [CrossRef]
  92. Freitas-Júnior, F.; Christoffersen, M.L.; de Araújo, J.P.; Branco, J.O. Spatiotemporal Distribution and Population Structure of Monokalliapseudes schubarti (Tanaidacea: Kalliapseudidae) in an Estuary in Southern Brazil. Sci. World J. 2013, 2013, e363187. [Google Scholar] [CrossRef]
  93. Primavera, J.H. Fish predation on mangrove-associated penaeids: The role of structures and substrate. J. Exp. Mar. Biol. Ecol. 1997, 215, 205–216. [Google Scholar] [CrossRef]
  94. Reinsel, K.A. Impact of fiddler crab foraging and tidal inundation on an intertidal sandflat: Season-dependent effects in one tidal cycle. J. Exp. Mar. Biol. Ecol. 2004, 313, 1–17. [Google Scholar] [CrossRef]
  95. Graal, J.; Coic, N. Synthèse Des Méthodes D’évaluation De La Qualité Du Benthos En Milieu Côtier Rebent; Ifremer: Brest, France, 2006; p. 90. [Google Scholar]
  96. Michelet, C.; Zeppilli, D.; Hubas, C.; Baldrighi, E.; Cuny, P.; Dirberg, G.; Militon, C.; Walcker, R.; Lamy, D.; Jézéquel, R.; et al. First Assessment of the Benthic Meiofauna Sensitivity to Low Human-Impacted Mangroves in French Guiana. Forests 2021, 12, 338. [Google Scholar] [CrossRef]
  97. Chen, G.-C.; Ye, Y.; Lu, C.-Y. Changes of macro-benthic faunal community with stand age of rehabilitated Kandelia candel mangrove in Jiulongjiang Estuary, China. Ecol. Eng. 2007, 31, 215–224. [Google Scholar] [CrossRef]
  98. Ward, J.V.; Tockner, K.; Schiemer, F. Biodiversity of floodplain river ecosystems: Ecotones and connectivity1. Regul. Rivers Res. Manag. 1999, 15, 125–139. [Google Scholar] [CrossRef]
  99. Martin, B.; Ferrer, M. Temporally variable environments maintain more beta-diversity in Mediterranean landscapes. Acta Oecologica 2015, 68, 1–10. [Google Scholar] [CrossRef]
  100. Sasekumar, A.; Chong, V.C. Faunal diversity in Malaysian mangroves. Glob. Ecol. Biogeogr. Lett. 1998, 7, 57–60. [Google Scholar] [CrossRef]
  101. Bosire, J.O.; Dahdouh-Guebas, F.; Walton, M.; Crona, B.I.; Lewis, R.R.; Field, C.; Kairo, J.G.; Koedam, N. Functionality of restored mangroves: A review. Aquat. Bot. 2008, 89, 251–259. [Google Scholar] [CrossRef] [Green Version]
  102. Chen, G.C.; Ye, Y. Restoration of Aegiceras corniculatum mangroves in Jiulongjiang Estuary changed macro-benthic faunal community. Ecol. Eng. 2011, 37, 224–228. [Google Scholar] [CrossRef]
  103. Morrisey, D.J.; Skilleter, G.A.; Ellis, J.I.; Burns, B.R.; Kemp, C.E.; Burt, K. Differences in benthic fauna and sediment among mangrove (Avicennia marina var. australasica) stands of different ages in New Zealand. Estuar. Coast. Shelf Sci. 2003, 56, 581–592. [Google Scholar] [CrossRef]
  104. Holling, C.S. Resilience and Stability of Ecological Systems. Annu. Rev. Ecol. Syst. 1973, 4, 1–23. [Google Scholar] [CrossRef] [Green Version]
  105. Connell, J.H. Diversity in Tropical Rain Forests and Coral Reefs. Science 1978, 199, 1302–1310. [Google Scholar] [CrossRef] [PubMed] [Green Version]
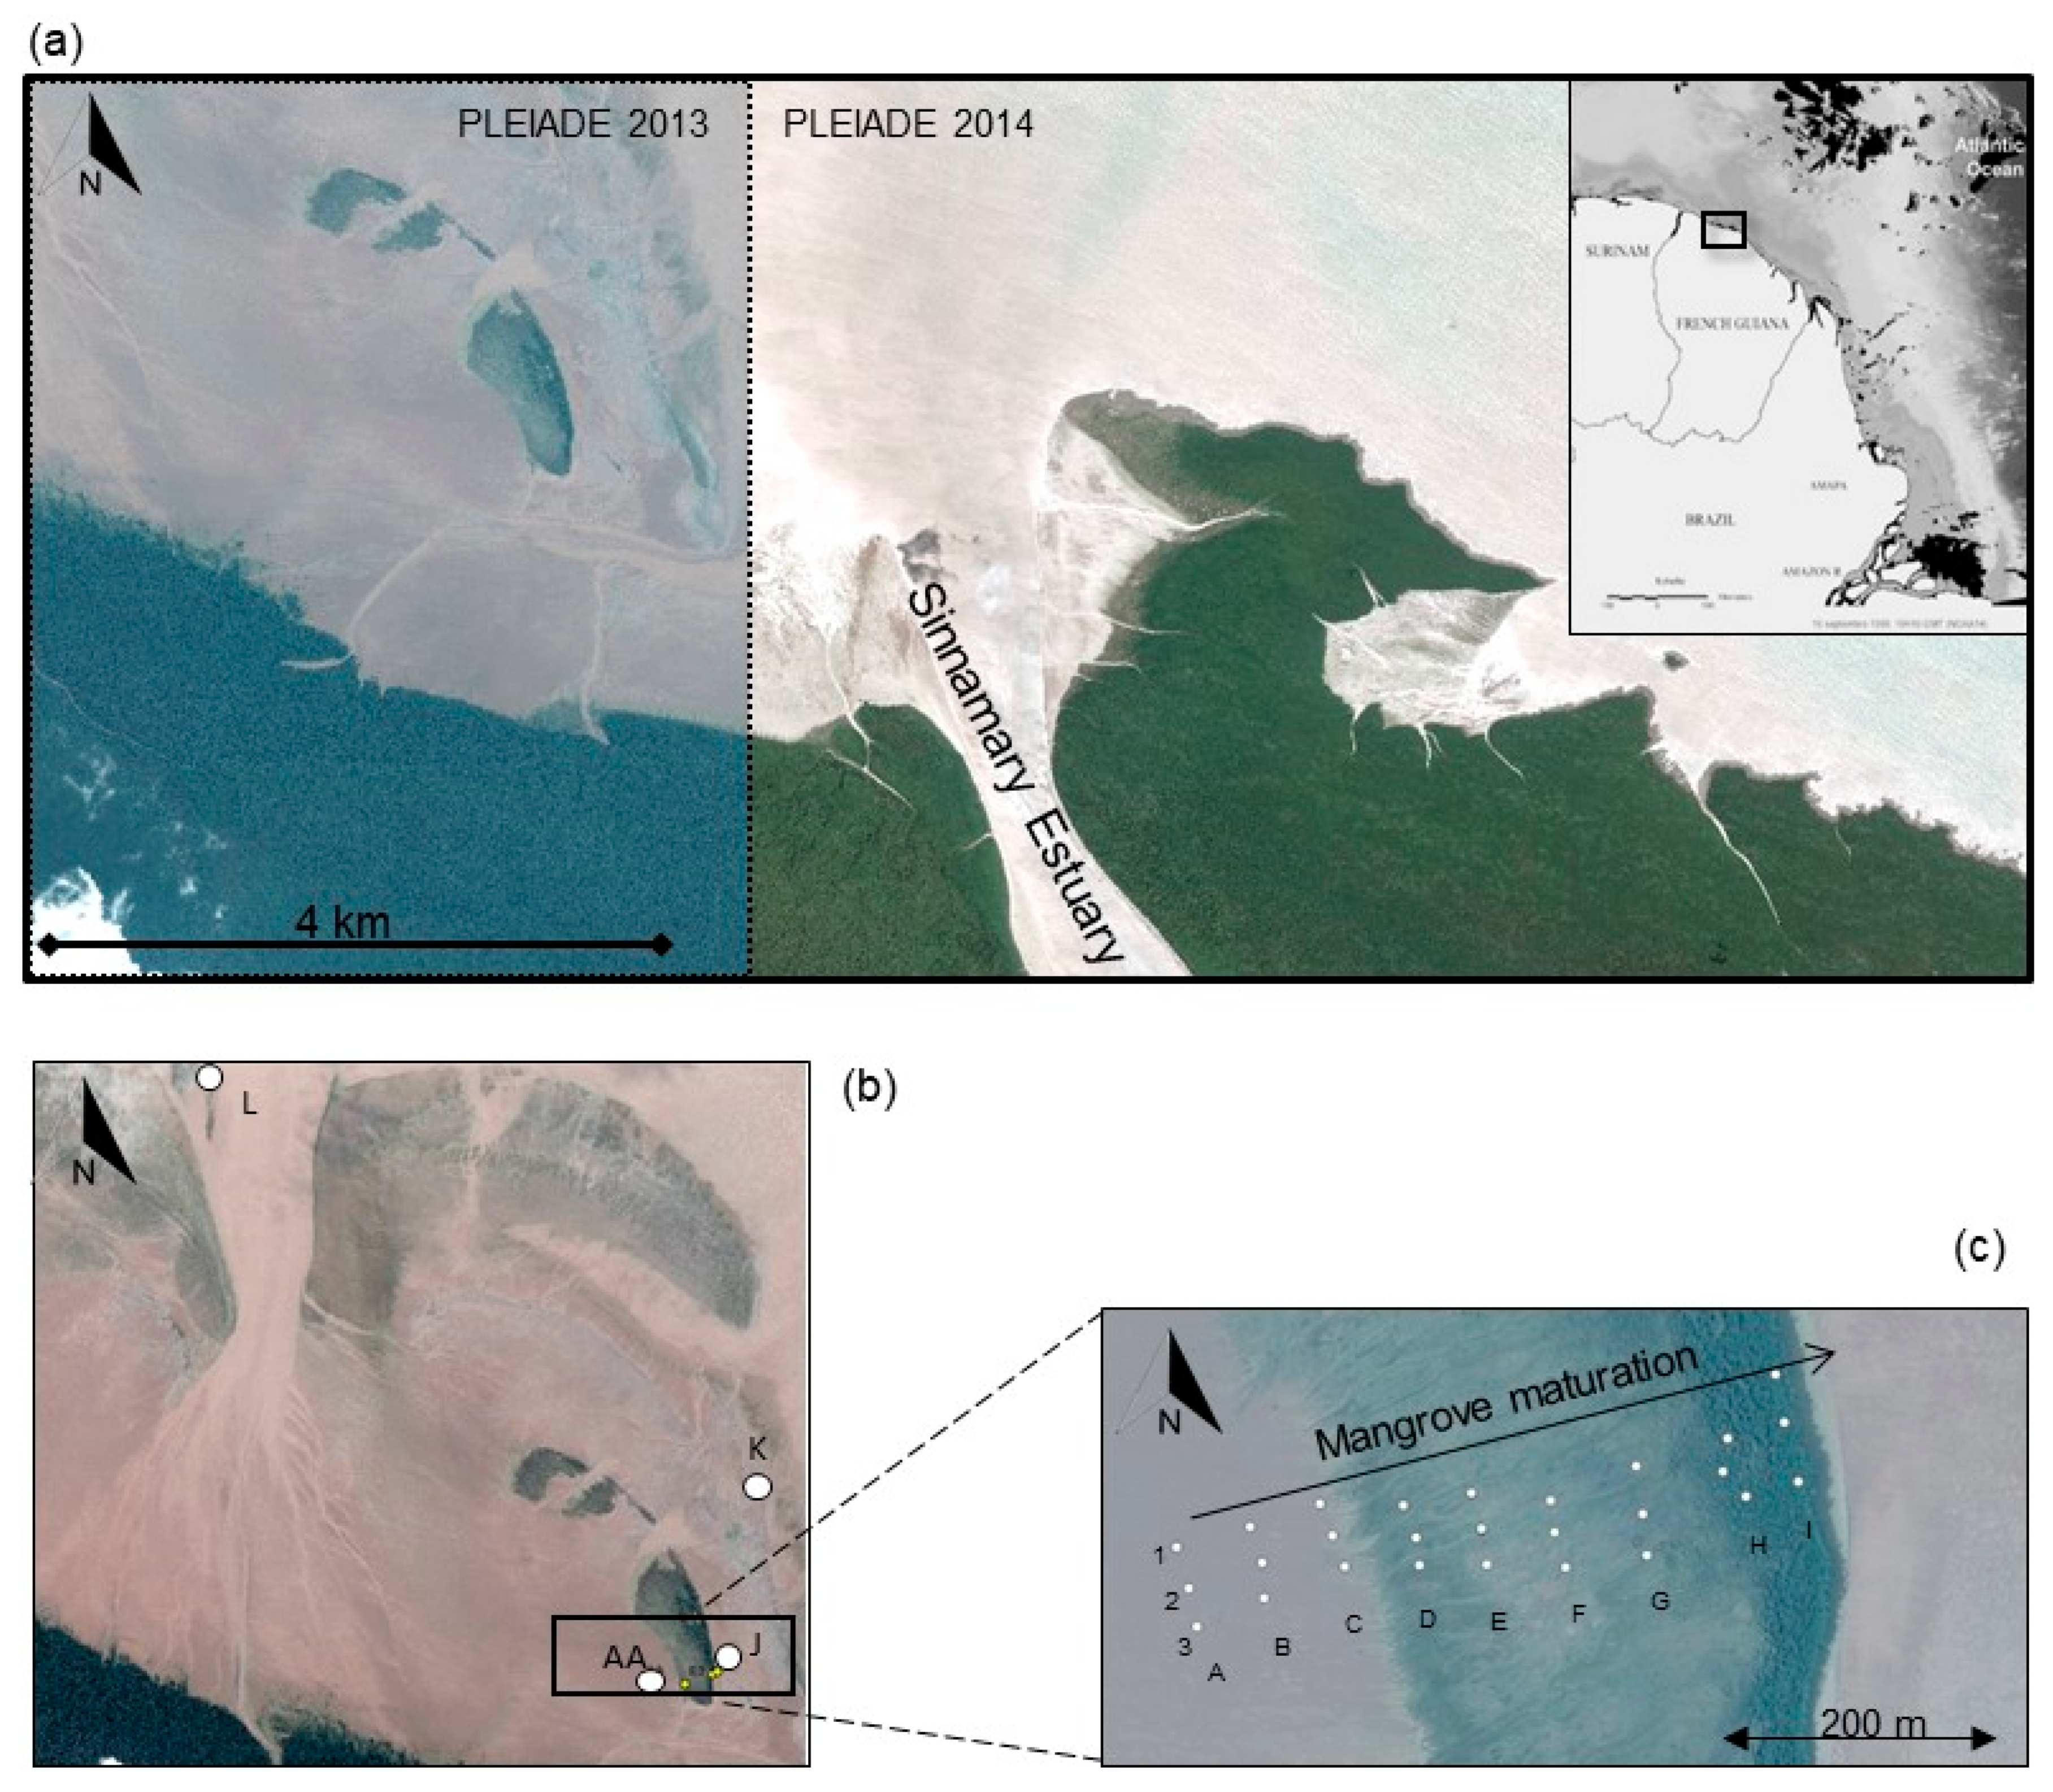
Figure 1. Study site and sampling locations. (a) Sampling area investigated near the Sinnamary estuary (French Guiana, South America), (b) mobile mud stations (AA, J, K and L), (c) consolidated mud stations with the mangrove maturation gradient (0 to 2 years old) along a grid crossing 9 shore-parallel transects (A to I), each containing three stations (1, 2, 3). The black arrow (mangrove maturation gradient) indicates increase in mangrove age. © CNES (2014) and Astrium services/PLEIADE Images (09/19/2013 and 2014, not for commercial use).
Sustainability 14 02829 g001
Figure 2. Study design employed for the meso and macro benthic community structure and surface sediment characteristics and their relationships along a mangrove growth gradient (0 to 2 years old, referring to the transects from A to I).
Sustainability 14 02829 g002
Figure 3. Principal component analysis performed on the correlation matrix of environmental variables (tree biomass, density and height, pneumatophore density, litter biomass, grain size, water content (WC), porosity, salinity, total carbon (TC), total nitrogen (TN), Chla and phaeopigments, TC:TN, Chla:phaeo and C-Chla:TOC ratios, along the mangrove maturation gradient (0 to 2 years old, referring to the transects from A to I). Together, axes 1 and 2 explain 68.7% of total variability in station data. The larger dots illustrate the centroids of the group of individuals for each transect.
Sustainability 14 02829 g003
Figure 4. (a) Bed elevation (m) along the study grid area. Pink dots indicate the locations of the topographic measurements; interpolations between dots were carried out following the natural neighbor method. Letters and numbers refer to the sampling stations of the grid. (bd) Vegetation structure along the study grid: (b) tree biomass (tons of dry matter per ha−1), (c) tree density (individuals per ha−1), (d) tree height (m); values averaged at each station and linearly extrapolated between stations along the mangrove gradient.
Sustainability 14 02829 g004
Figure 5. Mean (±SD, n = 9) porewater salinity (a), median grain size (µm) (b), total carbon (TC, %) (c), TC:TN ratio (d), Chla (e) and Phaeopigment (phaeo) (f) concentrations (µg g−1), and chla:phaeo (g) and C-Chla:TC (h) ratios along the mangrove maturation gradient (transects A–I, 0 to 2 years old) in October–November 2013.
Sustainability 14 02829 g005
Figure 6. Mean (mean ± SD, n = 3) OTU richness (a), Shannon index (b), Pielou index (J) (c), density (d) and biovolume (e) per transect (A–I) for meso, macro and total benthic infauna in October–November 2013.
Sustainability 14 02829 g006
Figure 7. Principal component analysis based on Hellingher transformed data for OTU abundances (a) and biovolumes (b) along the mangrove maturation gradient (transects A to I). For the abundance (a) and biovolume (b), the two axes explained 64.41% and 49.15% of total variance, respectively. Plotting characters for sites correspond to K-means clustering into 3 groups (circles, triangles, squares) with shades of grey corresponding to the established groups of transects based on the environmental PCA (white circles: A–C (group 1); grey boxes: D–G (group 2); black triangles: H–I (group 3).
Sustainability 14 02829 g007
Figure 8. Variation partitioning of the Hellinger transformed abundance (a) and biovolume (b) data among the four sets of explanatory variables: selected abiotic environmental variables (i.e., elevation, grain size, salinity), cartesian spatial coordinates (linear spatial structure); selected dbMEM spatial eigenfunctions (non linear spatial) and selected biotic environmental variables (i.e., phae:chl-a, TC:TN, pneumatophores). Values are R2Adj; values < 0.005% are not shown. The underlined values denote the variable or convergence of variables that mostly explain the infaunal community structure.
Sustainability 14 02829 g008
Publisher’s Note: MDPI stays neutral with regard to jurisdictional claims in published maps and institutional affiliations.