
Mathematical Modeling of the Dynamic Temperature Profile in Geothermal-Energy-Heated Natural Gas Hydrate Reservoirs


Abstract
:1. Introduction
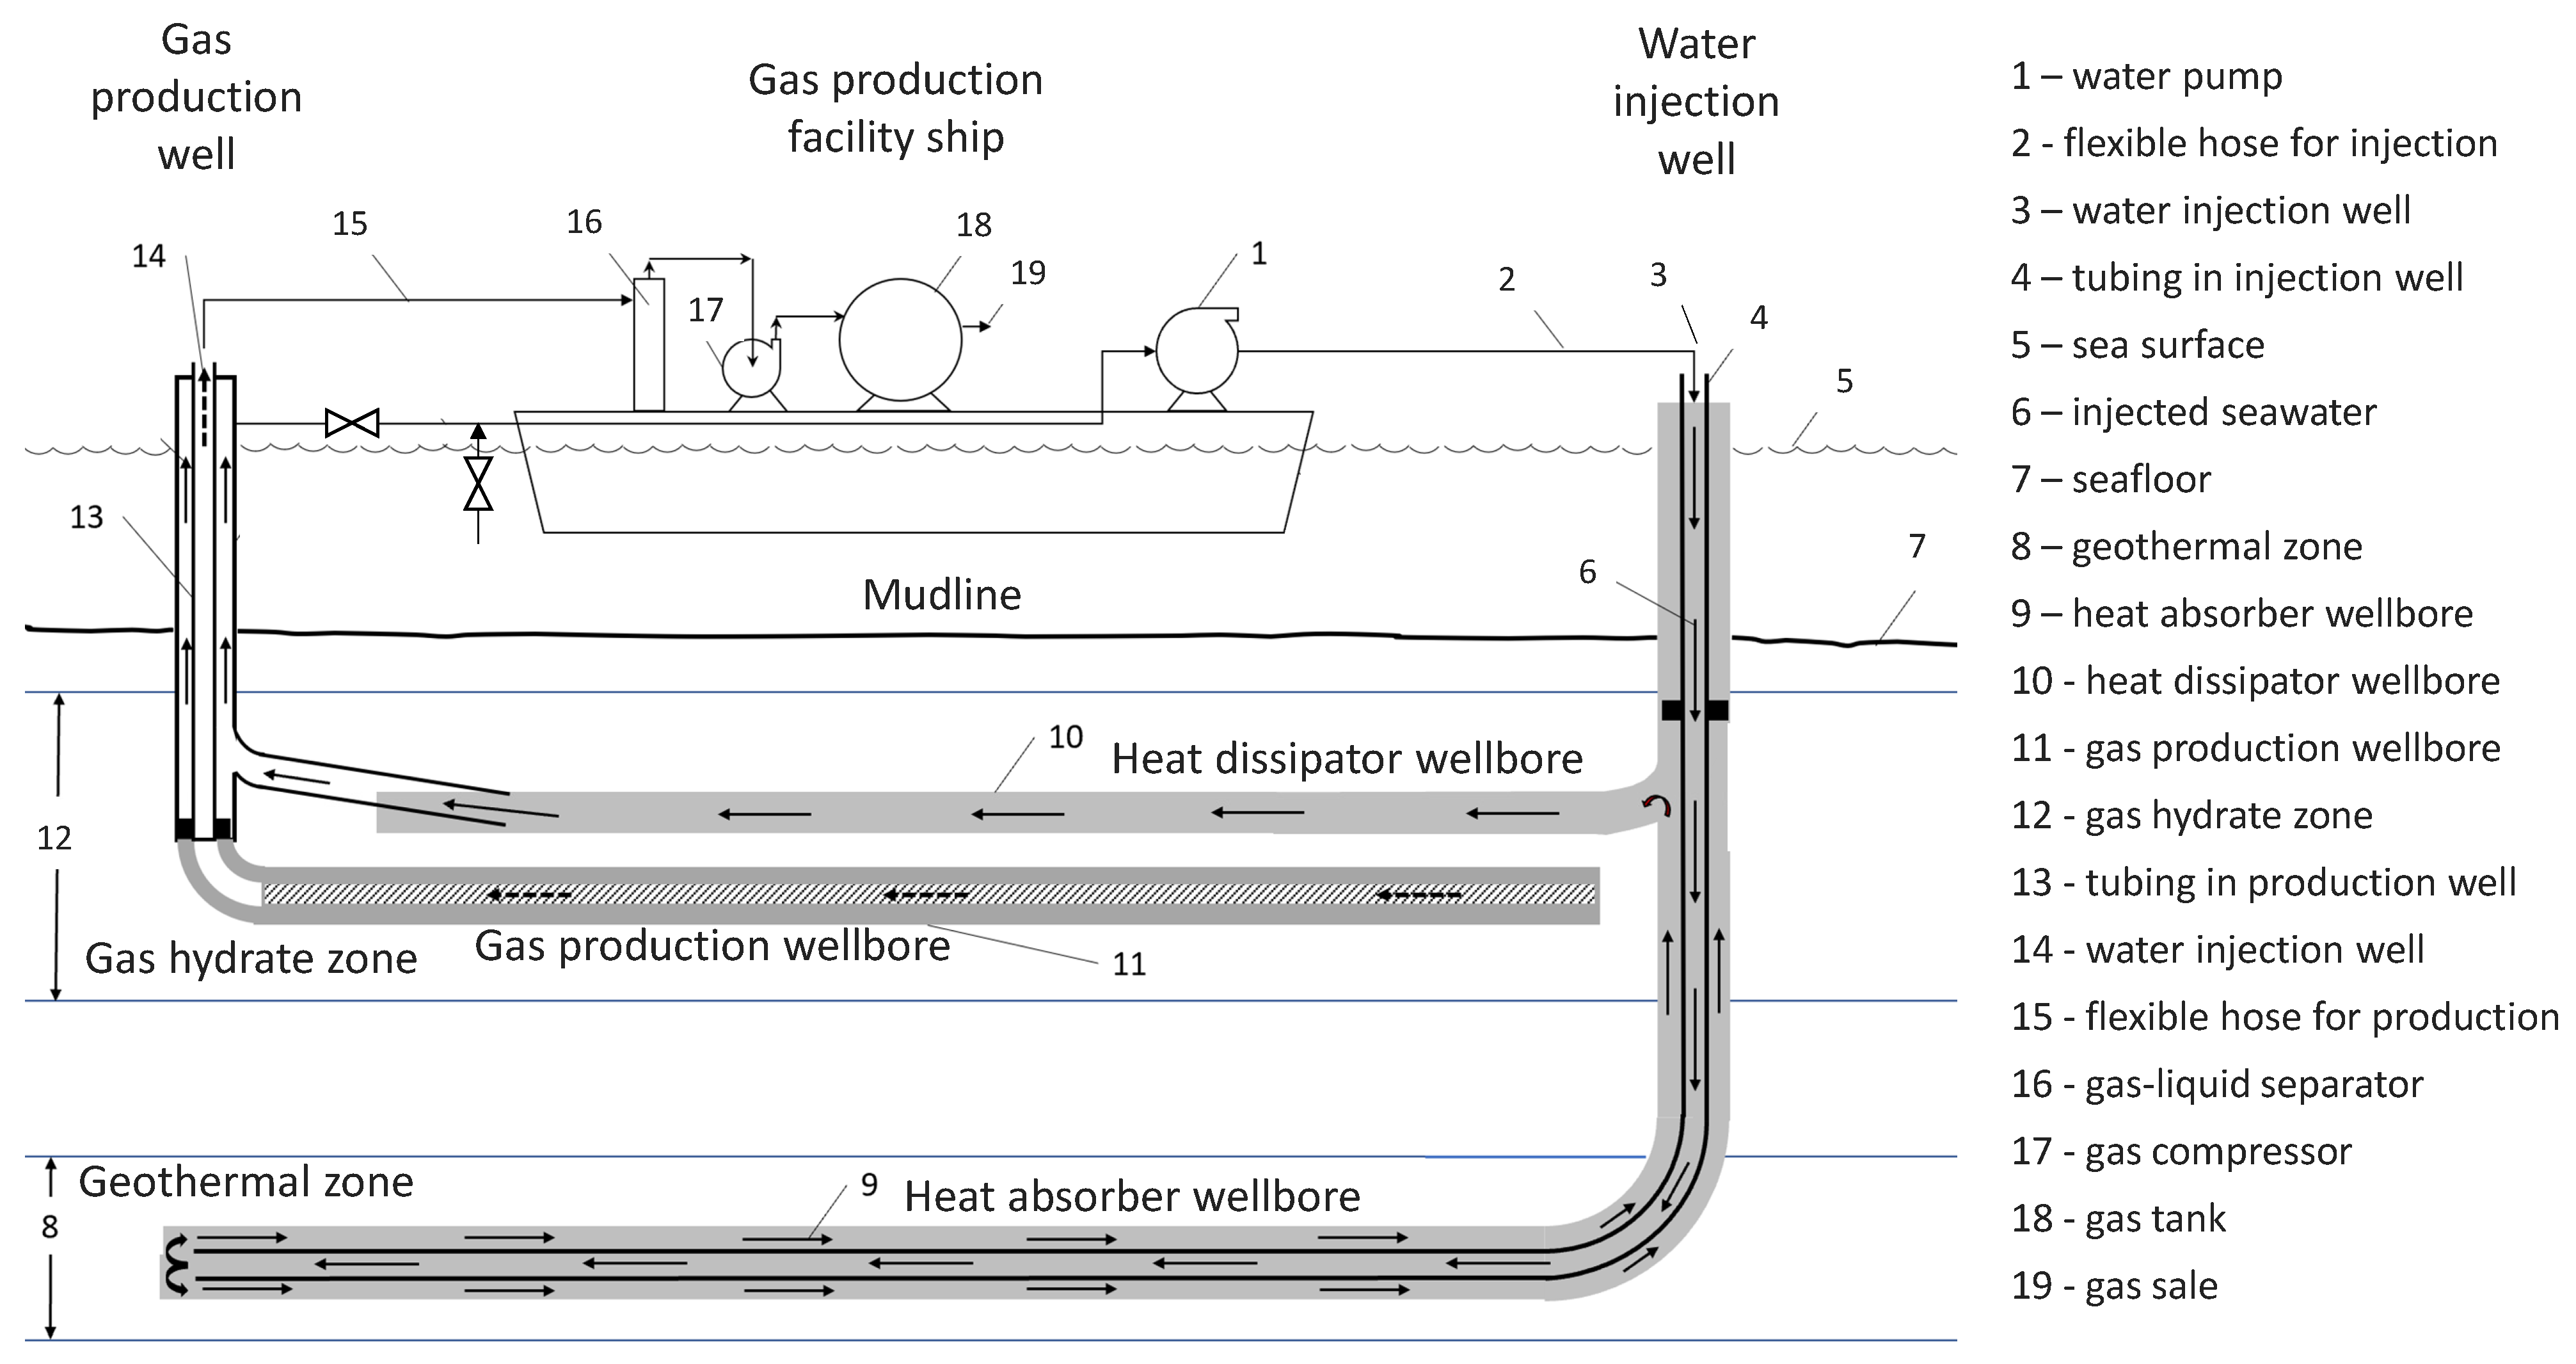
2. System Description
3. Mathematical Models
4. Applications
5. Discussion
6. Conclusions
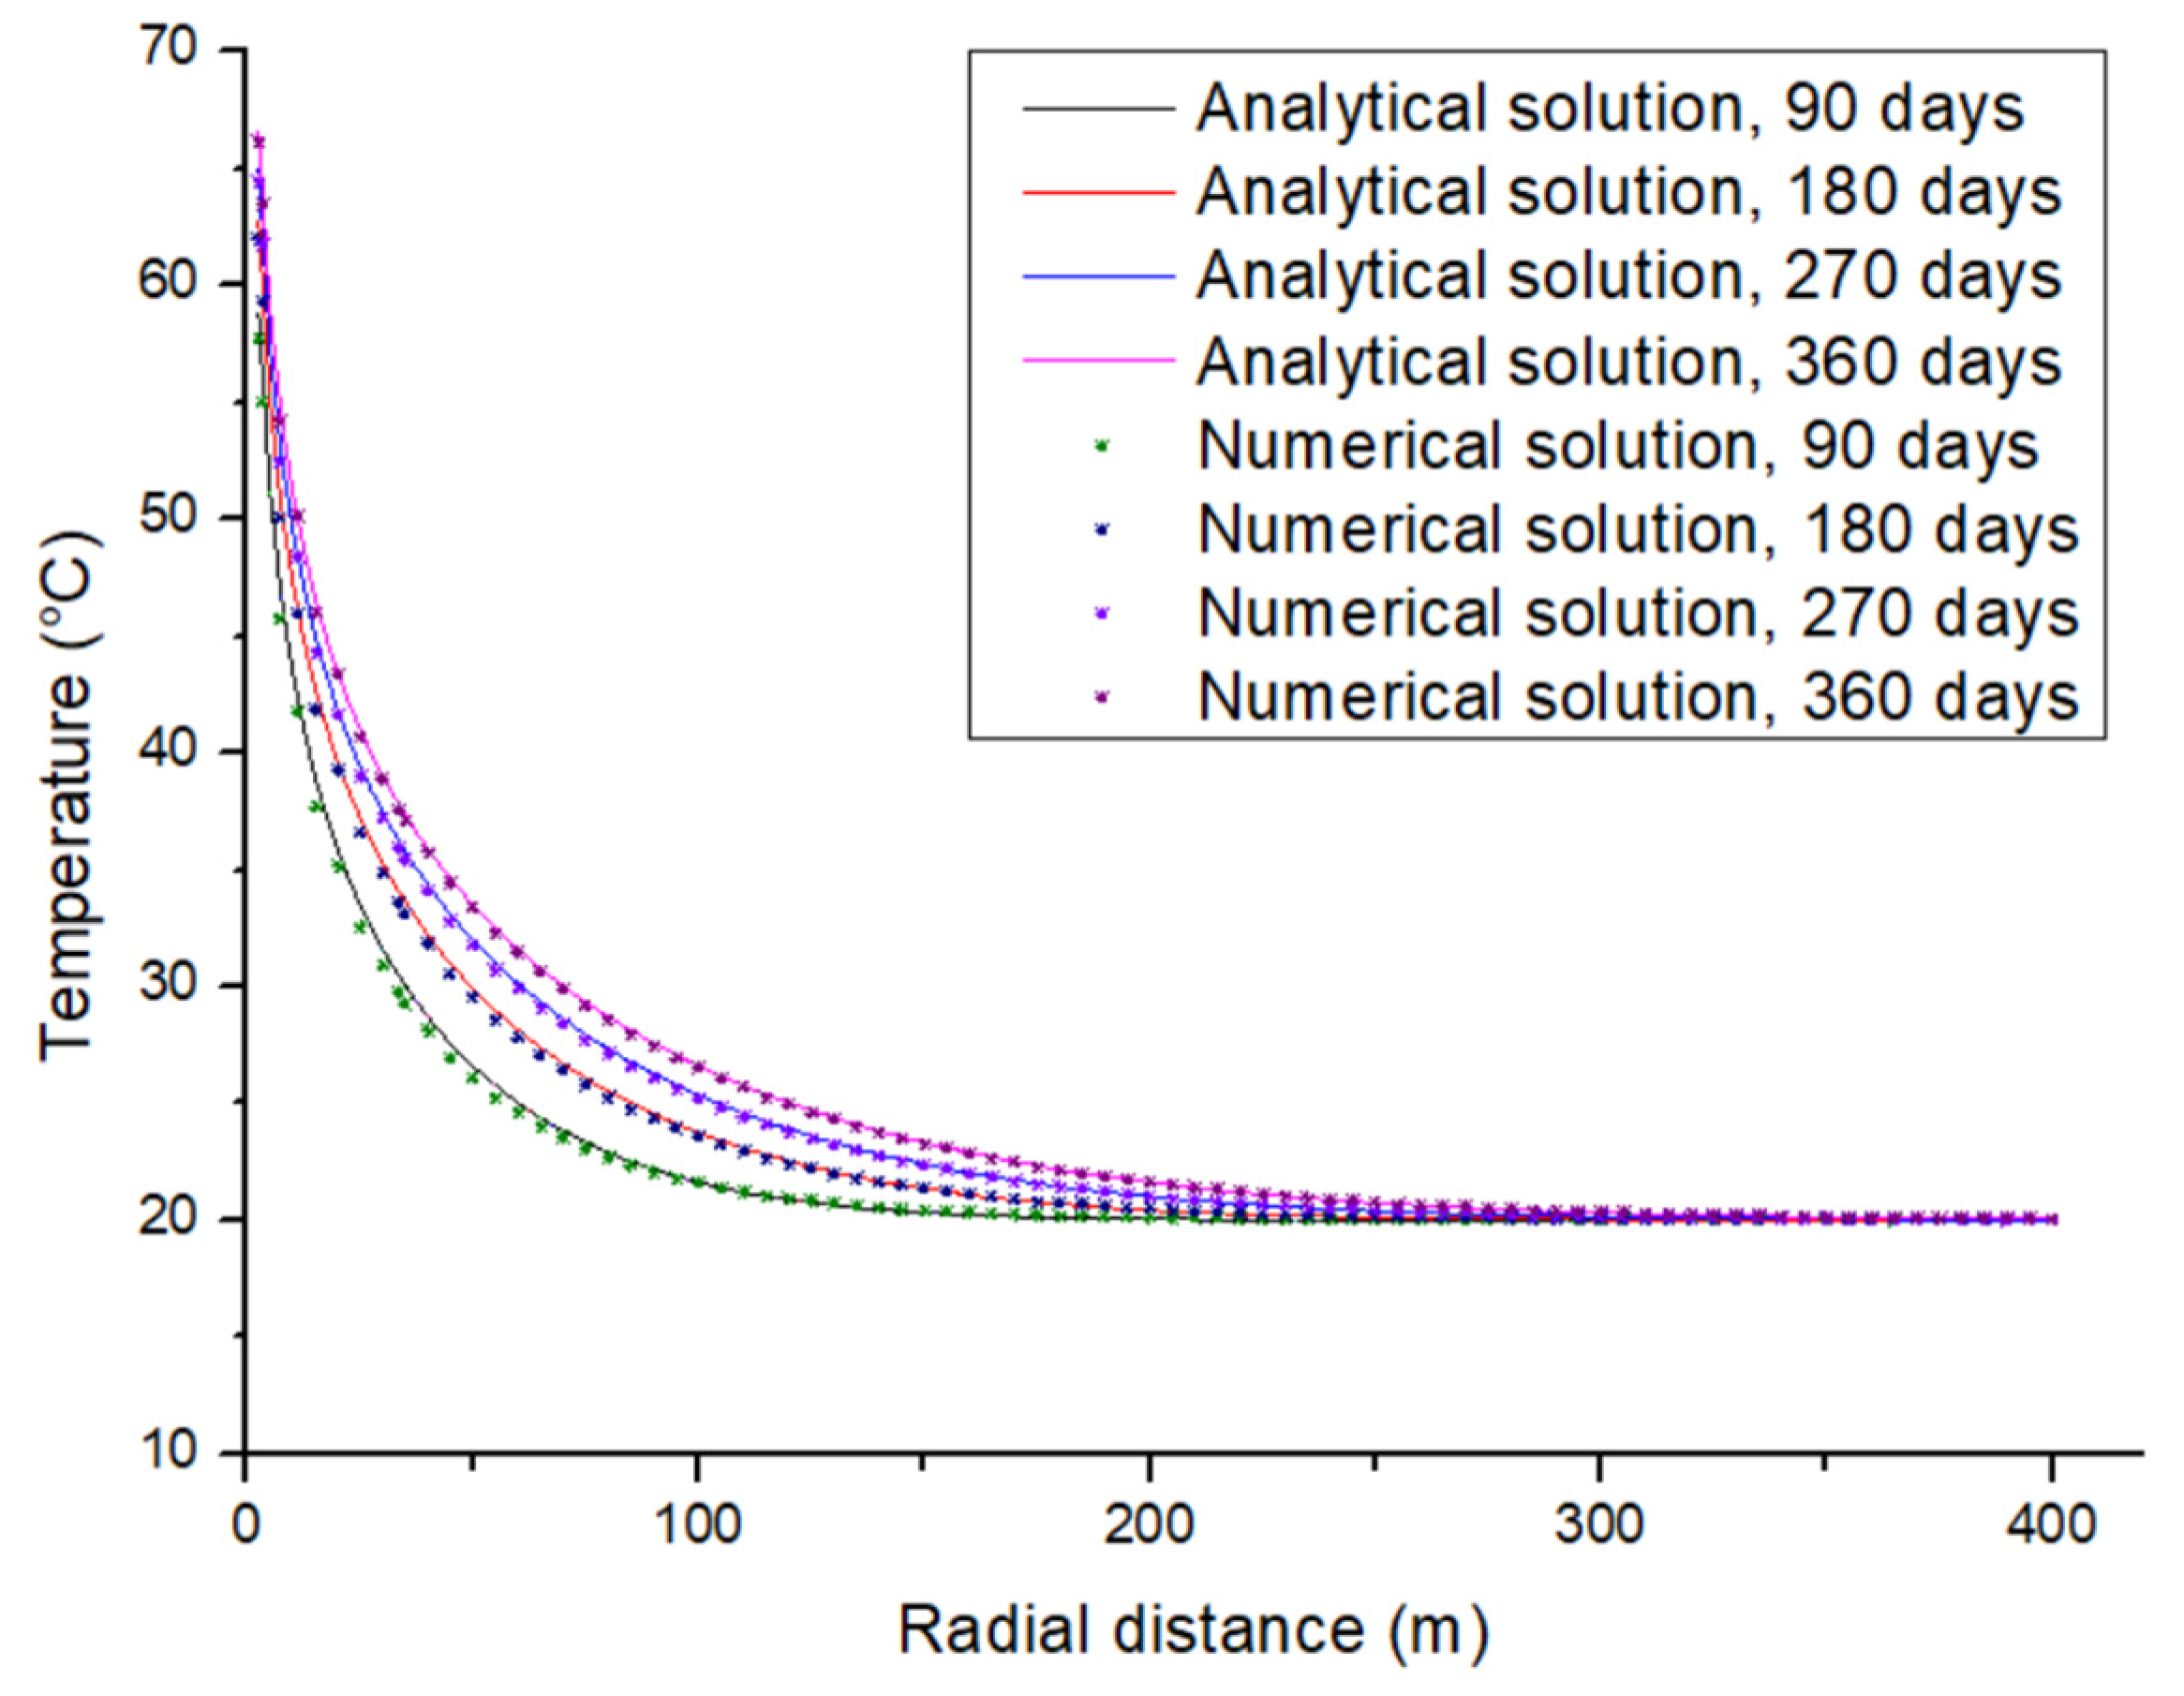
- The analytical model was validated by a comparison of its result and the result given by a numerical model for an arbitrary data set. A comparison of temperature profiles given by the analytical and numerical models indicates that the results given by the two models are identical, which proves the correctness of the analytical model.
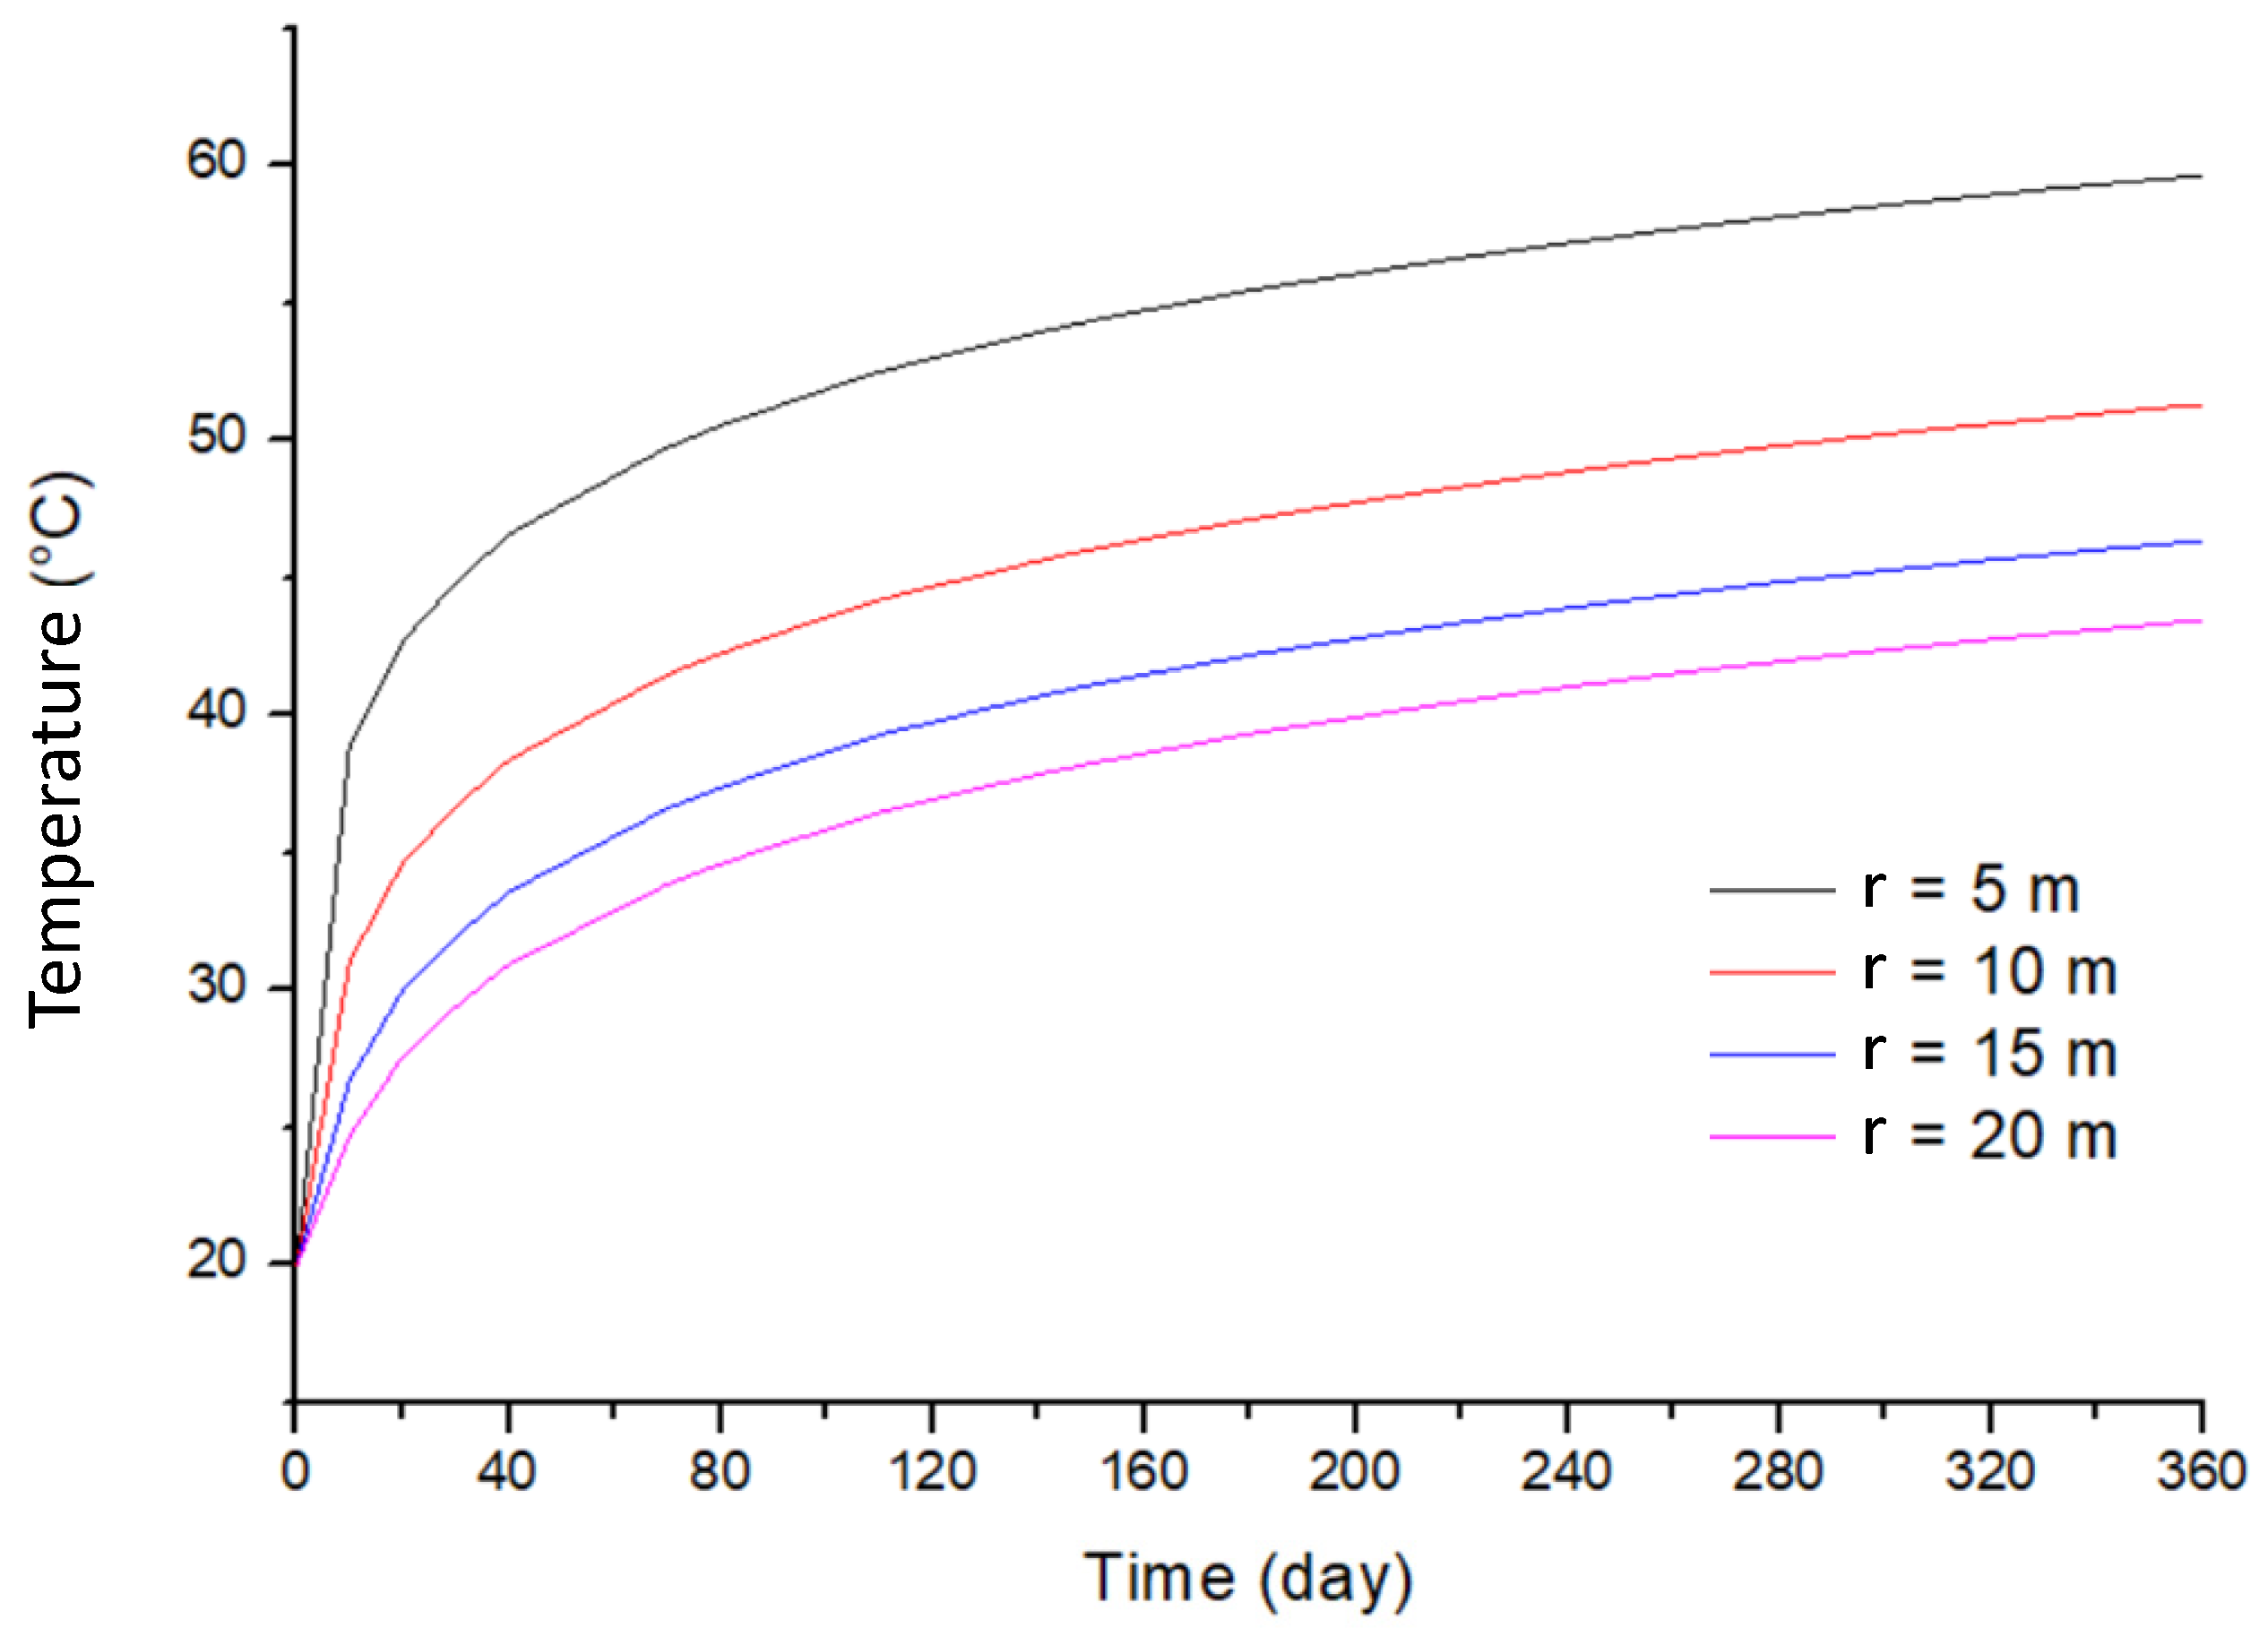
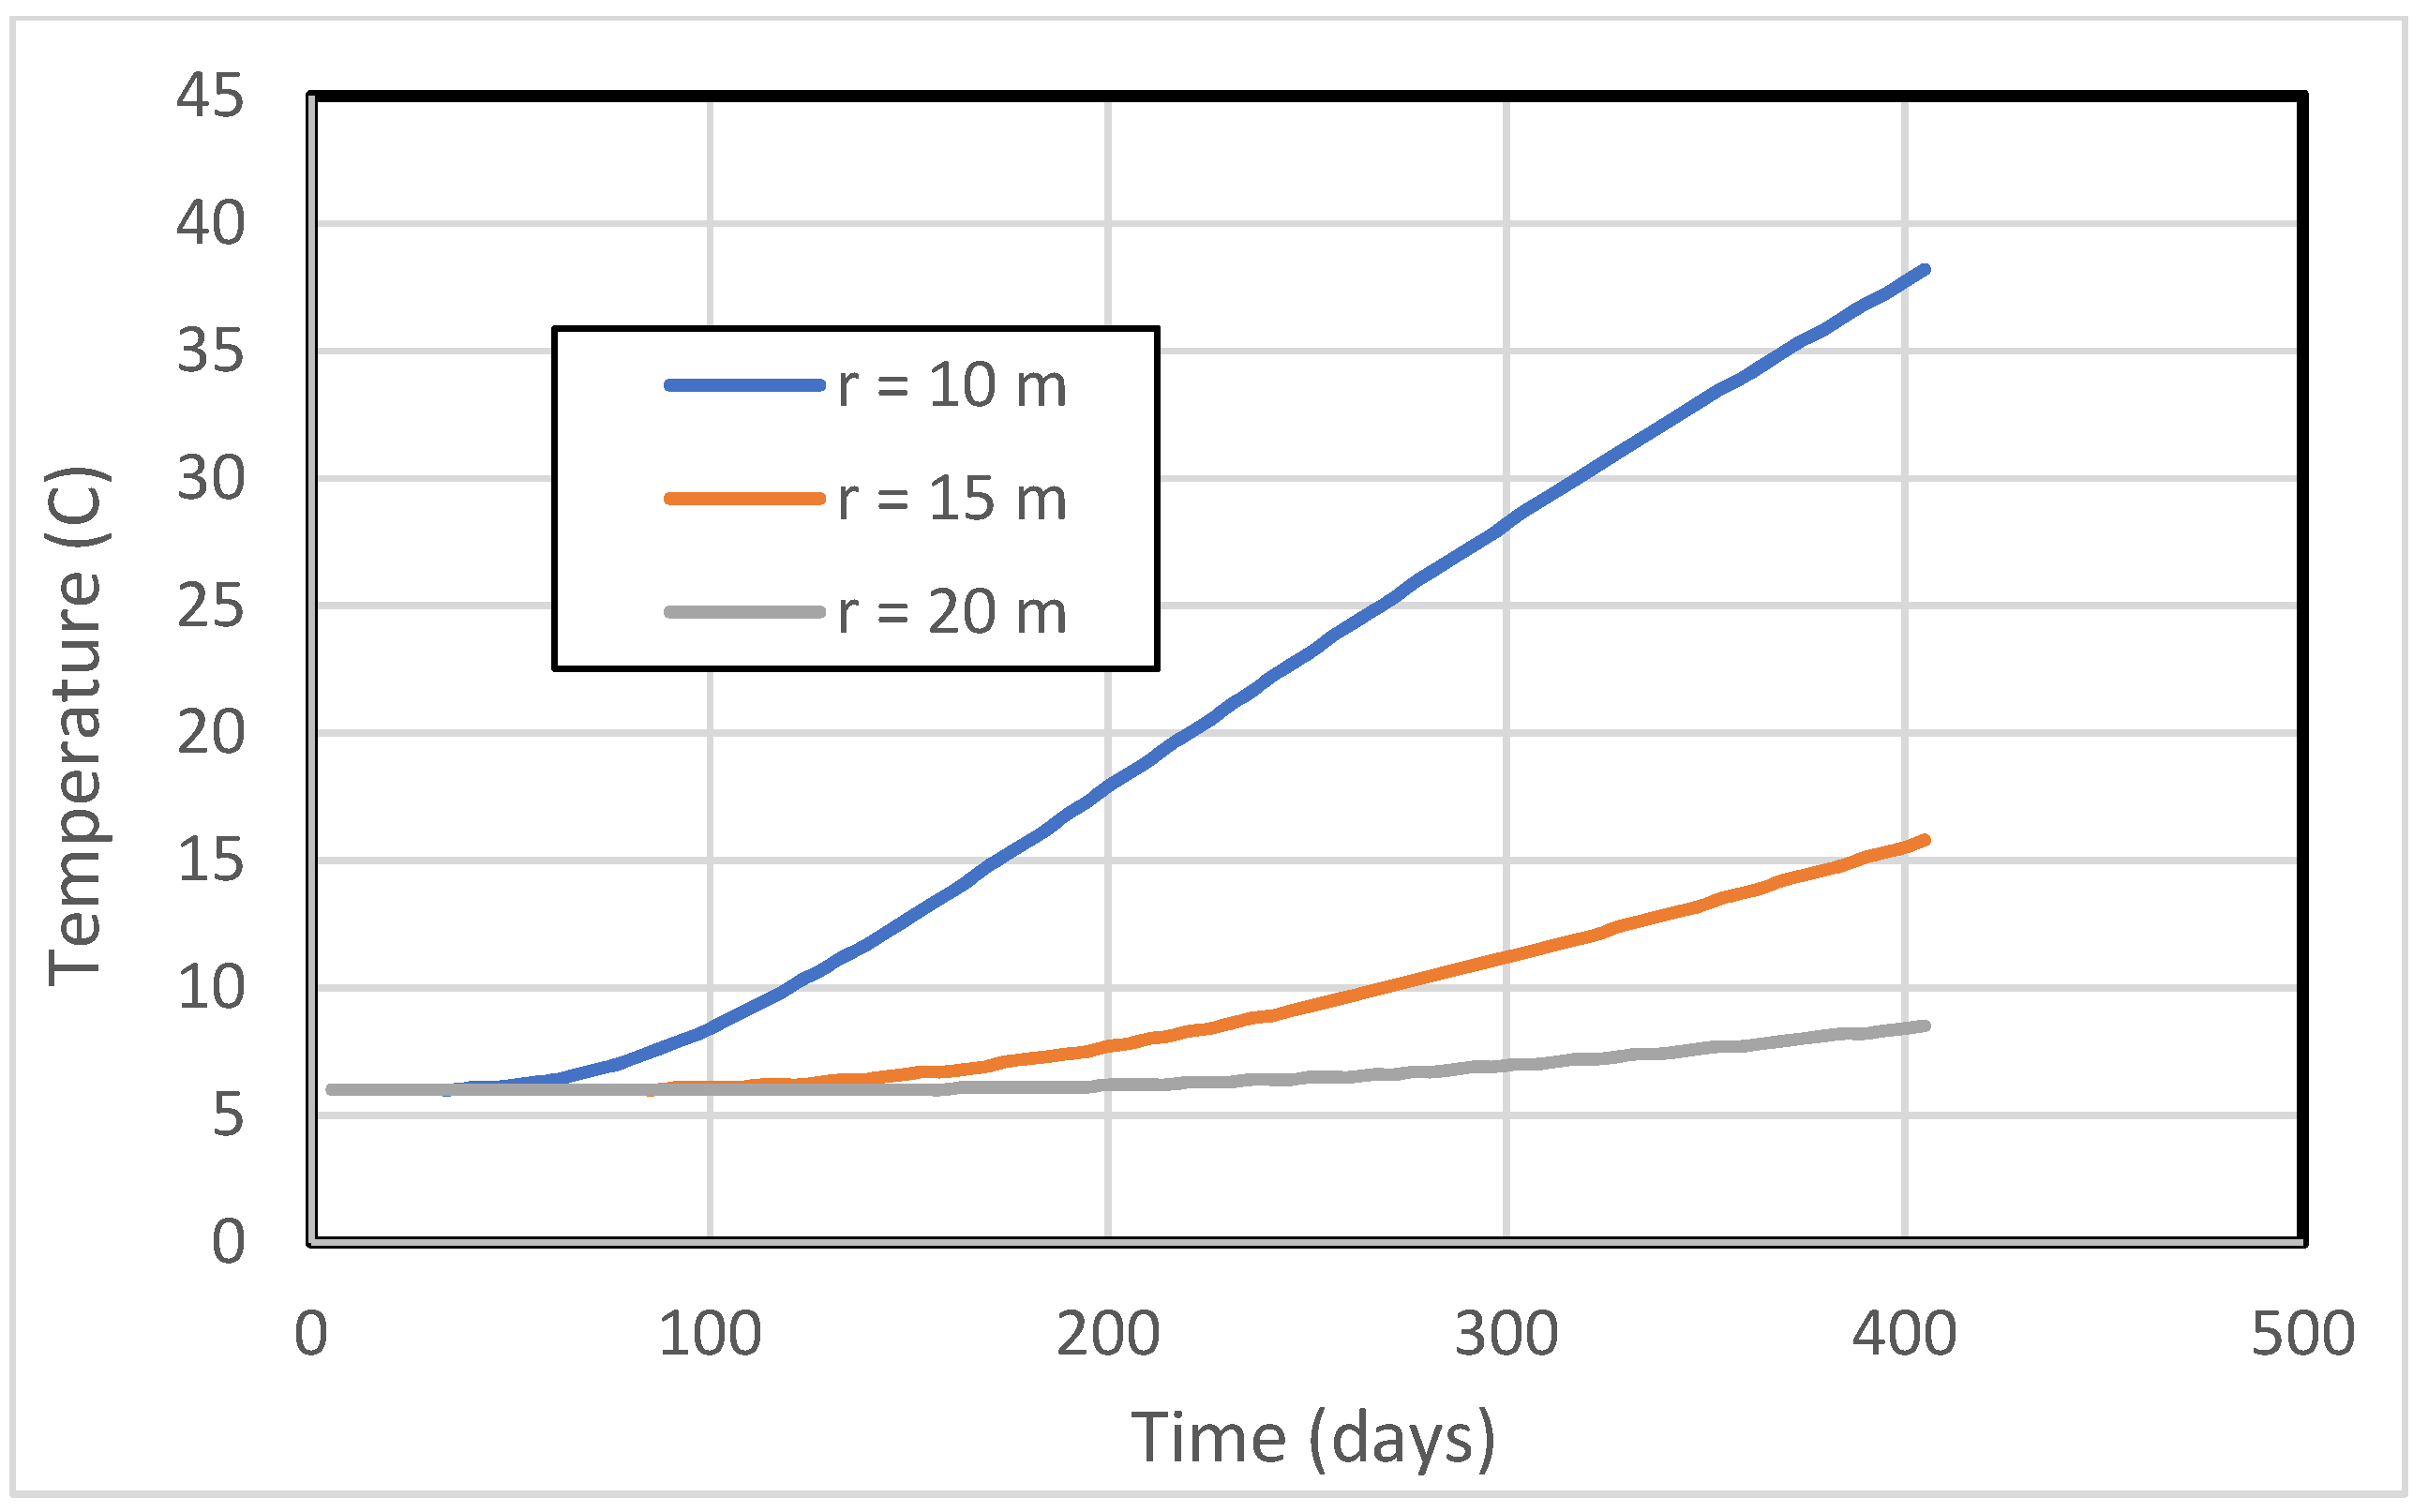
- Applying the analytical model to the NGH reservoir in the Shenhu area, Northern South China Sea, allowed for predicting temperature profiles both in spatial and time domains. Model results reveal that the NGH reservoir temperature should increase quickly at any heat-affected point, but it should propagate slowly in the radial direction.
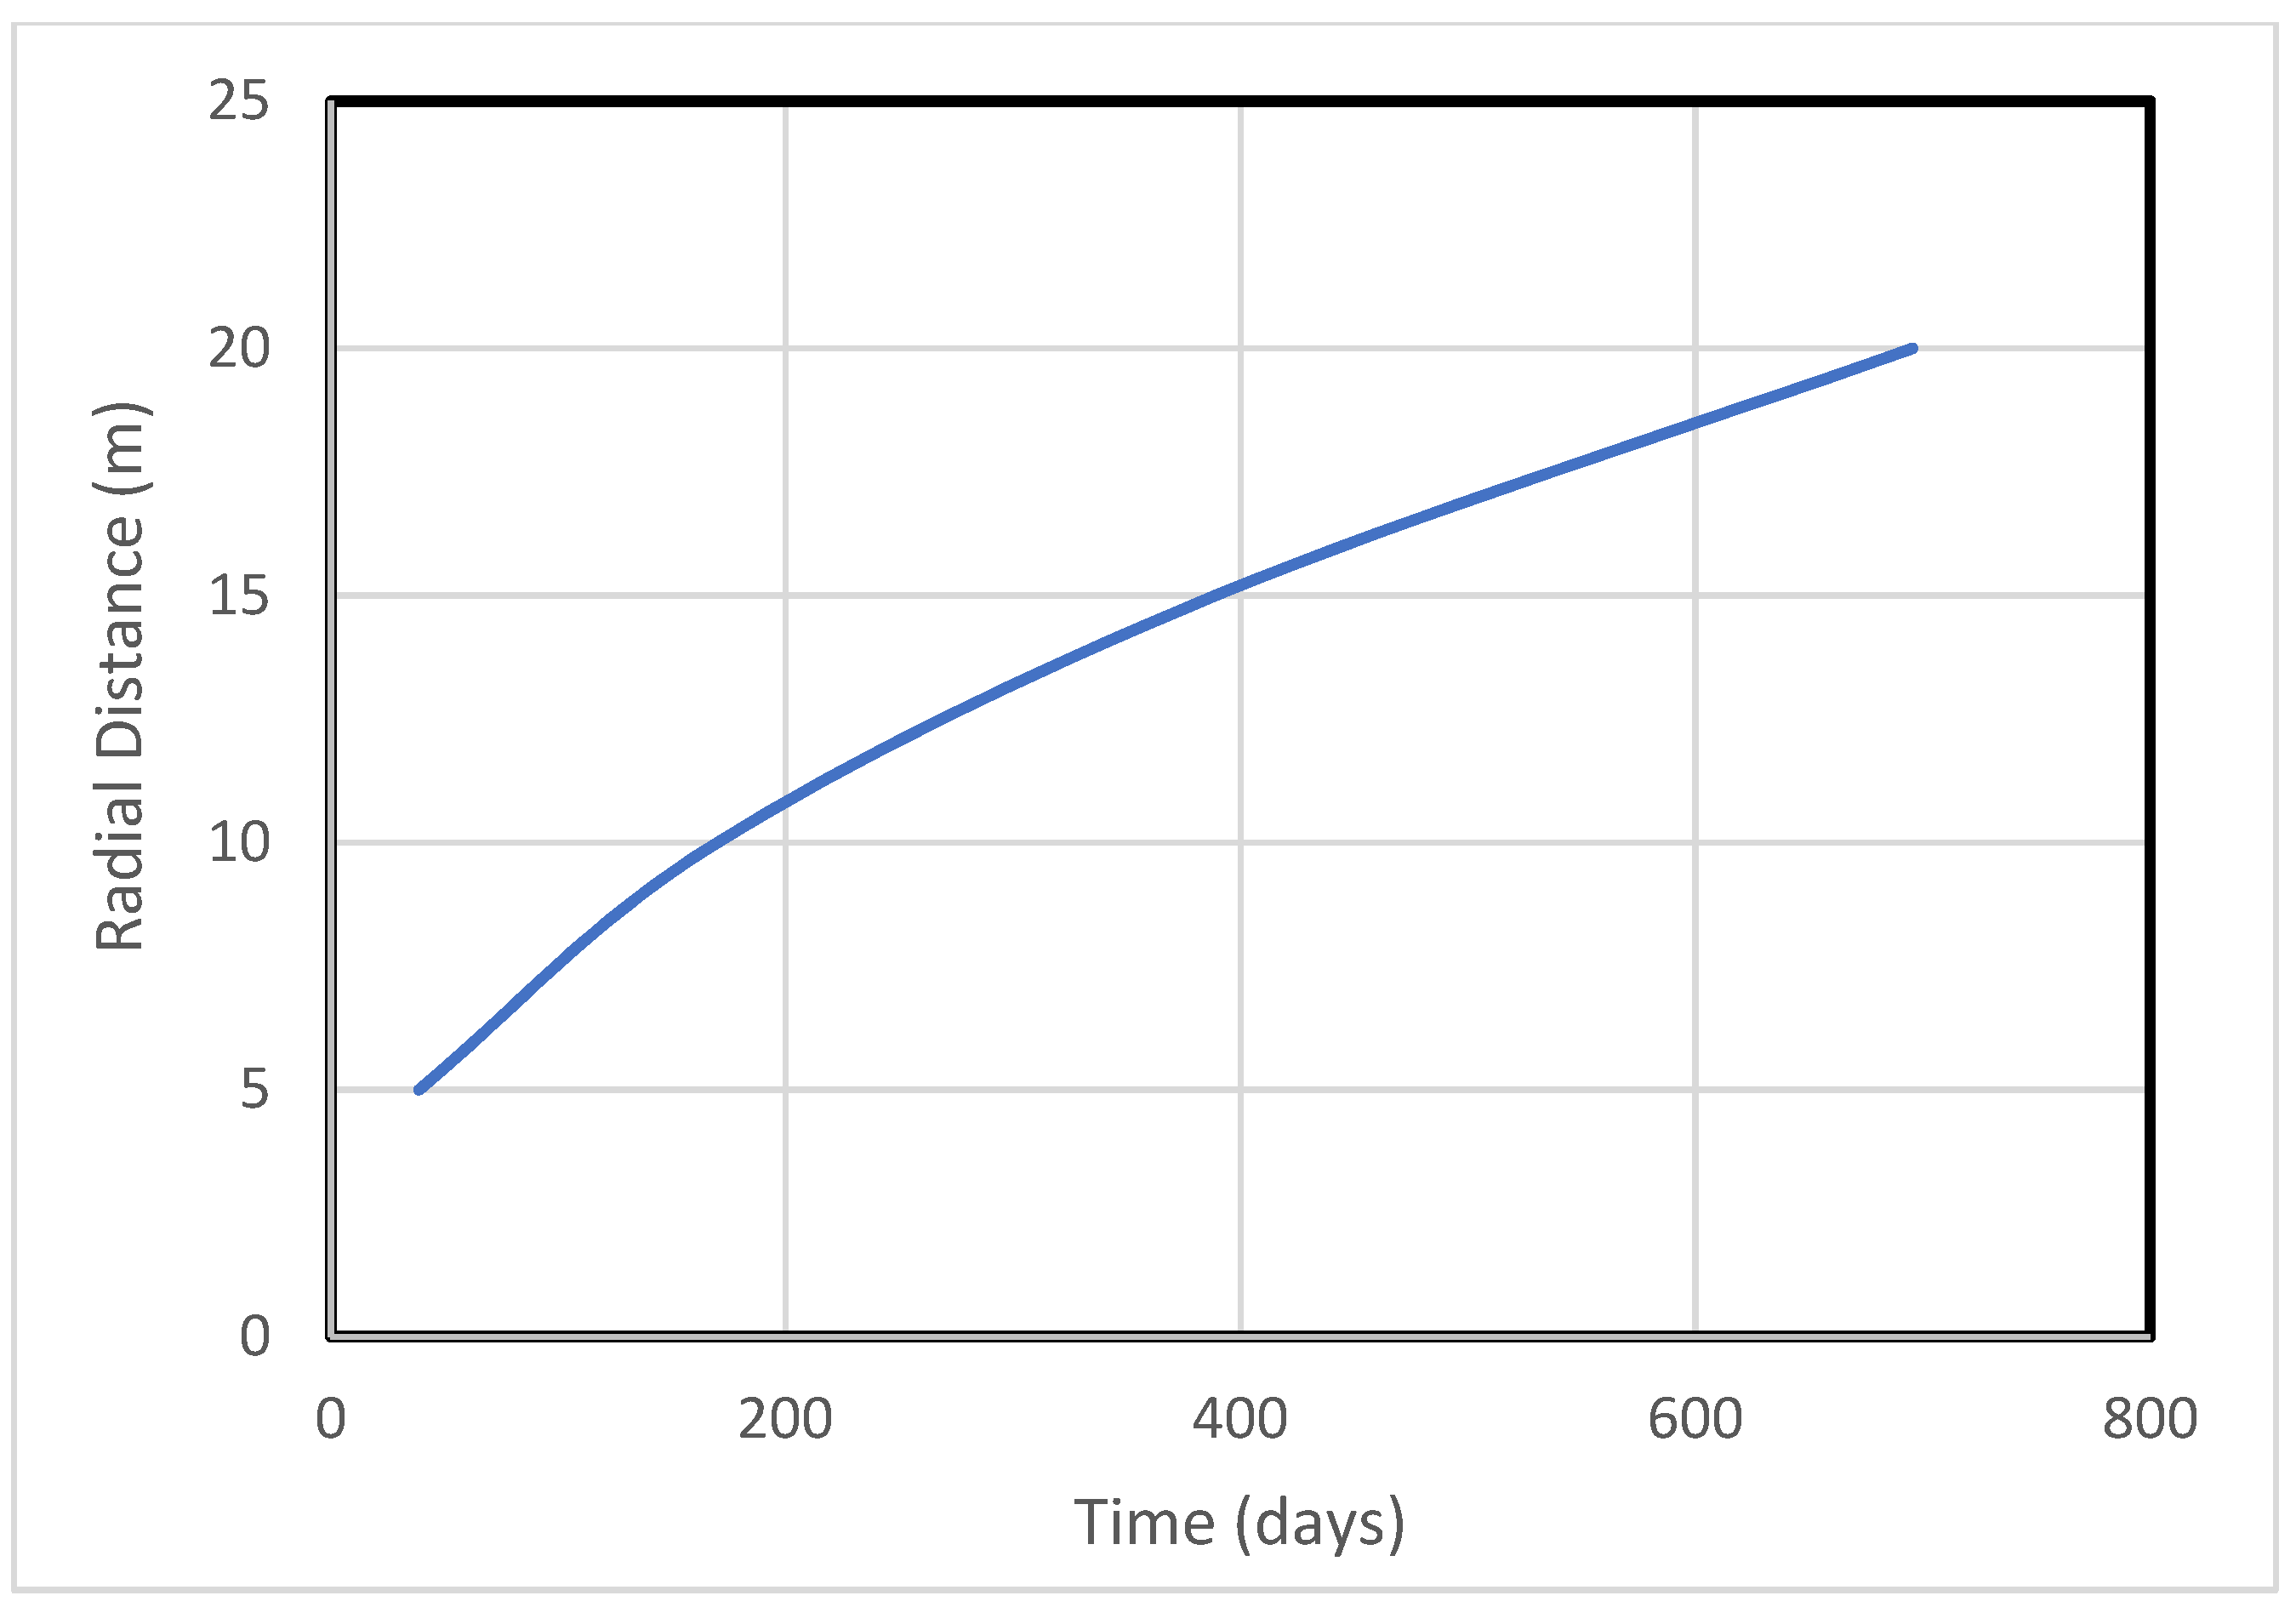
- It should take more than two years to dissociate NGH within 20 m of the heat dissipator wellbore due to only thermal stimulation. Therefore, the geo-thermal stimulation method should be used as a technique for accelerating gas production with a depressurization scheme.
- Because the real gas law demands that the increase in temperature will increase the pressure of free gas behind the NGH dissociation temperature (15 °C) front, it is expected that reformation of NGH may occur if the pressure fluctuates. This suggests that the natural gas released from the NGH should be produced in time through the gas production wellbore to reduce pressure.
- The analytical model shows that, for a given system, the heat transfer is proportional to the mass flow rate and the temperature drop along the heat dissipator wellbore. Because this temperature drop is affected by the mass flow rate through fluid retention time in the heat dissipator wellbore and heat losses in other sections of the y-shaped well couple, an optimum mass flow rate may be found to maximize the heat transfer into the NGH layer. This needs further investigations in the future.
Author Contributions
Funding
Institutional Review Board Statement
Informed Consent Statement
Data Availability Statement
Acknowledgments
Conflicts of Interest
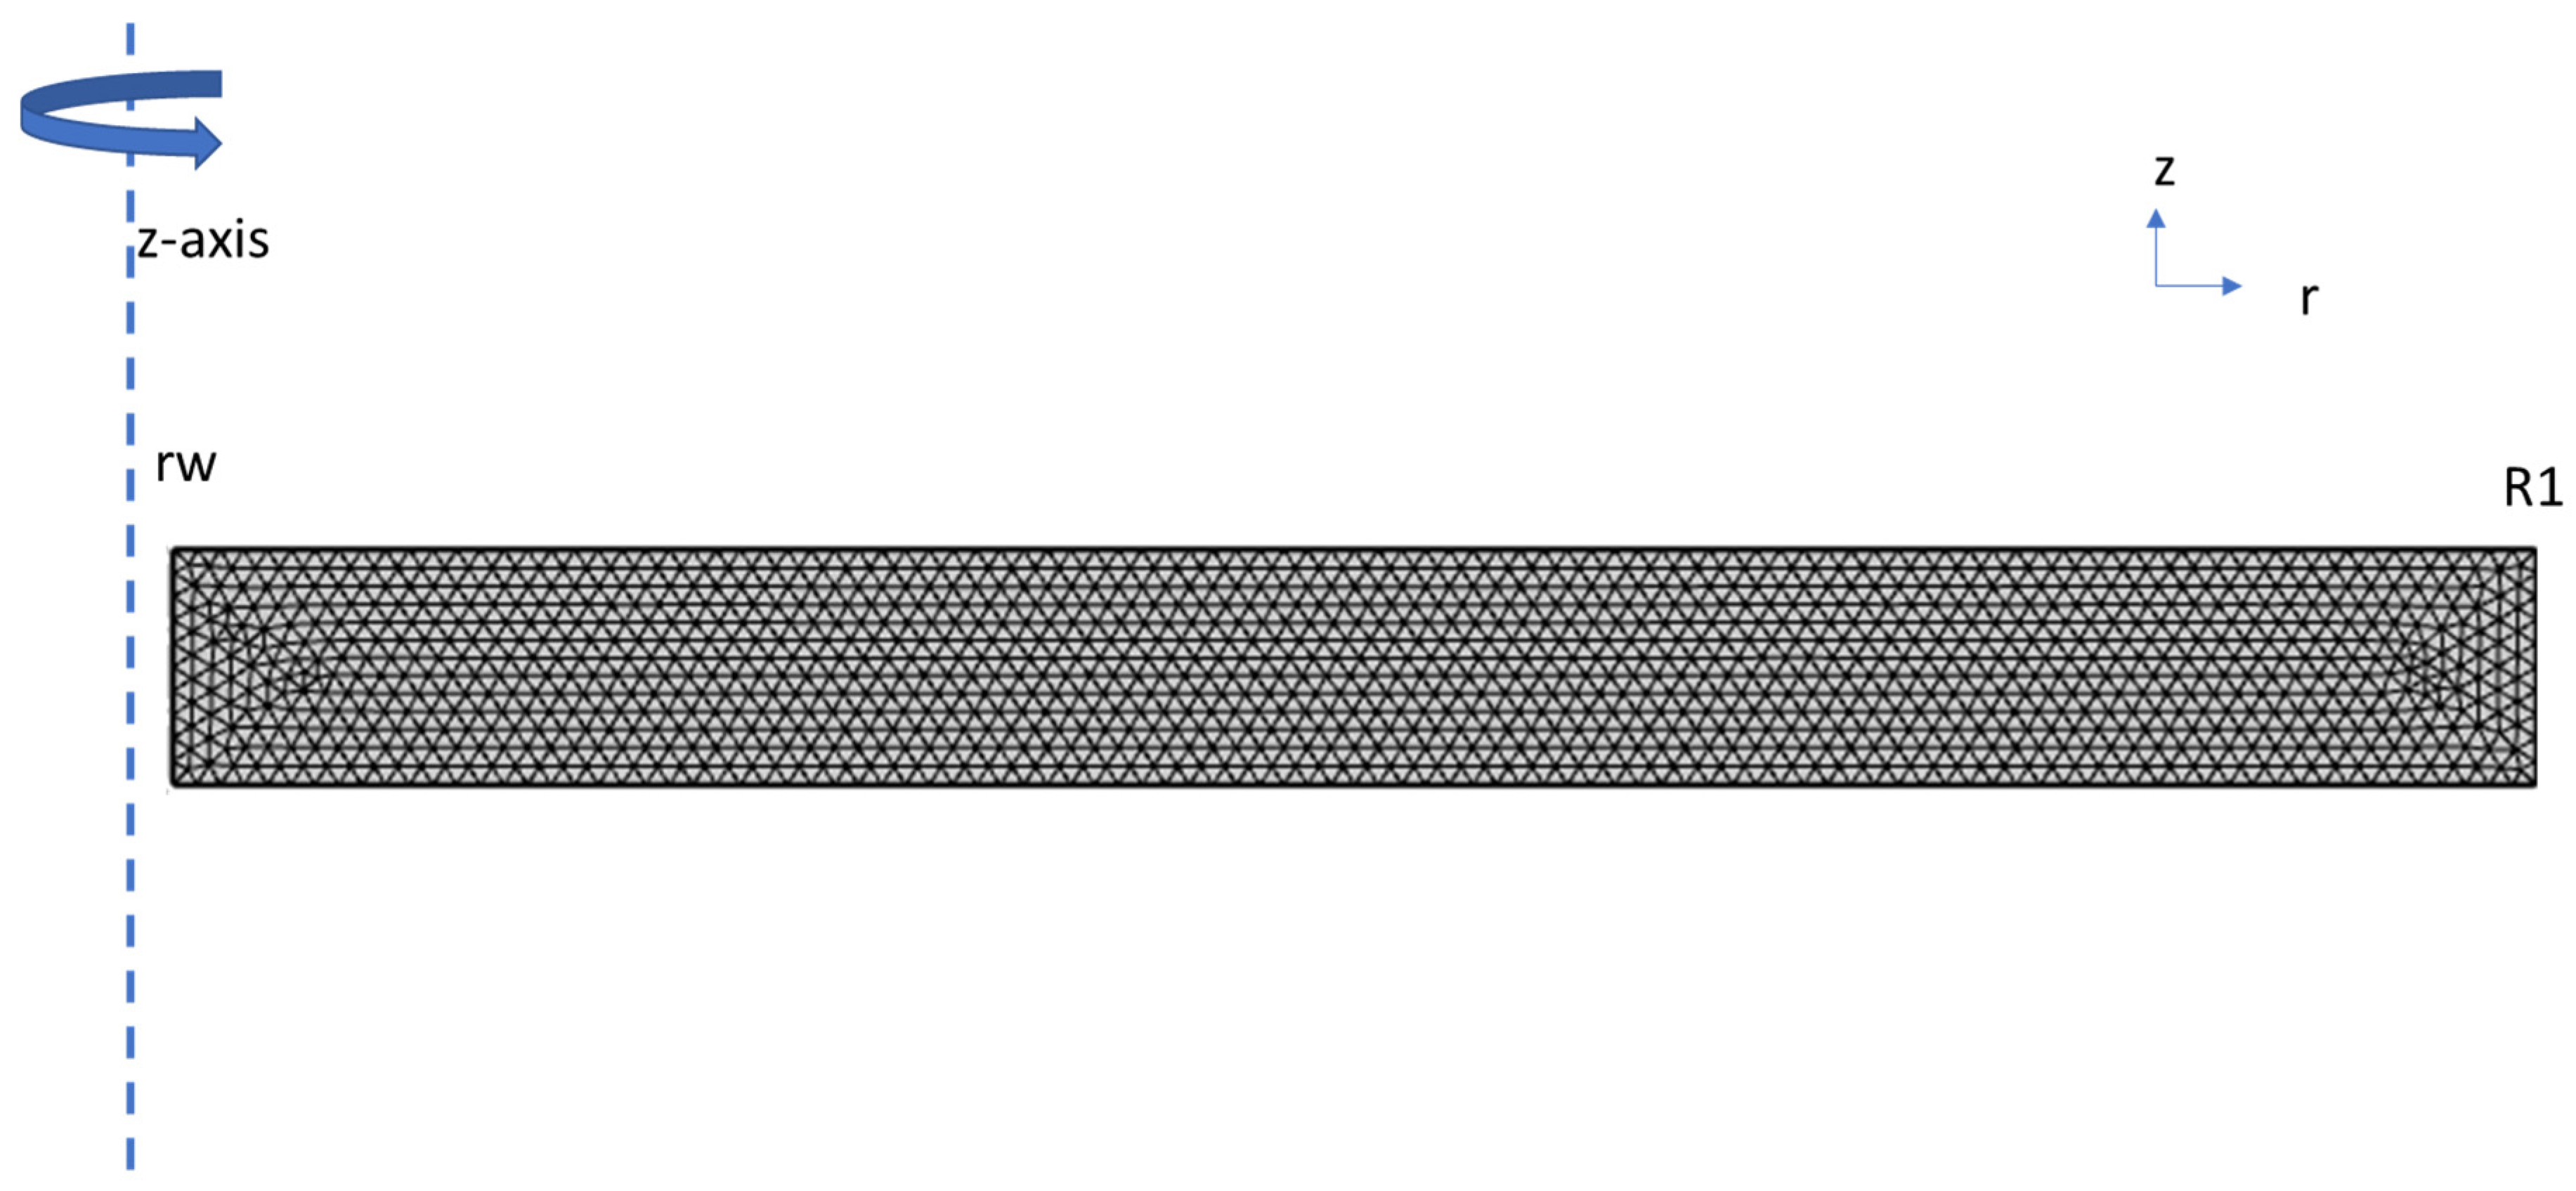
Appendix A. Mathematical Modeling of Heat Transfer into Gas Hydrate Reservoirs
- -
- The reservoir is homogeneous and isotropic with constant density, thermal conductivity, and specific heat.
- -
- The reservoir is considered infinitely large as compared to the wellbore size.
References
- U.S. Geological Survey Fact Sheet 021-01. Available online: https://pubs.usgs.gov/fs/fs021-01/fs021-01.pdf (accessed on 9 February 2022).
- Demirbas, A. Methane hydrates as potential energy resource: Part 2–Methane production processes from gas hydrates. Energy Convers. Manag. 2010, 51, 1562–1571. [Google Scholar] [CrossRef]
- Moridis, G.J.; Collett, T.S.; Boswell, R.; Kurihara, M.; Reagan, M.T.; Koh, C.; Sloan, E.D. Toward Production from Gas Hydrates: Current Status, Assessment of Resources, and Simulation-Based Evaluation of Technology and Potential. SPE Reserv. Eval. Eng. 2009, 12, 745–771. [Google Scholar] [CrossRef] [Green Version]
- Sloan, E.D., Jr. Clathrate Hydrates of Natural Gases; Marcel Dekker, Inc.: New York, NY, USA, 1990; pp. 12–16. [Google Scholar]
- Kurihara, M.; Funatsu, K.; Ouchi, H.; Masuda, Y.; Narita, H. Investigation on Applicability of Methane Hydrate Production Methods to Reservoirs with Diverse Characteristics. In Proceedings of the 5th International Conference on Gas Hydrates, Trondheim, Norway, 13–16 June 2005; Volume 3, pp. 714–725. [Google Scholar]
- Macfarlane, A. China Makes ‘Flammable Ice’ Breakthrough in South China Sea; CNN Money: New York, NY, USA, 2017. [Google Scholar]
- Zhang, W.; Bai, F.; Shao, M. Progress of offshore natural gas hydrate production tests in Japan and implications. Mar. Geol. Quat. Geol. 2017, 37, 27–33. [Google Scholar]
- Konno, Y.; Fujii, T.; Sato, A. Influence of Flow Properties on Gas Productivity in Gas-Hydrate Reservoirs: What Can We Learn from Offshore Production Tests? Energy Fuels 2021, 35, 8733–8741. [Google Scholar] [CrossRef]
- Paull, C.K.; Ussler, W.; Lorenson, T.; Winters, W.; Dougherty, J.; Iii, W.U. Geochemical constraints on the distribution of gas hydrates in the Gulf of Mexico. Geo-Mar. Lett. 2005, 25, 273–280. [Google Scholar] [CrossRef]
- Wan, L.; Shaibu, R.; Hou, X.; Guo, B. A Feasibility Study of Producing Natural Gas from Subsea Hydrates with Horizontal Snake Wells. In Proceedings of the Paper OTC 29816-MS 2019 Offshore Technology Conference, Rio de Janeiro, Brazil, 29–31 October 2019; pp. e28–e31. [Google Scholar]
- Guo, B.; Fu, C.; Liu, N. A priori assessment of long-term productivity of frac-packed wells for producing natural gas from marine gas hydrate reservoirs. Energy Sci. Eng. 2021, 9, 884–896. [Google Scholar] [CrossRef]
- Mahmood, N.; Guo, B. Productivity comparison of radial lateral wells and horizontal snake wells applied to marine gas hydrate reservoir development. Petroleum 2021, 7, 407–413. [Google Scholar] [CrossRef]
- Ekhator, E.; Guo, B. Assessing the effect of well completion types on productivity in a class 1G gas hydrate reservoir under pseudo steady state. Petroleum 2021, 7, 414–426. [Google Scholar] [CrossRef]
- Max, M.D.; Johnson, A.H. Exploration and Production of Oceanic Natural Gas Hydrate; Springer International Publishing: Berlin/Heidelberg, Germany, 2016; pp. 39–73. [Google Scholar]
- Ahmadi, G.; Ji, C.; Smith, D.H. Production of natural gas from methane hydrate by a constant downhole pressure well. Energy Convers. Manag. 2007, 48, 2053–2068. [Google Scholar] [CrossRef]
- Li, X.; Xu, C.-G.; Zhang, Y.; Ruan, X.-K.; Li, G.; Wang, Y. Investigation into gas production from natural gas hydrate: A review. Appl. Energy 2016, 172, 286–322. [Google Scholar] [CrossRef] [Green Version]
- Li, G.; Tang, L.G.; Huang, C.; Feng, Z.P.; Fan, S.S. Thermodynamic evaluation of hot brine stimulation for natural gas hydrate dissociation. J. Chem. Ind. Eng. China 2006, 57, 2033–2038. [Google Scholar]
- Kawamura, T.; Ohtake, M.; Sakamoto, Y.; Yamamoto, Y.; Haneda, H.; Komai, T.; Higuchi, S. Experimental study on steam injection method using methane hydrate core samples. In Proceedings of the Seventh (2007) ISOPE Ocean Mining Symposium, Lisbon, Portugal, 1–6 July 2007; pp. 83–86. [Google Scholar]
- Li, G.; Li, X.S.; Tang, L.G.; Li, Q.P. Control mechanisms for methane hydrate production by thermal stimulation. In Proceedings of the 6th International Conference on Gas Hydrates, Vancouver, BC, Canada, 6–10 July 2008. [Google Scholar]
- Kawamura, T.; Yamamoto, Y.; Ohtake, M.; Sakamoto, Y.; Komai, T.; Haneda, H. Experimental study on dissociation of hydrate core sample accelerated by thermodynamic inhibitors for gas recovery from natural gas hydrate. In Proceedings of the 5th International Conference on Gas Hydrates, Trondheim, Norway, 13–16 June 2005. [Google Scholar]
- Najibi, H.; Chapoy, A.; Haghighi, H.; Tohidi, B. Experimental determination and prediction of methane hydrate stability in alcohols and electrolyte solutions. Fluid Phase Equilibria 2009, 275, 127–131. [Google Scholar] [CrossRef]
- Moridis, G.J.; Reagan, M.T. Strategies for gas production from oceanic class 3 hydrate accumulations, OTC-18865. In Proceedings of the Offshore Technology Conference, Houston, TX, USA, 30 April–3 May 2007. [Google Scholar]
- Moridis, G.J.; Reagan, M.T. Gas production from oceanic class 2 hydrate accumulations, OTC 18866. In Proceedings of the Offshore Technology Conference, Houston, TX, USA, 30 April–3 May 2007. [Google Scholar]
- Gaydukova, O.; Misyura, S.; Strizhak, P. Investigating regularities of gas hydrate ignition on a heated surface: Experiments and modelling. Combust. Flame 2021, 228, 78–88. [Google Scholar] [CrossRef]
- Hong, H.; Pooladi-Darvish, M. Simulation of Depressurization for Gas Production from Gas Hydrate Reservoirs. J. Can. Pet. Technol. 2005, 44, 39–46. [Google Scholar] [CrossRef]
- Qin, X.; Liang, Q.; Ye, J.; Yang, L.; Qiu, H.; Xie, W.; Liang, J.; Lu, C.; Lu, H.; Ma, B.; et al. The response of temperature and pressure of hydrate reservoirs in the first gas hydrate production test in South China Sea. Appl. Energy 2020, 278, 115649. [Google Scholar] [CrossRef]
- Moridis, G.J.; Collett, T.S.; Dallimore, S.R.; Inoue, T.; Mroz, T. Analysis and Interpretation of the Thermal Test of Gas Hydrate Dissociation in the JAPEX/JNOC/GSC et al. Mallik 5L-38 Gas Hydrate Production Research Well. In Scientific Results from the Mallik 2002 Gas Hydrate Production Research Well Program; Dallimore, S.R., Collett, T., Eds.; Geological Survey of Canada, Bulletin 585: Mackenzie Delta, NT, Canada, 2005. [Google Scholar]
- Guo, B.; Shaibu, R.; Yang, X. Analytical Model for Predicting Productivity of Radial-Lateral Wells. Energies 2020, 13, 6386. [Google Scholar] [CrossRef]
- Fu, C.; Guo, B.; Shan, L.; Lee, J. Mathematical modeling of heat transfer in y-shaped well couples for developing gas hydrate reservoirs using geothermal energy. J. Nat. Gas Sci. Eng. 2021, 96, 104325. [Google Scholar] [CrossRef]
- Su, M.; Yang, R.; Wu, N.Y. Structural characteristics in the Shenhu Area, northern continental slope of South China Sea and their influence on gas hydrate. Acta Geol. Sin. 2014, 88, 318–326. [Google Scholar]
- Li, J.-F.; Ye, J.-L.; Qin, X.-W.; Qiu, H.-J.; Wu, N.-Y.; Lu, H.-L.; Xie, W.-W.; Lu, J.-A.; Peng, F.; Xu, Z.-Q.; et al. The first offshore natural gas hydrate production test in South China Sea. China Geol. 2018, 1, 5–16. [Google Scholar] [CrossRef]
- Guo, B.; Ghalambor, A. Natural Gas Engineering Handbook, 2nd ed.; Gulf Publishing Company: Houston, TX, USA, 2012; pp. 277–279. [Google Scholar] [CrossRef]


| Model Parameter | Value | Unit |
|---|---|---|
| Solid density (rs) | 2600 | kg/m3 |
| Solid thermal conductivity (K) | 1 | W/m-°C |
| Solid heat capacity (Cps) | 1 | J/kg-°C |
| Solid initial temperature (Ti) | 20 | °C |
| Liquid density (rL) | 1000 | kg/m3 |
| Liquid heat capacity (Cpl) | 1 | J/kg-°C |
| Borehole length (L) | 10 | m |
| Borehole radius (rw) | 0.3 | m |
| Liquid flow rate (Qf) | 0.01 | m3/s |
| Borehole inlet temperature (Tin) | 100 | °C |
| Borehole outlet temperature (Tout) | 30 | °C |
| Wellbore Length (L) | 2000 | m |
|---|---|---|
| Thermal conductivity of rock (K) | 3.06 | W/m-°C |
| Density of rock (rs) | 2600 | kg/m3 |
| Heat capacity of hydrate zone (cps) | 878 | J/kg-°C |
| Initial rock temperature (Ti) | 6 | °C |
| Thermal fluid density (rL) | 1030 | kg/m3 |
| Thermal fluid flow rate (Qf) | 0.1 | m3/s |
| Heat capacity of thermal fluid (Cpl) | 4184 | J/kg-°C |
| Fluid temperature at inlet of wellbore (Tin) | 47.5 | °C |
| Fluid temperature at outlet of wellbore (Tout) | 36.5 | °C |
Publisher’s Note: MDPI stays neutral with regard to jurisdictional claims in published maps and institutional affiliations. |
© 2022 by the authors. Licensee MDPI, Basel, Switzerland. This article is an open access article distributed under the terms and conditions of the Creative Commons Attribution (CC BY) license (https://creativecommons.org/licenses/by/4.0/).
Share and Cite
Guo, B.; Zhang, H. Mathematical Modeling of the Dynamic Temperature Profile in Geothermal-Energy-Heated Natural Gas Hydrate Reservoirs. Sustainability 2022, 14, 2767. https://doi.org/10.3390/su14052767
Guo B, Zhang H. Mathematical Modeling of the Dynamic Temperature Profile in Geothermal-Energy-Heated Natural Gas Hydrate Reservoirs. Sustainability. 2022; 14(5):2767. https://doi.org/10.3390/su14052767
Chicago/Turabian StyleGuo, Boyun, and He Zhang. 2022. "Mathematical Modeling of the Dynamic Temperature Profile in Geothermal-Energy-Heated Natural Gas Hydrate Reservoirs" Sustainability 14, no. 5: 2767. https://doi.org/10.3390/su14052767
APA StyleGuo, B., & Zhang, H. (2022). Mathematical Modeling of the Dynamic Temperature Profile in Geothermal-Energy-Heated Natural Gas Hydrate Reservoirs. Sustainability, 14(5), 2767. https://doi.org/10.3390/su14052767