Article

Spatial-Temporal Evolution of Total Factor Productivity in Logistics Industry of the Yangtze River Economic Belt, China

School of Economics and Management, China University of Geosciences, Wuhan 430074, China
*
Authors to whom correspondence should be addressed.
Sustainability 2022, 14(5), 2740; https://doi.org/10.3390/su14052740
Submission received: 6 January 2022 / Revised: 14 February 2022 / Accepted: 23 February 2022 / Published: 25 February 2022

Abstract

:
The logistics industry plays a great role in the sustainable economic development of the Yangtze River Economic Belt (YREB). This paper measures the total factor productivity (TFP) of the logistics industry by using the DEA-Malmquist index method and analyzes its spatial-temporal evolution characteristics based on panel data of 11 provinces and cities in the YREB in 2003–2017. Lastly, a spatial autocorrelation analysis was conducted in conjunction with the exploratory spatial data analysis (ESDA) model. The results show that the overall development of the logistics industry has been relatively good, with an inverted “N” shape trend over the years. Technological progress is the main reason for the growth of TFP. From a regional perspective, it shows a spatial distribution pattern of high in the east and low in the west, with an overall upward trend of TFP levels. The spatial correlation between the TFP levels of logistics in each province and city is gradually increasing, but coordinated development between regions is still limited. Finally, according to the conclusions, policy recommendations are proposed to accelerate the coordinated development of regional logistics and the innovative development of the modern logistics industry.

1. Introduction

Since the beginning of the 21st century, China’s economy has developed rapidly, and the logistics industry (LI) has become a pillar industry for economic growth, receiving great attention from the government and enterprises. The logistics industry is a collection of activities that organically combines basic functions, such as transportation, storage, loading and unloading, handling, packaging, distribution, processing, and information processing, all according to actual needs. As the basic industry and service industry of national economic and social development [1,2], the development level of LI has become an important symbol for measuring the comprehensive strength of a country or region. The Medium and Long-Term Planning of Logistics Development (2014–2020) released by the State Council in 2014 states that, by 2020, the added value of LI will increase by about 8% annually, and the added value of LI will account for around 7.5% of the gross domestic product (GDP) [3]. It can be seen that the logistics industry has further enhanced its ability to support and safeguard the national economy [4,5]. Accelerating the development of the modern logistics industry is of great significance in promoting industrial restructuring [6], transforming the mode of development, and improving the competitiveness of the national economy.
The Yangtze River Economic Belt (YREB) spans the three major regions of China: the east, the middle, and the west. Being one of the three major development strategies, the YREB plays a prominent role in China’s regional economic strategic layout and has far-reaching significance in promoting the coordinated development of China’s regional economy. As the “third source of profit” and a pillar industry, the logistics industry is an important part of regional economic development. In September 2014, the State Council issued the Guiding Opinions on Relying on the “Golden Waterway” to Promote the Economic Development of the Yangtze River Delta, clearly proposing to optimize logistics resources, improve logistics efficiency, reduce logistics costs, develop modern logistics, and build a pioneering demonstration belt for ecological civilization. Therefore, as the YREB is an important growth pole for China’s economic development, the high-quality development of the logistics industry in this region is crucial to macroeconomic growth.
Under the new ‘‘economic normal’’, the development quality of the industry has attracted much attention. Academics usually use productivity to measure development [7]. Productivity refers to the utilization efficiency of human, material, and financial resources, which reflects the influence of factors such as labor force, technical level, and resource allocation for production activities [8]. Productivity has evolved from the initial single factor to the now commonly used total factor productivity (TFP), which has become an important indicator of industry development. As a cornerstone of regional economic development, the logistics industry has always been of interest [9]. Due to the wide span of the YREB, coupled with the influence of natural, social, economic, and technical factors, the development of the logistics industry in the YREB is not balanced. Therefore, the study of total factor productivity for the coordinated development of the logistics industry has become a crucial issue, and the improvement of TFP is related to the sustainable development of the LI.
In recent years, many scholars have researched the total factor productivity of the logistics industry (LITFP), mainly focusing on three aspects. One aspect is research on the measurement methods of total factor productivity. There are three current measurement methods, and the first of which is to use the conventional growth accounting method, which is usually present in earlier studies. For instance, some researchers make great use of them to calculate TFP using microscopic data [10,11]. At the same time, many scholars have used the algebraic index method to analyze TFP [12], and many others have used the Solow residual method [13]. The second measurement method is stochastic frontier analysis (SFA). This type of analysis can be further divided into parametric and nonparametric methods according to whether the production function needs to be constructed. SFA is a typical representative of parametric methods in frontier analysis [14,15]. The last measurement method is data envelopment analysis (DEA), which is a non-parametric-based method that can effectively avoid setting errors in the form of equations, making it easier to operate [16,17]. In addition, DEA models are often combined with index analysis, including the Malmquist index and the Malmquist–Luenberger index [18,19].
The second aspect is the application of DEA methods to research in the logistics industry. Rita et al. proposed a new method of evaluating efficiency, combining DEA with analytic hierarchy processes to study the efficiency of the logistics industry in 29 European countries [20]. Sun et al. established an input-output indicator system and used three-stage DEA to measure the logistics efficiency of the three provinces in Northeast China [21]. In addition to studies of regional logistics efficiency at the macro level [22,23,24,25], the literature also includes studies of enterprise logistics efficiency at the micro level [26]. Hong et al. used the DEA models to measure the efficiency changes of Korean logistics suppliers [27]. The Malmquist index method calculates the Malmquist total factor productivity index through the change of productivity from the current period to the next period. Combining the Malmquist index with DEA can realize the dynamic analysis of efficiency [28,29]. Liu et al. measured the total factor energy efficiency of the logistics industry using the DEA-Malmquist method [30]. With the aid of the Malmquist–Luenberger SBM (Slack-based Measure) model, Liang et al. measured the green total factor productivity of the logistics industry in Jiangsu Province, China [31].
The third aspect is the spatial and temporal evolution of total factor productivity in the logistics industry. Most of the literature uses the exploratory spatial data analysis (ESDA) model to analyze total factor productivity, which is better able to analyze its spatial correlation and thus identify its spatial evolutionary characteristics [9]. Long et al. combined the DEA model with the global Malmquist–Luenberger index to measure the ecological efficiency of the logistics industry in 11 provinces of China’s Yangtze River Economic Belt, and he also analyzed the spatial autocorrelation using Moran’s I index [32]. Tan et al. selected the non-radial slacks-based method to evaluate the efficiency of the logistics industry and focused on the temporal change and spatial distribution [33]. Peng et al. used a spatial visualization technique to analyze the temporal-spatial pattern of the carbon emission efficiency of China’s transportation industry [34].
By combing through the above literature, it can be seen that research has focused on the overall region, but relatively few studies have been conducted from a local regional perspective. Especially after the development strategy of the YREB has been elevated to a national strategy, there have been few studies on the TFP of the logistics industry in this economic belt. From the perspective of research methods, it is mainly based on the DEA model to conduct static research, whereas there is not much research literature combining the DEA model with the Malmquist index model. The DEA-Malmquist index model allows for a better dynamic analysis of LITFP. From the perspective of the spatial analysis scale, there is a lack of analysis of the spatial differences in the logistics industry at the provincial level in the YREB. Therefore, it is necessary to study LITFP in the YREB from a spatial-temporal perspective. Based on the above reasons, this paper conducts an empirical analysis of LITFP in the YREB to find measures to improve and balance regional logistics productivity. It is of great significance to promote the flow of production factors through logistics development.
Thus, this research focuses on the following issues: (1) What is the level of LITFP in the YREB? (2) During the research period, what are the characteristics of the temporal and spatial differences of LITFP in the YREB? (3) How can the LITFP be improved? This paper aims to fill these research gaps by investigating LITFP and its spatial-temporal evolution in the YREB. Based on the DEA-Malmquist index model and Exploratory Spatial Data Analysis (ESDA) model, this paper analyzes the spatial-temporal evolution of LITFP from 2003 to 2017, taking 11 provinces and cities in the YREB as research objects. The study’s main contributions can be summarized as follows: (i) its analysis of the driving factors for LITFP in the YREB during 2003–2017, from the three aspects of technological progress, scale efficiency, and pure technical efficiency. The analysis can help us clarify the “gains” and “losses” of the logistics industry in promoting TFP; (ii) its reveal of the sources and spatial-temporal characteristics of LITFP in the YREB. This can help us grasp the current status and features of LITFP in the YREB; (iii) its formulation of specific strategies for the logistics industry in each province to improve their TFP. This can help provinces and cities to understand the current situation of their logistics industries and provide a basis for adjusting the allocation of logistics resources to achieve the coordinated development of regional logistics industries.
The remainder of this paper is structured as follows: Section 2 presents the methodology, which consists of the DEA-Malmquist model and the ESDA model, and the study area and data are also introduced in this section; Section 3 describes the spatial-temporal evolution and spatial autocorrelation analysis of LITFP in the YREB; and finally, Section 4 presents the conclusions and policy implications.

2. Methodology and Data

2.1. DEA-Malmquist Model

Data Envelopment Analysis (DEA) was first proposed in 1978 by the famous American operations researchers Charnes et al. [35]. DEA uses a mathematical programming model to evaluate the relative effectiveness of “departments” or “units” (called Decision Making Units (DMU)) with multiple inputs, especially with multiple outputs. According to the observations of each DMU Data, judging whether DMU is DEA effective is essentially judging whether DMU is located on the “production frontier” of the production possibility [36]. The DEA method and model can be used to determine the structure, characteristics, and construction methods of the production frontier [37]. Therefore, DEA is regarded as a non-parametric statistical estimation method [38]. According to the DEA method and model, input and output data can be directly used to establish non-parametric data. The DEA model carries out economic analysis, which has attracted many scholars’ research [39,40,41]. The DEA method mainly includes the constant return to a scale model (CCR) [42] and the variable return to a scale model (BCC) [43]. Since the BCC model can decompose the comprehensive technical efficiency in the CCR model into pure technical efficiency and scale efficiency, it is more conducive to analyze the causes of DEA ineffectiveness [44], so this paper adopts the BCC model.
The Malmquist index [45] was first proposed by Swedish economist Sten Malmquist in 1953 to measure changes in consumption levels over time, and Caves introduced a distance function to construct an index reflecting changes in total factor productivity [46]. Färe [47] took the lead in using the DEA method to measure the Malmquist productivity index and proposed the Färe–Grosskopf–Norris–Zhang (FGNZ) decomposition model [48], which decomposed the Malmquist index into technical efficiency change (TEC), technical change (TC), pure efficiency change (PEC), and scale efficiency change (SEC). Then, Ray et al. [49] revised the FGNZ decomposition model and proposed a more explanatory RD decomposition model.
The DEA-Malmquist index model allows for the analysis of changes in total factor productivity as well as the analysis of the impact of the technical progress index and the technical efficiency index of the decomposition factor on changes in total factor productivity, as opposed to the static analysis of DEA on a cross-sectional basis. This method first uses innovation input and output data to construct a production frontier function and solves the distance function through DEA’s non-parametric linear programming model. Then, by calculating the distance between the decision-making unit and the production frontier in the two periods before and after, it expresses the change in productivity in different periods. The calculation formula of the Total Factor Productivity Change index (TFPC) is as follows:
TFPC = M t , t + 1 = d t x t + 1 , y t + 1 d t x t , y t × d t + 1 x t + 1 , y t + 1 d t + 1 x t , y t 1 2
In the formula, x t , y t denote the input and output vectors in period t, respectively; x t + 1 , y t + 1 denote the input and output vectors in period t + 1, respectively; d t x t , y t denotes the distance function of period t based on the technology of period t; and d t + 1 x t + 1 , y t + 1 denotes the distance function of period t + 1 based on the technology of period t + 1.
TFPC > 1 indicates that total factor productivity is on the rise and that innovation efficiency is increasing, whereas TFPC < 1 indicates that total factor productivity is on the decline and that innovation efficiency is declining. In the case of constant returns to scale, the change of the total factor productivity index is decomposed into two important components, namely the technical efficiency change (TEC) and the technical change (TC). TEC stands for the contribution of technological efficiency, and TC stands for the contribution of technological progress, which are decomposed as follows:
TFPC = TEC × TC = d t + 1 x t + 1 , y t + 1 d t x t , y t × d t x t , y t d t + 1 x t , y t × d t x t + 1 , y t + 1 d t + 1 x t + 1 , y t + 1
TEC = d t + 1 x t + 1 , y t + 1 d t x t , y t
TC = d t x t , y t d t + 1 x t , y t × d t x t + 1 , y t + 1 d t + 1 x t + 1 , y t + 1
TEC represents the degree of catching up to the production frontier by the decision-making unit from period t to period t + 1. When TEC > 1, the comprehensive technical efficiency improves, indicating that production is closer to the frontier of production compared to the previous period; when TEC < 1, the comprehensive technical efficiency decreases, indicating that production is closer to the frontier of production compared to the previous period. TC stands for technological progress change, that is, the movement of the best frontier of production. When TC > 1, technological advancement indicates that the production frontier is raised or moved outward. Following the views of scholars such as Ray et al. [49], in the case of variable returns to scale, the technical efficiency change (TEC) can also be decomposed into pure technical efficiency change (PEC) and scale efficiency (SEC), the formula is:
d t + 1 x t + 1 , y t + 1 d t x t , y t = d v t + 1 x t + 1 , y t + 1 d v t x t , y t × d v t + 1 x t + 1 , y t + 1 d c t + 1 x t + 1 , y t + 1 × d c t + 1 x t , y t d v t + 1 x t , y t × d v t x t + 1 , y t + 1 d c t x t + 1 , y t + 1 × d c t x t , y t d v t x t , y t
that is:
TEC = PEC × SEC
Among them, the subscript c represents constant returns to scale, and v represents variable returns to scale.

2.2. Exploratory Spatial Data Analysis (ESDA) Model

ESDA is a collection of spatial analysis methods and techniques that have been used by a wide range of scholars [50,51]. By describing and visualising the spatial distribution patterns of things or phenomena, ESDA discovers spatial agglomerations and spatial anomalies and explains the mechanisms of spatial interactions between research objects [52]. There are two measurement methods commonly used in ESDA technology: global spatial autocorrelation and local spatial autocorrelation [53,54]. This paper visualizes spatial data by developing an ESDA model to describe changes in total factor productivity of the logistics industry in each province of YREB in conjunction with geographic location.

2.2.1. Global Spatial Autocorrelation Analysis

The Global Moran’s I index reflects the degree of similarity in the attribute values of spatially adjacent regional units and is often used to analyze the degree of spatial association and variation in the region as a whole. Its calculation formula is:
I = i = 1 n j = 1 n w ij x i x ¯ x j x ¯ S 2 i = 1 n j = 1 n w ij
S 2 = 1 n i = 1 n x i x ¯ 2
x ¯ = 1 n i = 1 n x i
Among them, I is the global Moran index; n is the total number of study areas; x i and x j are the observation values of sample i and sample j, respectively; x ¯ is the mean value of all observations; and w ij is the spatial weight matrix. This article uses the spatial weight matrix based on Queen’s proximity.
Global Moran’s I statistic only shows the average degree of spatial difference between all regions and surrounding areas, and it cannot reflect local spatial differences. When the overall regional spatial difference shrinks, the local spatial difference may expand. Therefore, it is necessary to further explore the correlation between local regions.

2.2.2. Local Spatial Autocorrelation Analysis
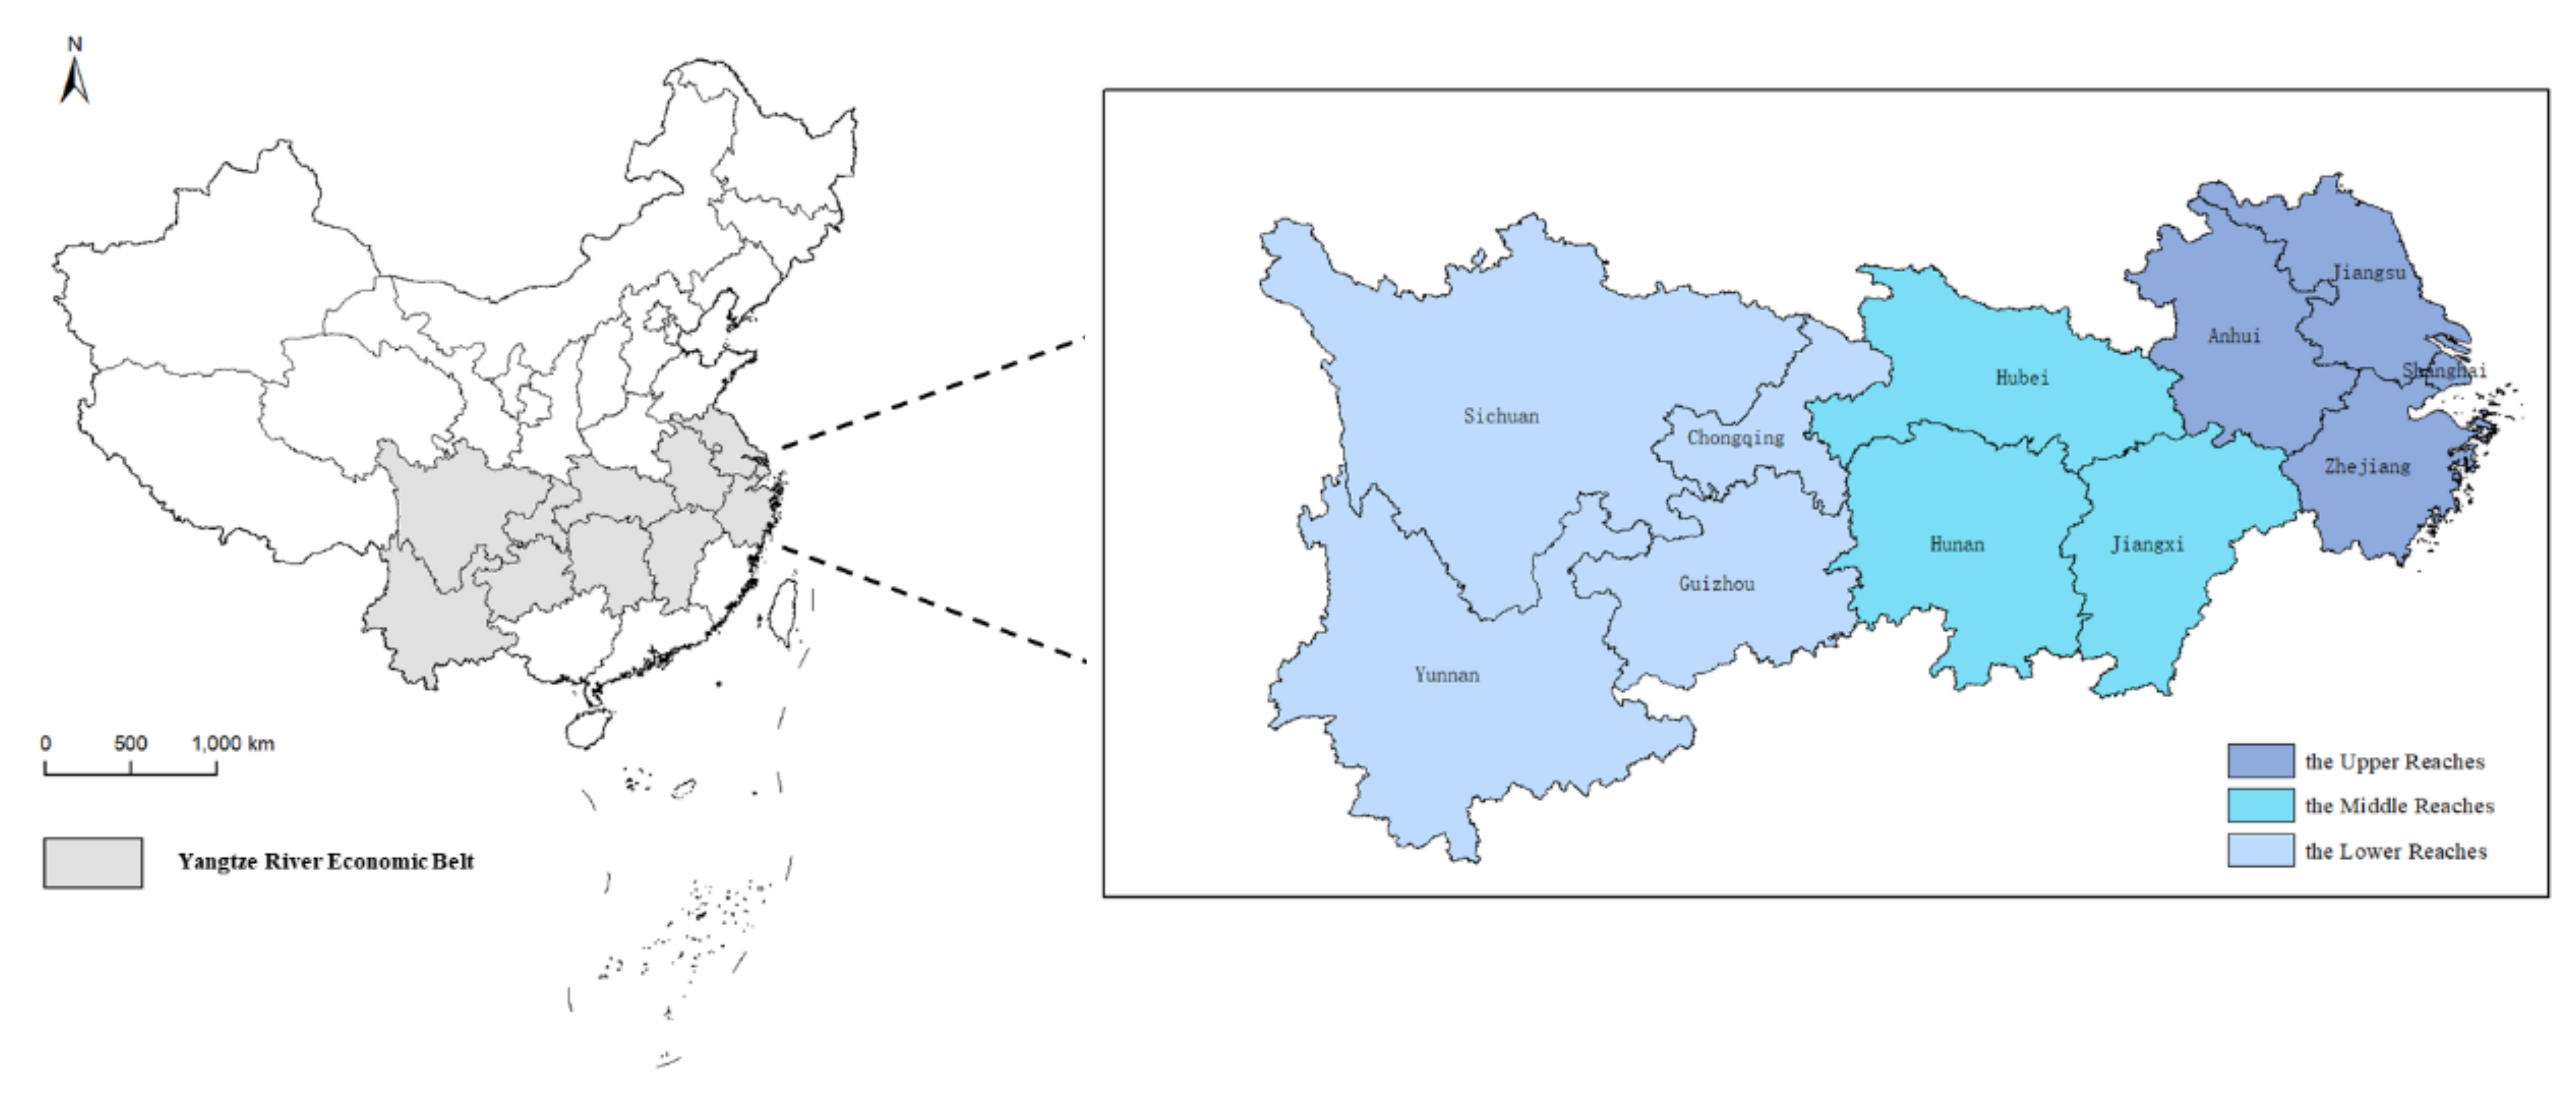
The local Moran’s I index is an index that measures the spatial relationship between adjacent regions, and the sum of LISA in all regions is proportional to the global spatial correlation index. The calculation is as follows:
I i = x i x ¯ s 2 j = 1 n w ij x j x ¯ = z i j = 1 n w ij z j
In the formula, z i and z j are values that have been standardized.
The Moran scatter plot, which can be derived from GeoDa software, is a graphical representation of the spatial lag factors W Z and Z, representing the spatial correlation of decision units. The different quadrants represent their levels of total factor productivity and the degree of correlation with neighboring decision units. Combining Moran scatter plots with LISA significance levels allows for a more comprehensive analysis of the correlations between provinces and cities in the YREB.
The Moran scatter plot is divided into four quadrants, which are defined as follows: (1) High-High: a high level of development of the logistics industry in both the region itself and the surrounding areas, with a small degree of spatial variation between the two; (2) Low-High: a low level of development of the logistics industry in the region itself and a high level in the surrounding areas, with a high degree of spatial variation between the two; (3) Low-Low: a low level of development of the logistics industry in both the region itself and in the surrounding areas, with a small degree of spatial variation between the two; and (4) High-Low: a high level of development of the logistics industry in the region itself and a low level in the surrounding areas, with a high degree of spatial variation between the two.

2.3. Study Area

The Yangtze River Economic Belt covers 11 provinces and cities, with an area of approximately 2.05 million square kilometers and with a population and GDP exceeding 40% of China. Relying on natural “golden waterways” and abundant real estate resources, the Yangtze River Basin has developed into one of the most developed regions in China in terms of economy, technology, and culture. The YREB comprises three major regions: the upper, the middle, and the lower reaches. Among them, the upper reaches include Chongqing, Sichuan, Guizhou, and Yunnan; the middle reaches include Jiangxi, Hubei, and Hunan; and the lower reaches include Shanghai, Jiangsu, Zhejiang, and Anhui. Figure 1 shows the study area of this paper.

2.4. Variables and Data Description

At present, China has not yet established an independent statistical system of LI. According to the National Bureau of Statistics of China, the output value of transportation, warehousing, and the postal industries accounts for more than 80% of the output value of LI. Regarding the current literature on the logistics industry [55,56], the indicator data of the transportation, warehousing, and postal industries are used to replace the relevant indicators of LI in this paper. Taking the 15 years (from 2003 to 2017) as the research period, this paper selects the indicator data of eleven provinces and cities in the YREB, namely Shanghai, Jiangsu, Zhejiang, Anhui, Jiangxi, Hubei, Hunan, Chongqing, Sichuan, Guizhou, and Yunnan, to analyze the spatial-temporal evolution of LITFP. The data are mainly obtained from the China Statistical Yearbook, the China Logistics Statistical Yearbook, and the statistical yearbooks of each province and city.
This paper constructs an input-output index system for evaluating LITFP in the YREB. From the perspective of “people, money, and material”, the employees of LI, the fixed asset investment of LI, and the road operating mileage are taken as input indicators; from the perspective of “value output” and “actual output”, the added value of LI and cargo turnover volume are used as output indicators. To eliminate the effect of inflation, the added value and fixed asset investment of LI are deflated by the GDP index and the producer price index (PPI) in each year and are converted to constant 2003 prices. The number of employees includes employees in urban units, private enterprises, and individual employees in the transportation, warehousing, and postal industries. Road operating mileage includes highway mileage and railway operating mileage. The added value of LI is the most monetary manifestation of LI’s contribution to economic and social development, and this indicator is replaced by the added value of the transportation, warehousing, and postal industries. The cargo turnover volume represents the logistics production capacity, which is used to reflect the output of LI. The relevant indicators are described in Table 1.

3. Results and Discussions

3.1. Spatial-Temporal Evolution of LITFP in the YREB

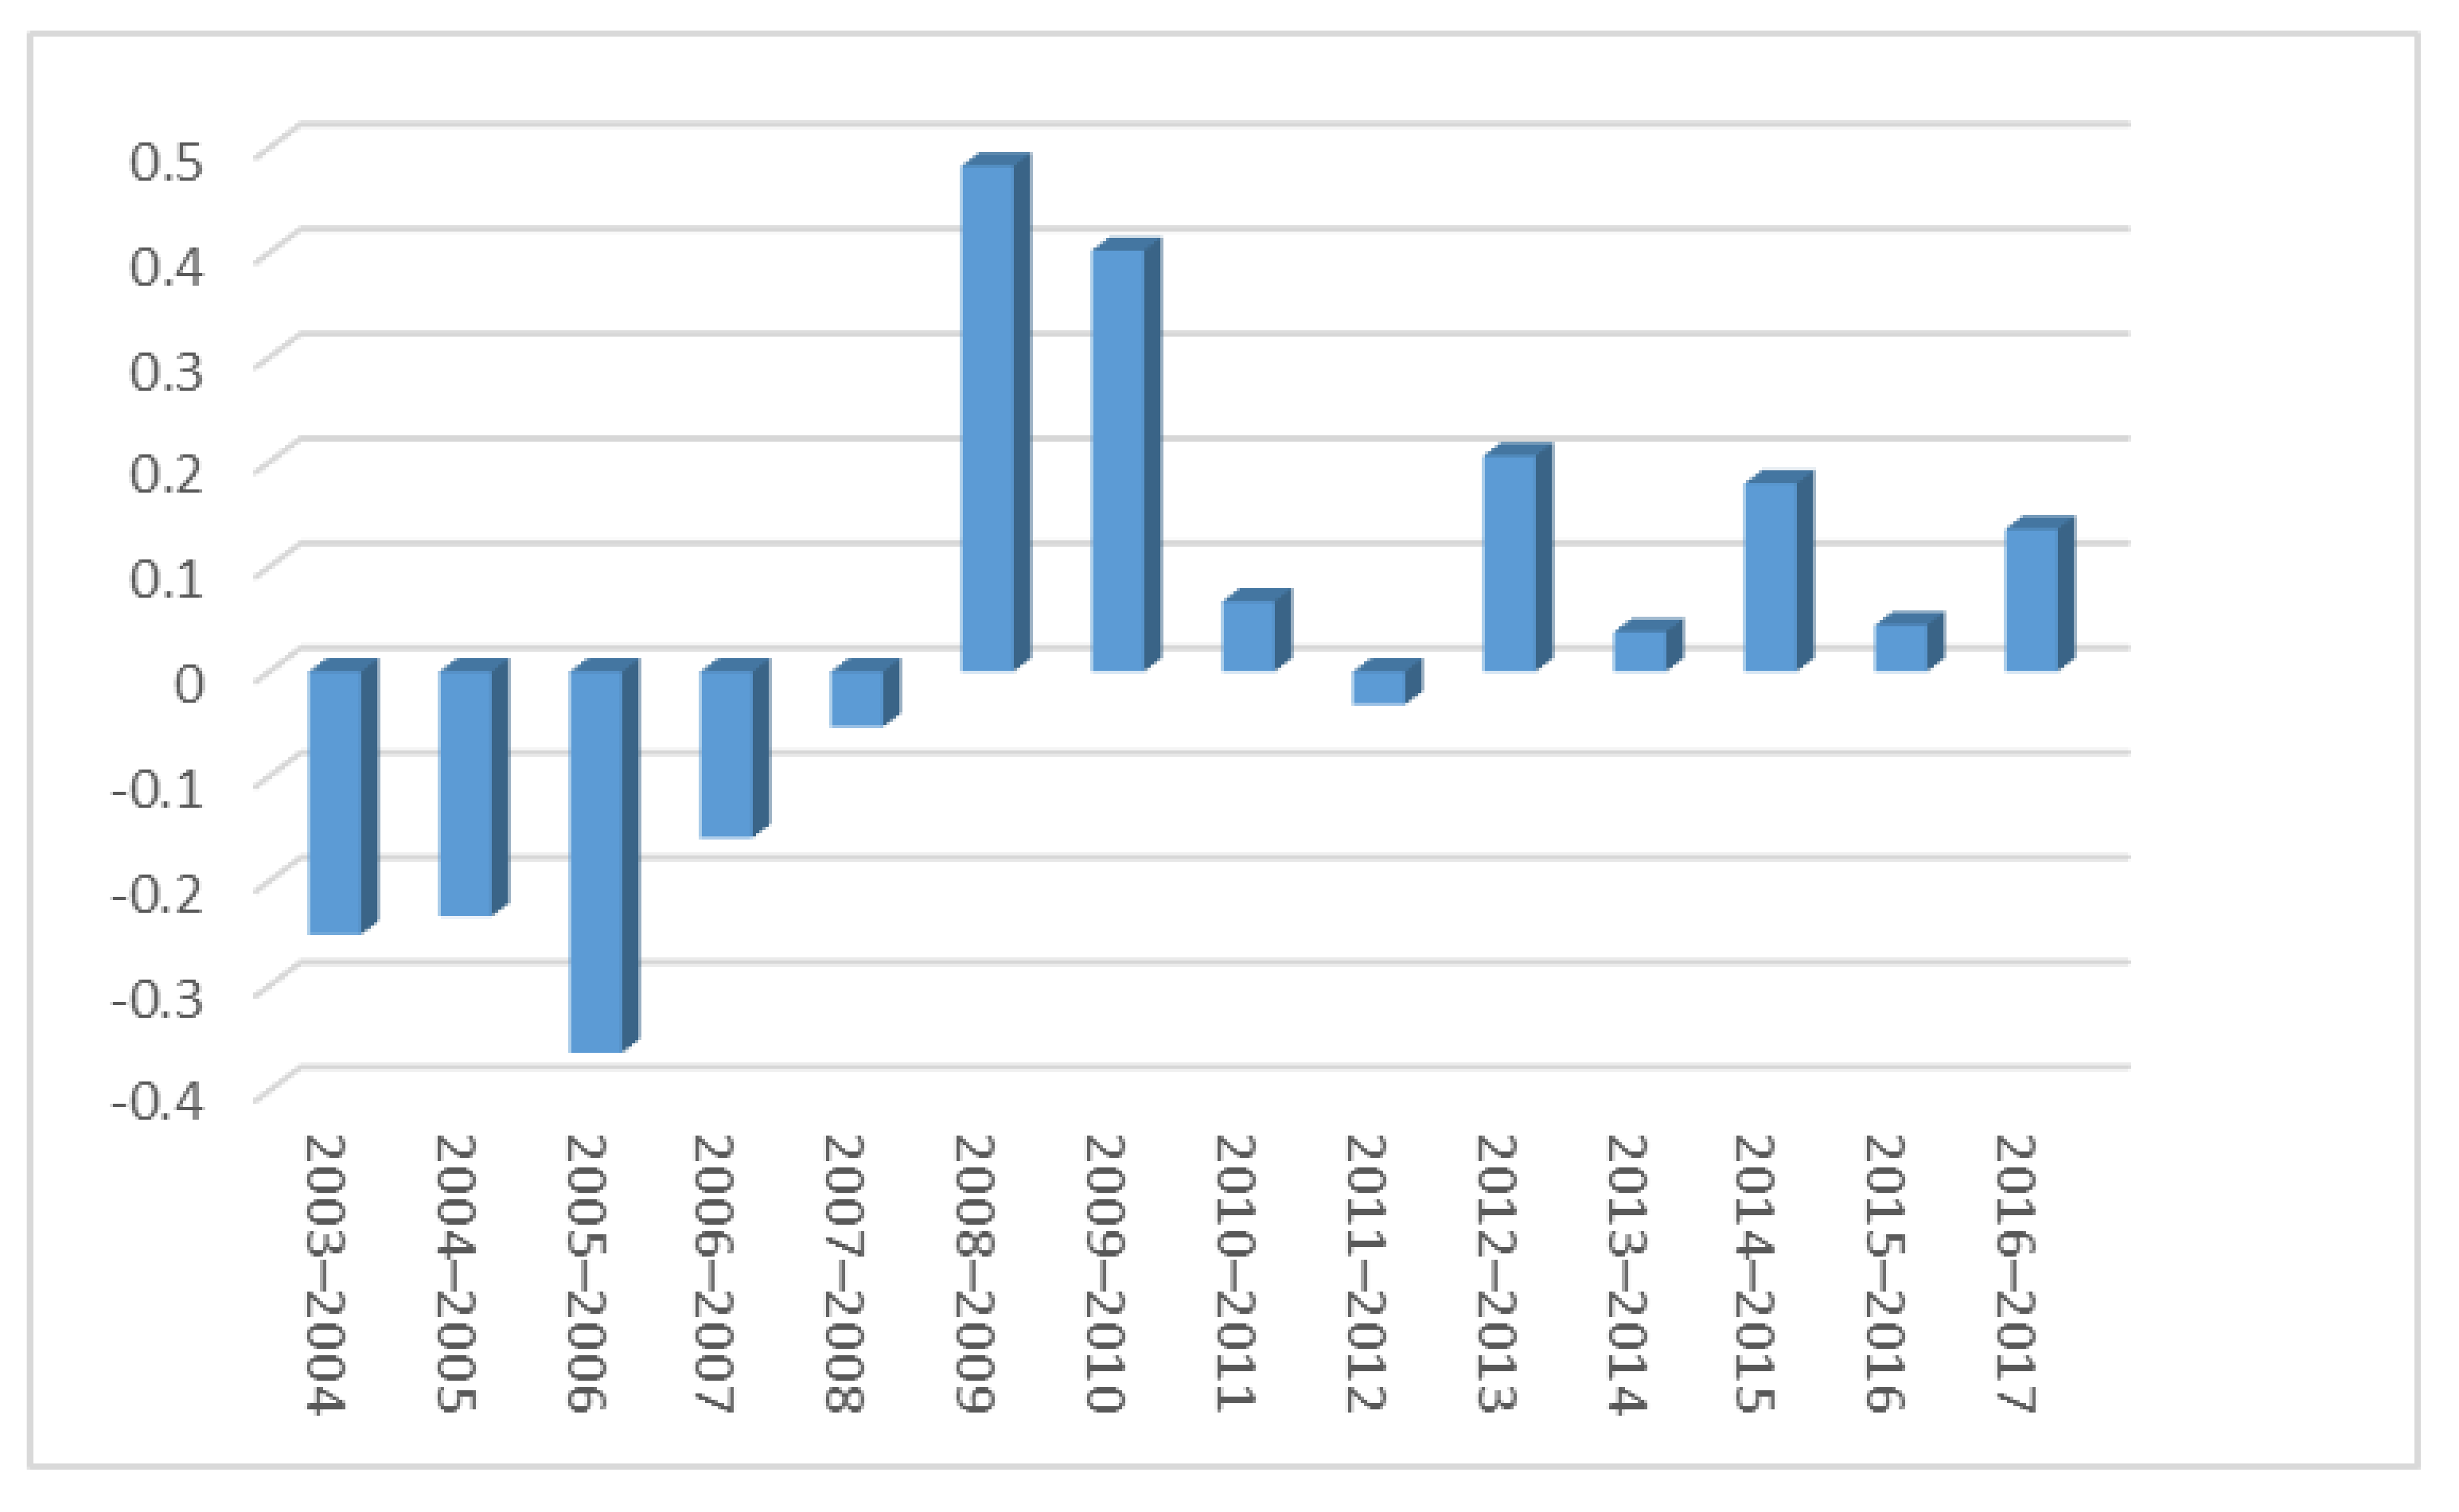
3.1.1. Time Evolution of LITFP in the YREB

Based on the constructed total factor productivity evaluation index system for the logistics industry in the YREB, this paper uses the DEA-Malmquist index method to measure the LITFP in the YREB from 2003 to 2017, and it obtains its TFPC and its decomposition factors. According to the measurement method introduced earlier, we can decompose TFPC into TEC and TC, and TEC can be further decomposed into PEC and SEC. The results are shown in Table 2.
The measured TFP index and its decomposition of LI in the YREB are reflected on a graph, as shown in Figure 2. From an overall perspective, the logistics industry in the YREB developed relatively well from 2003 to 2017, with an average TFPC of 0.978, which still has some room for upward mobility. During this 15-year period, TFPC showed an overall inverted N-shaped trend, which can be roughly divided into three stages. The first stage was from 2003 to 2007, when TFPC was largely on a downward trend, falling from 1.017 in 2003 to 0.848 in 2007. During this period, the LI in YREB was in its infancy, with less capital and manpower input, underdeveloped logistics technology, and a low output value of LI. The second stage was from 2007 to 2013, during which TFPC showed an upward trend and exceeded the initial value level, with TFPC increasing to 1.042. In 2006, the national “Eleventh Five-Year Plan” outline proposed to “vigorously develop the modern logistics industry”, which established its status as an industry in the national economy. The strong support of the state has prompted the provinces and cities of the YREB to increase their investment in logistics elements and improve the efficiency of LI. In 2009, the government issued the “Logistics Industry Adjustment and Revitalization Plan” and proposed to accelerate the research and application of the Internet of Things, which greatly promoted the technological progress of LI, thus driving the growth of TFP in LI. The third stage was from 2013 to 2017, and during this period, TFPC gradually decreased to 0.975. In 2012, the 18th National Congress of the Communist Party of China was held, which put forward a strategic plan for comprehensively deepening reforms. As China entered a period of deepening reform across the board, the logistics industry faced adjustments, with some high-energy-consuming and high-polluting enterprises facing discontinuation of production and closure. At the same time, after early rapid development, the current technology level and management methods can no longer fully meet the development of the logistics industry, and the overall TFP has fluctuated.
From the decomposition results of TEC, PEC is higher than SEC as a whole. In 15 years, PEC has remained relatively stable, whereas the change of SEC is relatively obvious. Therefore, the main factor that affects the level of TEC is SEC. In the future, although YREB can continue to rely on human resources and scientific and technological innovation to improve PEC, it should pay more attention to expanding the scale of the logistics industry and to forming economies of scale in the logistics industry to improve the overall logistics industry level in the economic zone.
The above analysis shows that the improvement of TFPC depends on the improvement of TC, and TEC plays a minimal role in the improvement of TFPC. The YREB has used its resource advantages to promote rapid economic development. The economy is growing at a high speed, and the government can increase its investment in resources such as technology and education. With the application of high technology such as artificial intelligence to production, the technological level of enterprises has been greatly improved. Therefore, TC has played a vital role in the growth of TFPC. However, TEC is low, and PEC has not contributed to an increase in TFPC, but rather has acted as a “drag”.

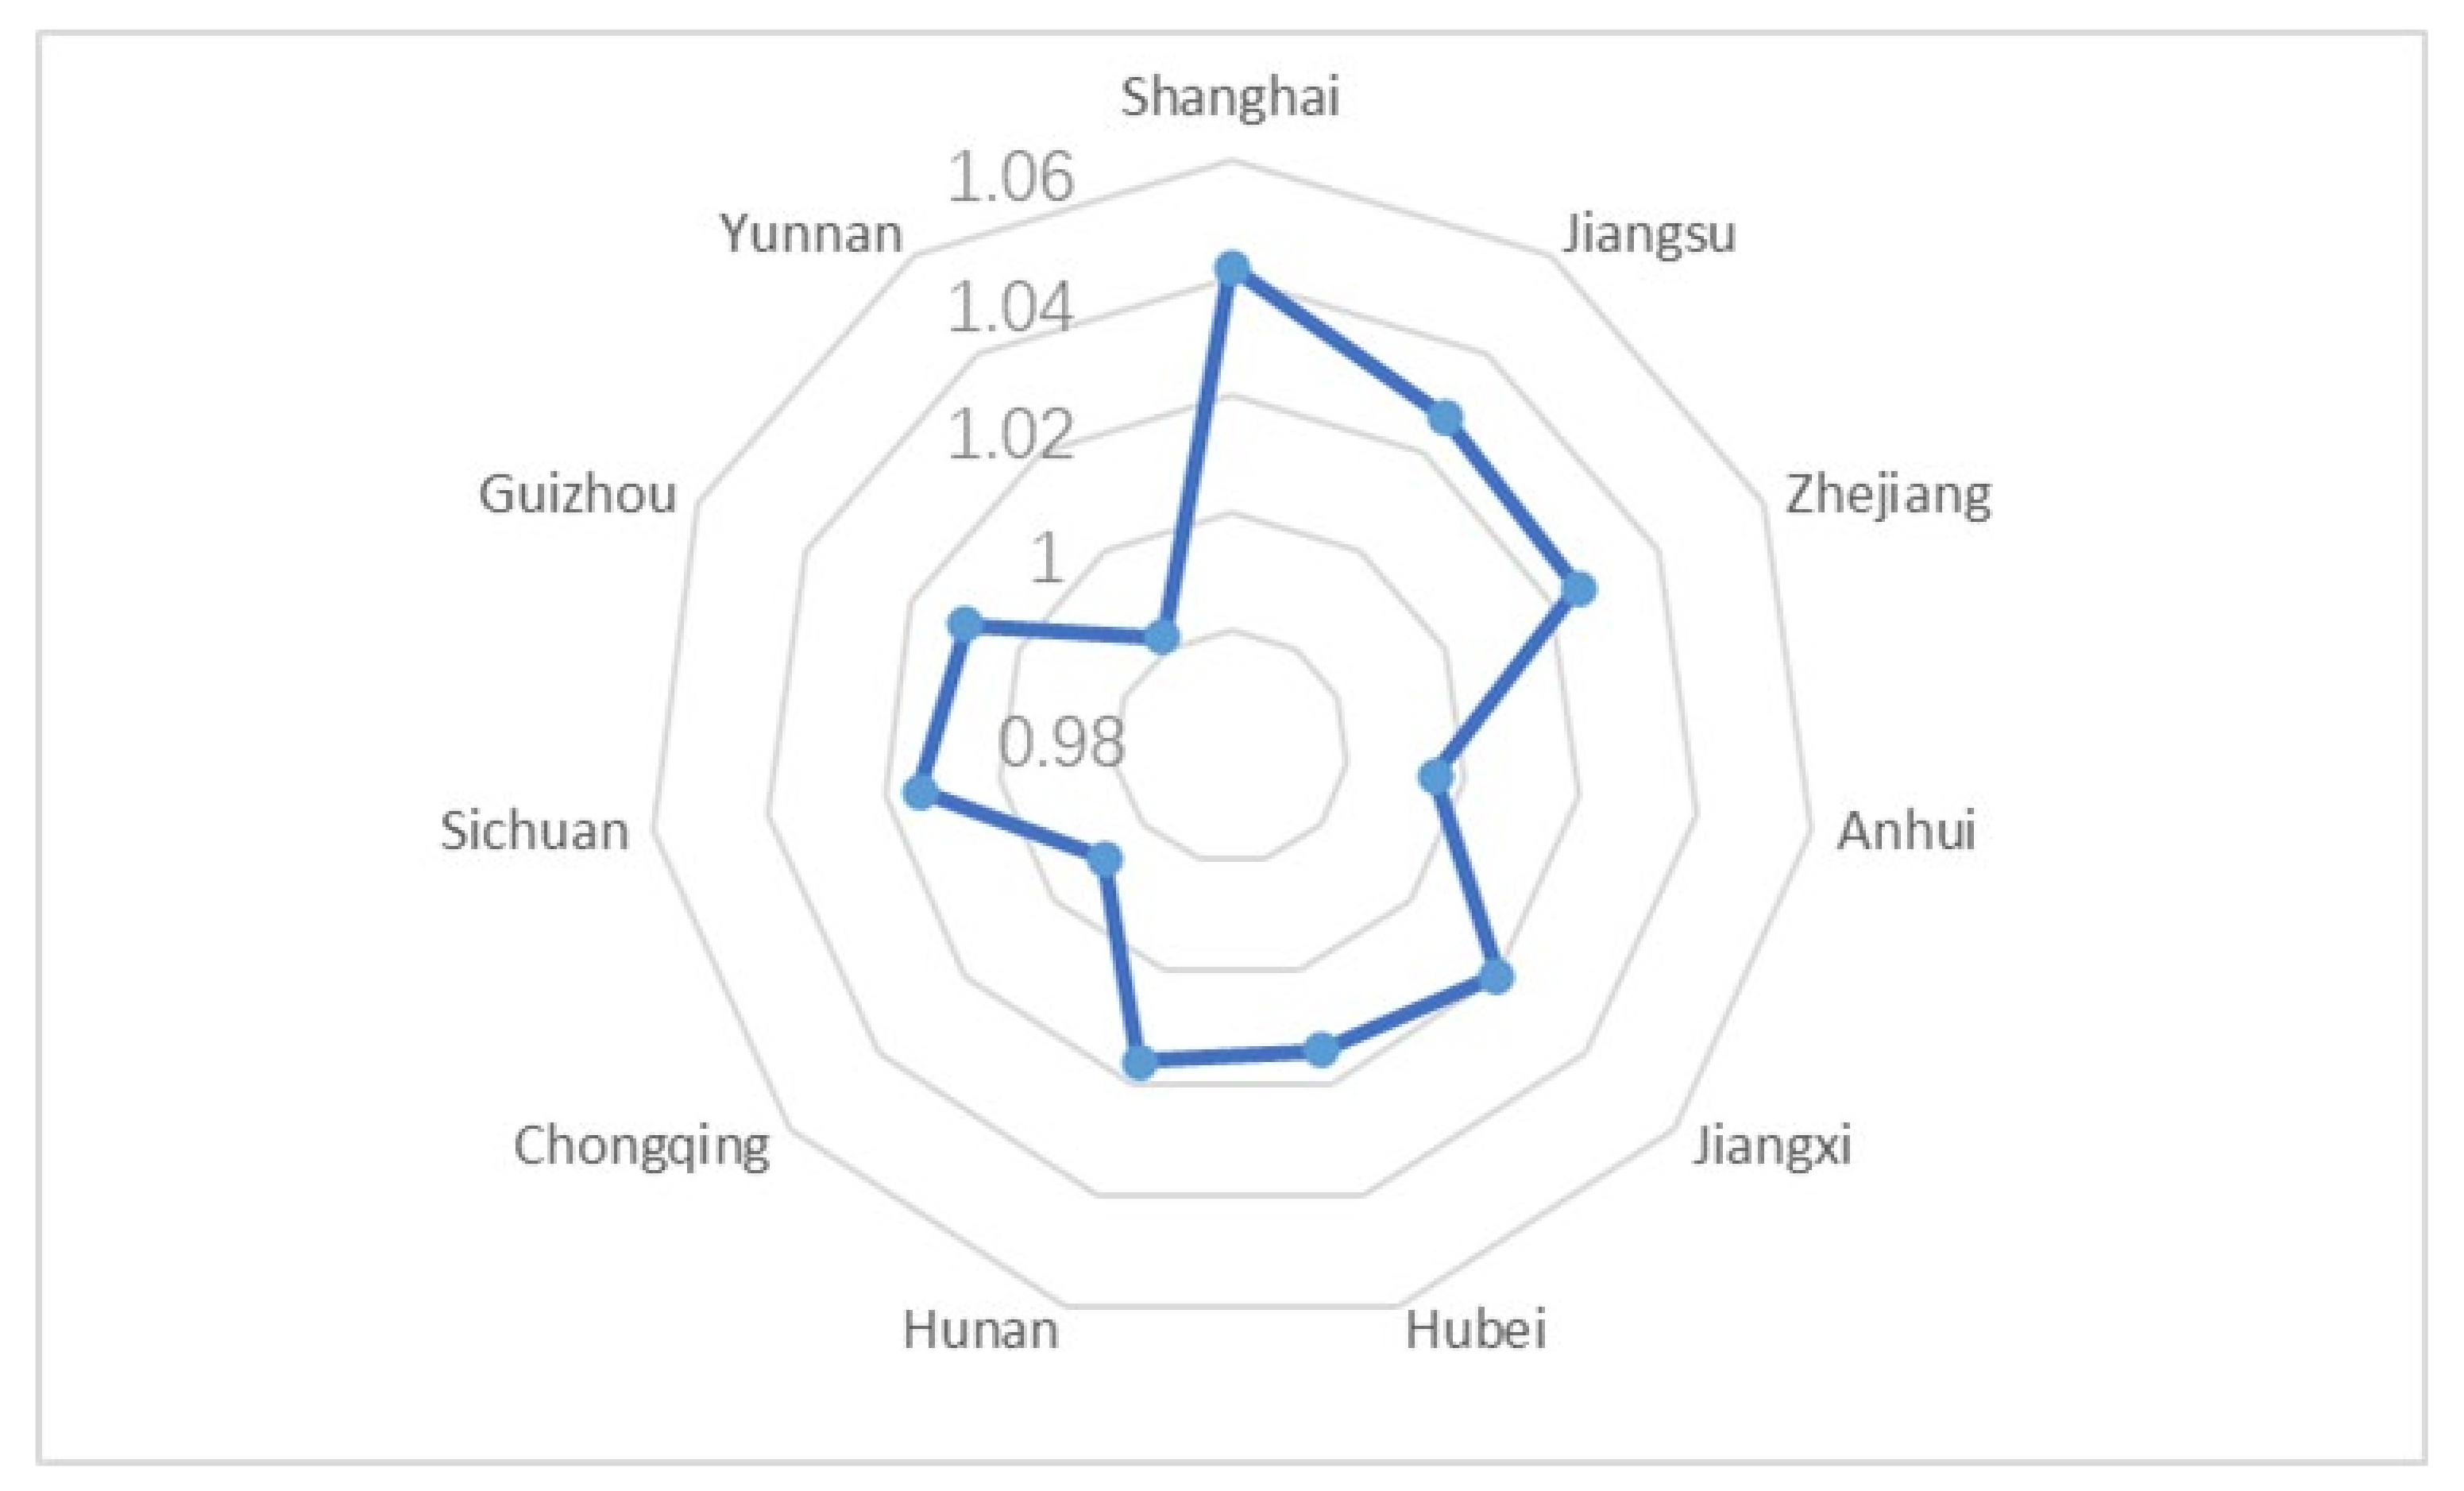
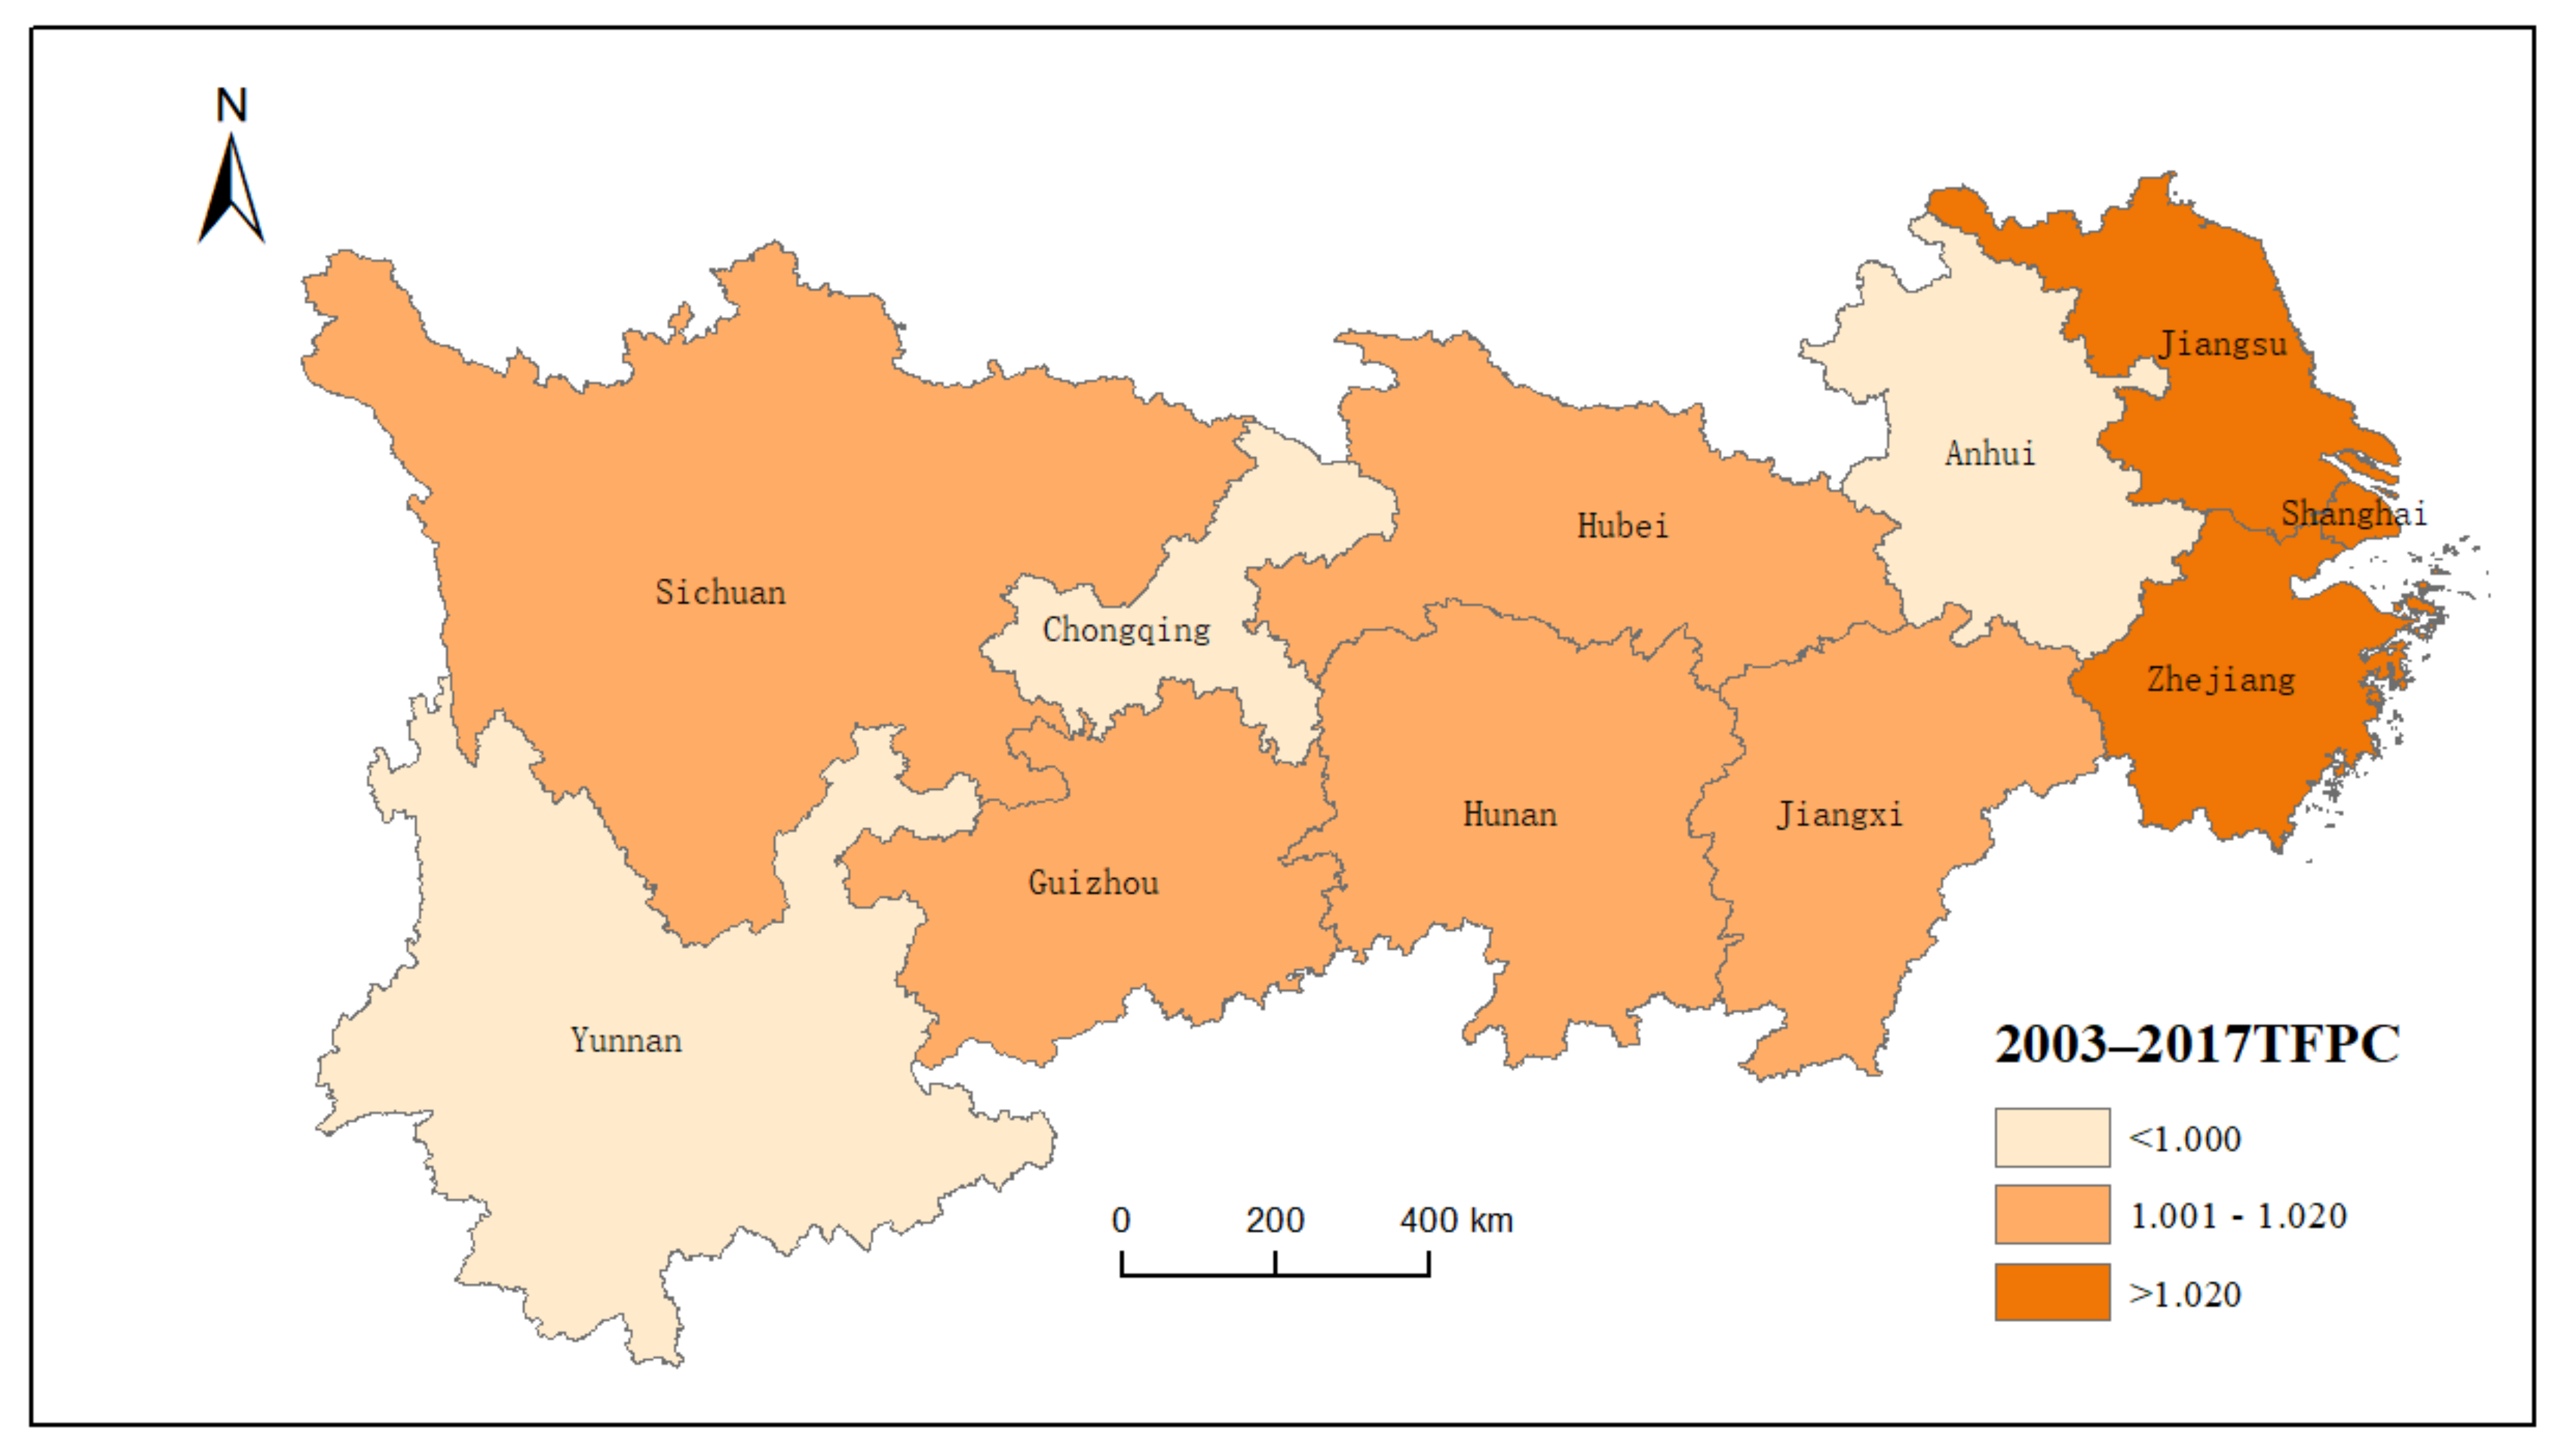
3.1.2. Spatial Evolution of LITFP in the YREB

In order to have a more comprehensive understanding of the changes in LITFP in the YREB, this paper conducts a horizontal analysis of LITFP in each province and city based on the longitudinal study of the overall time series. The results are shown in Figure 3. Based on the LITFP and decomposition of each province and city in the YREB from 2013 to 2017, the spatial distribution map of 11 provinces and cities is drawn as shown in Figure 4. It can be seen from the figure that the average LITFP in most provinces and cities in the past 15 years is greater than 1, which shows that the LITFP of each province and city has shown an upward trend, and the overall development of the logistics industry in the YREB is in good condition. From 2003 to 2017, the LITFP of each province and city had a relatively obvious two-tier division, with a wide gap between regions. The spatial distribution generally presents a pattern of “high in the east and low in the west”, with LITFP in the east being higher than that in the middle and west, which is consistent with the research findings of Li et al. [9] and Tan et al. [33].
Among them, Shanghai, Jiangsu, and Zhejiang in the lower reaches have higher index values, above 1.2, which belong to high-efficiency growth areas. The lower reaches of the YREB are the concentration of industries and populations in China, with many logistics industries, and they have formed a certain scale economy. At the same time, the lower reaches of the Yangtze River provinces represented by Shanghai and Jiangsu have numerous scientific research institutes, which highlight their talent advantages. With this advantage, the technological innovation capacity of the logistics industry is also ahead of the middle and upper reaches of the provinces. The five provinces of Jiangxi, Hubei, Hunan, Guizhou, and Sichuan in the middle and lower reaches of the TFP are second, and they belong to the regions with higher efficiency growth. The TFP of Anhui, Chongqing, and Yunnan is below 1, and the efficiency growth is lower than the average level, indicating that their logistics industry has a low level of development in the YREB. However, Yunnan, as an underdeveloped province in the economic belt, has more room to improve technical efficiency and technological progress. Other developed provinces and cities may encounter technical bottlenecks in the development of the logistics industry, and technological progress is not enough to meet economic development.

3.2. Spatial Autocorrelation Analysis of LITFP in the YREB

3.2.1. Global Spatial Autocorrelation Analysis of LITFP in the YREB

In this paper, global spatial autocorrelation is used to further analyze the spatial correlation of LITFP in each province and city. The Moran’s I index is chosen to represent the global spatial autocorrelation coefficient of LITFP, and the results are shown in Figure 5. The absolute value of the Moran’s I index value represents the degree of correlation, and the positive and negative values are used to distinguish the positive and negative correlations. It can be seen from Figure 5 that the global Moran’s I for LITFP is sporadically distributed between positive and negative. In the past fifteen years, the Moran Index of the provinces and cities in the YREB has gradually tended to be positively correlated from the previous discrete distribution. The development of the logistics industry in the provinces and cities in the YREB is no longer a simple competition but has shifted to a mutual promotion and joint development among the provinces and cities. With the introduction of policies to support the development of the logistics industry, the development of the LI has accelerated, making the global spatial differences in logistics efficiency in the YREB slowly decrease. However, due to a large gap in the development level of logistics informatization within the region and the long-standing differences in industrial structure, the gap in the development of logistics efficiency within the region is still obvious.
According to the previous results, the average TFPs of the three-time periods, 2003–2007, 2008–2012, and 2013–2017, are selected for global spatial autocorrelation analysis, and the Moran scatter graphs are drawn in Figure 6. The overall regression line shifts from decreasing to increasing, indicating a positive interaction in the logistics industry in neighboring regions of the YREB. Since 2008, provinces and cities in the YREB have shown different degrees of spatial agglomeration effects. The distance between each point and the regression line gradually decreases, indicating a regional spillover effect between provinces and cities in the YREB and a certain correlation in spatial development.

3.2.2. Local Spatial Autocorrelation Analysis of LITFP in the YREB

To further explore the spatial correlation patterns between provinces and cities in YREB, this paper uses local spatial autocorrelation analysis to construct a spatial weight matrix based on the ROK principle and draws LISA agglomeration maps to analyze spatial correlations. This paper selects representative data in 2008–2009 and in 2015–2016 to obtain the LISA agglomeration diagram of LITFP, as shown in Figure 7.
During the period 2008–2009, three provinces, Shanghai, Jiangsu, and Zhejiang, were in the high-high agglomeration area, and Yunnan was in the low-low agglomeration area. The rest of the provinces did not pass the significance test. This indicates that there is an aggregation phenomenon in the same level of areas in the YREB. The lower reaches of the YREB, with its first-mover advantages such as location, transportation, and economy, continuously promote the concentration of logistics elements in the region. The spatial connections between provinces and cities are getting closer, and the internal differences are constantly shrinking. As a result, the entire region is in a high-high agglomeration zone. Due to the influence of China’s long-term trapezoidal development strategy and unfavorable location, the upstream area has a low level of intensification, scale, and efficiency in the logistics industry. The logistics development of the entire region is slow, and it is in a low-low agglomeration area. In 2015–2016, only Zhejiang and Guizhou in the YREB passed the significance test, with Zhejiang Province located in the high-high agglomeration area. Guizhou Province is in a high-low agglomeration area, indicating that its LITFP is growing rapidly, significantly ahead of its neighboring provinces and cities. The spatial agglomeration effect of the provinces located in the middle reaches of the YREB is not obvious, and the spillover effect of the logistics industry from the lower reaches to the middle reaches has not yet occurred. The regional development gap is still significant.

4. Conclusions and Policy Implications

Based on the DEA-Malmquist and ESDA model, this paper analyzes the spatial-temporal evolution of LITFP in 11 provinces and cities of YREB from 2003 to 2017. The research conclusions of this article are as follows: (1) The overall development of LI in the YREB is relatively good, with an inverted N-shaped trend over the years, and there is room for growth. It can be seen from the empirical analysis that technological progress (TC) is the main reason for the increase in LITFP. The contribution of technical efficiency (TEC) to TFP is very limited and does not play a facilitating role to some extent. (2) According to the spatial-temporal distribution characteristics of TFP, the LITFP is showing an upward trend as a whole and presents a spatial distribution pattern of high in the east and low in the west. At the regional level, the levels of green TFP inefficiency in the YREB are various. The eastern logistics industry has the highest LITFP, followed by that in the central and western logistics industries. In addition, the sources of LITFP of regional logistics industries are also quite different. LITFP inefficiency in central LI mainly comes from TC and TEC. In addition, for the logistics industry of the western region, its LITFP inefficiency comes from pure technology inefficiency and scale inefficiency. (3) The positive spatial correlation among provinces and cities in the YREB is gradually increasing, and there is a mutually reinforcing effect. Spatial autocorrelation analysis shows that the spatial correlation of LITFP in each province and city is gradually increasing. However, the coordinated development between regions is still limited, and the mutual promotion effect needs to be strengthened.
Therefore, to continuously improve the LITFP and achieve high-quality development of LI, we should adhere to the problem orientation, focus on the shortcomings of development, and give priority to solving the problems of unbalanced regional development and slow technological progress. The specific suggestions mainly include the following three points: (1) Strengthen the coordinated development of inter-regional logistics. While advancing the integrated development of logistics in the YREB with the “National Logistics Hub Layout and Construction Plan” as the guideline, optimize the industrial layout, promote the coordinated development of the regional logistics industry, and realize the establishment of a linkage mechanism among the upper, middle and lower reaches of LI in the YREB. Meanwhile, the developed eastern regions should take advantage of technological innovation and should strengthen exchanges and cooperation with regions lagging behind in the logistics industry. In contrast, the central and western regions should not only increase investment in research and development, but they should also increase investment in the construction of supporting facilities for researchers to play the positive role of technological innovation. (2) Accelerate the innovation and development of the modern logistics industry. The government should encourage the construction of pilot cities for the innovative development of modern logistics; accelerate the innovation of government departments in logistics industry planning, management systems and mechanisms, regional collaboration and linkage, new business models, and policy support; and increase efforts to support industry enterprises in the innovative development of intelligent logistics, logistics technology and equipment, and business models. (3) Increase opening up to the outside world. Considering the geographical location and development level of the upper reaches in the YREB, it is important to strengthen the degree of the region’s opening to the outside world and to increase contacts and exchanges with foreign countries and the upper and middle reaches. The development of logistics technology and management methods should be promoted, and trade partnerships should be deepened.
This paper also has some limitations. In the current context of resource and environmental constraints, this paper does not take into account the impact of the environment on total factor productivity. Future research can be further carried out in the following ways: by integrating carbon emissions into the total factor productivity analysis framework to measure the green TFP of the logistics industry and by assessing its influencing factors.

Author Contributions

Conceptualization, methodology and writing—original draft preparation, Y.M.; formal analysis, software and writing—review & editing, Y.L.; investigation and resources, D.X.; data curation and visualization, Y.W.; supervision, funding acquisition and project administration, J.C. All authors have read and agreed to the published version of the manuscript.

Funding

National Natural Science Foundation of China (71991482).

Institutional Review Board Statement

Not applicable.

Informed Consent Statement

Not applicable.

Data Availability Statement

The data presented in this study are available on request from the corresponding author.

Conflicts of Interest

The authors declare no conflict of interest.

References

  1. Deng, F.; Xu, L.; Fang, Y.; Gong, Q.; Li, Z. PCA-DEA-Tobit Regression Assessment with Carbon Emission Constraints of China’s Logistics Industry. J. Clean. Prod. 2020, 271, 122548. [Google Scholar] [CrossRef]
  2. Yu, L.; Shi, M.; Li, J. Logistics efficiency and factor decomposition of the Yangtze River Economic Belt based on DEA-Malmquist index model. Bus. Econ. Manag. 2018, 4, 16–25. (In Chinese) [Google Scholar] [CrossRef]
  3. State Council the People’s Republic of China. Medium and Long Term Planning of Logistics Development (2014–2020). 2014. Available online: http://www.gov.cn/zhengce/content/2014-10/04/content_9120.htm (accessed on 5 January 2022).
  4. Liang, Z.; Chiu, Y.; Guo, Q.; Liang, Z. Low-Carbon Logistics Efficiency: Analysis on the Statistical Data of the Logistics Industry of 13 Cities in Jiangsu Province, China. Res. Transp. Bus. Manag. 2021, 100740. [Google Scholar] [CrossRef]
  5. Liu, W.; Liang, Y.; Bao, X.; Qin, J.; Lim, M.K. China’s Logistics Development Trends in the Post COVID-19 Era. Int. J. Logist. Res. Appl. 2020, 1, 1–12. [Google Scholar] [CrossRef]
  6. Tian, X.; Zhang, M. Research on Spatial Correlations and Influencing Factors of Logistics Industry Development Level. Sustainability 2019, 11, 1356. [Google Scholar] [CrossRef] [Green Version]
  7. Zuo, Z.; Guo, H.; Li, Y.; Cheng, J. A Two-Stage DEA Evaluation of Chinese Mining Industry Technological Innovation Efficiency and Eco-Efficiency. Environ. Impact Assess. Rev. 2022, 94, 106762. [Google Scholar] [CrossRef]
  8. Xu, X.; Huang, X.; Huang, J.; Gao, X.; Chen, L. Spatial-temporal characteristics of agriculture green total factor productivity in China, 1998–2016: Based on more sophisticated calculations of carbon emissions. Int. J. Environ. Res. Public Health 2019, 16, 3932. [Google Scholar] [CrossRef] [Green Version]
  9. Li, M.; Wang, J. Spatial-temporal evolution and influencing factors of total factor productivity in China’s logistics industry under low-carbon constraints. Environ. Sci. Pollut. Res. 2022, 29, 883–900. [Google Scholar] [CrossRef]
  10. Baldoni, E.; Coderoni, S.; Esposti, R. The productivity and environment nexus with farm-level data. The Case of Carbon Footprint in Lombardy FADN farms. Bio-Based Appl. Econ. 2017, 6, 119–137. [Google Scholar] [CrossRef]
  11. Baldoni, E.; Coderoni, S.; Esposti, R. The Complex Farm-Level Relationship between Environmental Performance and Productivity. The Case of Carbon Footprint of Lombardy farms. Environ. Sci. Policy 2018, 89, 73–82. [Google Scholar] [CrossRef]
  12. Wu, S.; Walker, D.; Devadoss, S. Productivity Growth and its Component in Chinese Agriculture after Reforms. Rev. Dev. Econ. 2001, 5, 375–391. [Google Scholar] [CrossRef] [Green Version]
  13. Lambert, D.K.; Parker, E. Productivity in Chinese Provincial Agriculture. J. Agric. Econ. 2010, 49, 378–392. [Google Scholar] [CrossRef]
  14. Wu, D. Impact of Green Total Factor Productivity in Marine Economy Based on Entropy Method. Pol. Marit. Res. 2018, 25, 141–146. [Google Scholar] [CrossRef] [Green Version]
  15. Bayarsaihan, T.; Coelli, T. Productivity growth in pre-1990 Mongolian agriculture: Spiraling disaster or emerging success. Agric. Econ. 2003, 28, 121–137. [Google Scholar]
  16. Guo, P.; Qi, X.; Zhou, X.; Li, W. Total-factor energy efficiency of coal consumption: An empirical analysis of China’s energy intensive industries. J. Clean. Prod. 2018, 172, 2618–2624. [Google Scholar] [CrossRef]
  17. Han, H.; Zhong, Z.; Wen, C.; Sun, H. Agricultural environmental total factor productivity in China under technological heterogeneity: Characteristics and determinants. Environ. Sci. Pollut. Res. 2018, 25, 32096–32111. [Google Scholar] [CrossRef]
  18. Zhang, Y.; Wu, Z. Intelligence and green total factor productivity based on China’s province-level manufacturing data. Sustainability 2021, 13, 4989. [Google Scholar] [CrossRef]
  19. Li, W.; Wang, W.; Wang, Y.; Ali, M. Historical growth in total factor carbon productivity of the Chinese industry—A comprehensive analysis. J. Clean. Prod. 2018, 170, 471–485. [Google Scholar] [CrossRef]
  20. Markovits-Somogyi, R.; Bokor, Z. Assessing the Logistics Efficiency of European Countries by Using the DEA-PC Methodology. Transport 2014, 29, 137–145. [Google Scholar] [CrossRef] [Green Version]
  21. Xu, S. Study on the Logistics Efficiency of Three Northeast Provinces Based on Three-Stage DEA. In Proceedings of the International Conference on Information Computing and Applications, Chengde, China, 14–16 September 2012; Liu, C., Wang, L., Yang, A., Eds.; Springer: Berlin/Heidelberg, Germany, 2012; pp. 810–819. [Google Scholar]
  22. Wong, W.P.; Soh, K.L.; Goh, M. Innovation and productivity: Insights from Malaysia’s logistics industry. Int. J. Log. Res. Appl. 2016, 19, 318–331. [Google Scholar] [CrossRef]
  23. Lan, S.L.; Tseng, M.L.; Chen, Y.; Donald, H. Trends in sustainable logistics in major cities in China. Sci. Total Environ. 2020, 712, 136381. [Google Scholar] [CrossRef]
  24. Petiot, R.; Dumas, A.; Cavaignac, L. Third-party logistics efficiency: An innovative two-stage DEA analysis of the French market. Int. J. Logs 2020, 3, 581–604. [Google Scholar]
  25. He, D.; Yang, J.; Wang, Z.; Li, W. Has the Manufacturing Policy Helped to Promote the Logistics Industry? PLoS ONE 2020, 15, e0235292. [Google Scholar] [CrossRef]
  26. Nguyen, N.T.; Tran, T.T. Raising opportunities in strategic alliance by evaluating efficiency of logistics companies in Vietnam: A case of Cat Lai Port. Neural Comput. Appl. 2019, 31, 7963–7974. [Google Scholar] [CrossRef]
  27. Park, H.G.; Lee, Y.J. The Efficiency and Productivity Analysis of Large Logistics Providers Services in Korea. Asian J. Shipp. Logist. 2015, 31, 469–476. [Google Scholar] [CrossRef] [Green Version]
  28. Zhu, W.; Zhu, Y.; Yu, Y. China’s regional environmental efficiency evaluation: A dynamic analysis with biennial Malmquist productivity index based on common weights. Environ. Sci. Pollut. Res. 2020, 27, 39726–39741. [Google Scholar] [CrossRef]
  29. Huang, B.; Zhang, L.; Ma, L.; Bai, W.; Ren, J. Multi-criteria decision analysis of China’s energy security from 2008 to 2017 based on Fuzzy BWM-DEA-AR model and Malmquist Productivity Index. Energy 2021, 228, 120481. [Google Scholar] [CrossRef]
  30. Liu, Z.K.; Jiang, Y.F.; Bolayog, D. Does “replacing business tax with value-added tax” promote the energy efficiency of the logistics industry in China? Environ. Sci. Pollut. Res. 2019, 26, 33169–33180. [Google Scholar] [CrossRef]
  31. Liang, Z.G.; Chiu, Y.H.; Li, X.C.; Guo, Q.; Yun, Y. Study on the effect of environmental regulation on the green total factor productivity of logistics industry from the perspective of low carbon. Sustainability 2020, 12, 175. [Google Scholar] [CrossRef] [Green Version]
  32. Long, R.; Ouyang, H.; Guo, H. Super-Slack-Based Measuring Data Envelopment Analysis on the Spatial-Temporal Patterns of Logistics Ecological Efficiency Using Global Malmquist Index Model. Environ. Technol. Innov. 2020, 18, 100770. [Google Scholar] [CrossRef]
  33. Tan, L.L.; Wu, Q.Q.; Li, Q.; Cheng, W.; Gu, Y.L. A panel analysis of the sustainability of logistics industry in China: Based on non-radial slacks-based method. Environ. Sci. Pollut. Res. 2019, 26, 21948–21963. [Google Scholar] [CrossRef]
  34. Peng, Z.M.; Wu, Q.Q.; Wang, D.F.; Li, M. Temporal-spatial pattern and influencing factors of China’s province-level transport sector carbon emissions efficiency. Pol. J. Environ. Stud. 2020, 29, 233–247. [Google Scholar] [CrossRef]
  35. Charnes, A.; Cooper, W.W.; Rhodes, E. Measuring the Efficiency of Decision Making Units. Eur. J. Oper. Res. 1978, 2, 429–444. [Google Scholar] [CrossRef]
  36. Li, Y.; Zuo, Z.; Xu, D.; Wei, Y. Mining Eco-Efficiency Measurement and Driving Factors Identification Based on Meta-US-SBM in Guangxi Province, China. Int. J. Environ. Res. Public Health 2021, 18, 5397. [Google Scholar] [CrossRef]
  37. Chen, C.-M.; van Dalen, J. Measuring Dynamic Efficiency: Theories and an Integrated Methodology. Eur. J. Oper. Res. 2010, 203, 749–760. [Google Scholar] [CrossRef]
  38. Asmild, M.; Paradi, J.C.; Reese, D.N.; Tam, F. Measuring Overall Efficiency and Effectiveness Using DEA. Eur. J. Oper. Res. 2007, 178, 305–321. [Google Scholar] [CrossRef]
  39. Xu, Z.; Zhu, X.; Wei, G.; Ouyang, X. Spatio-Temporal Evolution and Mechanism Analysis of China’s Regional Innovation Efficiency. Sustainability 2021, 13, 11089. [Google Scholar] [CrossRef]
  40. Xu, Z.; Yin, Y. Regional Development Quality of Yangtze River Delta: From the Perspective of Urban Population Agglomeration and Ecological Efficiency Coordination. Sustainability 2021, 13, 12818. [Google Scholar] [CrossRef]
  41. Li, H.; Qu, J.; Wang, D.; Meng, P.; Lu, C.; Zeng, J. Spatial-Temporal Integrated Measurement of the Efficiency of Urban Land Use in Yellow River Basin. Sustainability 2021, 13, 8902. [Google Scholar] [CrossRef]
  42. Yi, L.; Liu, Y.; Li, Z.; Yang, L.; Wang, F. Study on Serviceability and Efficiency of Seven Pilot Carbon Trading Exchanges in China. Sci. Total Environ. 2020, 703, 135465. [Google Scholar] [CrossRef]
  43. Chang, K.; Wan, Q.; Lou, Q.; Chen, Y.; Wang, W. Green Fiscal Policy and Firms’ Investment Efficiency: New Insights into Firm-Level Panel Data from the Renewable Energy Industry in China. Renew. Energy 2020, 151, 589–597. [Google Scholar] [CrossRef]
  44. Lombardi, G.V.; Stefani, G.; Paci, A.; Becagli, C.; Miliacca, M.; Gastaldi, M.; Giannetti, B.F.; Almeida, C.M.V.B. The Sustainability of the Italian Water Sector: An Empirical Analysis by DEA. J. Clean. Prod. 2019, 227, 1035–1043. [Google Scholar] [CrossRef]
  45. Malmquist, S. Index Numbers and Indifference Surfaces. Trab. Estad. 1953, 4, 209–242. [Google Scholar] [CrossRef]
  46. Caves, D.W.; Christensen, L.R.; Diewert, W.E. The Economic Theory of Index Numbers and the Measurement of Input, Output, and Productivity. Econometrica 1982, 50, 1393–1414. [Google Scholar] [CrossRef]
  47. Färe, R.; Grosskopf, S.; Lindgren, B.; Roos, P. Productivity Changes in Swedish Pharamacies 1980–1989: A Non-Parametric Malmquist Approach. J. Prod. Anal. 1992, 3, 85–101. [Google Scholar] [CrossRef]
  48. Färe, R.; Grosskopf, S.; Norris, M.; Zhang, Z. Productivity Growth, Technical Progress, and Efficiency Change in Industrialized Countries. Am. Econ. Rev. 1994, 84, 66–83. [Google Scholar]
  49. Ray, S.C.; Desli, E. Productivity Growth, Technical Progress, and Efficiency Change in Industrialized Countries: Comment. Am. Econ. Rev. 1997, 87, 1033–1039. [Google Scholar]
  50. De Siano, R.; D’Uva, M. Do Spatial Interdependencies Matter in Italian Regional Specialization? Geogr. Anal. 2014, 46, 185–208. [Google Scholar] [CrossRef]
  51. Li, X.; Griffin, W.A. Using ESDA with Social Weights to Analyze Spatial and Social Patterns of Preschool Children’s Behavior. Appl. Geogr. 2013, 43, 67–80. [Google Scholar] [CrossRef]
  52. Xie, Z.; Qin, Y.; Li, Y.; Shen, W.; Zheng, Z.; Liu, S. Spatial and Temporal Differentiation of COVID-19 Epidemic Spread in Mainland China and Its Influencing Factors. Sci. Total Environ. 2020, 744, 140929. [Google Scholar] [CrossRef]
  53. Wang, K.; Zhao, X.; Peng, B.; Zeng, Y. Spatio-Temporal Pattern and Driving Factors of Municipal Solid Waste Generation in China: New Evidence from Exploratory Spatial Data Analysis and Dynamic Spatial Models. J. Clean. Prod. 2020, 270, 121794. [Google Scholar] [CrossRef]
  54. Wang, S.; Liu, H.; Pu, H.; Yang, H. Spatial Disparity and Hierarchical Cluster Analysis of Final Energy Consumption in China. Energy 2020, 197, 117195. [Google Scholar] [CrossRef]
  55. Yang, J.; Tang, L.; Mi, Z.; Liu, S.; Li, L.; Zheng, J. Carbon Emissions Performance in Logistics at the City Level. J. Clean. Prod. 2019, 231, 1258–1266. [Google Scholar] [CrossRef]
  56. Gong, Y.; Yang, X.-Q.; Ran, C.-Y.; Shi, V.; Zhou, Y.-F. Evaluation of the Sustainable Coupling Coordination of the Logistics Industry and the Manufacturing Industry in the Yangtze River Economic Belt. Sustainability 2021, 13, 5167. [Google Scholar] [CrossRef]
Figure 1. Geographical locations of the provinces and cities in the YREB.
Sustainability 14 02740 g001
Figure 2. Time evolution of LITFP and its decomposition in the YREB.
Sustainability 14 02740 g002
Figure 3. The average LITFP of each province and city in the YREB.
Sustainability 14 02740 g003
Figure 4. The spatial distribution of LITFP of each province and city in the YREB.
Sustainability 14 02740 g004
Figure 5. The global Moran’s I index of LITFP in the YREB.
Sustainability 14 02740 g005
Figure 6. The global Moran’s I scatter graphs of LITFP in the YREB.
Sustainability 14 02740 g006
Figure 7. The LISA agglomeration diagram of LITFP in the YREB.
Sustainability 14 02740 g007
Table 1. Description of indicator variables of LI in the YREB.
Indicator TypeVariableUnit
inputemployees (X1)100 million yuan
fixed asset investment (X2)10 thousand people
road operating mileage(X3)10 thousand km
outputadded value (Y1)100 million yuan
cargo turnover volume(Y2)100 million tons·km
Table 2. The total factor productivity and decomposition of LI in the YREB.
YearTFPCTCTECPECSEC
2003–20041.0171.0190.9981.0010.997
2004–20050.9801.0350.9480.9910.956
2005–20061.0561.0351.0201.0031.016
2006–20070.9541.0120.9430.9920.951
2007–20080.8480.8950.9470.9720.975
2008–20090.8540.8860.9650.9431.023
2009–20100.9350.9600.9740.9860.988
2010–20110.9190.9081.0121.0180.994
2011–20121.0170.9811.0370.9701.070
2012–20131.0361.0031.0331.0281.005
2013–20141.0421.0331.0091.0250.984
2014–20151.0421.0121.0301.0201.009
2015–20161.0191.0031.0161.0051.011
2016–20170.9750.9611.0141.0021.012
Average0.9780.9820.9960.9970.999
Publisher’s Note: MDPI stays neutral with regard to jurisdictional claims in published maps and institutional affiliations.

