
Recycling of 3D Printable Thermoplastic Cellulose-Composite

 , , , ,
Abstract
:1. Introduction
2. Materials and Methods
2.1. Materials
2.2. Processing
2.2.1. Compounding and Injection Molding
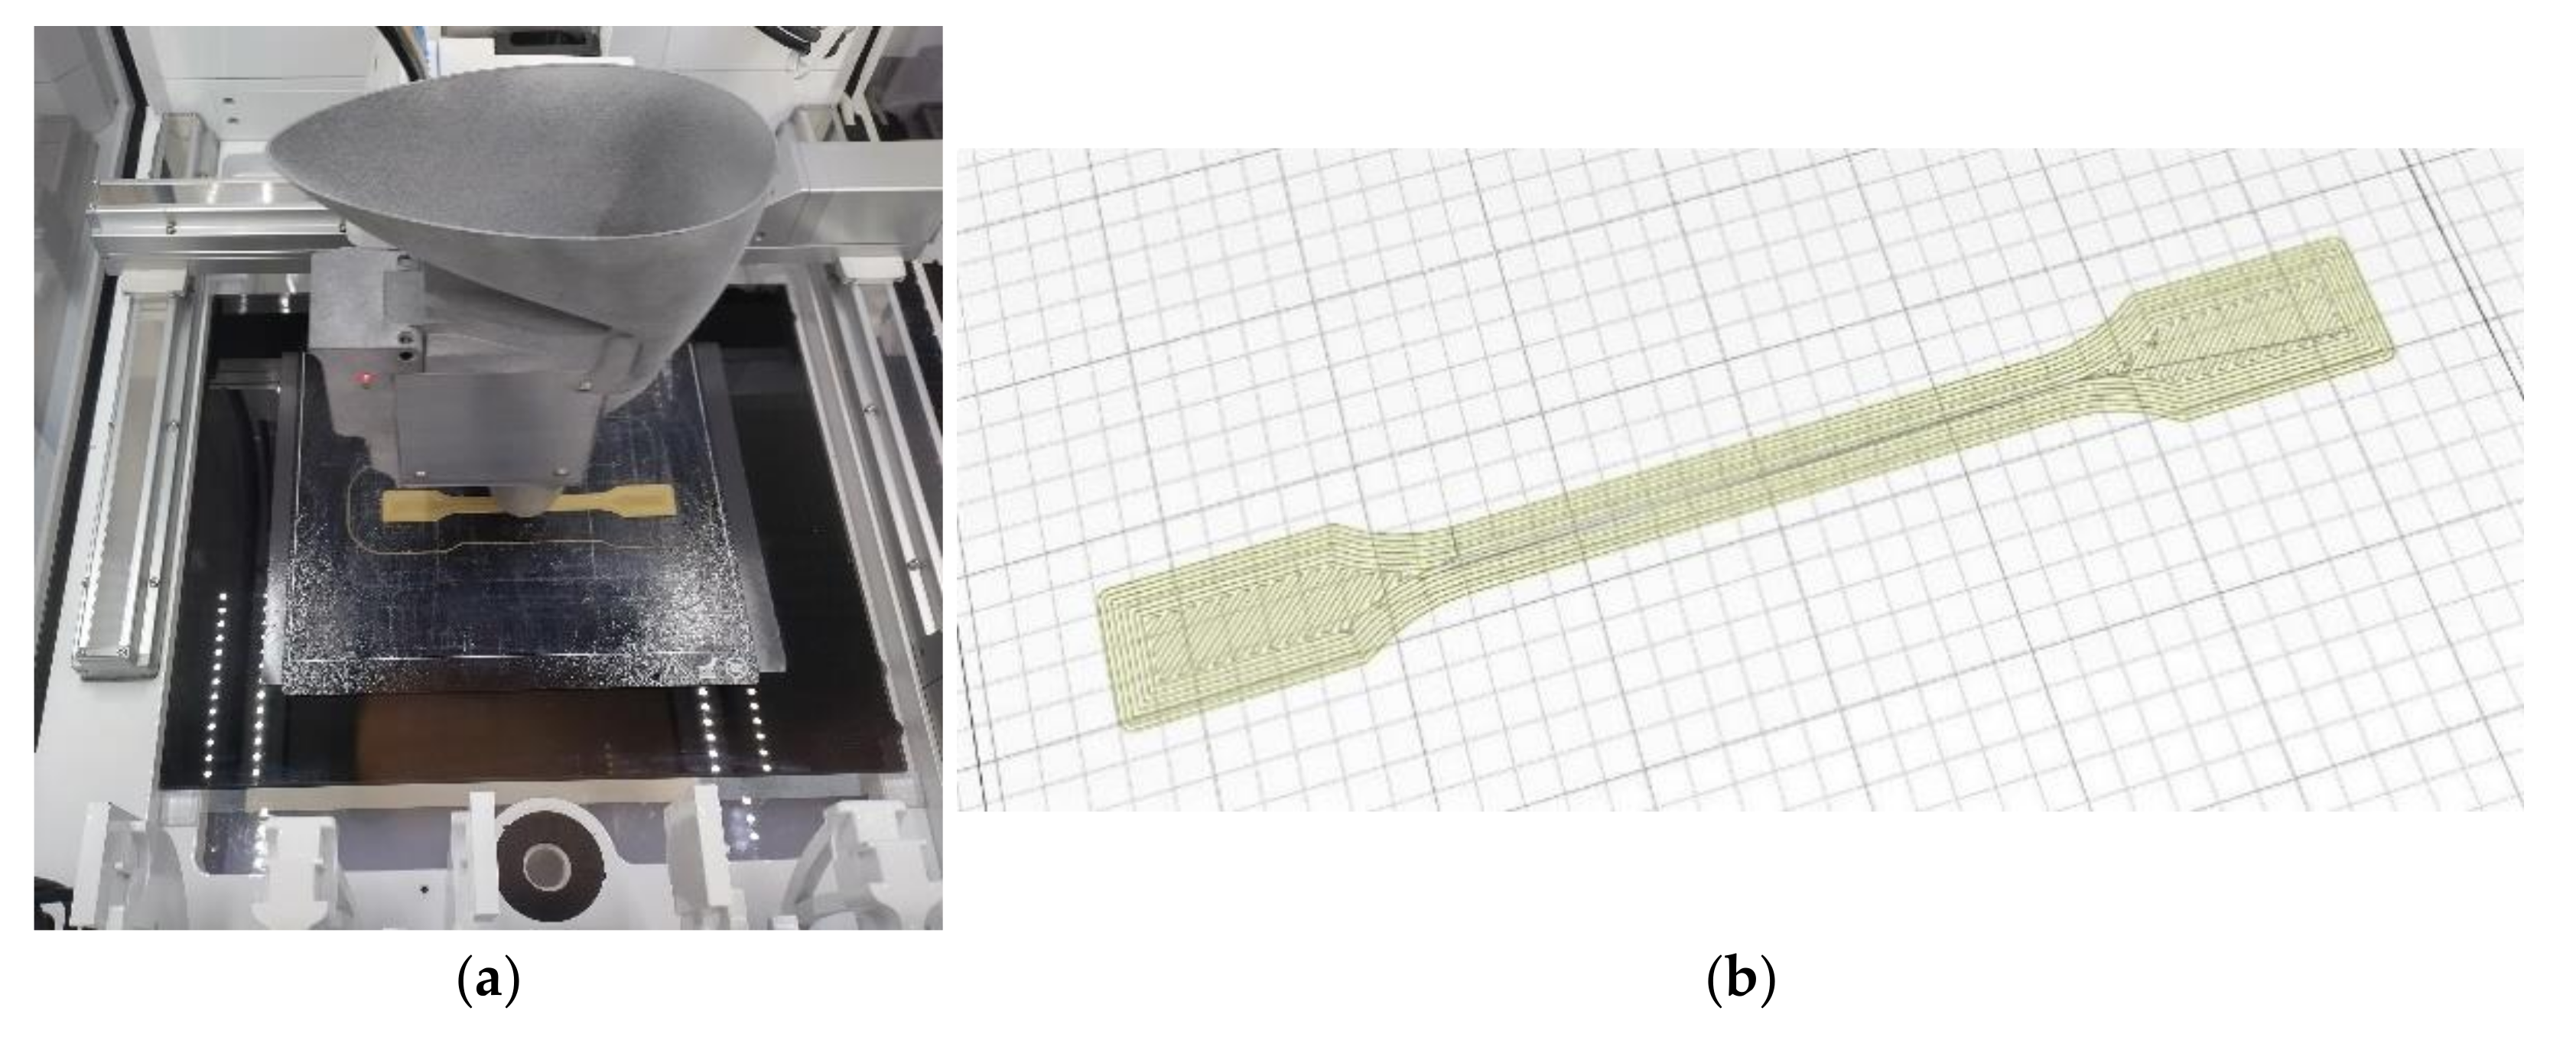
2.2.2. 3D Printing
2.3. Analytics and Testing
2.3.1. Scanning Electron Microscopy (SEM)
2.3.2. Microtomography
2.3.3. Mechanical Testing
2.3.4. Melt Flow Index (MFI)
2.3.5. Heat Distortion Temperature (HDT)
2.3.6. Molar Mass
2.3.7. Fiber Dimensions
3. Results
3.1. Visual Inspection
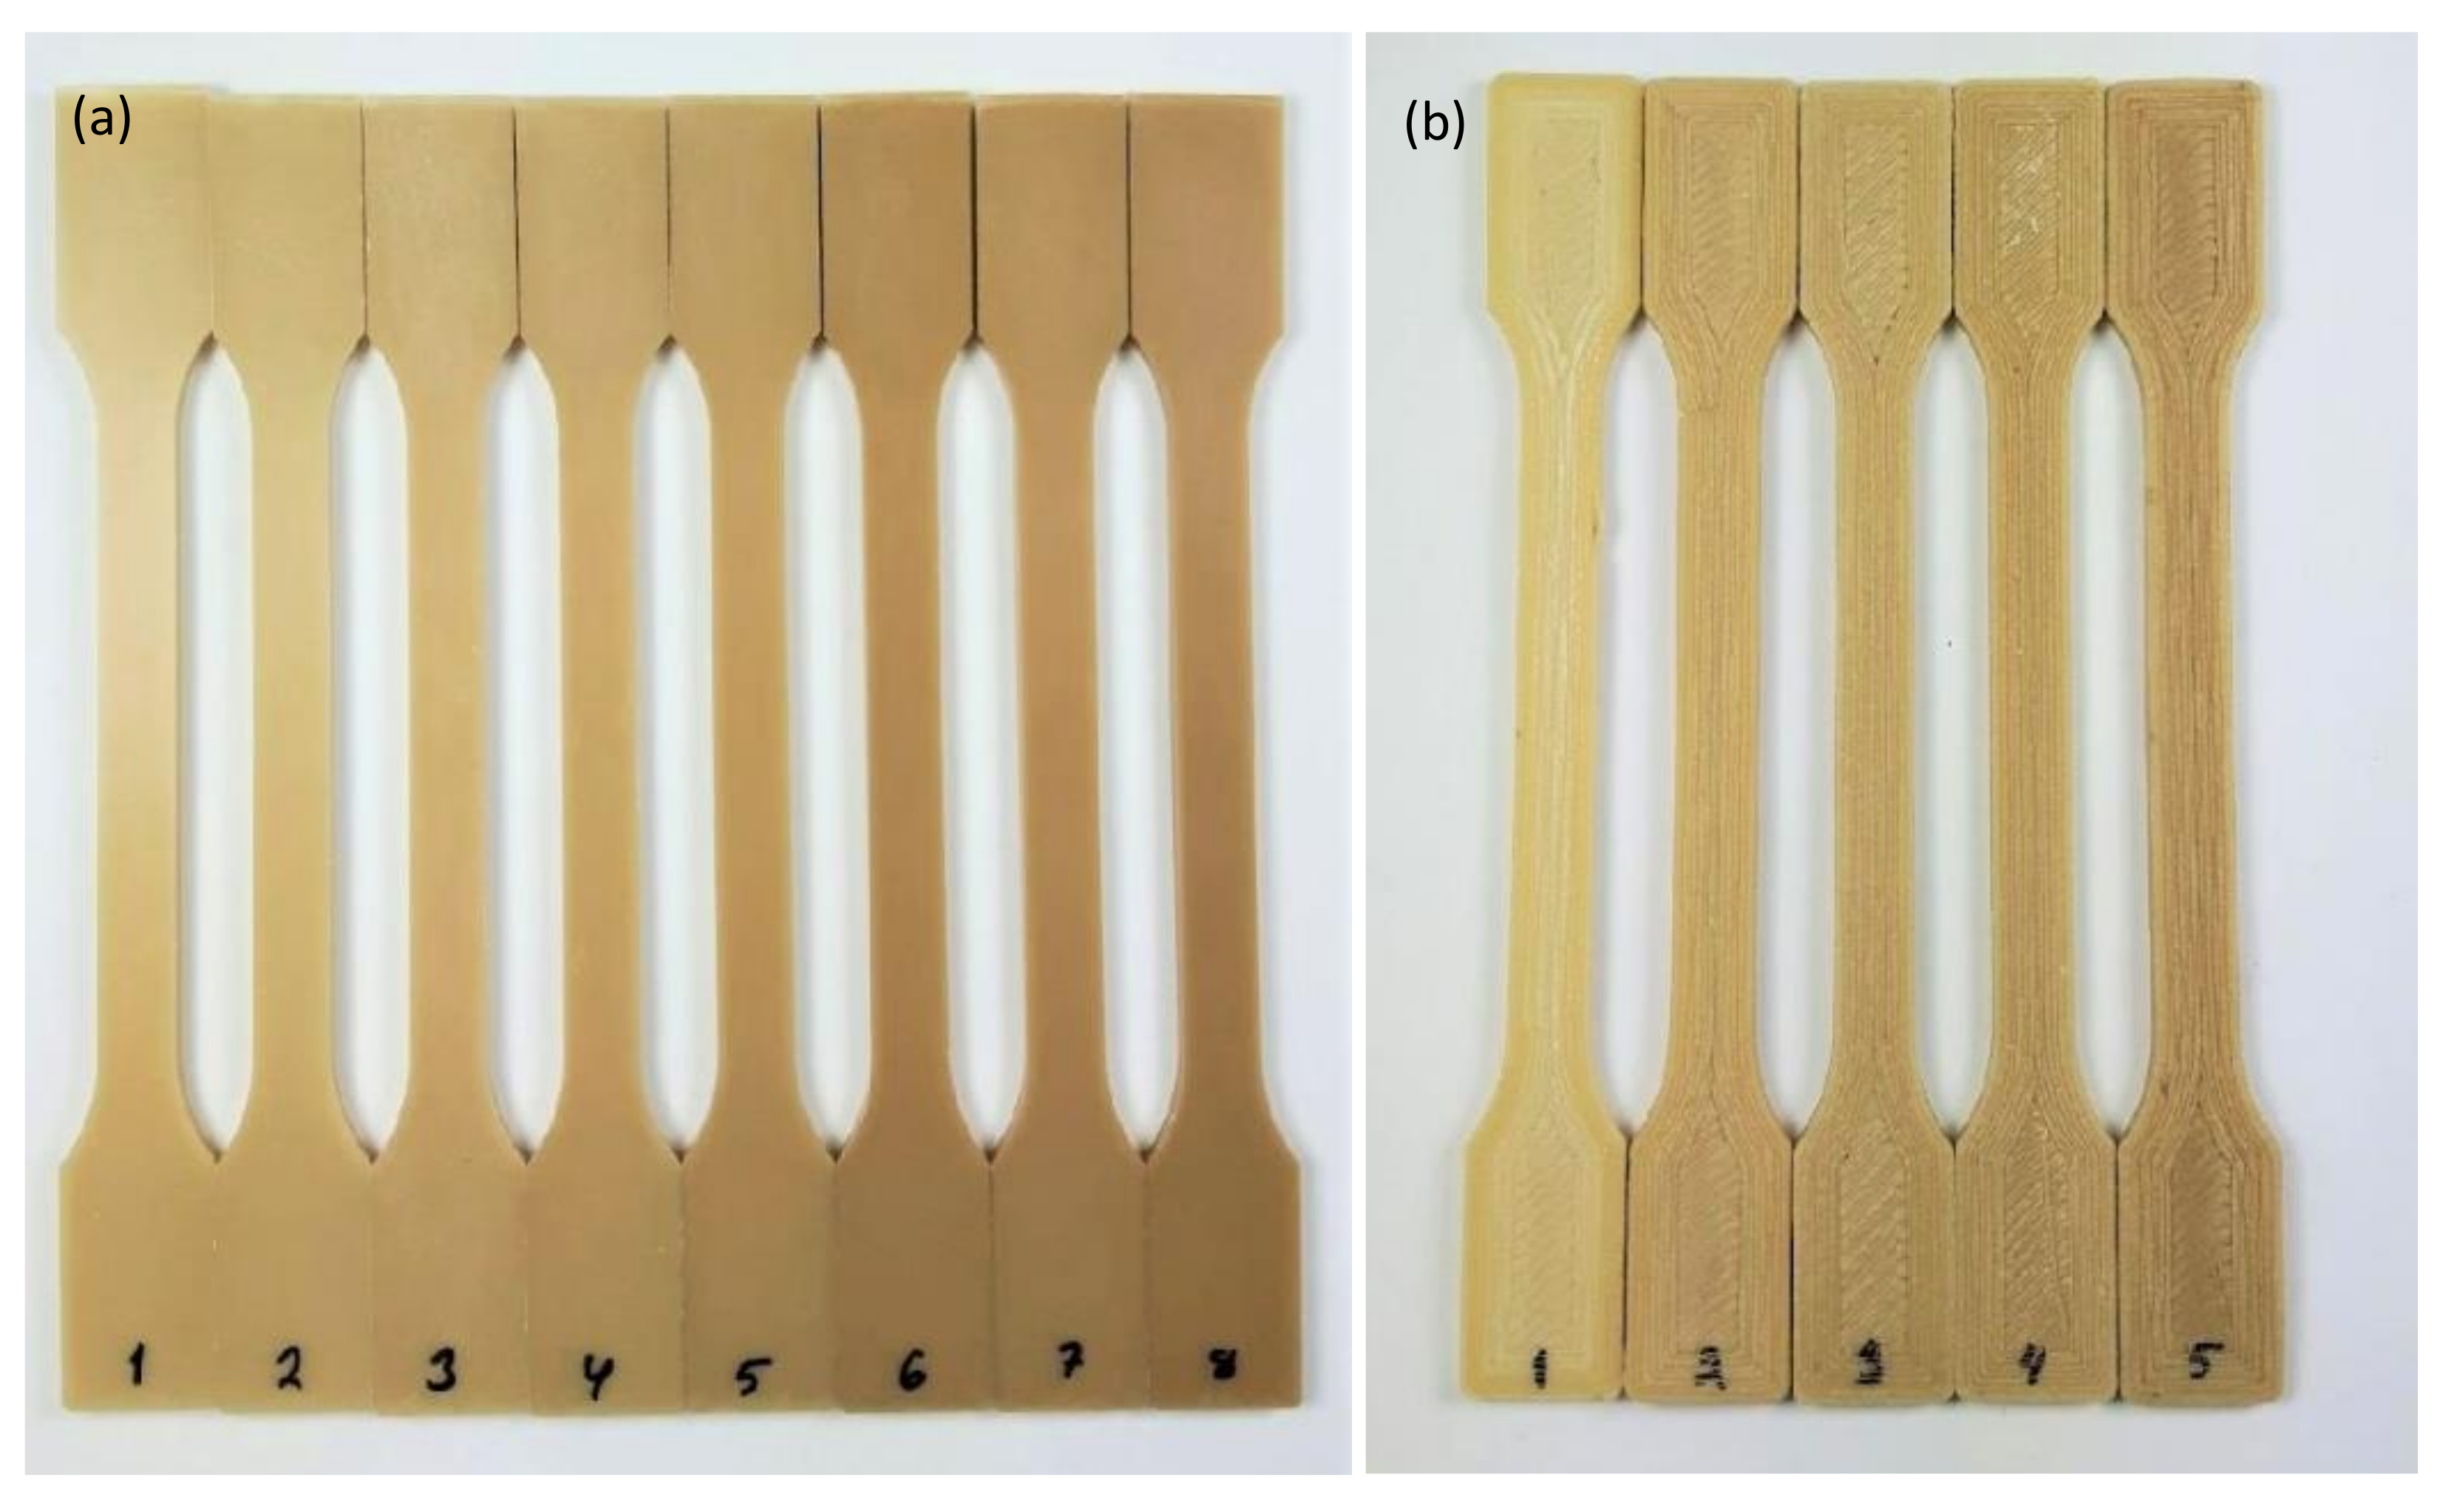
3.1.1. Pictures of the Samples
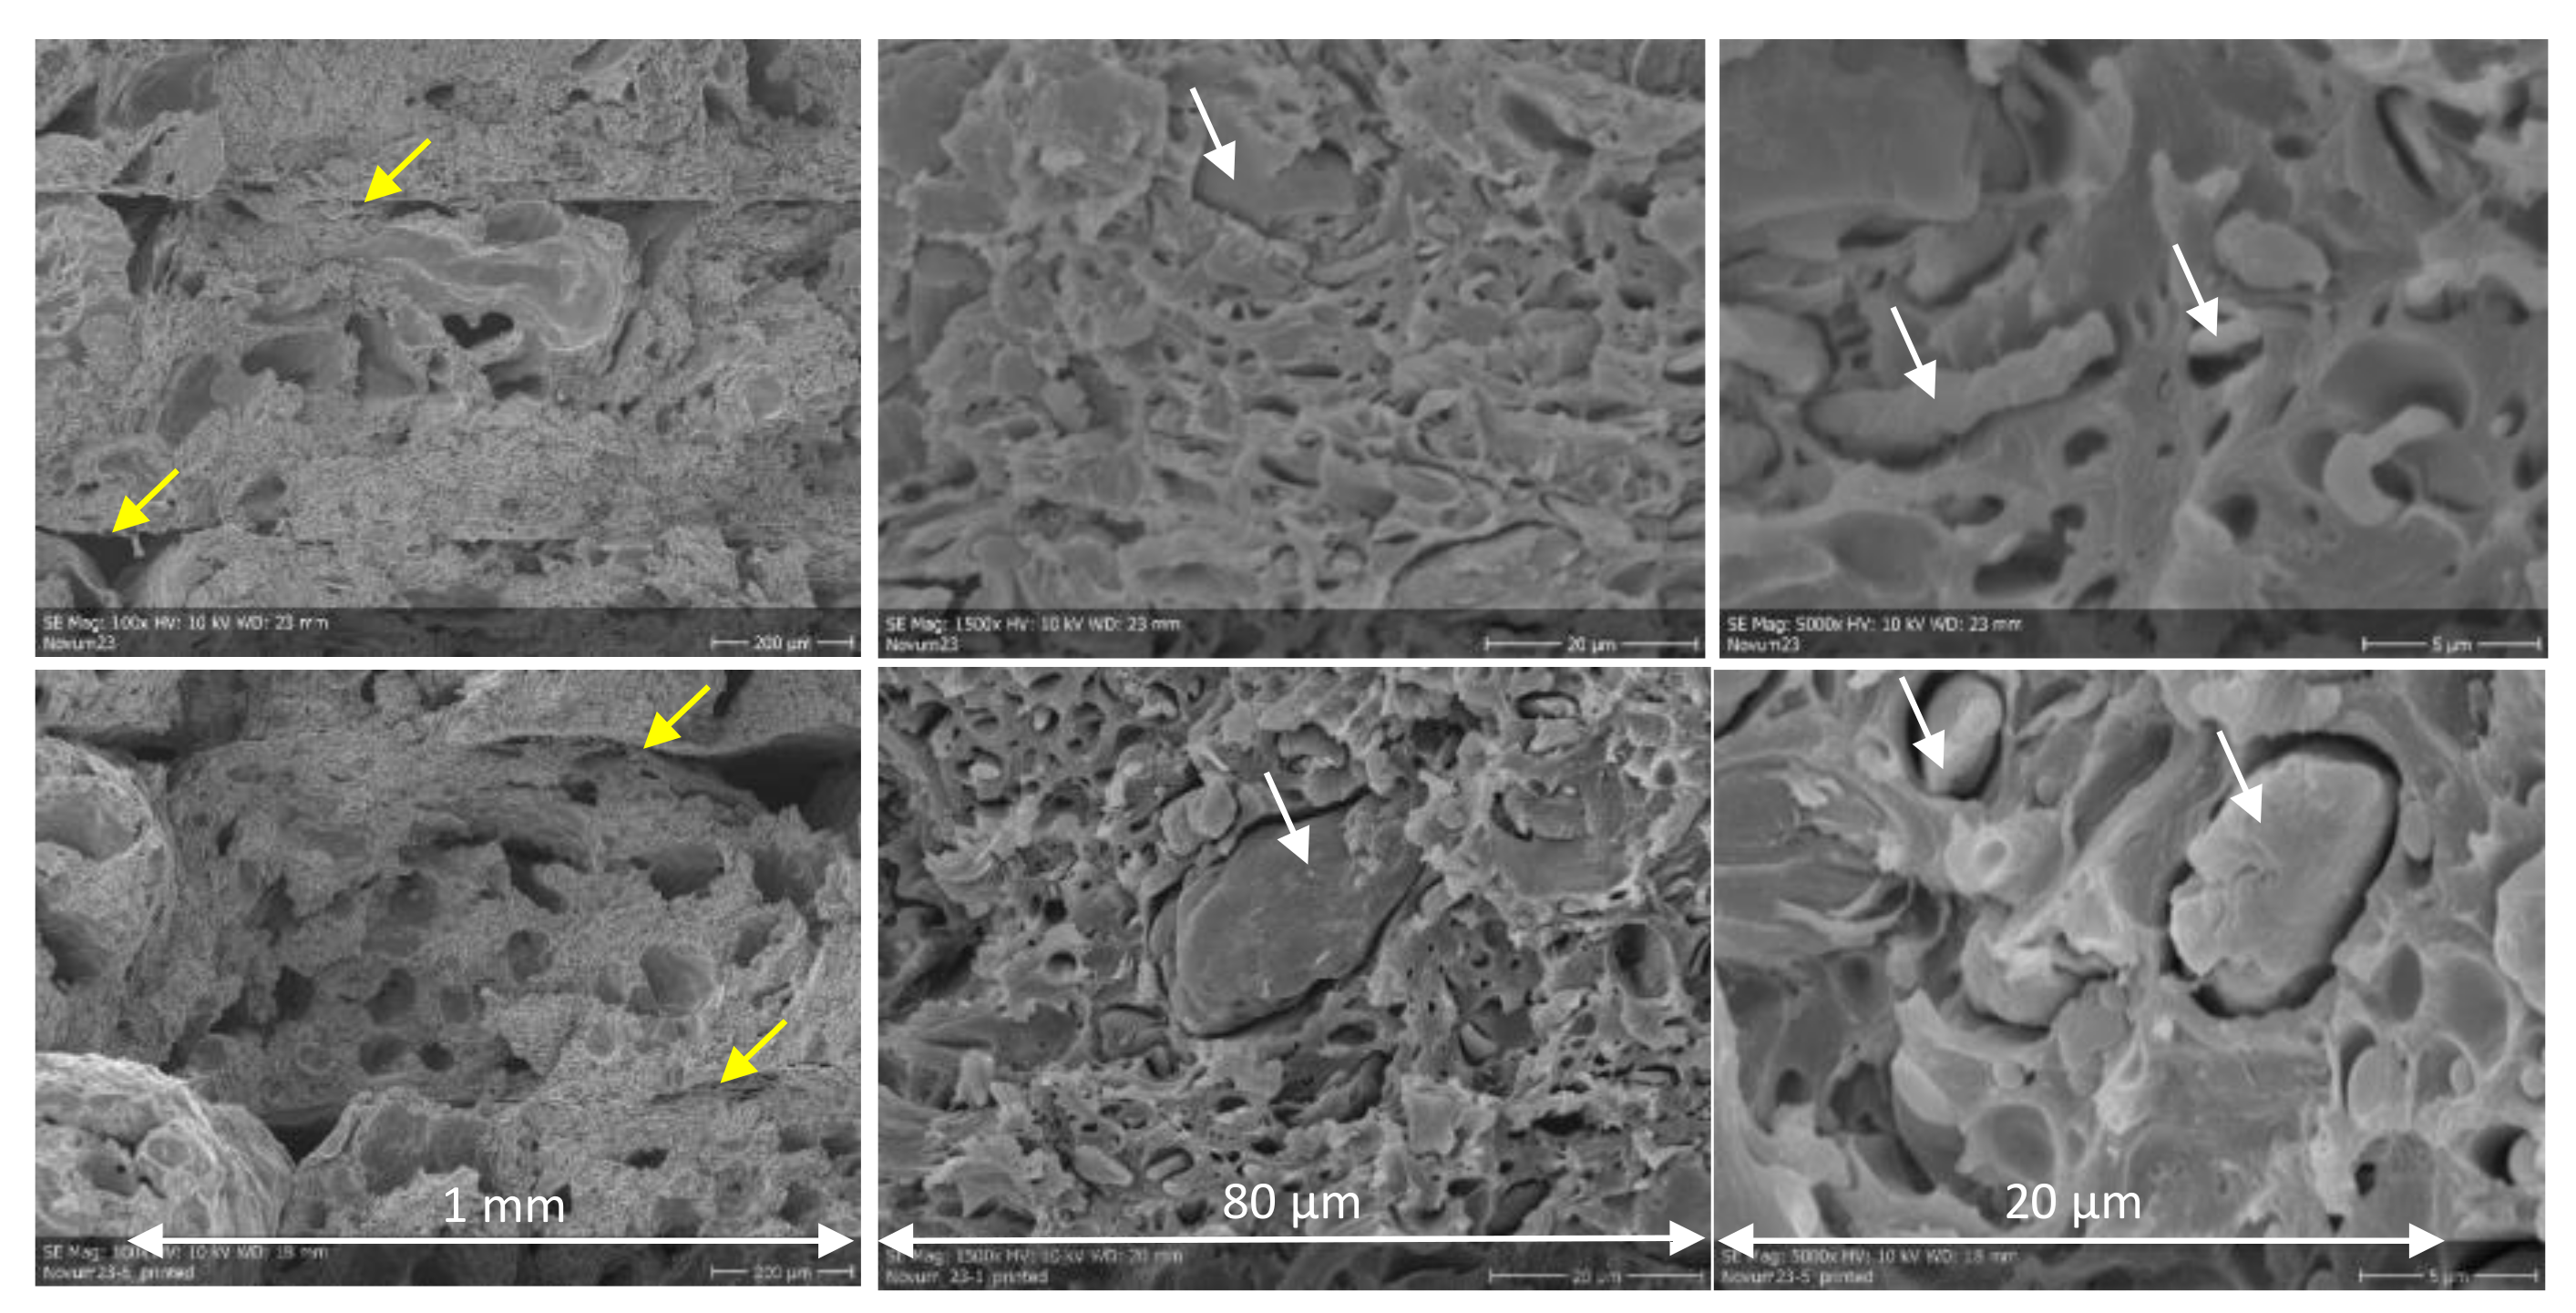
3.1.2. SEM
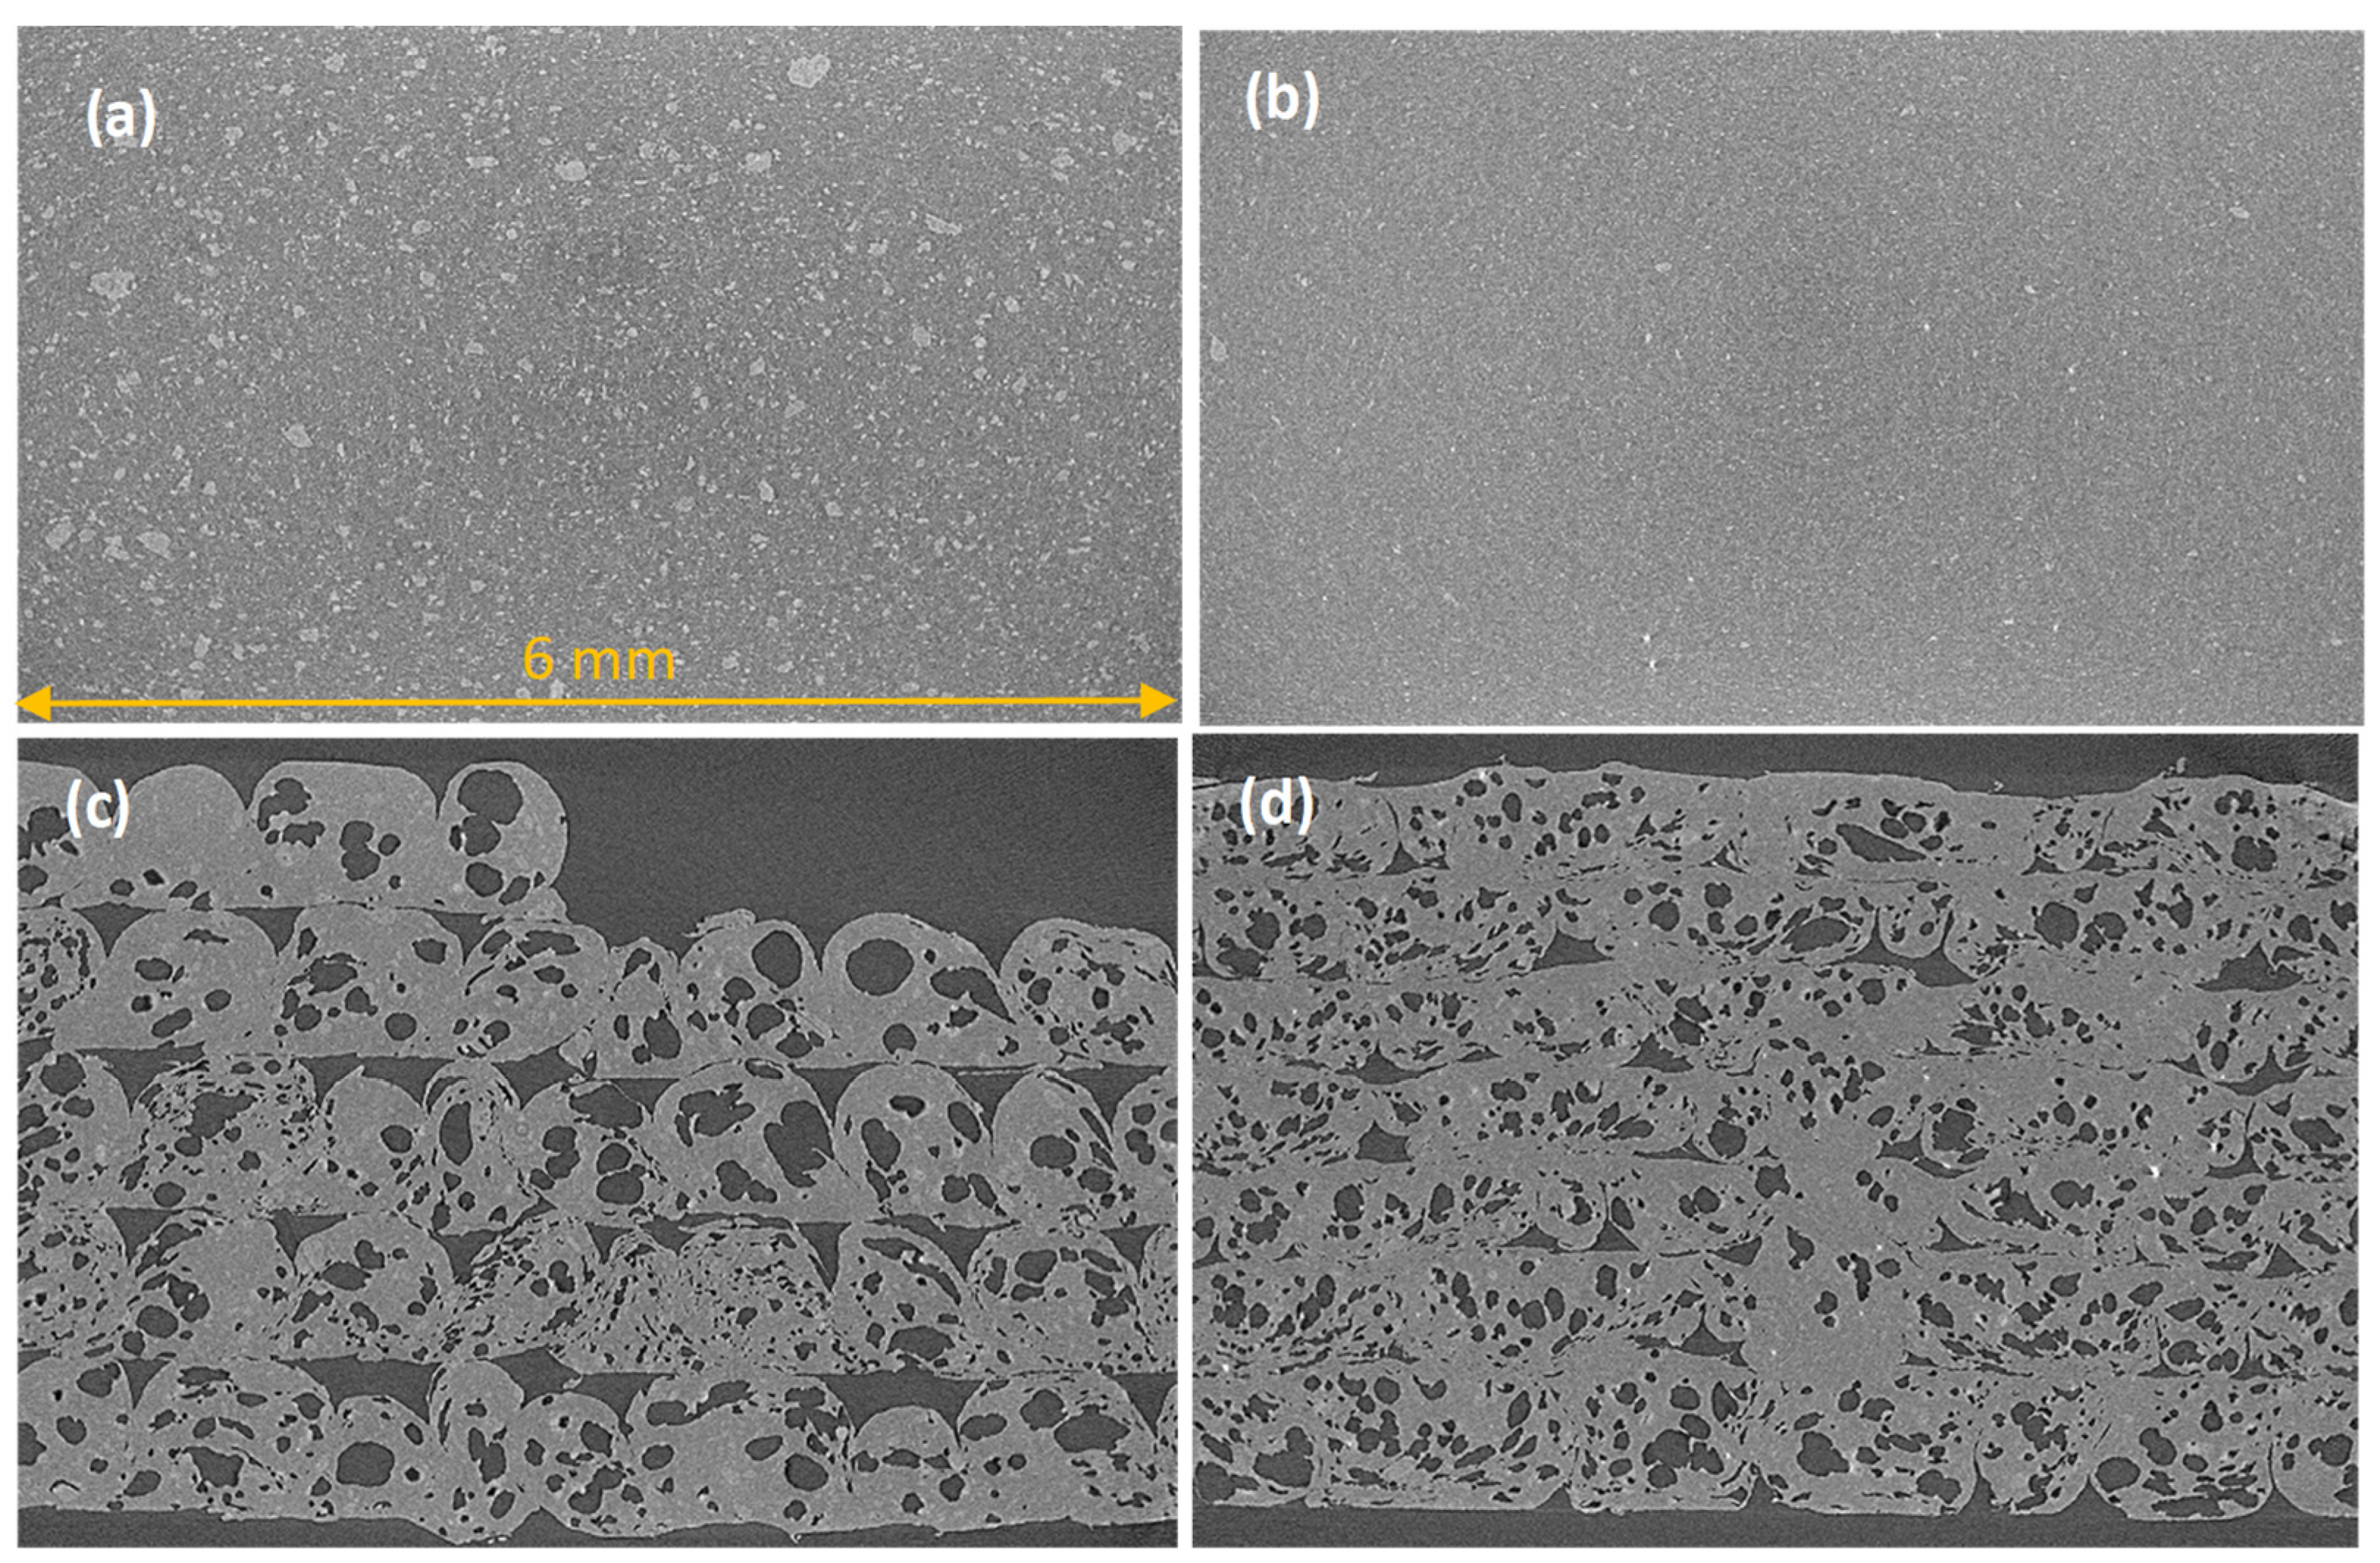
3.1.3. Microtomography
3.2. Fiber and Polymer Analytics
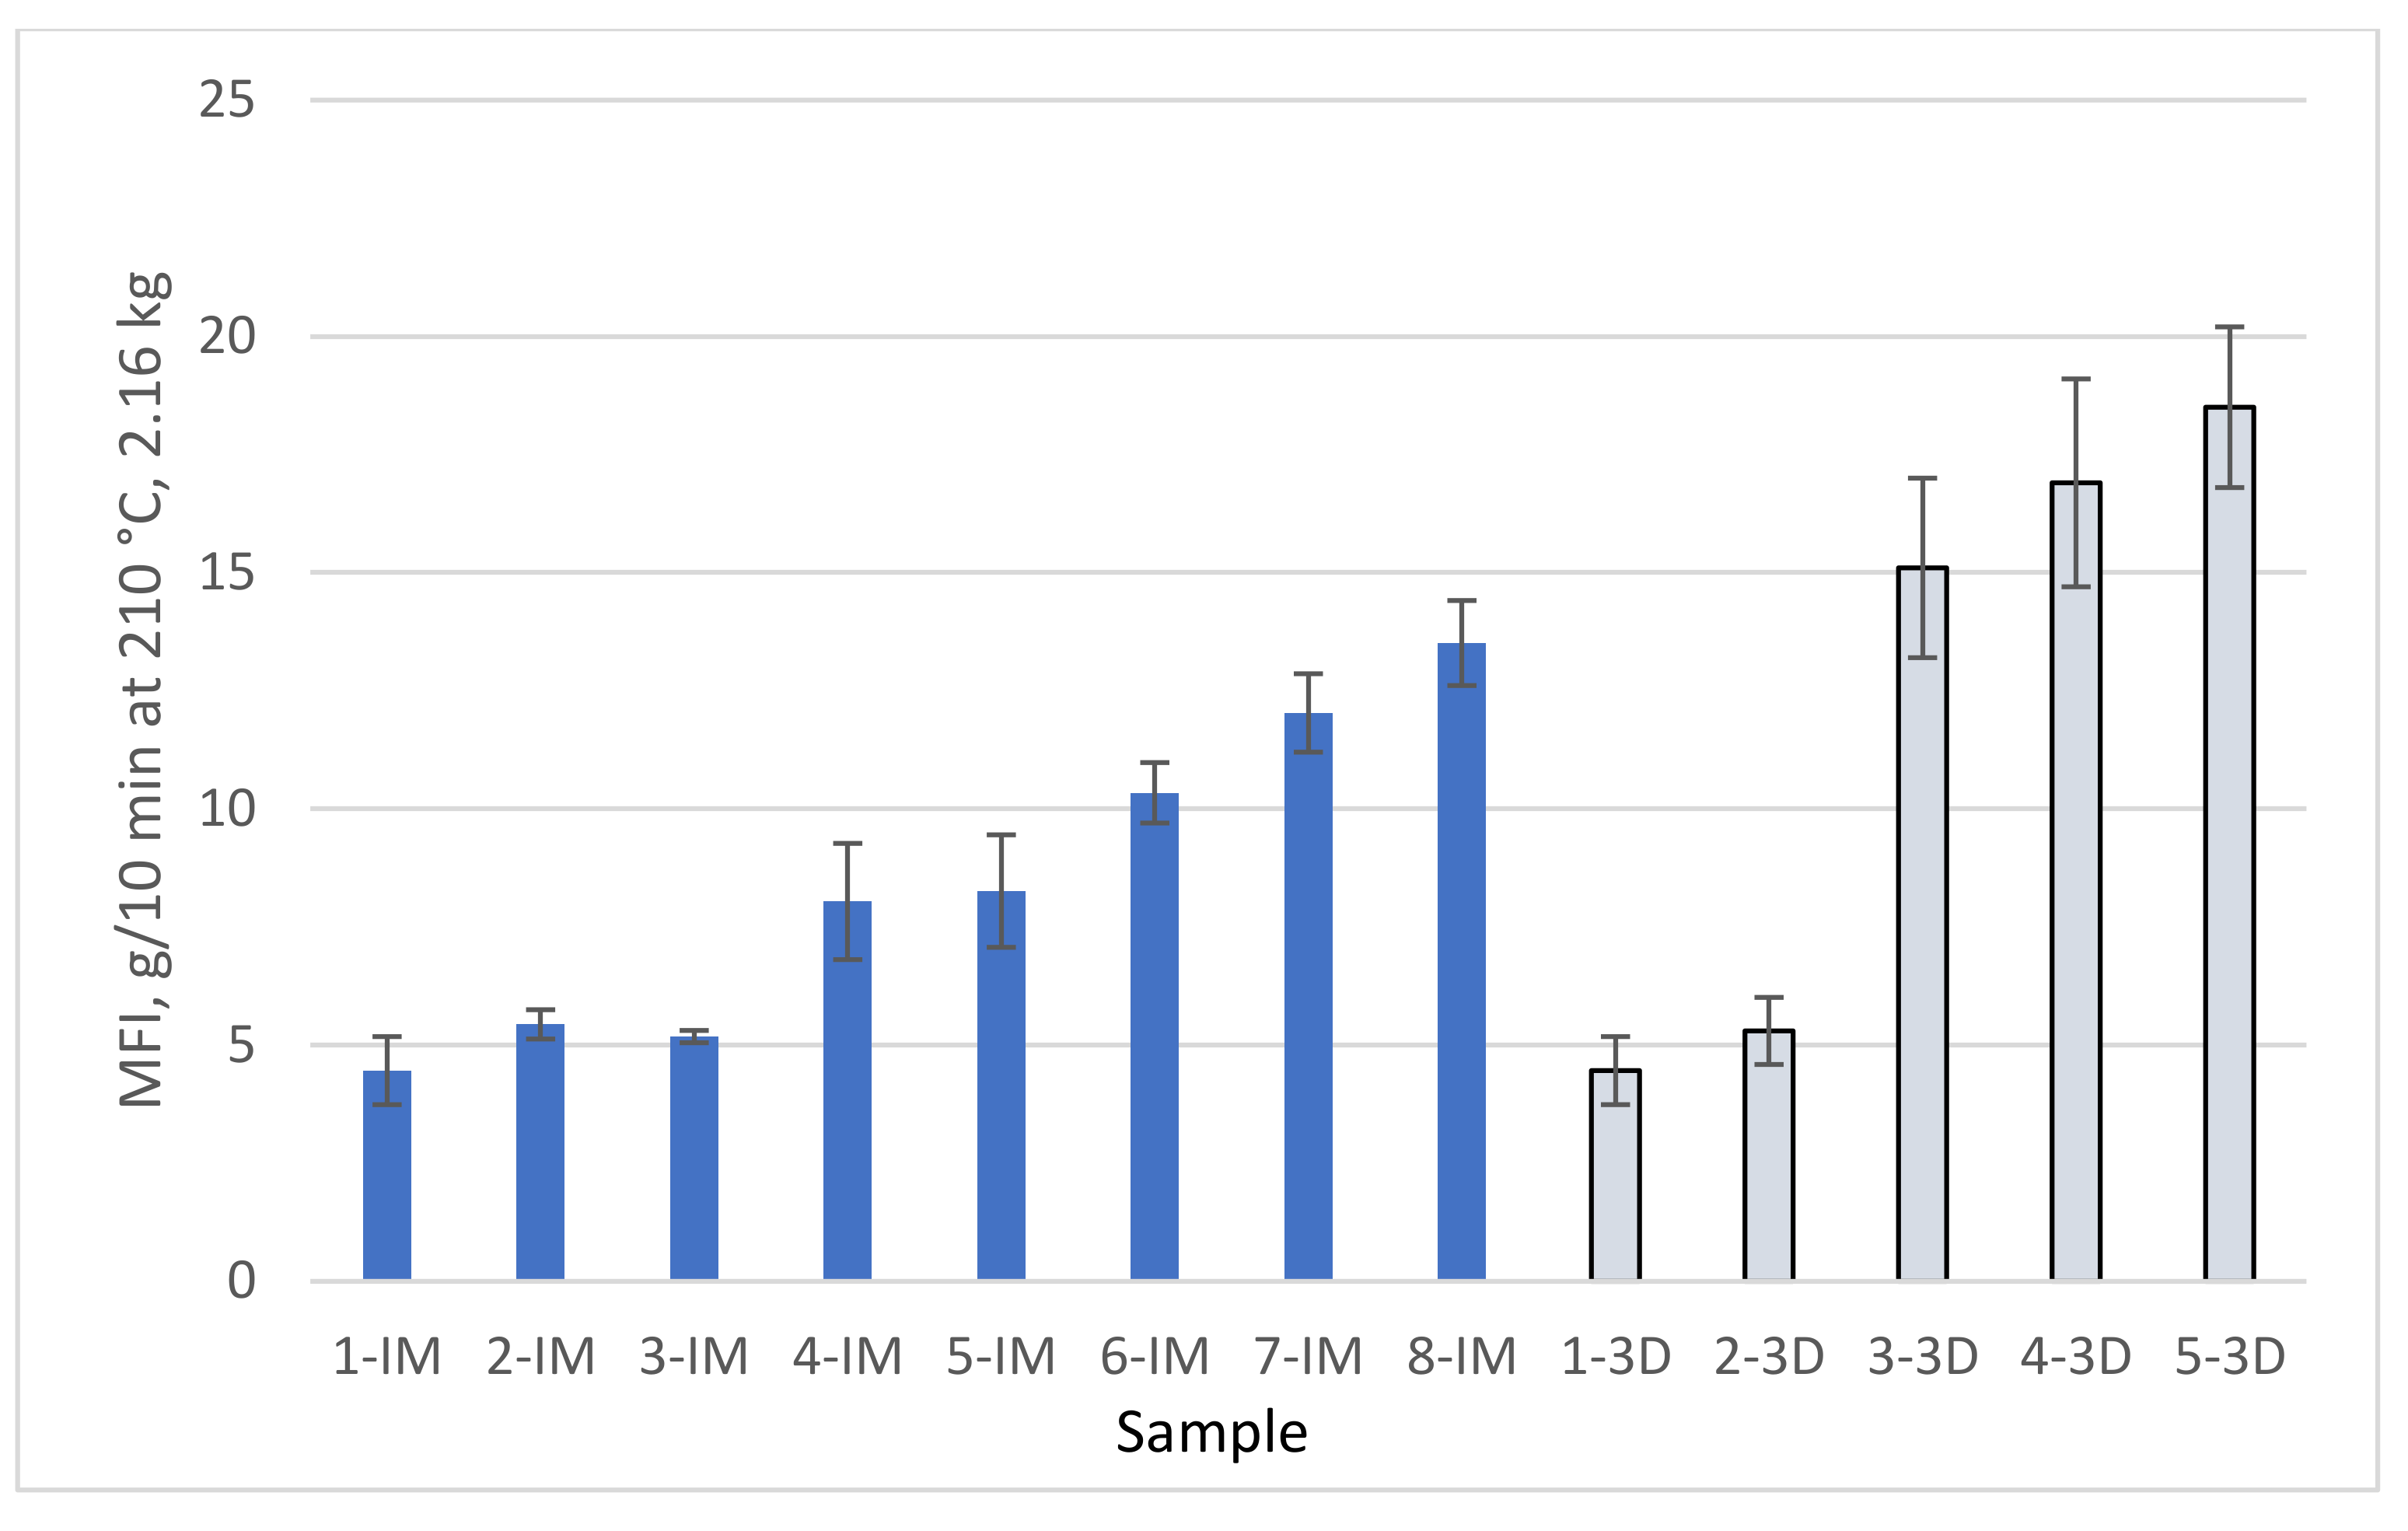
3.2.1. MFI
3.2.2. SEC Results
3.2.3. Particle Size
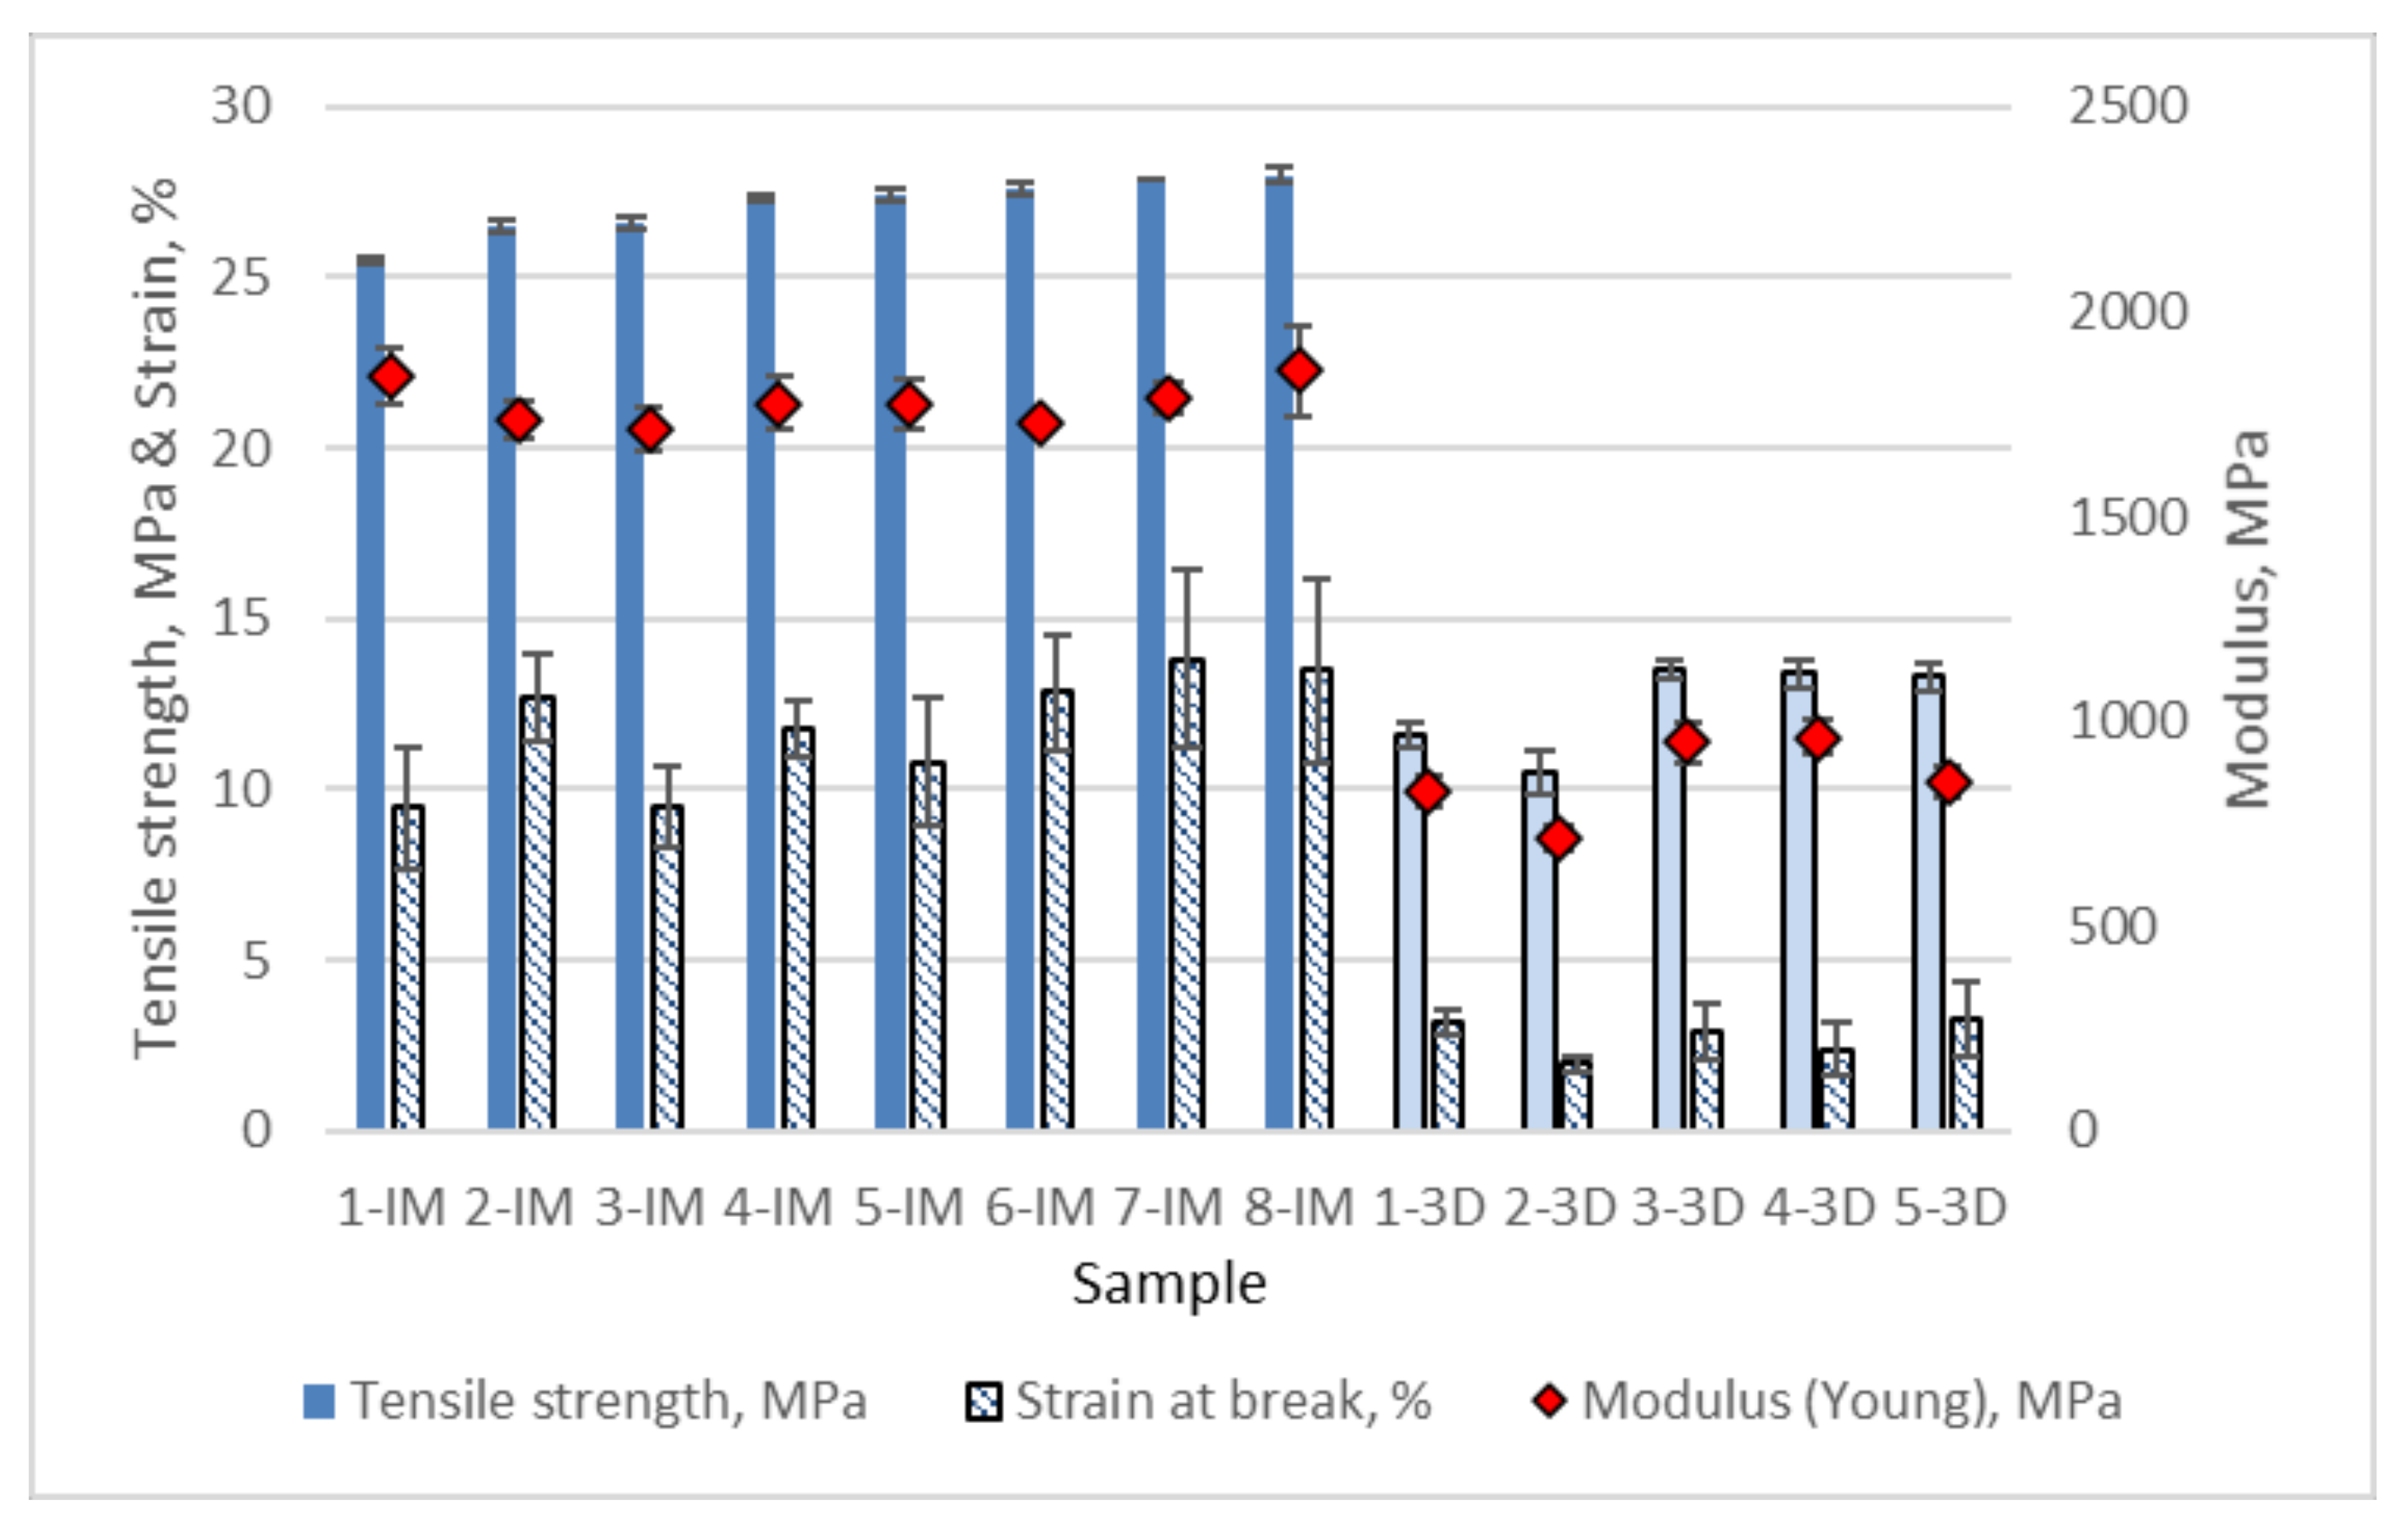
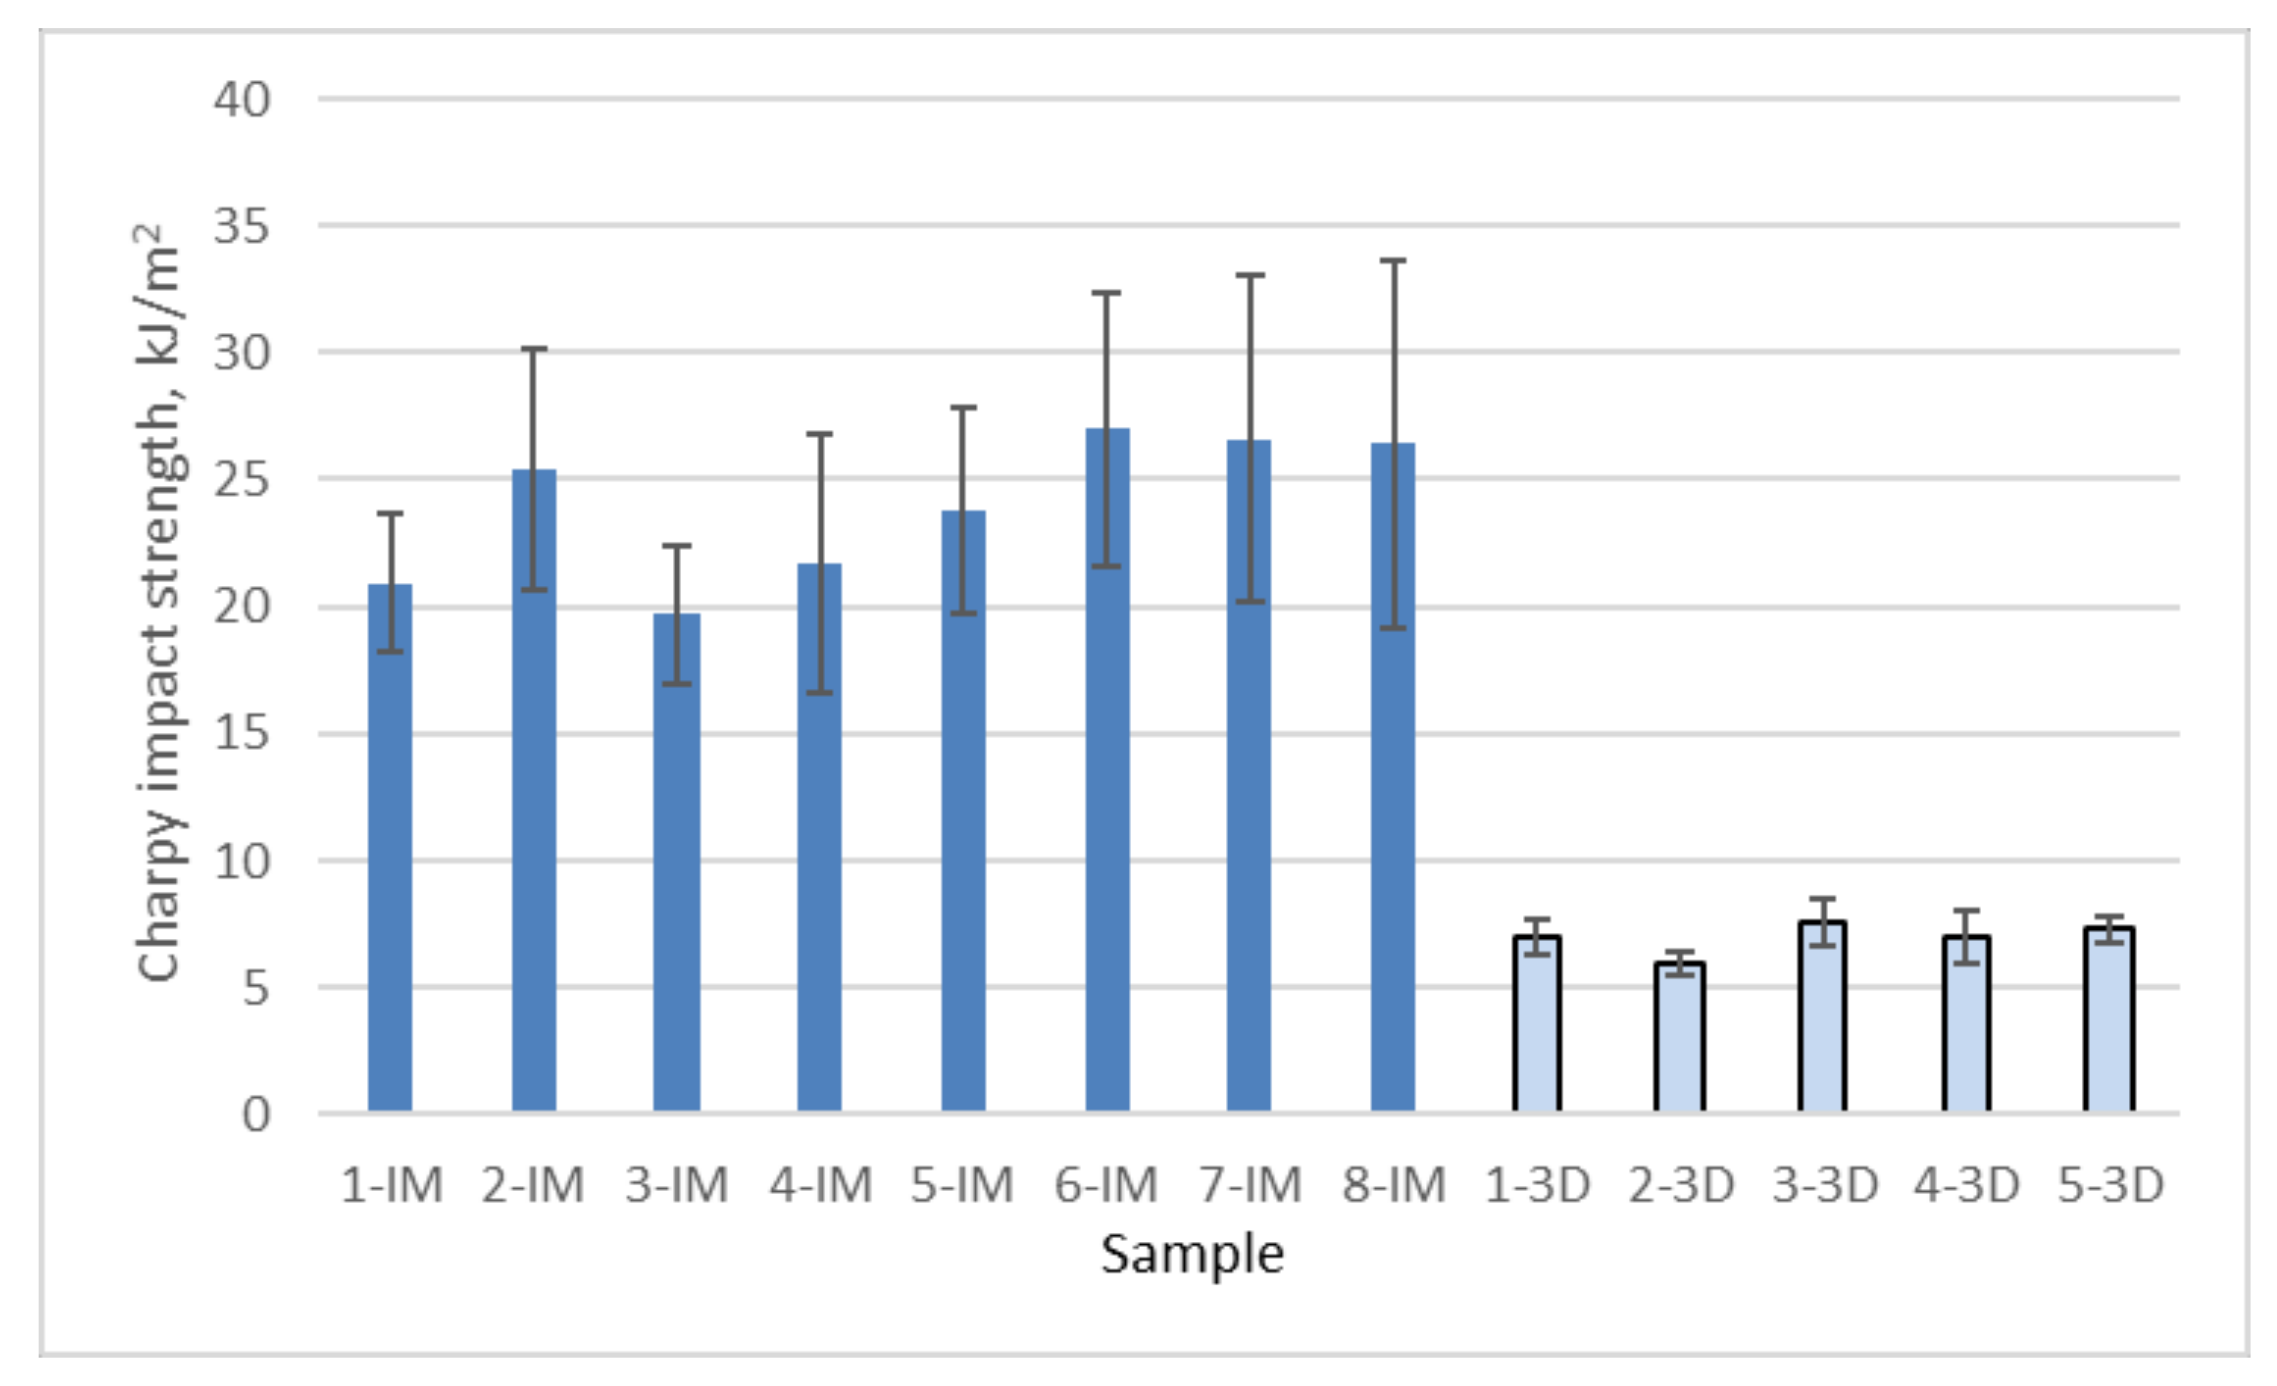
3.3. Mechanical Testing
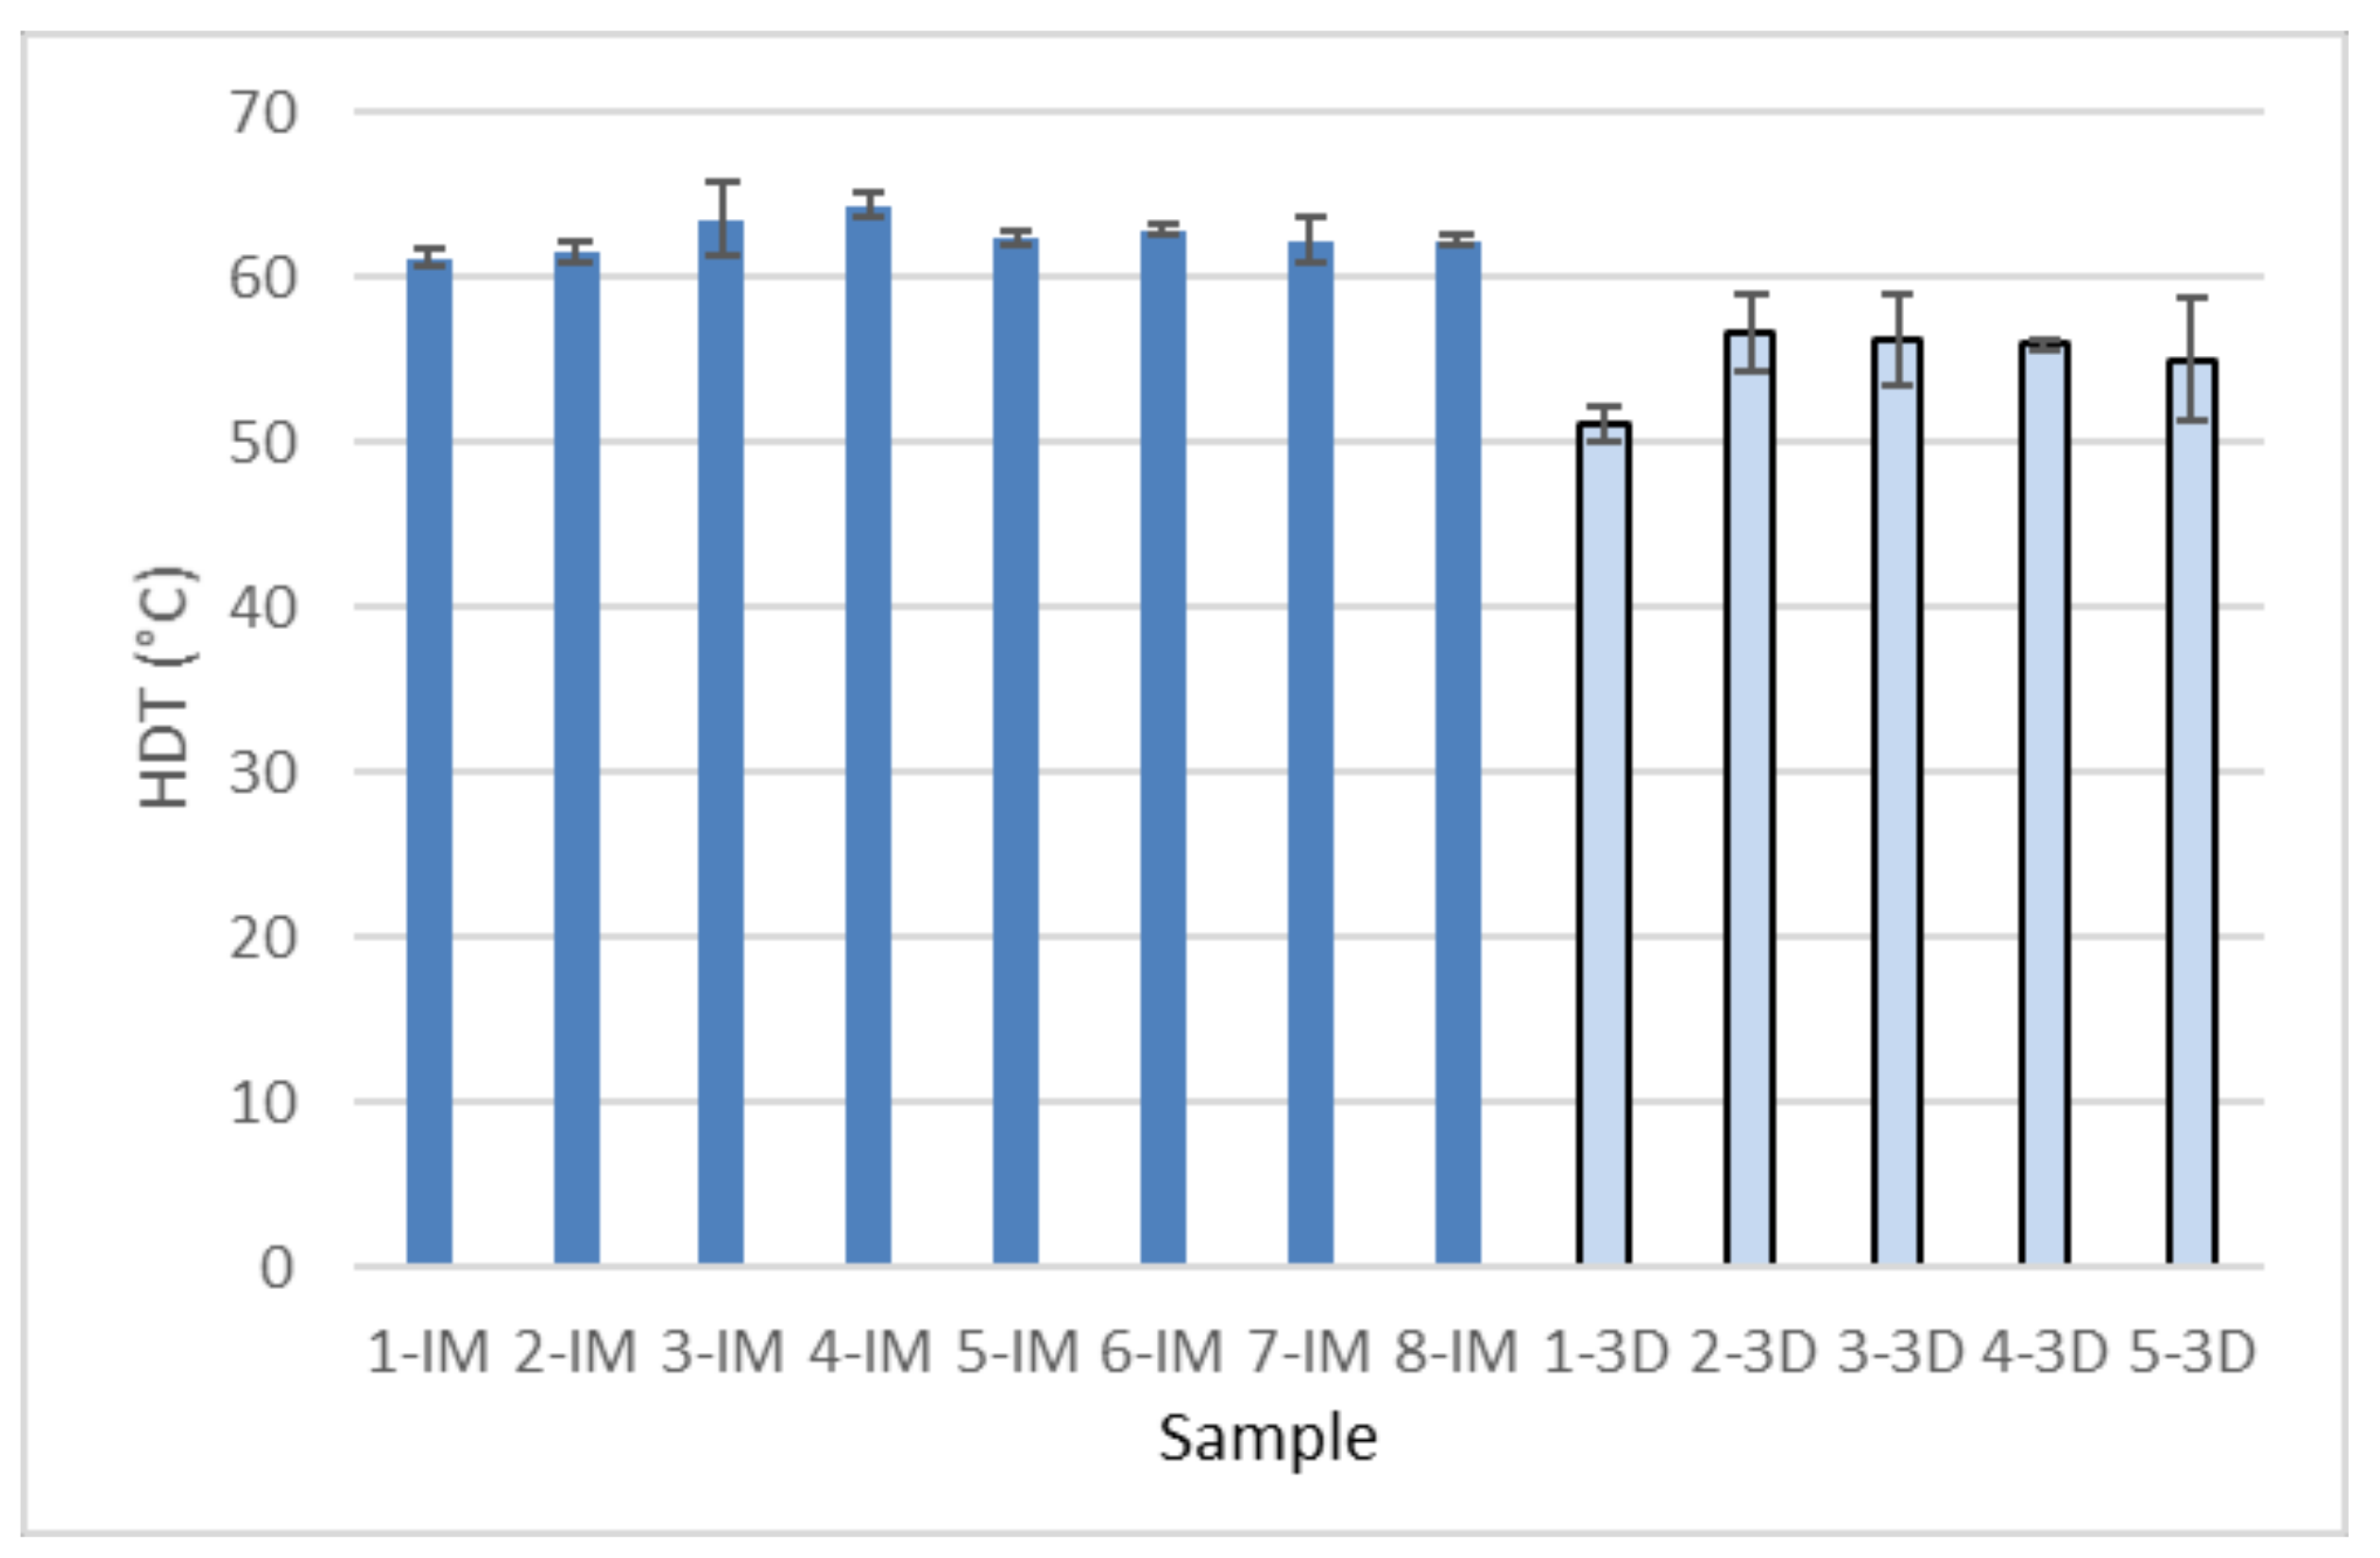
3.4. HDT
4. Discussion
5. Conclusions
Author Contributions
Funding
Institutional Review Board Statement
Informed Consent Statement
Data Availability Statement
Acknowledgments
Conflicts of Interest
References
- Statista. Additive Manufacturing & 3D Printing Worldwide ID 755074; Statista: Hamburg, Germany, 2021. [Google Scholar]
- BCC Research. Global Markets for 3D Printing, Copyrighted Material, All Rights Reserved; BCC Research: Wellesley, MA, USA, 2021. [Google Scholar]
- Kellens, K.; Baumers, M.; Gutowski, T.G.; Flanagan, W.; Lifset, R.; Duflou, J.R. Environmental Dimensions of Additive Manufacturing: Mapping Application Domains and Their Environmental Implications. J. Ind. Ecol. 2017, 21, S49–S68. [Google Scholar] [CrossRef] [Green Version]
- Mikula, K.; Skrzypczak, D.; Izydorczyk, G.; Warchoł, J.; Moustakas, K.; Chojnacka, K.; Witek-Krowiak, A. 3D printing filament as a second life of waste plastics—A review. Environ. Sci. Pollut. Res. 2020, 28, 12321–12333. [Google Scholar] [CrossRef] [PubMed]
- Mohan, D.; Teong, Z.K.; Bakir, A.N.; Sajab, M.S.; Kaco, H. Extending cellulose-based polymers application in additive manufacturing technology: A review of recent approaches. Polymers 2020, 12, 1876. [Google Scholar] [CrossRef] [PubMed]
- Mervine, N.; Brätt, K.; Saloni, D. A Review of Sustainable Materials Used in Thermoplastic Extrusion and Powder Bed Melting Additive Manufacturing. In Advances in Intelligent Systems and Computing, Proceedings of the International Conference on Applied Human Factors and Ergonomics, New York, NY, USA, 24–28 July 2022; Springer: Cham, Switzerland, 2020; Volume 1216 AISC, pp. 95–102. [Google Scholar]
- Jawahir, I.S.; Bradley, R. Technological Elements of Circular Economy and the Principles of 6R-Based Closed-loop Material Flow in Sustainable Manufacturing. Procedia CIRP 2016, 40, 103–108. [Google Scholar] [CrossRef] [Green Version]
- Association of Plastic Recyclers. Life Cycle Impacts For Postconsumer Recycled Resins: PET, HDPE, AND PP; Franklin Associates, A Division of ERG: Washington, DC, USA, 2018; Available online: https://plasticsrecycling.org/images/library/2018-APR-LCI-report.pdf (accessed on 16 December 2021).
- Cruz Sanchez, F.A.; Boudaoud, H.; Camargo, M.; Pearce, J.M. Plastic recycling in additive manufacturing: A systematic literature review and opportunities for the circular economy. J. Clean. Prod. 2020, 264, 121602. [Google Scholar] [CrossRef]
- Cress, A.K.; Huynh, J.; Anderson, E.H.; O’neill, R.; Schneider, Y.; Keleş, Ö. Effect of recycling on the mechanical behavior and structure of additively manufactured acrylonitrile butadiene styrene (ABS). J. Clean. Prod. 2021, 279, 123689. [Google Scholar] [CrossRef]
- Vidakis, N.; Petousis, M.; Tzounis, L.; Grammatikos, S.A.; Porfyrakis, E.; Maniadi, A.; Mountakis, N. Sustainable additive manufacturing: Mechanical response of polyethylene terephthalate glycol over multiple recycling processes. Materials 2021, 14, 1162. [Google Scholar] [CrossRef] [PubMed]
- Vidakis, N.; Petousis, M.; Tzounis, L.; Maniadi, A.; Velidakis, E.; Mountakis, N.; Kechagias, J.D. Sustainable additive manufacturing: Mechanical response of polyamide 12 over multiple recycling processes. Materials 2021, 14, 466. [Google Scholar] [CrossRef] [PubMed]
- Vidakis, N.; Petousis, M.; Tzounis, L.; Maniadi, A.; Velidakis, E.; Mountakis, N.; Papageorgiou, D.; Liebscher, M.; Mechtcherine, V. Sustainable additive manufacturing: Mechanical response of polypropylene over multiple recycling processes. Sustainability 2021, 13, 159. [Google Scholar] [CrossRef]
- Spoerk, M.; Arbeiter, F.; Raguž, I.; Holzer, C.; Gonzalez-Gutierrez, J. Mechanical Recyclability of Polypropylene Composites Produced by Material Extrusion-Based Additive Manufacturing. Polymers 2019, 11, 1318. [Google Scholar] [CrossRef] [Green Version]
- Cruz Sanchez, F.A.; Boudaoud, H.; Hoppe, S.; Camargo, M. Polymer recycling in an open-source additive manufacturing context: Mechanical issues. Addit. Manuf. 2017, 17, 87–105. [Google Scholar] [CrossRef]
- Fazita, M.R.N.; Jayaraman, K.; Bhattacharyya, D.; Hossain, M.S.; Haafiz, M.K.M.; Abdul Khalil, H.P.S. Disposal Options of Bamboo Fabric-Reinforced Poly(Lactic) Acid Composites for Sustainable Packaging: Biodegradability and Recyclability. Polymers 2015, 7, 1476–1496. [Google Scholar] [CrossRef] [Green Version]
- Chaitanya, S.; Singh, I.; Song, J. Il Recyclability analysis of PLA/Sisal fiber biocomposites. Compos. Part B Eng. 2019, 173, 106895. [Google Scholar] [CrossRef]
- Åkesson, D.; Fazelinejad, S.; Skrifvars, V.V.; Skrifvars, M. Mechanical recycling of polylactic acid composites reinforced with wood fibres by multiple extrusion and hydrothermal ageing. J. Reinf. Plast. Compos. 2016, 35, 1248–1259. [Google Scholar] [CrossRef]
- Properties and Applications of Cellulose Propionate (CP). Available online: https://www.azom.com/article.aspx?ArticleID=389 (accessed on 16 December 2021).
- CELLULOSIC PLASTICS. Available online: https://powerplasticrecycling.com/cellulosic-plastics/ (accessed on 16 December 2021).
- Hunt, E.J.; Zhang, C.; Anzalone, N.; Pearce, J.M. Polymer recycling codes for distributed manufacturing with 3-D printers. Resour. Conserv. Recycl. 2015, 97, 24–30. [Google Scholar] [CrossRef]
- Recycling Codes. Available online: https://en.wikipedia.org/wiki/Recycling_codes (accessed on 16 December 2021).
- Mohanty, A.K.; Wibowo, A.; Misra, M.; Drzal, L.T. Development of renewable resource–based cellulose acetate bioplastic: Effect of process engineering on the performance of cellulosic plastics. Polym. Eng. Sci. 2003, 43, 1151–1161. [Google Scholar] [CrossRef]
- Immonen, K.; Willberg-Keyriläinen, P.; Ropponen, J.; Nurmela, A.; Metsä-Kortelainen, S.; Kaukoniemi, O.V.; Kangas, H. Thermoplastic Cellulose-Based Compound for Additive Manufacturing. Molecules 2021, 26, 1701. [Google Scholar] [CrossRef]
- Albis Plastics GmbH Material Data Center Datasheet for Cellidor CP300-13. Available online: https://www.materialdatacenter.com/ms/en/Cellidor/ALBIS+PLASTIC+GmbH/10 (accessed on 16 December 2021).
- Willberg-Keyriläinen, P.; Talja, R.; Asikainen, S.; Harlin, A.; Ropponen, J. The effect of cellulose molar mass on the properties of palmitate esters. Carbohydr. Polym. 2016, 151, 988–995. [Google Scholar] [CrossRef]
- Vanhatalo, K.; Maximova, N.; Perander, A.M.; Johansson, L.S.; Haimi, E.; Dahl, O. Comparison of conventional and lignin-rich microcrystalline cellulose. BioResources 2016, 11, 4037–4054. [Google Scholar] [CrossRef] [Green Version]
- Virtanen, S.; Wikström, L.; Immonen, K.; Anttila, U.; Retulainen, E.; Virtanen, S.; Wikström, L.; Immonen, K.; Anttila, U.; Retulainen, E. Cellulose kraft pulp reinforced polylactic acid (PLA) composites: Effect of fibre moisture content. AIMS Mater. Sci. 2016, 3, 756–769. [Google Scholar] [CrossRef]
- Innofil PLA by Innofil3D, BV. Available online: https://www.3d-tulostus.fi/WebRoot/vilkas04/Shops/20131018-11092-264846-1/5C8B/826C/D5D6/09A3/AD95/0A28/1011/7CA4/TDS_EN_Innofil3D_PLA.pdf (accessed on 22 December 2021).
- Ultimaker Technical Data Sheet PLA. Available online: https://support.ultimaker.com/hc/en-us/articles/360011962720 (accessed on 22 December 2021).
- Wang, S.; Capoen, L.; D’hooge, D.R.; Cardon, L. Can the melt flow index be used to predict the success of fused deposition modelling of commercial poly(lactic acid) filaments into 3D printed materials? Plast. Rubber Compos. 2017, 47, 9–16. [Google Scholar] [CrossRef]
- Sepe, M. Melt Flow Rate Testing—Part 1 Plastics Technology. Available online: https://www.ptonline.com/articles/melt-flow-rate-testingpart-1 (accessed on 22 December 2021).
- Zandi, M.D.; Jerez-Mesa, R.; Lluma-Fuentes, J.; Jorba-Peiro, J.; Travieso-Rodriguez, J.A. Study of the manufacturing process effects of fused filament fabrication and injection molding on tensile properties of composite PLA-wood parts. Int. J. Adv. Manuf. Technol. 2020, 108, 1725–1735. [Google Scholar] [CrossRef]
- Xiao, X.; Chevali, V.S.; Song, P.; He, D.; Wang, H. Polylactide/hemp hurd biocomposite as sustainable 3D printing feedstock. Compos. Sci. Technol. 2019, 184, 107887. [Google Scholar] [CrossRef]
- Rimašauskas, M.; Jasiūnienė, E.; Kuncius, T.; Rimašauskienė, R.; Cicėnas, V. Investigation of influence of printing parameters on the quality of 3D printed composite structures. Compos. Struct. 2022, 281, 115061. [Google Scholar] [CrossRef]
- Rajpurohit, S.R.; Dave, H.K. Effect of process parameters on tensile strength of FDM printed PLA part. Rapid Prototyp. J. 2018, 24, 1317–1324. [Google Scholar] [CrossRef]


| Parameter | Value |
|---|---|
| Nozzle diameter, mm | 0.8 |
| Printing temperature, °C | 215 |
| Layer height, mm | 1st layer 0.8, other layers 0.8 in the 1st and 2nd prints, 0.5 in the 3rd, 4th and 5th prints |
| Shell count | 5 in the 1st and 2nd prints, 7 in the 3rd, 4th and 5th prints solid infill (angle 45°), overlap 0.33 |
| Extrusion factor | 1.1× |
| Z offset, mm | −0.2 |
| Sample | Mw, g/mol | Mn, 1/mol | Đ, - |
|---|---|---|---|
| 1-IM | 202,847 | 88,357 | 2.3 |
| 2-IM | 218,305 | 109,073 | 2.0 |
| 3-IM | 198,606 | 86,907 | 2.3 |
| 4-IM | 206,036 | 88,598 | 2.3 |
| 5-IM | 206,135 | 91,882 | 2.2 |
| 6-IM | 200,255 | 88,358 | 2.3 |
| 7-IM | 205,681 | 92,140 | 2.2 |
| 8-IM | 201,793 | 105,244 | 1.9 |
| 1-3D | 197,465 | 70,661 | 2.8 |
| 2-3D | 207,438 | 72,810 | 2.8 |
| 3-3D | 211,971 | 75,976 | 2.8 |
| 4-3D | 205,726 | 71,334 | 2.9 |
| 5-3D | 211,750 | 74,269 | 2.9 |
| Sample | 10% of Particles Below, µm | 50% of Particles Below, µm | 90% of Particles Below, µm |
|---|---|---|---|
| IM-1 | 5.2 | 21.0 | 114 |
| IM-8 | 4.1 | 12.0 | 113 |
| 3D-5 | 4.7 | 16.3 | 106 |
| Sample | Tensile Strength (at Yield) MPa | Tensile Modulus MPa | Strain at Break % | Charpy Impact Strength kJ/m2 |
|---|---|---|---|---|
| 1-IM | 25.5 ± 0.1 | 1841 ± 69 | 9.5 ± 1.8 | 21 ± 2.7 |
| 2-IM | 26.5 ± 0.2 | 1735 ± 47 | 12.7 ± 1.3 | 25 ± 4.8 |
| 3-IM | 26.6 ± 0.2 | 1712 ± 53 | 9.5 ± 1.2 | 20 ± 2.8 |
| 4-IM | 27.3 ± 0.1 | 1778 ± 62 | 11.8 ± 0.8 | 22 ± 5.1 |
| 5-IM | 27.4 ± 0.2 | 1777 ± 62 | 10.8 ± 1.9 | 24 ± 4.0 |
| 6-IM | 27.6 ± 0.2 | 1731 ± 14 | 12.9 ± 1.7 | 27 ± 5.4 |
| 7-IM | 27.9 ± 0.1 | 1789 ± 38 | 13.8 ± 2.6 | 27 ± 6.4 |
| 8-IM | 28.0 ± 0.2 | 1856 ± 112 | 13.5 ± 2.7 | 26 ± 7.3 |
| 1-3D | 11.6 ± 0.4 | 828 ± 36 | 3.2 ± 0.4 | 7.0 ± 0.7 |
| 2-3D | 10.5 ± 0.6 | 716 ± 30 | 2.0 ± 0.2 | 6.0 ± 0.5 |
| 3-3D | 13.5 ± 0.3 | 949 ± 48 | 2.9 ± 0.8 | 7.6 ± 1.0 |
| 4-3D | 13.4 ± 0.4 | 962 ± 45 | 2.4 ± 0.8 | 7.0 ± 1.0 |
| 5-3D | 13.3 ± 0.4 | 851 ± 40 | 3.3 ± 1.1 | 7.3 ± 0.6 |
Publisher’s Note: MDPI stays neutral with regard to jurisdictional claims in published maps and institutional affiliations. |
© 2022 by the authors. Licensee MDPI, Basel, Switzerland. This article is an open access article distributed under the terms and conditions of the Creative Commons Attribution (CC BY) license (https://creativecommons.org/licenses/by/4.0/).
Share and Cite
Immonen, K.; Metsä-Kortelainen, S.; Nurmio, J.; Tribot, A.; Turpeinen, T.; Mikkelson, A.; Kalpio, T.; Kaukoniemi, O.-V.; Kangas, H. Recycling of 3D Printable Thermoplastic Cellulose-Composite. Sustainability 2022, 14, 2734. https://doi.org/10.3390/su14052734
Immonen K, Metsä-Kortelainen S, Nurmio J, Tribot A, Turpeinen T, Mikkelson A, Kalpio T, Kaukoniemi O-V, Kangas H. Recycling of 3D Printable Thermoplastic Cellulose-Composite. Sustainability. 2022; 14(5):2734. https://doi.org/10.3390/su14052734
Chicago/Turabian StyleImmonen, Kirsi, Sini Metsä-Kortelainen, Juha Nurmio, Amélie Tribot, Tuomas Turpeinen, Atte Mikkelson, Tomi Kalpio, Otto-Ville Kaukoniemi, and Heli Kangas. 2022. "Recycling of 3D Printable Thermoplastic Cellulose-Composite" Sustainability 14, no. 5: 2734. https://doi.org/10.3390/su14052734
APA StyleImmonen, K., Metsä-Kortelainen, S., Nurmio, J., Tribot, A., Turpeinen, T., Mikkelson, A., Kalpio, T., Kaukoniemi, O.-V., & Kangas, H. (2022). Recycling of 3D Printable Thermoplastic Cellulose-Composite. Sustainability, 14(5), 2734. https://doi.org/10.3390/su14052734