Abstract
Oil palm (Elaeis guineensis Jacq.), an industrial oilseed crop, is the most prominent oil-producing crop in the world and one of the highest dry matter producers among C3 plants. It removes large amounts of soil nutrients to support its substantial biomass and oil production. Thus, maintaining adequate levels of limiting nutrients at favorable ratios in the soil is crucial to sustain the required palm nutritional status and oil production over extended periods. We evaluated the levels and ratios of the available soil and leaf nutrients in high-yielding (HYOPP) and low-yielding (LYOPP) oil palm plantations from two locations in southern India and assessed their relations to develop effective nutrient management for sustaining fresh fruit bunch (FFB) production. The FFB yield varied from 2.00 to 31.0 t ha−1 (location 1) and 6.84 to 30.9 t ha−1 (location 2), and the FFB yields of the high- and low-yield population at each location differed significantly. Wide ranges of soil properties, available nutrients, and leaf nutrients concentrations were observed at 0–20- and 20–40-cm soil depths at both locations. The soil nutrient ratios at both sampling depths of the HYOPP were significantly different than the LYOPP at location 1. The mean leaf N (2.09%) and K (0.68%) concentrations at location 2 were significantly higher than those in location 1 (1.85% and 0.54, respectively). The mean leaf concentrations at both locations followed the order N (1.85%, 2.09%) > Ca (1.65%, 1.36%) > K (0.54%, 0.68%) > Mg (0.49%, 0.47%) > S (0.16%, 0.18) > P (0.11%, 0.12%) > B (35.8 mg kg−1, 27.5 mg kg−1). We observed positive and significant correlations between the available N and P at 0–20 cm and between the available N and K as well as Ca and S at both soil depths for HYOPPs. In LYOPPs, the available N was significantly correlated with the available P, K, Ca, and Mg at both soil depths and with the available S at 0–20 cm. The FFB yield of LYOPPs was positively and significantly correlated with the available P and S at the 0–20-cm soil depth and with the available N and P at the 20–40-cm soil depth. Except for a negative correlation (p < 0.05) with exchangeable Ca at the 20–40-cm soil depth, the FFB yield in HYOPPs had no significant correlation with the available soil nutrients at both depths. The FFB yield of LYOPPs had a positive significant (p < 0.01) correlation with the leaf P and K concentrations, while the yield of HYOPPs had a negative correlation (p < 0.01) with the leaf P. Fertilizer accounts for a large part of the on-farm cost in oil palm plantations, and an evidenced approach for fertilizer management based on nutrient contents and ratios in the soil and in the plant is useful for sustainable and profitable production of palm oil.
1. Introduction
Soil plays a pivotal role in several ecosystem services, including biomass production [1,2]. Crop plants obtain nutrients primarily from the surface and sub-surface soil layers for their growth and development. However, the phytoavailability of nutrients (hereafter referred to as available nutrients) in soils and their acquisition by plants depend mainly on different soil and plant factors [3]. Soil fertility parameters, namely, pH, electrical conductivity (EC), and soil organic carbon content (SOC), and the amounts and ratios of available nutrients influence nutrient availability in soils [4]. Furthermore, the uptake of nutrients from soil by the plants and their utilization are influenced by nutrient interactions in the soil as well as in plant tissues [5]. The interactions occur because of complexation, absorption, adsorption, transportation, and competition among these nutrient ions, owing to a similar charge, size, electronic configuration, and coordination geometry [6].
The soil fertility parameters influence crop yields [7,8,9]. Crop yield levels could be improved by suitably ameliorating these parameters. Moreover, there is a need for maintaining and building soil fertility levels and providing balanced nutrition to growing crops for improving productivity and farm profit [10,11]. Previous research reported the necessity of maintaining appropriate levels of available nitrogen (AN), available phosphorus (AP), and available potassium (AK) in soils for higher crop yields [12,13]. This is due to occurrences of interactions among nitrogen (N), phosphorus (P), and potassium (K) in various soil–crop contexts [14,15,16]. The required levels and ratios of AN, AP, and AK in soils which are needed for maintaining optimum N/P and N/K ratios in plant tissues vary with the soil–crop situations [17,18]. Bhat et al. [19] established the optimum soil nutrient (including P, K, calcium (Ca), magnesium (Mg), and boron (B)) norms for improved leaf nutrient concentrations and yields of areca nut (Areca catechu L.) grown in the laterite soils of India. Boron is a micronutrient. It is extremely important for the fruit set and crop yield, but too much B is not good. The availability and stoichiometry of N and sulfur (S) in soil influence N and S uptake and thus the N/S ratio in crop plant tissues [20,21,22]. Wacal et al. [23] reported the influence of soil Ca, Mg, and K and their ratios (Ca/K and Mg/K) on the K nutrition of sesame. Similarly, the mobility of Mg in soil and plants is affected by the soil Ca, K, and NH4+ [24]. Behera et al. [25] highlighted the need for maintaining an equilibrium concentration of exchangeable K, Ca, and Mg in soils for ensuring proper nutrition in oil palm. Therefore, proper comprehension of the soil nutrients’ status, stoichiometry, and their relations with plant nutrient concentrations under high and low crop yield levels provides guidance for adopting effective nutrient management strategies [26,27].
Oil palm (Elaeis guineensis Jacq.) is grown in several countries, including India [28]. It provides fresh fruit bunches (FFBs). Palm oil is obtained from fruit mesocarp and kernels, and it has both industrial and food uses [29,30]. In India, oil palm is presently cultivated in a ≈ 0.34 mha area spreading across different states [31]. The area under oil palm cultivation may extend to other identified potential areas of the country [32]. Oil palm requires relatively high amounts of mineral nutrients for growth, development, and FFB production [33,34]. Adequate and balanced levels of nutrients in soils and optimum levels and ratios of them in leaves are required for higher FFB production [35,36]. FFB yield levels in oil palm plantations (OPPs) vary widely due to soil types and the adoption of different nutrient management practices [37]. Nutrient deficiency or disorders, namely N/K imbalance, K deficiency, Mg deficiency, and B deficiency, are common in OPPs throughout India, adversely affecting FFB yields [38]. We hypothesized that the soil properties and the levels and ratios of nutrients in soils and leaves of high-yielding oil palm plantations (HYOPPs) and low-yielding oil palm plantations (LYOPPs) would vary widely. Currently, there is limited information regarding this. The present study was therefore carried out to evaluate the soil properties and the levels and ratios of nutrients in the soils and leaves of HYOPPs and LYOPPs of two locations in southern India and their relations. This information is highly useful for the adoption of informed and effective nutrient management practices for higher FFB production in OPPs.
2. Materials and Methods
2.1. Study Locations
Soil and leaf samples were collected from an HYOPP (≥20 t ha−1 FFB yield) and LYOPP (<20 t ha−1 FFB yield) from two locations (Location 1 (Thanjavur district, Tamil Nadu) and Location 2 (West Godavari district, Andhra Pradesh) in southern India (Figure 1)). Location 1 is situated at 75°45′–70°25′ E longitude and 9°50′–11°25′ N latitude (57 m above mean sea level) (Thanjavur district, Tamil Nadu) with a sandy loam to loamy sand soil texture, acidic to alkaline soil pH, and Alfisols and Inceptisols soil orders. It receives an average annual precipitation of 940 mm and experiences a tropical climate. Location 2 is situated at 81°01′–81°02′ E longitude and 16°07′–16°12′ N latitude (22 m above mean sea level) (West Godavari district, Andhra Pradesh) with a sandy clay loam to loamy sand soil texture, acidic to alkaline soil pH, and Alfisols, Entisols, and Vertisols soil orders. It receives an average annual precipitation of 950 mm and experiences a tropical climate.
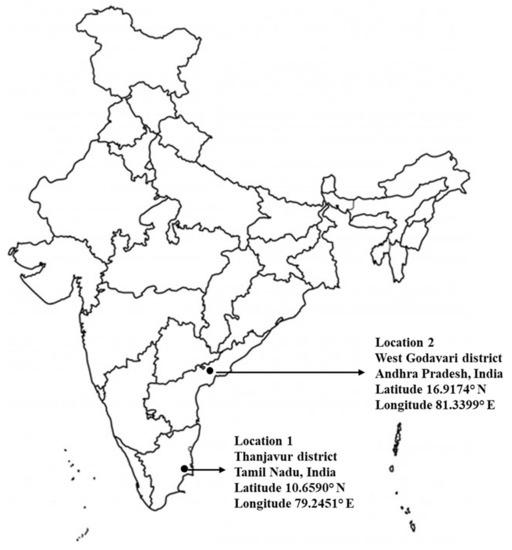
Figure 1.
Map showing study locations.
2.2. Collection of Soil and Leaf Samples and Average Yield Data
Soil and leaf samples were collected from a total of 165 OPPs from April to June in 2015 and 2016, consisting of 52 OPPs (14 HYOPPs and 38 LYOPPs) 5–15 years of age for location 1 and 113 OPPs (73 HYOPPs and 40 LYOPPs) 6–22 years of age for location 2. Plantations having ≥20 and <20 t ha−1 FFB yields were considered HYOPPs and LYOPPs, respectively. A total of 104 and 226 representative soil samples were collected from the surface (0–20 cm depth) and sub-surface (20–40 cm depth) soil layers of the OPPs at location 1 and location 2, respectively, using a stainless steel handheld auger. Each representative soil sample was obtained by mixing three soil samples collected from the palm basin 1 m away from the tree trunk.
A total of 165 leaf samples (52 samples from location 1 and 113 samples from location 2) were collected from the 165 OPPs at each location. Leaf samples were collected from the 17th frond of the corresponding palms where the soil samples were collected. The leaf laminae were collected from the middle leaflets of the 17th frond by removing the midrib. The FFB yield data of each OPP was recorded by obtaining the average FFB yield.
2.3. Processing and Analysis of Soil and Leaf Samples
Soil samples were processed by air-drying in a dust-free room, removing the roots, debris, stones, and gravel, and grinding with a wooden mortar and pestle to pass through a 2-mm sieve. The processed soil samples were stored in plastic jars for analysis. The soil pH and EC were determined by making a soil/water suspension (1:2.5 (w/v)) and using a pH meter (Systronics 362, Ahmedabad, India) and EC meter (Systronics 304, Ahmedabad, India), respectively [39]. The SOC content was determined by wet digestion method [40]. The available N, AP, and AK were estimated by alkaline permanganate [41], Olsen [42] and the ammonium acetate extraction method [43], respectively. Exchangeable Ca (Exch. Ca) and exchangeable Mg (Exch. Mg) were determined using a neutral normal ammonium acetate solution [44]. The available S (AS) was estimated by the turbidity method [45]. The available B (AB) was determined by hot water extraction [46]. The soil samples were analyzed in triplicate for each parameter, and the average values were used for statical analysis.
The collected leaf samples were washed with tap water, detergent solution (0.2%), diluted (0.1 N) hydrochloric acid solution, and double distilled water to remove dirt and waxy and metallic substances from the leaf samples [47]. Excess water was removed by using blotting paper. The leaf samples were ground (using a stainless steel grinder) to a powder form after air-drying and oven-drying at 70 °C until the leaf material was dry and crisp. The powdered leaf samples were stored in plastic jars for analysis. Each leaf sample was analyzed in triplicate for each parameter, and the average values were obtained. The concentration of N was estimated by micro-Kjeldahl. The concentrations of P, K, Ca, Mg, S, and B in the leaf samples were determined after digesting the leaf samples with a nitric acid/perchloric acid (9:4 ratio) mixture [39]. The concentration of B was determined by Azomethine-H [48].
2.4. Statistical Analysis
The descriptive statistics of the soil properties and available nutrients at both soil depths, as well as the leaf nutrient concentrations and their ratios, were assessed using SAS software (9.2 version) [49]. The datasets were subjected to a Shapiro–Wilk test (for normality) and Levene’s test (for equality of error variances). Analysis of variance (ANOVA) and a comparison between means were carried out. The means were compared at p < 0.05 using Tukey’s HSD test, which considers statical distribution related to repetitive testing. Relations among the available nutrients in both soil depths with FFB yield and leaf nutrient concentrations (by considering the parameters for HYOPPs and LYOPPs for both locations together) were visualized by Pearson’s correlation coefficient analysis and regression analysis.
3. Results
3.1. FFB Yield
The FFB yields of the OPPs of both locations varied widely (Table 1). The OPPs at location 2 had a significantly higher mean FFB yield level (20.8 t ha−1) than location 1 (14.8 t ha−1). The FFB yields of the HYOPPs and LYOPPs at each location were significantly (p < 0.05) different (Figure 2). The HYOPPs and LYOPPs at location 1 had mean FFB yields of 25.6 and 10.9 t ha−1, respectively, whereas the HYOPPs and LYOPPs at location 2 had FFB yields of 24.2 and 14.5 t ha−1, respectively.

Table 1.
Fresh fruit bunch (FFB) yield, soil properties, and soil nutrients in oil palm plantations at two locations in India.
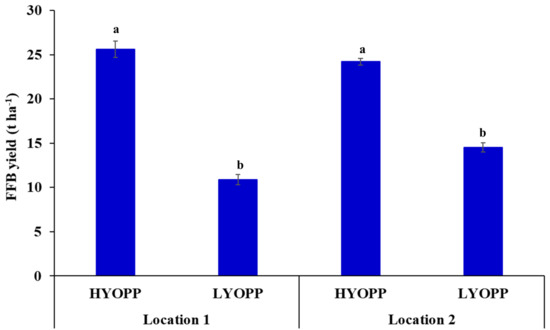
Figure 2.
Mean fresh fruit bunch (FFB) yield of high-yielding oil palm plantations (HYOPPs) and low-yielding oil palm plantations (LYOPPs) at two locations in India. Error bars denote standard errors. Different letters denote significant difference between mean FFB yields for each location.
3.2. Soil Properties and Available Nutrients
The soil properties and available nutrients in the 0–20- and 20–40-cm soil depths at the OPPs of both the locations varied widely (Table 1). The soils at location 1 were more acidic and had significantly lower EC and SOC contents at both soil depths compared with location 2. Except for the mean exchangeable Mg, the available nutrient content was higher at location 2 at both soil depths.
The HYOPPs at location 1 had higher mean available P (57.2 kg ha−1) and S (24.2 kg ha−1) and lower available N (217 kg ha−1) and exchangeable Ca (2.52 meq 100 g−1) at the 0–20-cm soil depth than in the LYOPPs. There was no significant difference in the available K, exchangeable Mg, and available B at the 0–20-cm depth between the soils for the two yield classes (Table 2). A similar trend was observed at the 20–40-cm soil depth, except for available S, which was similar in the HYOPPs and LYOPPs.
Table 2.
Soil parameters of high- and low-yielding oil palm plantations at location 1 (Thanjavur district, Tamil Nadu).
The SOC (11.4 g kg−1), available N (314 kg ha−1), K (439 kg ha−1), and S (39.2 kg ha−1), and exchangeable Ca (4.66 meq 100 g−1) and Mg (2.20 meq 100 g−1) contents at 0–20-cm depths were higher in the HYOPPs than the LYOPPs at location 2 (Table 3). The mean available P (116 kg ha−1) and B (4.08 kg ha−1) were statistically similar for the HYOPPs and LYOPPs. This trend was also similar at the deeper depths (20–40 cm).
Table 3.
Soil parameters of high- and low-yielding oil palm plantations at location 2 (West Godavari district, Andhra Pradesh).
3.3. Ratios of Available Nutrients
The HYOPPs at location 1 had significantly lower available N/P (4.31), N/K (2.54), N/S (6.74), Ca/Mg (0.97), K/Mg (0.16), and Ca/B (265) ratios than the LYOPPs (5.00, 3.21, 9.04, 1.45, 0.19, and 317, respectively) at the 0–20-cm soil depth (Table 4). This trend was similar at the deeper depth (20–40 cm), except for the N/S ratio, which was similar in the HYOPPs (10.7) and LYOPPs (10.3). At location 2, the available N/P ratio was higher in the HYOPPs (4.01) than the LYOPPs (3.44) at the 0–20-cm soil depth. The available N/K, N/S, P/K, Ca/Mg, K/Mg, and Ca/B ratios were similar in the HYOPPs (1.22, 5.05, 0.39, 2.84, 1.07, and 458, respectively) and LYOPPs (1.23, 4.95, 0.44, 2.69, 0.90, and 473, respectively) (Table 5). At the deeper depth (20–40 cm), the nutrient ratios were higher for N/P (5.87) and K/Mg (1.33), lower for N/K (1.34), N/S (4.94), and P/K (0.34), and similar for Ca/Mg (3.20) and Ca/B (529) at the HYOPPs compared with the LYOPPs (Table 5).
Table 4.
Soil nutrient ratios of high- and low-yielding oil palm plantations at location 1 (Thanjavur district, Tamil Nadu).
Table 5.
Soil nutrient ratios of high- and low-yielding oil palm plantations at location 2 (West Godavari district, Andhra Pradesh).
3.4. Leaf Nutrient Concentrations and Their Ratios
The leaf nutrient concentrations varied widely at the OPPs of both locations (data provided in Supplementary Tables S1 and S2). The OPPs at location 2 had significantly higher mean leaf N (2.09%) and K (0.68%) concentrations than location 1 (N: 1.85% and K: 0.54%). The mean leaf nutrient concentrations of the HYOPPs and LYOPPs were statistically similar, except for B at location 1 and Ca and B at location 2 (Figure 3). The comparison of leaf nutrient ratios of the HYOPPs and LYOPPs revealed that the HYOPPs at location 1 had significantly higher mean N/P, N/K, N/Mg, N/B, P/Mg, K/Mg, and Ca/Mg ratios compared with those nutrient ratios at the LYOPPs (Table 6). However, the LYOPPs at location 2 had significantly higher mean N/B, P/B, K/S, K/B, Ca/Mg, Ca/S, Ca/B, and Mg/B ratios compared with those ratios at the HYOPPs (Table 7).
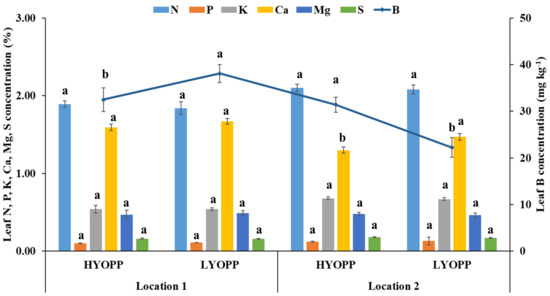
Figure 3.
Mean leaf nutrient concentrations of high-yielding oil palm plantations (HYOPPs) and low-yielding oil palm plantations (LYOPPs) at two locations in India. Error bars denote standard errors. Different letters denote significant difference between mean values of each nutrient concentration for each location.
Table 6.
Leaf nutrient concentration ratios in high- and low-yielding oil palm plantations at location 1 (Thanjavur district, Tamil Nadu).
Table 7.
Leaf nutrient concentration ratios in high- and low-yielding oil palm plantations at location 2 (West Godavari district, Andhra Pradesh).
3.5. Relations among Available Nutrients, Leaf Nutrient Concentrations, and FFB Yield
The available N at the 0–20-cm soil depth was positively and significantly correlated with the P, K, Ca, and S of the HYOPPs and with the P, K, Ca, Mg, and S of the LYOPPs (Table 8). Similarly, the available N in the 20–40-cm soil depth was positively and significantly correlated with the K, Ca, and S of the HYOPPs and with the P, K, Ca, and Mg of the LYOPPs (Table 9). Significant positive correlations were observed between the available P at 0–20- and 20–40-cm soil depths and the available K, Ca, S, and B at the LYOPPs. The available K at both soil depths of the HYOPPs was positively and significantly correlated with the available Ca, S, and B. The available K at both the soil depths of the LYOPPs had a significant positive correlation with the Ca and S. The Exch. Ca was positively and significantly correlated with the Exch. Mg at both the soil depths of the HYOPPs and at the 20–40-cm soil depth of the LYOPPs.
Table 8.
Pearson’s correlation coefficients highlighting correlations among soil nutrients at a 0–20-cm depth, FFB yield, and leaf nutrient concentrations of high- and low-yielding oil palm plantations at two locations in India with locations pooled together.
Table 9.
Pearson’s correlation coefficients highlighting correlations among soil nutrients at a 20–40-cm depth, FFB yield, and leaf nutrient concentrations of high- and low-yielding oil palm plantations at two locations in India with locations pooled together.
The FFB yield of the LYOPPs was positively and significantly correlated with the available P (r = 0.349, p < 0.01) and S (r = 0.277, p < 0.01) at the 0–20-cm soil depth and with the available N (r = 0.228, p < 0.01) and P (r = 0.306, p < 0.01) at the 20–40-cm soil depth (Table 8 and Table 9).
The FFB yield of the HYOPPs was negatively and significantly correlated (r = 0.355, p < 0.01) with the leaf P concentration. However, the FFB yield of the LYOPPs was positively and significantly correlated with the leaf P (r = 0.326, p < 0.01) and K (r = 0.341, p < 0.01) concentrations.
Available K had a significant negative correlation with the leaf Ca concentration of the HYOPPs at the 0–20-cm depth (r = −0.275, p < 0.01) and the 20–40-cm depth (r = −0.319, p < 0.01). In the LYOPPs, available K at the 0–20-cm depth was significantly correlated with the leaf P (r = 0.362, p < 0.01) and K (r = 0.266, p < 0.01) but inversely correlated with the leaf Ca (r = −0.243, p < 0.01) and B (r = −0.264, p < 0.01). The available K at the 20–40-cm soil depth of the LYOPPs had a positive correlation with the leaf P concentration (r = 0.220, p < 0.01) and a negative correlation with the leaf B concentration (r = −0.296, p < 0.01). The leaf K concentration and leaf Ca concentration were negatively correlated both in the HYOPPs (r = −0.239, p < 0.01) and LYOPPs (r = −0.326, p < 0.01). The leaf Ca concentration was positively and significantly correlated with the leaf B concentration in both the HYOPPs (r = 0.408, p < 0.01) and LYOPPs (r = 0.369, p < 0.01).
4. Discussion
4.1. FFB Yield
Soil fertility and fertilizer management are important factors influencing crop yield under different production systems [50]. The yield gap of OPPs could be closed by assessing the soil fertility status and imposing appropriate nutrient management strategies [35,51]. The FFB yields of OPPs at location 1 and location 2 varied from 2.00 to 31.0 t ha−1 and 6.84 to 30.9 t ha−1, respectively. Location 2 had a higher FFB yield mean value compared with the mean FFB yield at location 1. This result is similar to the FFB yield levels reported in OPPs of the Para state and the Amazon region of Brazil [52,53]. The above-mentioned variations in the FFB yield of OPPs is primarily attributed to differences in soil types and soil nutrient status as influenced by nutrient management practices [35,54,55].
4.2. Soil Properties and Available Nutrients
Oil palm grows well in soil with a pH range in between 4.3 and 6.5, and almost 95 percent of oil palms are grown in acidic and low-fertility soil [34]. The soil pH of both the plantations in this study varied from 5.44 to 8.26 and from 4.92 to 8.14 at 0–20- and 20–40-cm soil depths, respectively (Table 1). The prevailing soil pH in the study locations was in contrast to that of oil palm cultivation in acidic soils of northeast Asian countries and some African countries [56,57,58]. The SOC content of the OPPs of the study area varied from 0.78 to 31.2 g kg−1 and from 0.39 to 9.36 g kg−1 at 0–20- and 20–40-cm soil depths, respectively. The mean SOC content in the OPPs of both the soil depths at location 2 was higher than the mean SOC content of the OPPs at location 1 and might have contributed to a higher average FFB yield at location 2. This could have influenced the yields within the locations, as the SOC content in both the soil depths of the HYOPPs was higher than the SOC content of the LYOPPs. The variations in SOC content of the OPPs are attributed to the adoption of different crop residue management practices such as mulching and intercropping [55]. Several studies have highlighted that proper crop residue management in OPPs such as the addition of chopped, pruned leaves and empty fruit bunches at the palm basin leading to enhancement of the SOC and improvement in FFB yields [59,60].
The available nutrients at the 0–20- and 20–40-cm soil depths at the OPPs of both locations varied widely. This may be attributed to variations in soil types and nutrient management practices in different OPPs. Several researchers also reported the variations of available nutrients in the OPPs of different areas of Indonesia, India, and Ghana [58,61,62]. The surface soil (0–20-cm depth) of the HYOPPs had higher values of AP and AS at location 1 and higher values of AN, AK, Exch. Ca, Exch. Mg, and AS at location 2 compared with the available nutrients in the LYOPPs. This agrees with Rhebergen et al. [63], who reported lower values of available nutrients in low-yielding small holder OPPs compared with large OPPs. The higher levels of available nutrients in soils help ensure an adequate and uninterrupted nutrient supply to the root surface for proper uptake by the plant [64]. In an alluvial soil with poor drainage located at a former rubber plantation, N alone led to a 21% yield increase and even to a 41% fresh fruit bunch increase when applied together with P [65]. This highlights the need for the adoption of effective nutrient management practices for enhancing the levels of available nutrients in soil for higher FFB yields. Nutrient ratios in soils are indicators of yield differences in a particular crop [12,66]. Nutrient ratios in soil under high-yield conditions are considered ideal for nutrient management. The nutrient ratios in the soil layers of OPPs at both the locations varied widely. The HYOPPs at location 1 had lower mean values for the nutrient ratios, namely AN/AP, AN/AK, Exch. Ca/Exch. Mg, AK/Exch. Mg, and Exch. Ca/AB, in both the soil layers compared with those nutrient ratios in the soils of the LYOPPs (Table 4). However, the mean values for the nutrient ratios in the 0–20-cm soil depth of the HYOPPs and LYOPPs at location 2 were similar (Table 5). This indicates that the optimum nutrient ratios in the soils for the HYOPPs varied with the soil types and location, with a specific climatic condition and crop management practice. The interactions among the nutrients vary with the soil–crop situations. Therefore, proper soil–crop management practices need to be adopted to maintain the desired nutrient ratios in the soils (by providing adequate and balanced proportions) of OPPs for obtaining higher FFB yields.
4.3. Leaf Nutrient Concentrations
The leaf nutrient concentrations at the OPPs of both locations varied widely. The mean leaf nutrient concentrations at both locations followed the order N (1.85%, 2.09%) > Ca (1.65%, 1.36%) > K (0.54%, 0.68%) > Mg (0.49%, 0.47%) > S (0.16%, 0.18) > P (0.11%, 0.12%) > B (35.8 mg kg−1, 27.5 mg kg−1). Other researchers have reported similar variations in the leaf nutrient concentrations of the OPPs in Malaysia and Brazil [53,67]. The mean leaf nutrient (except for B at location 1 and Ca and B at location 2) concentrations of the HYOPPs and LYOPPs at both locations were statistically similar. This indicates that both the HYOPPs and LYOPPs at the study areas accumulated similar levels of leaf nutrients. However, there were variations in some nutrient ratios between the HYOPPs and LYOPPs at both locations. Similar to the ratios of the available nutrients in the soil, the optimum leaf nutrient ratio for higher FFB yields varied by location. There was lack of clarity on the influence of the leaf nutrient concentration and their ratios on the FFB yield. Foster [68] reported that the leaf nutrient content alone may not be a good indicator of nutritional requirements in oil palm. It has been shown that increased levels of available nutrients in the soil enhance the leaf nutrient concentration up to a certain level [69]. Beyond that point, the oil palm plant responds by enhancing its growth without changing the leaf nutrient concentration. Therefore, location-specific nutrient management practices need to be adopted for maintaining optimum leaf nutrient ratios (known from leaf analysis), and this should be combined with field knowledge and a general sense of plantation management for obtaining higher FFB yields in OPPs [70,71].
4.4. Relations among Available Nutrients, Leaf Nutrient Concentrations, and FFB Yield
There were positive and significant correlations of AN in both the soil layers with AK, Exch. Ca, and AS in the soils of the HYOPPs and with AP, AK, Exch. Ca, and Exch. Mg in the soils of the LYOPPs. This indicates that the AK, Exch. Ca, and AS in the soils of the HYOPPs and AP, AK, Exch. Ca, and Exch. Mg in the soils of the LYOPPs increased with the increase in AN in the soils. In both soil layers of the LYOPPs, the AP was positively and significantly correlated with the AK, Exch. Ca, AS, and AB. The available K in both soil layers was positively and significantly correlated with the Exch. Ca and AS in the soils of the HYOPPs and LYOPPs. There were positive and significant correlations between the exchangeable Ca and exchangeable Mg in the soils of the HYOPPs and LYOPPs (except at the 0–20-cm soil depth). Positive correlations among the soil nutrients in the OPPs was probably due to facilitations and nutrient complementarity. These relations need to be considered for deciding fertilization strategies in OPPs. The positive and significant correlation of the FFB yields in LYOPPs with AP at the 0–20-cm soil depth and with AN and AP at the 20–40-cm soil depth indicated an increase in the FFB yield with an increase in the AP and AN in deeper soil layers. However, the FFB yields in HYOPPs were not significantly correlated with any of the studied soil nutrients. This agrees with the work of Black [72], who reported that a crop yield may increase, decrease, or be unaffected by a certain change in soil fertility, depending on the initial soil fertility level and quantum of change in the soil fertility level. The FFBs yield in the HYOPPs decreased with the increase in the leaf P concentration. Conversely, the FFB yields in the LYOPPs increased with the increasing leaf P concentration. However, the contribution of the leaf P concentration toward the FFB was 13% and 11% in the HYOPPs and LYOPPs, respectively (Figure 4). The negative relation of the FFB yield with the leaf P concentration emphasizes the need for rationalization of P use in HYOPPs. Behera et al. [73] also reported a P build-up in the soils of some OPPs in India.
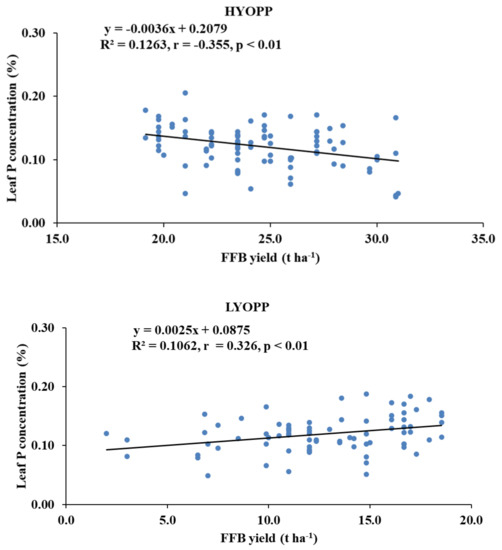
Figure 4.
Relationships between fresh fruit bunch (FFB) yield and leaf P concentration of high-yielding oil palm plantations (HYOPPs) and low-yielding oil palm plantations (LYOPP).
The negative and significant correlations of the AK at both soil depths of the HYOPPs and the 0–20-cm soil depth of the LYOPPs with the leaf Ca concentration indicated the decrease in leaf Ca concentration with increased levels of AK in the soil. There is some evidence of an interaction among cations such as K+ and Ca2+ as they compete for exchange sites so that an excess of one may interfere with the availability of the others [34,74]. The contribution of the AK at the 0–20- and 20–40-cm soil depths of the HYOPPs toward the leaf Ca concentration was 8% and 10%, respectively (Figure 5). The contribution of AK at the 0–20-cm soil depth of the LYOPP toward the leaf Ca concentration was 6%. This is due to the inverse relationship between K and Ca for root xylem translocation [75,76]. The available K at both soil depths of the LYOPPs was negatively correlated with the leaf B concentration. This negative interaction of the AK with the leaf B concentration is due to cation-anion imbalance [77]. In the LYOPPs, the leaf N concentration was positively and significantly correlated with the leaf P and K concentrations, indicating synergistic interactions among these nutrients. Several researchers reported interactive effects of N vs. P and N vs. K in plants [14,78]. However, the leaf N concentration was negatively and significantly correlated with the leaf B concentration revealing an antagonistic relationship between N and B. Aulakh and Malhi [79] and Koohkan and Maftoun [80] also reported an antagonistic interaction between plant N and B. In our study, an increase in the leaf K concentration led to a reduction in the leaf Ca concentration in both the HYOPPs and LYOPPs (Table 8). The contribution of the leaf K concentration toward the leaf Ca concentration was 6% and 11% in the HYOPPs and LYOPPs, respectively (Figure 6). In order to achieve the optimum Ca concentration, the leaf K concentration could be managed appropriately by K fertilizer application. An increase in the leaf Ca concentration led to an increase in the leaf B concentration in both the HYOPPs and LYOPPs, revealing synergistic interaction between Ca and B. The contribution of the leaf Ca concentration toward the leaf B concentration was 17% and 14% in the HYOPPs and LYOPPs, respectively (Figure 7). This information pertaining to relations among the studied parameters in the HYOPPs and LYOPPs could be used for efficient nutrient management to achieve higher FFB yields.
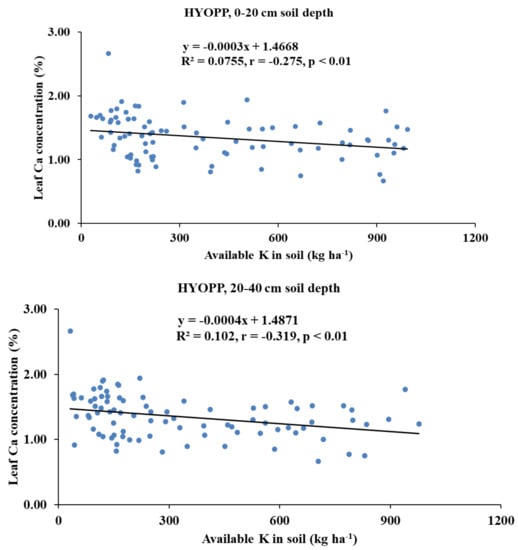
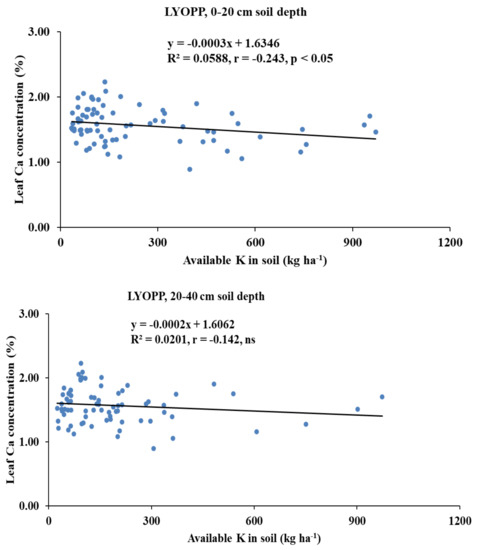
Figure 5.
Relationships between available K (AK) in soils and leaf Ca concentration of high-yielding oil palm plantations (HYOPPs) and low-yielding oil palm plantations (LYOPPs).
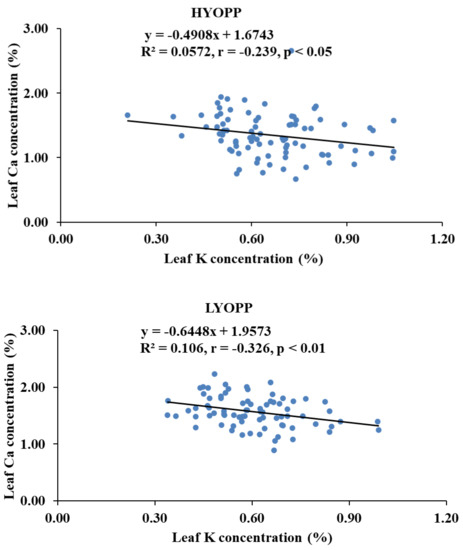
Figure 6.
Relationships between leaf K concentrations and leaf Ca concentrations of high-yielding oil palm plantations (HYOPPs) and low-yielding oil palm plantations (LYOPPs).
Figure 7.
Relationships between leaf Ca concentrations and leaf B concentrations of high-yielding oil palm plantations (HYOPPs) and low-yielding oil palm plantations (LYOPPs).
5. Conclusions
The study revealed variations in the FFB yields of the OPPs of the study locations. The soil properties (pH, EC, and SOC) and available nutrients (AN, AP, AK, Exch. Ca, Exch. Mg, AS, and AB) and their ratios at the 0–20- and 20–40-cm soil depths in the HYOPPs and LYOPPs correlated well with the yield. We found significant correlations among the soil and leaf nutrient contents and between the contents of the leaf nutrients. That the FFB yields of the plantations were correlated with the sub-surface soil nutrient contents is an interesting outcome of this study. This highlighted the need for assessing surface as well as sub-surface soil nutrient availability for effective nutrient management. The mean leaf nutrient concentrations of both examined locations followed the order N > Ca > K > Mg > S > P > B. In a nutshell, location-specific surface and sub-surface soil nutrient and leaf nutrient management practices need to be adopted for enhancing the FFB yields in LYOPPs and maintaining the FFB yields of HYOPPs. Similar studies need to be carried out in different crop production systems of the world for proper understanding of the nutrient interactions in soil–plant situations, thereby devising appropriate nutrient management options for enhancing and maintaining crop yields.
Supplementary Materials
The following supporting information can be downloaded at: https://www.mdpi.com/article/10.3390/su14052672/s1, Table S1: Leaf nutrients concentration in oil palm plantations of two locations; Table S2: Leaf nutrients concentrations in high and low yielding oil palm plantations of both the locations;
Author Contributions
Conceptualization, investigation, formal analysis, writing—original draft, and editing, S.K.B.; visualization, formal analysis, and writing—editing, A.K.S.; investigation, formal analysis, and writing—editing, K.S.; methodology, data curation, and software, K.M. (Kamireddy Manorama); conceptualization, supervision, fund acquisition, and project administration, R.K.M.; formal analysis, resources, and writing—editing, K.M. (Kaushik Majumdar). All authors have read and agreed to the published version of the manuscript.
Funding
This study was funded by Indian Council of Agricultural Research-Indian Institute of Oil Palm Research, Pedavegi, West Godavari, Andhra Pradesh, India.
Institutional Review Board Statement
Not applicable.
Informed Consent Statement
Not applicable.
Data Availability Statement
Not applicable.
Acknowledgments
The authors acknowledge the director of the ICAR-Indian Institute of Oil Palm Research in Pedavegi, West Godavari, Andhra Pradesh, India for providing the facilities to carry out the study. The authors thank the Indian Council of Agricultural Research in New Delhi for their financial support.
Conflicts of Interest
The authors declare no conflict of interest.
References
- Adhikari, K.; Hartemink, A.E. Linking soils to ecosystem services—A global review. Geoderma 2016, 262, 101–111. [Google Scholar] [CrossRef]
- Pereira, P.; Bogunovic, I.; Muñoz-Rojas, M.; Brevik, E.C. Soil ecosystem services, sustainability, valuation and management. Curr. Opin. Environ. Sci. Health 2018, 5, 7–13. [Google Scholar] [CrossRef]
- Marschner, P. Marschner’s Mineral Nutrition of Higher Plants, 3rd ed.; Elsevier: Oxford, UK, 2012. [Google Scholar] [CrossRef]
- Tisdale, S.L.; Nelson, W.L.; Beaton, J.D. Soil Fertility and Fertilizers, 4th ed.; McMilan: New York, NY, USA, 1985. [Google Scholar]
- Fageria, V.D. Nutrient interactions in crop plants. J. Plant Nutr. 2001, 24, 1269–1290. [Google Scholar] [CrossRef]
- Robson, A.D.; Pitman, J.B. Interactions Between Nutrients in Higher Plants. In Inorganic Plant Nutrition: Encyclopedia of Plant Physiology; Lauchli, A., Bieleski, R.L., Eds.; Springer: New York, NY, USA, 1983. [Google Scholar]
- Juhos, K.; Szabó, S.; Ladányi, M. Influence of soil properties on crop yield: A multivariate statistical approach. Int. Agrophysics 2015, 29, 433–440. [Google Scholar] [CrossRef]
- Cook, R.L.; Trlica, A. Tillage and fertilizer effects on crop yield and soil properties over 45 years in southern Illinois. Agron. J. 2016, 108, 415–426. [Google Scholar] [CrossRef] [Green Version]
- Blanchet, G.; Gavazov, K.; Bragazza, L.; Sinaj, S. Responses of soil properties and crop yields to different inorganic and organic amendments in a Swiss conventional farming system Author links open overlay panel. Agric. Ecosys. Environ. 2016, 230, 116–126. [Google Scholar] [CrossRef] [Green Version]
- Darst, B.C.; Fixen, P.E. High yields, high profits, and high soil fertility. Better Crops 2000, 84, 4–8. [Google Scholar]
- Wani, S.P.; Anantha, K.H.; Garg, K.K. Soil properties, crop yield, and economics under integrated crop management practices in Karnataka, southern India. World Dev. 2017, 93, 43–61. [Google Scholar] [CrossRef]
- Yousaf, M.; Li, J.; Lu, J.; Ren, T.; Cong, R.; Fahad, S.; Li, X. Effects of fertilization on crop production and nutrient-supplying capacity under rice-oilseed rape rotation system. Sci. Rep. 2017, 7, 1270. [Google Scholar] [CrossRef]
- Moe, K.; Htwe, A.Z.; Thu, T.T.P.; Kajihara, Y.; Yamakawa, T. Effects on NPK status, growth, dry matter and yield of rice (Oryza sativa) by organic fertilizers applied in field condition. Agriculture 2019, 9, 109. [Google Scholar] [CrossRef] [Green Version]
- de Groot, C.C.; Marcelis, L.F.M.; van den Boogaard, R.; Kaiser, W.M.; Lambers, H. Interaction of nitrogen and phosphorus nutrition in determining growth. Plant Soil. 2003, 248, 257–268. [Google Scholar] [CrossRef]
- Fageria, N.K.; Oliveira, J.P. Nitrogen, phosphorus and potassium interactions in upland rice. J. Plant Nutr. 2014, 37, 1586–1600. [Google Scholar] [CrossRef]
- Gondwe, R.L.; Kinoshita, R.; Suminoe, T.; Aiuchi, D.; Palta, J.P.; Tani, M. Available soil nutrients and NPK application impacts on yield, quality, and nutrient composition of potatoes growing during the main season in Japan. Am. J. Potato Res. 2020, 97, 234–245. [Google Scholar] [CrossRef]
- NAAS. Crop Response and Nutrient Ratio; Policy paper no. 42; National Academy of Agricultural Sciences: New Delhi, India, 2009; pp. 1–16. [Google Scholar]
- Zhang, H.M.; Yang, X.Y.; He, X.H.; Xu, M.G.; Huang, S.M.; Liu, H.; Wang, B.R. Effect of long-term potassium fertilization on crop yield and potassium efficiency and balance under wheat-maize rotation in China. Pedosphere 2011, 21, 154–163. [Google Scholar] [CrossRef]
- Bhat, R.; Sujatha, S.; Jose, C.T. Assessing soil fertility of a laterite soil in relation to yield of arecanut (Areca catechu L.) in humid tropics of India. Geoderma 2012, 189–190, 91–97. [Google Scholar] [CrossRef]
- Brennan, R.F.; Bolland, M.D.A. Significant nitrogen by sulfur interactions occurred for canola grain production and oil concentration in grain on sandy soils in the Mediterranean-type climate of southwestern Australia. J. Plant Nutr. 2008, 31, 1174–1187. [Google Scholar] [CrossRef]
- Rossini, F.; Provenzano, M.E.; Sestili, F.; Ruggeri, R. Synergistic effect of sulfur and nitrogen in the organic and mineral fertilization of durum wheat: Grain yield and quality traits in the Mediterranean environment. Agronomy 2018, 8, 189. [Google Scholar] [CrossRef] [Green Version]
- Carciochi, W.D.; Salvagiotti, F.; Pagani, A.; Calvo, N.I.R.; Eyherabide, M.; Rozas, H.R.S.; Ciampitti, I.A. Nitrogen and sulfur interaction on nutrient use efficiencies and diagnostic tools in maize. Eur. J. Agron. 2020, 116, 126045. [Google Scholar] [CrossRef]
- Wacal, C.; Ogata, N.; Basalirwa, D.; Sasagawa, D.; Masunaga, T.; Yamamoto, S.; Nishihara, E. Growth and K nutrition of sesame (Sesamum indicum L.) seedlings as affected by balancing soil exchangeable cations Ca, Mg, and K of continuously monocropped soil from upland fields converted paddy. Agronomy 2019, 9, 819. [Google Scholar] [CrossRef] [Green Version]
- Gransee, A.; Führs, H. Magnesium mobility in soils as a challenge for soil and plant analysis, magnesium fertilization and root uptake under adverse growth conditions. Plant Soil 2013, 368, 5–21. [Google Scholar] [CrossRef] [Green Version]
- Behera, S.K.; Suresh, K.; Shukla, A.K.; Kamireddy, M.; Mathur, R.K.; Majumdar, K. Soil and leaf potassium, calcium and magnesium in oil palm (Elaeis guineensis Jacq.) plantations grown on three different soils of India: Status, stoichiometry and relations. Ind. Crops Prod. 2021, 168, 113589. [Google Scholar] [CrossRef]
- Rietra, R.P.J.J.; Heinen, M.; Dimkpa, C.O.; Bindraban, P.S. Effects of nutrient antagonism and synergism on yield and fertilizer use efficiency. Commun. Soil Sci. Plant Anal. 2017, 48, 1895–1920. [Google Scholar] [CrossRef] [Green Version]
- Havlin, J.; Heiniger, R. Soil fertility management for better crop production. Agronomy 2020, 10, 1349. [Google Scholar] [CrossRef]
- Pirker, J.; Mosnier, A.; Kraxner, F.; Havlik, P.; Obersteiner, M. What are the limits to oil palm expansion? Glob. Environ. Change 2016, 40, 73–81. [Google Scholar] [CrossRef] [Green Version]
- Knaut, J.; Richtler, H.J. Trends in industrial uses of palm and lauric oils. J. Am. Oil Chem. Soc. 1985, 62, 317–327. [Google Scholar] [CrossRef]
- Salimon, J.; Salih, N.; Yousif, E. Industrial development and applications of plant oils and their biobased oleochemicals. Arab. J. Chem. 2012, 5, 135–145. [Google Scholar] [CrossRef] [Green Version]
- DACFW. Department of Agriculture, Cooperation and Farmers Welfare, Government of India; 2020. Available online: http://nmoop.gov.in/Publication/Status_Paper_OilPalm.pdf (accessed on 20 November 2021).
- Rethinam, P.; Arulraj, S.; Rao, B.N. Assessment of Additional Potential Areas for Oil Palm Cultivation in India; Report submitted to Department of Agriculture and Cooperation, Ministry of Agriculture, Govt. of India; Directorate of Oil Palm Research: Pedavegi, Andhra Pradesh, India, 2012. [Google Scholar]
- Ng, S.K. Nutrition and nutrient management of the oil palm. New thrust for the future perspective. In Potassium for Sustainable Crop Production, 2002, Proceedings of the International Symposium on Role of Potassium in India, New Delhi, India, 3–5 December 2002; Pasricha, N.S., Bansal, S.K., Eds.; Potash Research Institute of India, and International Potash Institute: New Delhi, India, 2002; pp. 415–429. [Google Scholar]
- Tiemann, T.T.; Donough, C.R.; Lim, Y.L.; Härdter, R.; Norton, R.; Tao, H.H.; Jaramillo, R.; Satyanarayana, T.; Zingore, S.; Oberthür, T. Chapter Four-Feeding the palm: A review of oil palm nutrition. Adv. Agron. 2018, 152, 149–243. [Google Scholar] [CrossRef]
- Woittiez, L.S.; Slingerland, M.; Rafik, R.; Giller, K.E. Nutritional imbalance in smallholder oil palm plantations in Indonesia. Nutr. Cycl. Agroecosystem 2018, 111, 73–86. [Google Scholar] [CrossRef] [Green Version]
- Ayanda, A.F.; Jusop, S.; Ishak, C.F.; Othman, R. Utilization of magnesium-rich synthetic gypsum as magnesium fertilizer for oil palm grown on acidic soil. PLoS ONE 2020, 15, e0234045. [Google Scholar] [CrossRef]
- Prasad, M.V.; Sarkar, A.; Jameema, J. Performance of oil palm production technologies. Indian Res. J. Ext. Edu. 2013, 10, 10–15. [Google Scholar]
- Kalidas, P.; Behera, S.K.; Saravanan, L.; Deepthi, K.P.; Suresh, K.; Rao, B.N.; Prasad, M.V.; Manorama, K. Pests, Diseases, Nutrient Deficiencies and Disorders of Oil Palm; Technical Bulletin No. 01/2017; ICAR—Indian Institute of Oil Palm Reserach: Pedavegi, West Godavari, Andhra Pradesh, India, 2017; pp. 1–60. [Google Scholar]
- Jackson, M.L. Soil Chemical Analysis; Prentice Hall of India: New Delhi, India, 1973. [Google Scholar]
- Walkley, A.J.; Black, I.A. An examination of the Degtjareff method for determining soil organic matter and a proposed modification of the chromic acid titration method. Soil Sci. 1934, 37, 29–38. [Google Scholar] [CrossRef]
- Subbiah, B.V.; Asija, G.L. A rapid procedure for the determination of available nitrogen in soils. Curr. Sci. 1956, 25, 259–260. [Google Scholar]
- Olsen, S.R.; Cole, C.V.; Watanable, F.S.; Dean, L.A. Estimation of Available Phosphorous in Soils by Extraction with Sodium Bicarbonate; Circ. U. S. Dep. Agric; United States Department of Agriculture: Washington, DC, USA, 1954; p. 939.
- Hanway, J.J.; Heidel, H. Soil analyses methods as used in Iowa state college soil testing laboratory. Iowa Agric. 1952, 57, 1–31. [Google Scholar]
- Jones, J.B., Jr. Soil test methods: Past, present, and future. Commun. Soil Sci. Plant Anal. 1998, 29, 1543–1552. [Google Scholar] [CrossRef]
- Williams, C.H.; Steinbergs, A. Soil sulphur fractions as chemical indices of available sulphur in some Australian soils. Aust. J. Agric. Res. 1969, 10, 340–352. [Google Scholar] [CrossRef]
- Gupta, U.C. A simplified method for determining hot-water soluble boron in podzol soils. Soil Sci. 1967, 103, 424–428. [Google Scholar] [CrossRef]
- Behera, S.K.; Suresh, K.; Ramachandrudu, K.; Manorama, K.; Rao, B.N. Mapping spatial variability of leaf nutrient status of oil palm (Elaeis guineensis Jacq.) plantations in India. Crop Pasture Sci. 2016, 67, 109–116. [Google Scholar] [CrossRef]
- Gaines, T.P.; Mitchell, G.A. Boron determination in plant tissue by the azomethine-H method. Commun. Soil Sci. Plant Anal. 1979, 10, 1099–1108. [Google Scholar] [CrossRef]
- SAS Institute. The SAS Systems for Windows; Release 9.2.; SAS Institute: Cary, NC, USA, 2011. [Google Scholar]
- Kukal, M.S.; Irmak, S. Climate-driven crop yield and yield variability and climate change impacts on the U.S. Great Plains agricultural production. Sci. Rep. 2018, 8, 3450. [Google Scholar] [CrossRef] [Green Version]
- Rhebergen, T.; Zingore, S.; Giller, K.E.; Frimpong, C.A.; Acheampong, K.; Ohipeni, F.T.; Panyin, E.K.; Zutah, V.; Fairhurst, T. Closing yield gaps in oil palm production systems in Ghana through best management practices. Eur. J. Agron. 2020, 115, 126011. [Google Scholar] [CrossRef]
- Sato, M.K.; de Lima, H.V.; Ferreira, R.L.C.; Rodrigues, S.; da Silva, Á.P. Least limiting water range for oil palm production in Amazon region, Brazil. Sci. Agric. 2015, 74, 148–156. [Google Scholar] [CrossRef]
- Matos, G.S.B.; Fernandes, A.R.; Wadt, P.G.S.; Pina, A.J.A.; Franzini, V.I.; Ramos, H.M.N. The use of DRIS for nutritional diagnosis in oil palm in the state of Pará. Rev. Bras. Cienc. Solo 2017, 41, e0150466. [Google Scholar] [CrossRef]
- Tohiruddin, L.; Tandiono, J.; Salalah, A.J.; Prabowo, N.E.; Foster, H.L. Effects of N, P and K fertilizers on leaf trace element levels of oil palm in Sumatra. J. Oil Palm Res. 2010, 22, 869–877. [Google Scholar]
- Manorama, K.; Behera, S.K.; Suresh, K.; Prasad, M.V.; Mathur, R.K.; Harinarayana, P. Mulching and technological interventions avoid land degradation in intensive oil palm (Elaeis guineensis Jacq.) production system. Land Degr. Dev. 2021, 32, 3785–3797. [Google Scholar] [CrossRef]
- Nelson, P.N.; Rhebergen, T.; Berthelsen, S.; Webb, M.J.; Banabas, M.; Oberthür, T.; Donough, C.R.; Rahmadsyah; Indrasuara, K.; Lubis, A. Soil acidification under oil palm: Rates and effects on yield. Better Crops 2011, 95, 22–25. [Google Scholar]
- Rozieta, R.; Sahibin, A.R.; Wan Mohd Razi, I. Physico-chemical properties of soil at oil palm plantation area, Labu, Negeri Sembilan. AIP Conf. Proc. 2015, 1678, 020031. [Google Scholar] [CrossRef]
- Obeng, A.S.; Sadick, A.; Hanyabui, E.; Musah, M.; Marius, M.; Acheampong, M.K. Evaluation of soil fertility status in oil palm plantations in the western region of Ghana. AIMS Agric. Food 2020, 5, 938–949. [Google Scholar] [CrossRef]
- Tao, H.H.; Snaddon, J.L.; Slade, E.M.; Caliman, J.P.; Widodo, R.H.; Suhardi; Willis, K.J. Long-term crop residue application maintains oil palm yield and temporal stability of production. Agron. Sust. Dev. 2017, 37, 33. [Google Scholar] [CrossRef] [Green Version]
- Rahman, N.; Giller, K.E.; Neergaard, A.; Magid, J.; de Ven, G.; Bruun, T.B. The effects of management practices on soil organic carbon stocks of oil palm plantations in Sumatra, Indonesia. J. Environ. Manag. 2020, 278, 111446. [Google Scholar] [CrossRef]
- Balasundram, S.K.; Robert, P.C.; Mulla, D.J.; Allan, D.L. Spatial variability of soil fertility variables influencing yield in oil palm (Elaeis guineensis Jacq.). Asian J. Plant Sci. 2006, 5, 397–408. [Google Scholar] [CrossRef]
- Behera, S.K.; Rao, B.N.; Suresh, K.; Manorama, K.; Ramachandrudu, K.; Manoja, K. Distribution variability of soil properties of oil palm (Elaeis guineensis) plantations in southern plateau of India. Indian J. Agric. Sci. 2015, 85, 1170–1174. [Google Scholar]
- Rhebergen, T.; Fairhurst, T.; Whitbreadd, A.; Gillerb, K.E.; Zingore, S. Yield gap analysis and entry points for improving productivity on large oil palm plantations and smallholder farms in Ghana. Agric. Syst. 2018, 165, 14–25. [Google Scholar] [CrossRef] [Green Version]
- von Uexkull, H.R.; Fairhurst, T.H. Fertilizing for Higher Yield and Quality The Oil Palm; IPI Bulletin No. 12; International Potash Institute: Bern, Switzerland, 1991. [Google Scholar]
- BLRS. Annual Report 1997. Agronomy, Crop Protection; PT PP London Sumatra Indonesia Tbk Pusat Penelitian Bah Lias-Bah Lias Research Station: Jakarta, Indonesia, 1997; Volume 1. [Google Scholar]
- Kovács, A.; Kincses, I.; Vágó, I. Effects of nitrogen and different n:s ratio on yield and nutrient uptake of mustard (Sinapis Alba L.). Cereal Res. Commun. 2007, 35, 201–204. [Google Scholar] [CrossRef]
- Lee, C.T.; Rahman, Z.A.; Musa, M.H.; Norizan, M.S.; Tan, C.C. Leaf nutrient concentrations in oil palm as affected by genotypes, irrigation and terrain. J. Oil Palm Environ. 2011, 2, 38–47. [Google Scholar]
- Foster, H.L. Assessment of oil palm fertilizer requirement. In Oil Palm Manage-ment for Large and Sustainable Yields; Fairhurst, T., Hardter, R., Eds.; PPI, PPIC and IPI: Singapore, 2003; pp. 231–257. [Google Scholar]
- Pasuquin, J.M.; Cock, J.; Donough, C.R.; Oberthür, T.; Rahmadsyah; Lubis, A.; Abdurrohim, G.; Indrasuara, K.; Dolong, T.; Cook, S. Leaf nutrient analysis as a management tool in yield intensification of oil palm. Better Crops 2014, 98, 18–21. [Google Scholar]
- Fairhurst, T.H.; Mutert., E. Interpretation and management of oil palm leaf analysis data. Better Crops Int. 1999, 13, 48–51. [Google Scholar]
- Prabowo, N.E.; Tandiono, T.J.; Foster, H.L. Identification and evaluation of problem fields—An implementation of a yield prediction tool based on palm data. In Proceedings of the International Oil Palm Conference, Yogjakarta, Indonesia, 1–3 June 2010. [Google Scholar]
- Black, C.A. Crop yields in relation to water supply and soil fertility. In Plant Environment and Efficient Water Use; Pierre, W.H., Kirkham, D., Pesek, J., Shaw, R., Eds.; American Society of Agronomy, Crop Science Society of America, and Soil Science Society of America; Wiley: Madison, WI, USA, 1966. [Google Scholar] [CrossRef]
- Behera, S.K.; Shukla, A.K.; Suresh, K.; Manorama, K.; Mathur, R.K.; Kumar, A.; Harinarayana, P.; Prakash, C.; Tripathi, A. Oil palm cultivation enhances soil pH, electrical conductivity, concentrations of exchangeable calcium, magnesium and available sulphur and soil organic carbon content. Land Deg. Dev. 2020, 31, 2789–2803. [Google Scholar] [CrossRef]
- Senbayram, M.; Gransee, A.; Wahle, V.; Theil, H. Role of magnesium fertilizers in agriculture: Plant-soil continuum. Crop Pasture Sci. 2015, 66, 1219–1229. [Google Scholar] [CrossRef]
- De Boer, A.H. Potassium translocation into the root xylem. Plant Biol. 1999, 1, 36–45. [Google Scholar] [CrossRef]
- White, P.J.; Broadley, M.R. Calcium in plants. Ann. Bot. 2003, 92, 487–511. [Google Scholar] [CrossRef] [PubMed]
- Samet, H.; Cikili, Y.; Dursun, S. The role of potassium in alleviating boron toxicity and combined effects on nutrient concentrates in pepper (Capsicum annum L.). Bulg. J. Agric. Sci. 2015, 21, 64–70. [Google Scholar]
- Hou, W.; Tränkner, M.; Lu, J.; Yan, J.; Huang, S.; Ren, T.; Cong, R.; Li, X. Interactive effects of nitrogen and potassium on photosynthesis and photosynthetic nitrogen allocation of rice leaves. BMC Plant Biol. 2019, 19, 302. [Google Scholar] [CrossRef] [PubMed]
- Aulakh, M.S.; Malhi, S.S. Interactions of nitrogen with other nutrients and water: Effect on crop yield and quality, nutrient use efficiency, carbon sequestration, and environmental pollution. Adv. Agron. 2005, 86, 341–405. [Google Scholar] [CrossRef]
- Koohkan, H.; Maftoun, M. Effect of nitrogen– boron interaction on plant growth and tissue nutrient concentration of canola (Brassica napus L.). J. Plant Nutri. 2016, 39, 922–931. [Google Scholar] [CrossRef]
Publisher’s Note: MDPI stays neutral with regard to jurisdictional claims in published maps and institutional affiliations. |
© 2022 by the authors. Licensee MDPI, Basel, Switzerland. This article is an open access article distributed under the terms and conditions of the Creative Commons Attribution (CC BY) license (https://creativecommons.org/licenses/by/4.0/).