Abstract
Information is at the heart of the smooth running of a public transport network and the satisfaction of its users, particularly in disrupted situations. Information is a central element for users to continue to use this mode contributing to sustainable mobility and even attracting new users. Therefore, it is essential to understand how travellers use passenger information to adjust the way it is disseminated to actual usage. This article aims to identify the sources of information used by travellers and at what moments they consult them in order to categorise passengers according to these activities. We conducted an online questionnaire on 258 regular suburban train users of a specific branch of one particular line (with the same information material in the stations). In addition to univariate descriptive analyses, the results were analysed using Multiple Correspondence Analysis and Ascending Hierarchical Clustering to construct six information-seeking profiles named: Improvisers, Monitors, Planners, Circumscribed, Ultra-connected and Routinized. Based on clustering, we were able to link sociodemographic or travel characteristics to information-seeking behaviour. Differences in information acquisition and use were identified. These results suggest great information-seeking behaviour disparities and can provide interesting information to passenger transport stakeholders. The results could be further integrated into a multi-agent simulation.
1. Introduction
The current transportation sector has detrimental economic, social and environmental impacts, e.g., nearly one-third of global CO2 emissions come from the transportation of people. The development of efficient public transport systems is compelling for achieving Sustainable Development Goals (see, e.g., SDG 11 “Sustainable Cities and Communities” [1]), for example, by engaging decarbonization with the deployment of electric mobility, but also by inducing passengers to shift from private vehicles to public transport (PT). Such a behavioural shift requires that users perceive PT as reliable and trustable and associate their use to an optimal travel experience even when difficulties like congestion or disruptions occur. Furthermore, travel experiences also affect the persistence to use PT. In this context, the information provided to or acquired by passengers has been shown as being crucial for users’ satisfaction and experience [2,3]. Actually, the physical and mental comfort experience of citizens using PT linked, among many other aspects, to quality and accessibility of information, has been one indicator (amongst others) to assess the sustainability of urban mobility [4]. Traveller information meets two major challenges in a busy transport system like the Greater Paris Region (Ile-de-France) area where about 9.4 million trips are made every day, mostly by commuters [5]: on the one hand, distributing flows efficiently for the operator, and on the other, providing a pleasant travel experience for the user.
Traveller information refers to a broad set of information dedicated to supporting trip planning or execution [6], delivered possibly through various media (face-to-face, digital, speakers or paper-based) and in multiple formats (text, graphics or audio). The information available to travellers can be either static or dynamic. Static information is not subject to rapid change and is most often found in the physical environment of the station (e.g., maps or timetables). It covers a wide range of contents from available transport modes and their schedules to cost. Dynamic information refers to information likely to be updated at any time, e.g., due to the occurrence of an event on the network. Coupled with the evolution of personal devices, recent technological developments allow for more accurate real-time information (RTI) on the status of the network (vehicles and passengers) [3]. Furthermore, travel information can be personalised and made increasingly available to travellers, in addition to the information broadcasted in the station [7,8]. Nowadays, PT users have access to information on personal devices even when they are not physically in the station (also called ubiquitous information by Islam and Fonzone [9]), allowing more spatial and temporal flexibility [10]. Besides, information may be official or unofficial as the information may come from the transport operator, from the traveller’s own experience, or from relatives, friends or other travellers [11] also, for example, through social media. As a result, passengers (if they have a smartphone) have an extensive range of information sources at their disposal, which evolve continuously based on the availability and adoption of new technologies by a larger public [12]. Therefore, there is a need for renewed studies on the use of different information sources by PT users on their regular trips.
The study presented in this paper examines the use of passenger information among regular users of the same train line, to address the current gaps in the literature (as explained in the following section). The contribution of this work is described below:
- -
- First, we investigate passenger information in its real variety and complexity, by considering all the sources of information actually used either individually or in combination.
- -
- Second, we examine the nature of information and the way it is used at each step of a regular trip—pre-trip, on-trip and monitoring phases—as well as when a disruption occurs or not.
- -
- Third, we characterize six distinctive profiles of passengers related to their information-seeking behaviours.
A questionnaire was designed for that purpose and administered online to a sample of 258 regular users of a north-western train line in the Paris–Ile de France area. The collected data were used to build user profiles according to their information-seeking behaviour, travel and sociodemographic characteristics. The study presented here is part of the IVA (Augmented Travel Information) project, which aims to enhance passenger information in PT. The objective is to provide digital decision-making tools for passengers as well as for transport operators to improve, respectively, the travelling experience and the monitoring of transportation network, notably in disrupted situations. The available results of the project concern predictive models of passenger flows based on machine learning techniques [13], the prediction of passenger loads on trains [14], and the design of a data visualisation tool to jointly analyse train circulation and passenger flows [15]. Only elements related to information-seeking behaviours are reported hereafter.
The text is organised as follows. Section 2 gives an overview of the literature about the use of traveller information before and during a trip under normal and disrupted situations and highlights the gaps in existing research. Section 3 describes the case studied, the research method, procedure, recruitment and the statistical analysis conducted. Section 4 presents our findings and Section 5 the discussion. Section 6 concludes by describing the main contributions, limitations, and further perspectives.
2. Literature Review—Traveller Information in Trip Planning and Execution
2.1. Trip Steps and Information Needs
Making a trip involves both the planning of a route and its execution. Planning refers to identifying at least one possible route (mode, connection, travel time…) from an origin to the destination and deciding which route to take, considering various constraints such as time, cost, context or personal preferences (see Ref. [16]). Considered as a preparation phase, this step has also been called pre-trip by some authors because it is usually done in advance, at home or at work, for example ([2,17,18]). Execution refers to the realisation of the planned route and has been called the on-trip stage [2,17]. Patesson and Lecomte [17] also considered a post-trip phase in which the user acquires experience of his or her trip.
Research has suggested that the need for, and use of, travel information depends on the stage within the trip [17,18,19,20]. In planning, travellers seek the necessary information that will enable them to choose and to execute the route that satisfies their goals and constraints. In execution, Grotenhuis et al. [18] distinguish between in-station phases, where the user seeks information on train traffic (e.g., for a connection) and on-board phases (i.e., within the transport mode), where the user seeks information to ensure that his or her journey is carried out correctly (e.g., absence of disruption).
Information needs also depend on users’ familiarity with the route. Regular users (for example, commuters) do not (or only seldom) seek information at pre-trip [6,19] as they already know the route and subsequently rely on heuristics and habits due to its frequent repetition [21,22]. Similarly, regular users consult very little information during the trip [6]. In contrast, users seek information when the trip is unfamiliar, unpredictable or when they have time constraints [23].
2.2. Traveller Information Usage under Normal Conditions
Most of the work carried out on the use of RTI over the last 15 years has aimed to identify either its benefits or its impacts on users’ behaviour. For example, Cats et al. [24] suggested that information provision could be beneficial to PT users so that they can adapt their trip. Brakewood and Watkins [25] reviewed recurring benefits in the literature such as a decrease of perceived and actual waiting time, a decrease of the overall travel time due to change in path choice, and an increase in user satisfaction with transit service. Furthermore, RTI can be an effective way of encouraging passengers to shift from private to public transport [3] However, empirical studies of impacts have mostly focused on route choice by car drivers rather than on PT passengers’ choices [9].
Only a few studies have explored users’ behaviour related to the use of information media [3]. They mostly consider information or PT modes as a whole, sometimes distinguishing RTI from static information. Islam and Fonzone [9] showed that 85% of bus users use travel information, among which 56% use at least one source of RTI. Some studies are looking at different sources of information but not at their combination [26]. The need for more studies about the variety of sources used and their combination is commonly advocated [27,28]. Fonzone [27] shows that official displays and apps or websites are the most popular sources. Journey planners are used by about 10% of the users. This author also highlights joint uses of several media such as the web page and a written document or the web page and Google maps. From the author’s point of view, the first combination would be a confirmation of web information and the second a coupled use of descriptive (official website) and prescriptive (Google maps) information. Ben-Elia and Avineri [29] suggested these information categories. They put forward a clustering of traveller information in three non-exclusive categories: experiential information retained in memory, descriptive information prevailing in travel conditions and finally prescriptive information providing guidance on recommended alternatives.
Maréchal [28] looked at the portfolio of sources used, linked with the characteristics of the PT users and the characteristics of their familiar trips. The author showed that the most popular sources are Google Maps and the TfL (transport operator in London) tools. PT users also used various apps from different providers. Moreover, the sources used differ depending on the experience of the user with the PT service: for example, more experienced users checked less on the operator’s trip planner. For Harmony and Gayah [12], smartphone apps are the preferred medium for receiving information for the users followed by websites and displays but users’ preferences differ depending on demographic and socioeconomic characteristics. For example, older respondents (over 55) have a lower preference for apps and websites relative to younger people (from 18 to 24). This study has limitations, however, as audio announcements, as well as the combinations of information sources, are not considered. Macedo et al. [3] also observe that older people prefer displays while younger people are more interested in applications. In general, it has been shown that older seniors (over 75) are less likely to own a smartphone [30]. Furthermore, seniors that possess a smartphone can optionally have trouble when using it or other technological devices to retrieve traveller information [31].
Very few studies analyse the link between the stage of the trip and the sources of information used. Rahman et al. [32] explored the pre-trip and on-trip stages and found that users prefer to use the website and the call centre in the pre-trip stage while they prefer the display in the on-trip stage. More recently, Mulley et al. [33] analysed specifically the used sources as a function of the stage of the trip, the frequency of PT use and the users’ sociodemographic characteristics. Based on a sample of 172 regular users, they highlighted an age-related digital divide. Indeed, in the pre-trip phase, people over 50 were less aware of Google maps and social networks such as Twitter and Facebook. They were more likely to use the internet and timetables.
Some studies specifically target certain sources of information. This is the case, for example, of social networks. Nikolaidou and Papaioannou [34] studied the frequency of use of social networks, in which way they are used (social media, motives for use related to mobility) and the impact of social networks on travellers’ behaviour. In their study, in Greece, 64% of participants (mostly young and in higher education) receive travel information via social networks. Twitter, especially, is frequently used by transport operators to disseminate public RTI [35,36]. However, this type of source raises issues of intergenerational and social equity as it has been shown that social network users are not representative of the general public [37] since they are younger and more educated. Passenger Focus and Abellio [38] found through focus groups that in the context of passenger information, Twitter is considered as a complementary channel to more traditional information sources.
Finally, Ben-Elia and Avineri [29] emphasise that, for the traveller, the problem is less about having access to information than being able to process multiple sources of disconnected information and making sense out of it.
2.3. Where Do Travellers Acquire Information from during Disruptions?
Individual determinants and behavioural responses to unexpected PT disruptions are still not fully understood [39]. A small part of the research on passenger information has focused specifically on disrupted situations, a situation in which information plays an even more important role [40,41]. A better understanding is consequently necessary [42]. Existing studies focus on the impacts of RTI on users rather than on the sources, the moment of their acquisition and their use in the course of the disruption to support decision-making.
Several studies suggest that relevant RTI about the network status, traffic recovery and possible alternatives available is the most effective way to reassure and reduce passenger anxiety [43,44,45]. Indeed, as pointed out by Tsuchiya et al. [46], passengers have difficulties in identifying an alternative when a disruption occurs because of the lack of relevant information. Studies by Passenger Focus [47] or Bachok [48] suggest that the information currently provided by the transport operator is insufficient from the users’ point of view and specify that users expect more from the operator. During a disruption and depending on its location, RTI can play a major role for travellers, since alternatives shrink as the journey progresses and therefore, receiving the information of a disruption as soon as possible allows the travellers to manage their trip better [49,50].
Kattan et al. [51] tried to model drivers’ response to RTI in the case of a long-term disruption. The source most used by drivers was radio (58%) followed by variable message signs (16%). Drabicki et al. [39] looked at the use of travel information once the PT users encounter sudden service disruption in Krakow (Poland). They differentiated the sources according to the moment in the course of the disruption: to recognize the disruption itself and then to manage it. They showed that the largest proportion of participants does not use information to identify the presence of a disruption (34%). Next, displays were most often the origin of the discovery of the disruption (26%), followed by the transport company’s staff (20%). During the disruption, the smartphone and the displays were used with an equal frequency (75% at least sometimes), while the printed timetable was less used (45% at least sometimes). The study by Transport Focus [52] shows the role of several media in the detection and resolution of a disruption. First, the main board helps to see at a glance whether a disruption is affecting many services. On the way to the station, the smartphone allows the users to keep up to date with likely delays to their trip. If the disruption is severe, the announcements, smartphones and the station staff may be consulted. The users consider displays as the most up-to-date information source, more than online sources. To our knowledge, there is only one study that links the consultation of information in normal and disrupted situations. Maréchal [28] considered both situations from the same information sources in the context of regular travel. She showed that generally speaking, a disruption is discovered through the source that is most frequently consulted in a normal situation, as well as through the information panels in stations or the observation of an overcrowded station.
Few studies have focused on the use of social media during unplanned transit network disruptions [45]. In the absence of official information, some users may turn to social media and get in touch with other users to seek information. Lindsay [52] suggested that information given by social network users during a disruption is generally accurate, and Bregman [53] added that users trust information from peers.
2.4. Research Gaps and Research Questions
Reviewing the available literature on passenger information in PT enables us to identify some gaps, especially the lack of precise and in-depth analyses of real-life situations targeting the use of real information by specific users in concrete travel contexts. Indeed, existing studies mostly consider passenger information as a whole under the label “real-time information”, while some other studies focus on a subset of sources without taking into account other available sources. We, therefore, considered combinations of all existing sources, whether they are official or unofficial, dynamic or static, digital or physical, visual or auditory.
Secondly, existing studies tend to consider the use of information independently of the moment and the course of the journey or even the direction of this journey (from or to home). It is essential, however, to consider the sources used at different moments in the planning and execution of a specific journey in order to obtain a clear picture of commuter train users’ practices. Therefore, we have taken particular care to place the user in a specific moment of his journey for interviews, and we have kept this logic in our multivariate analysis by creating profiles that relate to the sources used in the different stages of a journey. Our review also reveals that the use of passenger information is less studied among train users than among bus users, who are themselves much less studied than drivers. Sometimes PT is considered as a whole, whereas each mode (or even each line) has its own specificities in terms of frequency or available information media. Our study, therefore, focuses on commuter train users on a particular branch in order to limit these variabilities in service quality or information.
Furthermore, the existing literature is rather focused on the normal travel situation, even if some references mention disruptions. Very few studies combine these two situations to clarify the use of passenger information.
Another gap identified in the literature concerns the characteristics of surveyed users. Regular users are scarcely differentiated from occasional users. Most often, information about the use and familiarity of users with the PT service is missing. However, regular users differ from other users, at least because they behave consistently from one trip to the next and, in principle, use a consistent decision-making process [28]. Therefore, this study focuses on regular users and their most familiar trips.
Finally, as mentioned above, the constantly changing information sources and the changing practices of users require frequent updating of the studies. Many previous studies do not consider social networks or audio announcements, for example.
Following the identification of these gaps, our research questions are as follows:
- What are the sources of information actually used by regular commuter train users?
- Do these sources vary according to the stage or the direction of the trip?
- Do these sources vary according to the sociodemographic characteristics of the users or to their travel patterns?
- Do these sources vary according to whether the trip is made in a normal or disrupted situation?
We will address these questions in two ways, first by treating each question of the survey separately and then by combining all the available results in a descriptive multivariate analysis with the aim of constructing profiles of passenger information use.
3. Materials and Methods
3.1. The H Line and the Branch Paris-Nord/Pontoise
The H line is operated by the French railway operator SNCF between 5 a.m. and 1 a.m., every day of the year. The train line serves the north-western part of the Île-de-France, essentially the Val-d’Oise department. H line of the Transilien serves fifty-one communes located in four departments (Paris, Seine-Saint-Denis, Val-d’Oise and Oise). It has 138 kilometres of lines served by 476 daily trains each weekday. It carried an average of 259,985 passengers each weekday in 2019 (https://ressources.data.sncf.com, accessed on 14 January 2022). In October 2021, the line had a punctuality rate of 91.8% (https://ressources.data.sncf.com, accessed on 14 January 2022). A passenger is considered late if he/she arrives 5 minutes or more after the scheduled time. This percentage corresponds to the share of passengers arriving on time.
One of its branches goes from Paris Nord (Paris) to Pontoise (Val-d’Oise) (Figure 1).
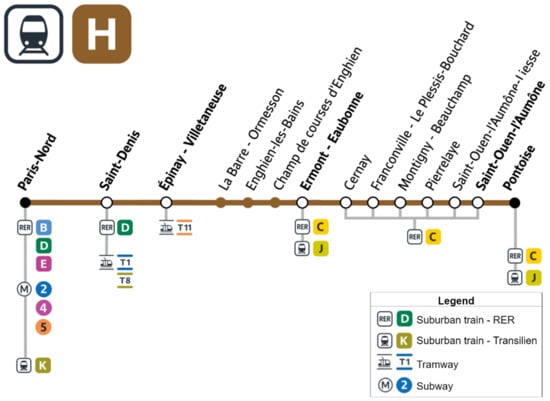
Figure 1.
Field of study—H line, Branch Paris Nord-Pontoise.
This branch is of particular interest because it offers many possibilities of rerouting in case of disruption, which are shown in Figure 1; see the connection possibilities to metro, tram and other railway lines. We assume that this rerouting involves consulting information.
Passenger information on H line is centrally managed by the Paris-Nord Passenger Information Centre (CIV). In addition to the paper timetables at the station and the staff present, it provides users with audio announcements, real-time screens on platforms and in stations, information available on the SNCF mobile application and website, and the official Twitter account. Moreover, users can subscribe to receive automatic notifications of disruption for the timetables and branches of their choice. There is also a Facebook page run by line users since 2010, which is used to disseminate information by its administrators and subscribers. The official H line blog is not used for passenger information but rather for explanations or general information. In addition to all these sources of information directly linked to the operator or the line, users can also use other sites or applications from other public or private information providers such as RATP, Citymapper, Google Maps or Île-de-France Mobilités.
3.2. Material
A questionnaire was drafted based on the current state of knowledge about information acquisition and information devices. It was tested twice with 5 participants, and wording was modified accordingly to ensure that the questions and suggested answers were well understood and unbiased.
The entire questionnaire took an average of 20 min to be completed. The questionnaire started with a few filter questions on the use of the H line. Then, participants were asked about how they acquire traveller information (subscription to alerts, pre-trip and on-trip consultation, information consulted during a disruption), about their commute trips (origin, destination, access and mode, solutions deployed in the event of disruption, perceived level of knowledge). Individual characteristics were finally collected. In this paper, we focus on the specific parts of the questionnaire dedicated to the suburban train passengers’ information acquisition behaviour and individual and trip characteristics. All the variables used are presented in Table 1.

Table 1.
List of variables considered.
3.3. Participants
The questionnaire received 648 responses, of which 258 were complete. The sample is therefore made up of 258 regular H line users (at least 3 days a week), 69% of whom are women. Thirty-one percent of the respondents are between 15 and 35 years old, 37% are between 36 and 50 years old, and 32% are over 51 years old (M = 43, SD = 13). Forty-nine percent of the sample belongs to the upper professional category (manager), 40% are in the lower professional category (workers and intermediate professions) and 11% were inactive (students, retirees and job seekers). Seventy-seven percent have an educational level above the baccalaureate. Women and upper socio-professional categories are overrepresented in our sample compared to the representative profile of PT users. According to the latest global transport survey [54], train users in Île-de-France are as much women as men, and the majority are in the 25 to 54 age group. Among the working population, managers are the most likely to use the RER and train (32%), followed by intermediate professions and employees (27% each). In total, 18% of users are students, 7% unemployed and 5% retired. Ninety-one percent of the respondents live in the suburbs and commute to Paris in the morning. Thirty-nine percent live with a partner, and 23% have a dependent child.
3.4. Procedure
The questionnaire was administered online for three weeks (from 4 November to 24 November 2019) with the tool MyFeedBack, as it is compatible with all devices (computer, smartphone, and tablet). Regular users of the H line were recruited through 4 mediums: a dedicated mailing list (6400 users who agreed to be contacted), official H line Twitter account, official H line blog, and the non-official Facebook group devoted to H line users. Participants were screened on the basis of having a regular trip on the line, i.e., defined as repeated at least 3 times a week.
Prior to its deployment, the procedure and the materials for the study were validated by the Eiffel University’s Data Protection Officer as compliant with the rules laid down by the General Data Protection Regulation.
3.5. Analysis Method
The questionnaire items essentially consisted of nominal categorical variables with a finite number of categories or response modalities. Firstly, a descriptive analysis for every variable was conducted with SPSS Software. Then, a multiple correspondence analysis (MCA) was conducted with SPAD Software.
MCA is especially appropriate for analysing categorical data [55,56]. MCA is a factorial method that seeks optimal projections to summarise a dataset by exploiting the redundancy between the variables. The difference between the better-known principal component analysis and MCA is the nature of the data processed. MCA is performed by applying the correspondence analysis algorithm to a Burt table. By assigning scores to rows (representing the subjects) and columns (representing response categories), MCA identifies and represents underlying structures in the data set in a geometric space. MCA is mainly descriptive [57] and is suitable for small samples because correspondence analysis is based on relative values. The number of dimensions is determined by examining a scree plot of eigenvalues to identify the elbow in descending sequences. The interpretation of the retained axes is based on the modalities whose contribution exceeds their relative weight. The MCA results were then used for clustering based on an Ascending Hierarchical Clustering (AHC) method.
The results of the MCA were used to define homogeneous groups of passengers by using the Ward aggregation index. At each step of the clustering, the two closest individuals are grouped to build a hierarchical tree (dendrogram). It is possible to examine the form of the dendrogram to select the optimal segmentation. The interpretation of clusters relies on over- and underrepresented modalities by comparing the relative frequency of the modality in the cluster and the frequency in the whole set [57].
4. Results
4.1. How Do Users Acquire Information during the Pre-Trip Phase?
4.1.1. Acquisition of Information during the Pre-Trip Phase
Thirty-one respondents (12%) reported that they did not consult (or rarely) any information before making a trip, while the remaining 227 users (88%) reported using one or more digital sources (Figure 2). Subscription to alerts was the dominant source used by 2/3 of the sample, and was systematically part of the most frequent combinations whatever the number of sources actually used. Then, the two most quoted sources of information were the operator’s application and website (respectively used by 55% and 45% of participants). The other sources were far less used, ranging from 25% (other provider applications) to 3% of users (other websites, e.g., Google Maps) (Appendix A, Table A1). The social media Twitter was reported by 17% of the users, while only 8% of participants reported using Facebook.
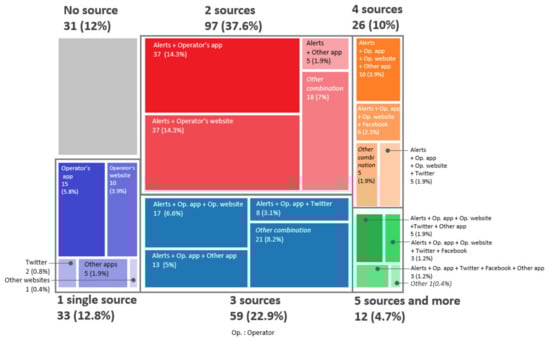
Figure 2.
Variety and combination of digital sources reported being used at pre-trip step by participants (n = 258). Frequencies are displayed by types of sources and number of sources used in combination. The most 3 frequent combinations found are indicated for each combination size.
On average, users who consult information pre-trip consult 2.5 sources of information; the combination of two different sources was indeed most frequently observed, corresponding to slightly more than 1/3 of the participants (Figure 2). More than half of the users use two or three sources in combination. Interestingly, one can see a continuous pattern across the various combinations (Figure 2): the combination of two sources can be predominantly described as the association of alerts with either the operator’s app or its website. In the case of three sources (22.9%), the main pattern is based on using both alerts and the operator’s app in association with either the operator’s website, another app or Twitter. When four sources are reported (10%), the main combination is based on the alerts coupled with both operator’s app and website, to which either another app, Twitter or Facebook is added. Lastly, when five or more sources are used (4.7%), the predominant pattern associates alerts, operators’ apps and Twitter, with the addition of either the operator’s website, another app or/and Facebook. The case of only one single source corresponds actually to users that do not use alerts in association even when these are available on the used source (e.g., operator’s app).
Globally, these data suggest that alerts and active consultation of an official source (such as the operator’s app or website) are privileged, especially the various sources offered by the transport operator, regardless of the number of sources consulted. In most cases, several sources offered by the operator are even consulted. However, applications offered by other providers are also consulted, as well as new social media to a lesser extent. Lastly, most combinations include sources specifically designed for smartphones, these applications appearing to be preferred to websites.
4.1.2. Acquisition of Information during the On-Trip Phase
The results obtained for consultations of in-station information are consistent among the participants. Whatever the destination (i.e., work or home), 96% of the users indicated that they consult information on displays and 93% indicated that they pay attention to the audio announcements. This is contrasted with the consultation of information on smartphones to check that the trip is running smoothly: only half of the participants (52%) check the traffic situation on their smartphone or tablet as they go along their usual route in both directions (53% to work and 55% from work).
4.1.3. Awareness of the Disruption and Complementary Acquisition of Information
When a disruption occurred, slightly more than 50% of respondents reported recognising the disruption through either the official operator’s application and website (28%) or screens in the station (24%). The reported percentages for alternative applications and websites (13%), audio announcements (13%), social networks (11%) and other transit users (10%) were equivalent. Operator employees exhibited the lowest percentage (1% of the respondents).
Seventy-three percent of the respondents reported that they sought complementary information after being informed about a disruption. They mostly use digital sources such as applications or websites (39%) and social networks (11%) but also displays (13%). The other information supports are less used: 5% of users indicated that they refer to audio announcements, 3% to operator staff and 2% to other travellers to investigate further.
4.2. Multivariate Analysis: Are There Distinctive Profiles of Information Users?
Since passenger information-seeking behaviours vary greatly depending on the stage of the journey and whether the situation is normal or disrupted, it was essential to carry out a multivariate analysis to identify whether recurring behaviours could be observed in the form of profiles.
4.2.1. Identifying the Structure of the Data Using the MCA Method
The MCA was run with five active variables (Table 1; representing 24 categories): pre-trip information acquisition, pre-trip sources of information, on-trip information-seeking, source of acquisition of disruption and complementary source of information during a disruption. We also added six supplementary variables from the questionnaire (Table 1; representing 15 categories): age, occupation, education, working hours, travel time, display use in the station, and subscription to alerts. We decided to introduce some of the information variables only as illustrative variables because they are too commonly shared within our sample not to influence the shape of the data too significantly. The MCA was followed by an AHC to define the segmentation of the transit users according to their information-seeking behaviour and to explain which individual characteristics could influence these behaviours.
The MCA results (Table 2) show that axes 1 and 2 explain most of the differences between the behavioural patterns in our sample. Although there is a substantial drop in the eigenvalues after the first axis, the results prompted us to choose three axes rather than two because of the “consultation of official website”, “consultation of Twitter” and “monitoring of the trip” variables are mainly present on the third axis. Overall, the first three axes explained 35.1% of the variance. The axes are interpreted based on the modalities whose contribution exceeds their relative weight (Table 3). In our case, four variables and twenty-three modalities can be summarised through three axes, each of them with two poles.
Table 2.
Results of the MCA, histogram of the first four eigenvalues.
Table 3.
Results of the MCA, relative weight and contributions of active variables (values in bold are used for the interpretation of the axis and in brackets, the side of the axes concerned).
In addition to the contributory modalities of the variables, the projection of illustrative variables on each factorial plane provides additional information to support our interpretation of the axes. Modalities with a test value greater than 2 in absolute value were retained. It corresponds approximately to a 5% threshold of statistical significance [58] (Table 4).
Table 4.
Modalities of illustrative variables.
Axis 1 opposes a connected information-seeking behaviour on social networks, monitoring and subscription to alerts to lack of consultation prior to travelling and lack of monitoring. Younger transit users are situated on the negative side, while older transit users are situated on the positive side. Axis 1 can be interpreted as contrasting an intensive information-seeking behaviour through digital tools and particularly through social networks (negative) with limited information acquiring information through other users or from in-station devices only during the on-trip phase of the trip (positive).
On axis 2, subscription to alerts, information-seeking on the operator’s official tools during disruption are opposed to lack of pre-trip information acquisition, absence of consultation of the screens in the station and learning about a disruption through crowdsourced sources (other users in the station and social networks). This axis can thus be interpreted as contrasting interest for official sources (negative) with the rejection of official sources (positive).
Finally, axis 3 contrasts repeated consultation of the official information sources at different stages of the trip (negative side) with the behaviour of not consulting information before leaving, at the station, as the journey progresses (positive side). Only the individuals on the negative side of the axis are characterised. They are aged 51 and over and have long journeys (greater than or equal to 65 min). We can consider that axis 3 opposes monitoring behaviour (negative) to crowd-based and opportunistic information acquisition (positive).
4.2.2. Clustering of Travellers according to Their Information Consultations Using AHC Method
We applied an AHC method and the Ward aggregation index to define groups of passengers with similar information-seeking behaviour. The method starts by calculating the dissimilarities between every user and then, at each step of the clustering, the two closest users are grouped. When all users have been aggregated, the clustering is represented in the form of a dendrogram (Figure 3). Then, the aim is to segment users by highlighting different groups of transit users according to their information-seeking behaviour, individual-specific (age, socio-occupational group, education) and trip-specific characteristics (travel time, working hours). The AHC suggests that it is possible to partition our data set into three to six clusters. We considered that the finest partition, consisting of six clusters, was the best. Firstly, partitioning into three clusters does not seem to sufficiently differentiate the users in our pool. Secondly, we observed a gain in intra-class inertia between a distribution in four clusters compared to a distribution in six clusters. Lastly, partitioning users into six clusters results in clusters of sufficient size, varying from 12 to 58 users (Table 5).
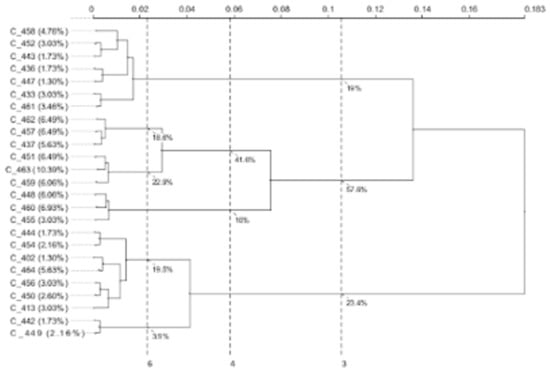
Figure 3.
Dendrogram of information usage classification.
Table 5.
Characteristics of the identified clusters (values in bold represent overrepresented modalities and values aligned left represent underrepresented modalities).
These clusters represent six profiles of users based on shared typical behaviours and the associated characteristics and travel patterns. It should be noted that the names of the clusters are interpretations on our part based on the modalities that are over-represented in them:
- Cluster—Improvisers (14%) are characterised by a lack of consultation of information prior to a trip. They learn of a disruption thanks to displays in the station or from other users. Users in this class are mostly middle-aged with an educational level higher than a bachelor’s degree.
- Cluster 2—Monitors (23%) are defined by frequent consultation of official information. This class subscribes to alerts, consults information on the operator’s website or app during a disruption and monitors the smooth running of its trip. The information collected when they become aware of the disruption, via the SNCF application, is sufficient for them because they do less additional research than the others.
- Cluster 3—Planners (25%) consult information pre-trip through the official app but they also use non-official websites or apps when faced with a disruption. They also rely on in-station devices. The majority of planners do not monitor the smooth running of their short trips.
- Cluster 4—Circumscribed (16%) seek information on the official website before making a trip and are characterised by low use of applications and social networks. The majority of this class is over 51 years old.
- Cluster 5—Ultra-connected (17%) are mainly composed of young users, under 35 years old. This class is characterised by high use of different sources of information at the different steps of the trip, especially of social media and official apps. They are also characterised by their trip monitoring behaviour.
- Cluster 6—Routinised (5%) are characterised by their regular working hours. This class is particularly defined by its attachment to Facebook even though the official information is consulted in pre-trip on the website.
Regarding the information-seeking behaviour at different steps of the trip, we can see that five clusters share a common behaviour: they consult traveller information prior to a trip. These groups are: Monitors (23%), Planners (25%), Circumscribed (16%), Ultra-connected (17%) and Routinized (5%). Monitors and Ultra-connected are also defined by the use of information to monitor the smooth running of their trip during the on-trip step.
Regarding the sources, Ultra-connected and Routinized are characterised by their use of social networks at the different steps of the trip. Ultra-connected consults Twitter and Facebook while Routinized consult only Facebook when preparing a trip. The use of the information media offered by the operator is characteristic of all classes, but Improvisers favour the in-station information, Monitors, Planners and Ultra-connected favour the application, while Circumscribed and Routinized are rather interested in the website.
5. Discussion
5.1. How Do Travellers Acquire Information?
Contrary to the result obtained by Lyons et al. [6] stating that regular users do not consult pre-trip information or by Farag and Lyons [23] that these users consult information only for unfamiliar, unpredictable or time-constrained trips, our questionnaire revealed that the majority of the regular users surveyed consult information prior to a trip, mainly available on smartphones. Two-thirds of our respondents also stated that they subscribe to traffic alerts. This reflects at least partially the extent to which the digitalisation of services and data, phones and other portable devices permeate in both personal and professional areas. Indeed, the democratisation of internet access and the significant development of mobility tools during the last decade enable easier access to real-time ubiquitous information in PT [2,3,7,8].
Another possible explanation is that the smooth running of a trip is a major concern for regular users and encourages them to seek out information because of a lack of confidence in the quality of the transportation system and a fear of disruption. We note that social networks are also used as a source of information prior to a trip by two of our clusters, suggesting that users divert the concept of social networks and use it to obtain RTI, mainly about the state of the PT network on their route. This result is similar to those observed in Passenger Focus and Abellio [38]. However, there are still users who do not consult pre-trip information and do not subscribe to alerts (which are part of our Improvisers cluster) without this lack of consultation being linked to factors suggesting difficulties in accessing information [30,31] because the members of this cluster have a high level of education and are middle-aged. Nevertheless, we have shown differences between generations as some of our clusters are characterised by the age of their members. Older people do have limited use of travel information and less consultation of applications (Circumscribed), while younger people are very connected and fans of social networks and applications (Ultra-connected). These generational differences have already been identified on several occasions with some nuances depending on the panel of sources studied [3,12,33].
Some of our results are interesting about user practices and should be of interest to researchers and transport stakeholders. We found that the vast majority of H line users use several sources in combination (generally 2 or 3) before making their regular trip. While this result has already been shown (e.g., [27,28]), we add to the possible sources the subscription to alerts and social networks, which have been little studied (Pender and al. 2014). We showed that, most of the time, the absence of an automatic notification or email from the operator is not considered sufficient information to decide that there is no disruption. On the other hand, we were also able to show some confidence in official information as few sources from other providers or from users themselves are consulted alone (contrary to what was shown by Maréchal [28]) and almost all users pay attention to the information disseminated at the station. In this respect, our results are consistent with those of Fonzone [27].
Finally, the highlighted clusters reveal that the use of smartphone information in the pre-trip phase is linked with the use of smartphone information in all phases of the normal and disrupted journey. Those who get information from the official application or social networks continue to use these sources afterwards and have habits of checking the smooth running of their trip on their smartphone (Monitors, Planners and Ultra-connected).
5.2. How Is Information Used to Be Aware of an Ongoing Disruption?
Our results suggest that the acquisition of information prior to the trip is not enough to enable the user to determine if a disturbance is currently in progress. Only slightly more than half of our respondents learn about a disruption through applications, websites and social networks (52%). The other half tends to learn it from audio announcements, displays in stations, other transit users and operator employees. This result differs from that obtained by Drabicki et al. [39], showing that displays were the primary source of disturbance awareness in a specific city in Poland. This discrepancy could be related to differences in information provision between Poland and France, as the RTI system of Krakow City was still in its early development stages.
It would be logical for users to learn about a disruption from the source used to prepare their trip [28]. Our results suggest that even if almost all the service users subscribe to alerts and/or engage in active checking pre-trip, nearly half of them learn that a disruption is occurring when they arrive at the station (i.e., too late to implement a number of alternatives). It suggests that digital information is not disseminated quickly enough and does not reach users early enough to allow a good distribution of passenger flows.
Furthermore, our segmentation suggests that a significant proportion of passengers are unable to efficiently receive information about an ongoing disruption. Circumscribed tend not to use the most up-to-date tools to receive automatic information without specifically looking at it. As older users characterised this cluster, a possible explanation could be a lack of ability to use a smartphone for mobility or a lack of knowledge of what can be done with these tools. To counteract low application usage, Hounsell et al. [31] suggested that an application’s development should also target the specific needs of senior users.
5.3. How Do Travellers Seek Additional Information When Facing a Disruption?
Nearly three-quarters of our respondents indicate that they consult complementary sources of information after learning that a disruption is occurring. Apps, websites and social networks account for half of these complementary sources. These digital tools are characterised by their availability on smartphones, which gives them ubiquity [9]. Thus, wherever they are on the network, the users can obtain information without having to choose their position in relation to that of the physical information displays. In addition, unlike displays or audio announcements, applications and websites offer a built-in route planner and can offer customised alternative routes. There are several limitations to the use of this type of media. Firstly, they sometimes require expensive technological equipment and skill to use, which may exclude some users of PT networks, due to their income level, age or education level. Secondly, internet and online mobility services access are not easy on the entire network (and especially at Gare du Nord station).
Our results provide interesting insights into the operator’s information strategy. Currently, SNCF provides little information at stations about solutions for managing disruptions or even about the disruption itself. It encourages users to turn to the information available on the website and the application. We have shown that two out of six clusters do not follow this advice by seeking information from other media. As a result, the operator often lacks control over the information that is disseminated. We can suggest some explanations for this observation. One explanation could be that the users from these two clusters trust and rely on these sources of information [52,53]; indeed, the information could be considered as more up to date and social networks can have the advantage of providing more personalised information by asking them directly to people. In a way, social networks could compensate for the insufficient presence of the staff in stations. Another explanation could be that these clusters make extensive use of their smartphone for entertainment during their trip and learn about a disruption indirectly from social networks. Whatever the reason for this choice of crowdsourced information, it is in line with the importance to strengthen their presence on social networks for transport operators to follow the habits of their users.
5.4. Synthesis of Research Contributions: Answers to Research Questions
To conclude this discussion, we will quickly review the responses we are able to give to the research questions set out in Section 2.4.
Concerning the sources used by regular commuter train users (question 1), our results show that the use of information varies greatly between different users. Multiple official and unofficial sources are used, sometimes in combination with preferences for certain media among certain users (e.g., social networks, official sources, physical sources).
Concerning the variation of information use according to the step or the direction of the trip (question 2), our observations are in favour of a very broad consultation of information pre-trip as well as on arrival at the station. This usage is much less uniform when we question the monitoring of the smooth running of the trip. We have shown that the differences in the sources used are more related to the opportunities present in the space where the person is, as users generally use the same sources at different stages of their journey. For example, we have people who are more attached to the operator’s application, while others favour social networks.
Concerning the influence of sociodemographic characteristics or travel patterns on information sources use (question 3), some of our results show that information usage patterns are determined by certain characteristics of the user (age, level of education) and their travel pattern (regularity and travel time).
Concerning the influence of a disruption on information use (question 4), our results show that the disruption is too rarely discovered by the information source that is consulted before leaving. We interpret these results as a consequence of the lack of reactivity of the transmission of information on personal media rather than a trend to favour the use of different sources related to the disruption.
6. Conclusions
This section briefly reviews the contributions, implications, limitations and perspective of the research presented in this paper.
This research aimed at describing the use of information at all the steps of a trip in normal and disturbed situations by regular users of a specific branch of one suburban train line and at linking this use to sociodemographic and trip characteristics. Indeed, despite its critical importance in encouraging the use of a more sustainable mode of transport, few studies have looked at this issue. By analysing data from an online questionnaire, we have put forward interesting results for all transport stakeholders, filling in some of the gaps in existing research. We were able to explore some little-studied sources such as a subscription to alerts or social networks. We have provided a clear picture of the uses by regular commuter train users, with an identical information offer, in a real situation at different stages of the journey in normal or disrupted situations. Although this paper focused on an empirical study, the findings can be useful to other contexts related to the use of passenger information by regular rail passengers in suburban areas.
This research contributes to illustrating sustainability challenges for PT in several ways. In this paper, traveller information was investigated prior to the COVID-19 period. Nevertheless, we can imagine the contribution in the light of resilience during pandemic conditions. Note that while the long-term effect of the COVID-19 pandemic on the usage of PT by commuters remains unknown and uncertain [59], PT ridership dramatically decreased worldwide in the middle of the pandemic with a 50 to 90% drop-off was recorded at the time. In the meantime, this phenomenon was doubled by the mistrust of passengers towards PT along with a shift towards personal vehicles (for those who own one) and biking. Current challenges for PT operators include maintaining a high level of service while mitigating exploitation losses and avoiding situations where overcrowding stations could increase the risk of contamination [59]. To this end, traveller information and how it is acquired and used by users will continue to play a crucial role.
Beyond disrupted situations, real-time information could be augmented by sound content like occupation rates in order to make passengers feel less stressed during their trip, hence addressing the safety feeling of users indirectly. The information-seeking profiles could be updated with the aim to avoid overflow in stations and trains. It further allows designing targeted information contents on targeted sources so that the diversity of the passenger’s behaviours in PT are taken into account, which could, in turn, be tested through new empirical studies. Second, the clarification of profiles is useful to ensure all social groups are equally served when information is needed (in normal or disrupted situations). An important aspect for the PT provider lies in the diversity of sources to manage in all situations, not only focusing on official applications and websites but also considering crowdsourced and human channelled information.
This research has some limitations. The questionnaire was delivered online, which could explain the over-representation of upper socio-professional participants. This bias does not seem to have a significant impact, as neither gender nor socio-professional category emerged in the profiles even if those variables have been introduced as illustrative variables (for reasons of brevity, only the interesting variables have been presented here). This seems to indicate that these are not influencing factors in the use of passenger information. In addition, the measurement tool used also requires a limited number of questions in order to remain within an acceptable completion time. It should be remembered that the results presented in this paper concern only a part of the work carried out in the framework of this project. Moreover, when we designed the questionnaire, we did not include in the information available for the discovery of a disturbance the observation of station crowds or other cues. This is due to the fact that this questionnaire is linked to another explanatory interview study. We felt that this study would be more appropriate to identify the richness of the cues that make users say that there is a disruption in addition to information. Finally, we would like to return to the size of our sample. The descriptive methods we used are not sensitive to sample size. In fact, the results obtained can be considered of interest, as far as the organisation of the different behaviours within the profiles is concerned, but precautions must be taken with the distribution of these profiles within the population.
These preliminary results enable us to derive some recommendations for stakeholders in transport and information dissemination. Firstly, the wide variability in consultation patterns suggests that policies to multiply information dissemination channels should be pursued. A variety of mediums allows them to reach different populations according to their preferences or technological and skill constraints. Some channels should be further developed to keep up with changing user habits (e.g., social networks). Our results also suggest improving the responsiveness of pre-trip information dissemination and especially email or notification alerts, as we have shown that users are not satisfied with these to estimate the traffic conditions of their line. Studies such as ours could also help stakeholders make trade-offs between different investments in order to improve information. These results could be used in simulations to link the audience to a specific media to a message delivered and its behavioural consequences.
Finally, this study opens the way for many further explorations. First, this type of study needs to be replicated as the media and their use by transport users evolve. It could also be interesting to link the use of information to a particular piece of information sought or, more generally, try to explain the reasons for these uses in terms of content, reliability and speed of updating. Finally, we have already started work on linking ‘classic’ passenger information as described in this paper with the observations that the individual can make of the situation in order to identify and assess a disruption that we call ‘cues’ in order to understand their relative weight in decision-making. Further relevant work could be considered by comparing the use of passenger information between different types of public transport users (novice, occasional, regular). Comparisons between cities with the same level of deployment of real-time information could also allow a better understanding of the impact of the characteristics of the transport offer on the use of passenger information.
This study builds a brick of knowledge to model individual decision-making in PT, and more specifically, elicit the role of information in the decisions taken by travellers depending on their sociodemographic and trip characteristics. This work on information-seeking profiles is an expected piece of contributions to the modelling of passengers’ responses to information in PT, which still requires research effort as stated in Ben-Elia and Avineri [29].
Author Contributions
Conceptualisation, P.U. and S.A.; methodology, P.U. and S.A.; formal analysis, P.U. and S.A.; investigation, P.U. and S.A.; data curation, S.A.; writing—original draft preparation, P.U. and S.A.; writing—review and editing, P.U., S.A., F.V. and J.-M.B.; supervision, S.A., F.V. and J.-M.B.; project administration, S.A.; funding acquisition, S.A. All authors have read and agreed to the published version of the manuscript.
Funding
This research is part of the IVA Project (RM1_F15725), which aims to enhance traveller information and is carried out under the leadership of the Technological Research Institute SystemX, with the partnership and support of the transport organisation authority Île-de-France Mobilités (IDFM), SNCF, and public funds under the scope of the French Program ‘Investissements d’Avenir’.
Institutional Review Board Statement
The study was conducted in accordance with the Declaration of Helsinki. Ethical review and approval were waived due to the applicable legislation in France.
Informed Consent Statement
Informed consent was obtained from all the subjects involved in the study.
Data Availability Statement
Anonymous data can be provided on a simple request to the corresponding author.
Acknowledgments
The authors would like to thank all participants in the survey and especially SNCF Transilien for its support in providing access to the participants. Furthermore, we would like to thank Elizabeth Rowley-Jolivet for English language editing. Finally, we thank the four anonymous reviewers for their interest in our work and their valuable comments to improve this paper.
Conflicts of Interest
The authors declare no conflict of interest. The funders had no role in the design of the study; in the collection, analyses, or interpretation of data; in the writing of the manuscript, or in the decision to publish the results.
Appendix A
Table A1.
Variety and combination of digital sources reported as being used pre-trip by participants (n = 258). Frequencies are displayed by types of sources, and number of sources used in combination. The 3 most frequent combinations found are indicated by letters a, b and c for each combination size. The 31 participants (12%) who did not consult (or rarely) any information before making a trip are not included.
| Digital Sources | Single Source | Combination of 2 Sources | Combination of 3 Sources | Combination of 4 Sources | Combination of 5 Sources and More | |
|---|---|---|---|---|---|---|
| Subscription to alerts | - | 81 abc | 54 abc | 26 abc | 12 abc | 173 (67%) |
| Operator’s app | 15 | 46 a | 45 abc | 25 abc | 12 abc | 143 (55%) |
| Operator’s website | 10 | 45 b | 31 a | 20 abc | 9 ab | 115 (45%) |
| 2 | 5 | 15 c | 10 c | 11 abc | 43 (17%) | |
| - | 5 | 5 | 8 b | 5 bc | 23 (9%) | |
| Other apps | 5 | 10 c | 25 b | 15 a | 9 ac | 64 (25%) |
| Other websites | 1 | 2 | 2 | - | 3 | 8 (3%) |
| Total (n = 258) | 33 (12.8%) | 97 (37.6%) | 59 (22.9%) | 26 (10%) | 12 (4.7%) | |
| 3 most common source combinations | a 37 b 37 c 5 | a 17 b 13 c 8 | a 10 b 6 c 5 | a 5 b 3 c 3 | ||
References
- UITP. Mobility and the SDGs: A Safe, Affordable, Accessible and Sustainable Transport System for All. 2019. Available online: https://www.uitp.org/publications/mobility-and-the-sdgs-a-safe-affordable-accessible-and-sustainable-transport-system-for-all/ (accessed on 14 January 2022).
- Keller, C.; Titov, W.; Schlegel, T. A Passenger Context Model for Adaptive Passenger Information in Public Transport. In HCI in Mobility, Transport, and Automotive Systems. Driving Behavior, Urban and Smart Mobility, Proceedings of HCII 2020, Copenhagen, Denmark, 19–24 July 2020; Lecture Notes in Computer Science; Krömker, H., Ed.; Springer: Cham, Switzerland, 2020; Volume 12213. [Google Scholar] [CrossRef]
- Macedo, E.; Teixeira, J.; Sampaio, C.; Silva, N.; Coelho, M.C.; Glinos, M.; Bandeira, J.M. Real-time information systems for public transport: User perspective. Transp. Res. Procedia 2021, 52, 732–739. [Google Scholar] [CrossRef]
- WBCSD. SMP2.0 Sustainable Mobility Indicators – 2nd Edition. 2015. Available online: https://www.wbcsd.org/Programs/Cities-and-Mobility/Sustainable-Cities/City-Business-Collaboration/SiMPlify/Resources/SMP2.0-Sustainable-Mobility-Indicators-2nd-Edition (accessed on 14 January 2022).
- Île-de-France Mobilités; OMNIL; DRIEA. La Nouvelle Enquête Globale Transport-Présentation des Premiers Résultats 2018; Assises de la mobilité en Île-de-France: Paris, France, 2019; Available online: https://www.omnil.fr/spip.php?article229 (accessed on 14 January 2022).
- Lyons, G.; Avineri, E.; Farag, S.; Harman, R. Strategic Review of Travel Information Research. Technical Report; Department for Transport/Bristol, University of the West of England: London, UK, 2007; Available online: http://eprints.uwe.ac.uk/10300 (accessed on 14 January 2022).
- Schweiger, C.L. Use and Deployment of Mobile Device Technology for Real-Time Transit Information; Transportation Research Board: Washington, DC, USA, 2011; Volume 91. [Google Scholar]
- Tang, L.; Thakuriah, P.V. Ridership effects of real-time bus information system: A case study in the City of Chicago. Transp. Res. Part C 2012, 22, 146–161. [Google Scholar] [CrossRef]
- Islam, M.F.; Fonzone, A. Bus passenger path choices after consulting ubiquitous real-time information. Travel Behav. Soc. 2021, 23, 226–239. [Google Scholar] [CrossRef]
- Schwanen, T.; Kwan, M.P. The Internet, mobile phone and space-time constraints. Geoforum 2008, 39, 1362–1377. [Google Scholar] [CrossRef]
- Nyblom, Å. Making plans or ‘just thinking about the trip’? Understanding people’s travel planning in practice. J. Transp. Geogr. 2014, 35, 30–39. [Google Scholar] [CrossRef] [Green Version]
- Harmony, X.J.; Gayah, V.V. Evaluation of real-time transit information systems: An information demand and supply approach. Int. J. Transp. Sci. Technol. 2017, 6, 86–98. [Google Scholar] [CrossRef]
- Amrani, A.; Pasini, K.; Khouadjia, M. Enhance Journey Planner with Predictive Travel Information for Smart City Routing Services. In Proceedings of the Forum on Integrated and Sustainable Transportation Systems, Delft, The Netherlands, 3–5 November 2020. [Google Scholar]
- Pasini, K.; Khouadjia, M.; Samé, A.; Ganansia, F.; Oukhellou, L. LSTM Encoder-Predictor for Short-Term Train Load Forecasting. In Machine Learning and Knowledge Discovery in Databases, Proceedings of ECML PKDD 2019, Würzburg, Germany, 16–20 September 2019; Lecture Notes in Computer Science; Brefeld, U., Fromont, E., Hotho, A., Knobbe, A., Maathuis, M., Robardet, C., Eds.; Springer: Cham, Switzerland, 2019; Volume 11908. [Google Scholar] [CrossRef]
- Vallet, F.; Khouadjia, M.; Amrani, A.; Pouzet, J. Designing a data visualisation and analysis tool for supporting decision-making with public transport network. Proc. Des. Soc. 2021, 1, 1093–1102. [Google Scholar] [CrossRef]
- Grison, E.; Burkhardt, J.M.; Gyselinck, V. How do users choose their routes in public transport? The effect of individual profile and contextual factors. Transp. Res. Part F 2017, 51, 24–37. [Google Scholar] [CrossRef]
- Patesson, R.; Lecomte, N. Le panel des voyageurs: Une étude des activités et des besoins d’information des utilisateurs des transports publics. In Proceedings of the Ergo IHM, Biarritz, France, 3–6 October 2000. [Google Scholar]
- Grotenhuis, J.W.; Wiegmans, B.W.; Rietveld, P. The desired quality of integrated multimodal travel information in public transport: Customer needs for time and effort savings. Transp. Policy 2007, 14, 27–38. [Google Scholar] [CrossRef]
- Infopolis 2 Consortium. Needs of travellers: An Analysis Based on the Study of their Tasks and Activities. Commission of the European Communities, DG XIII, TR, 4016. 1999. Available online: https://www.yumpu.com/en/document/read/27499303/needs-of-travellers-universitac-libre-de-bruxelles (accessed on 23 February 2022).
- Valentin, A. Conception d’un Serveur Multimodal Temps réel d’Information des Usagers de Transport Public - Projet P@ss-ITS; Unpublished working paper; 2005. [Google Scholar]
- Gärling, T.; Axhausen, K.W. Introduction: Habitual travel choice. Transportation 2003, 30, 1–11. [Google Scholar] [CrossRef]
- Verplanken, B.; Aarts, H.; Van Knippenberg, A. Habit, information acquisition, and the process of making travel mode choices. Eur. J. Soc. Psychol. 1997, 27, 539–560. [Google Scholar] [CrossRef]
- Farag, S.; Lyons, G. What affects use of pretrip public transport information? Empirical results of a qualitative study. Transp. Res. Rec. 2008, 2069, 85–92. [Google Scholar] [CrossRef]
- Cats, O.; Koutsopoulos, H.N.; Burghout, W.; Toledo, T. Effect of real-time transit information on dynamic path choice of passengers. Transp. Res. Rec. 2011, 2217, 46–54. [Google Scholar] [CrossRef] [Green Version]
- Brakewood, C.; Watkins, K. A literature review of the passenger benefits of real-time transit information. Transp. Rev. 2019, 39, 327–356. [Google Scholar] [CrossRef]
- Petrella, M.; Minnice, P.; Lappin, J. Traveler Use of and Response to Real-Time Traffic and Traveler Information: Evidence from Integrated Corridor Management Traveler Surveys in Dallas, Texas, and San Diego, California. Transp. Res. Rec. 2014, 2423, 44–51. [Google Scholar] [CrossRef]
- Fonzone, A. What do you do with your app? Study of bus rider decision-making with real-time passenger information. Transp. Res. Rec. 2015, 2535, 15–24. [Google Scholar] [CrossRef]
- Maréchal, S. Modelling the Acquisition of Travel Information and Its Influence on Travel Behaviour. Ph.D. Thesis, Imperial College London, London, UK, 2016. [Google Scholar] [CrossRef]
- Ben-Elia, E.; Avineri, E. Response to travel information: A behavioural review. Transp. Rev. 2015, 35, 352–377. [Google Scholar] [CrossRef]
- Bertolaccini, K.; Hickman, M. Age, transport and technology: A survey of older Queenslanders. In Proceedings of the 41st Australasian Transport Research Forum (ATRF), Canberra, ACT, Australia, 30 September–2 October 2019. [Google Scholar]
- Hounsell, N.B.; Shrestha, B.P.; McDonald, M.; Wong, A. Open data and the needs of older people for public transport information. Transp. Res. Procedia 2016, 14, 4334–4343. [Google Scholar] [CrossRef] [Green Version]
- Rahman, M.M.; Wirasinghe, S.C.; Kattan, L. Users’ views on current and future real-time bus information systems. J. Adv. Transp. 2013, 47, 336–354. [Google Scholar] [CrossRef]
- Mulley, C.; Clifton, G.T.; Balbontin, C.; Ma, L. Information for travelling: Awareness and usage of the various sources of information available to public transport users in NSW. Transp. Res. Part A 2017, 101, 111–132. [Google Scholar] [CrossRef] [Green Version]
- Nikolaidou, A.; Papaioannou, P. Social media and transport choices: How social media can affect tripmakers’ choices. WIT Trans. Ecol. Environ. 2017, 226, 605–616. [Google Scholar] [CrossRef] [Green Version]
- Gault, P.; Cottrill, C.D.; Corsar, D.; Edwards, P.; Nelson, J.D.; Markovic, M.; Mehdi, M.; Sripada, S. TravelBot: Utilising social media dialogue to provide journey disruption alerts. Transp. Res. Interdiscip. Perspect. 2019, 3, 100062. [Google Scholar] [CrossRef]
- Howard, J.M. Trains, Twitter and the social licence to operate: An analysis of Twitter use by train operating companies in the United Kingdom. Case Stud. Transp. Policy 2020, 8, 812–821. [Google Scholar] [CrossRef]
- Mellon, J.; Prosser, C. Twitter and Facebook are not representative of the general population: Political attitudes and demographics of British social media users. Res. Politics 2017, 4, 1–9. [Google Scholar] [CrossRef]
- Passenger Focus; Abellio. Short and Tweet. How Passengers Want Social Media during Disruption. 2012. Available online: https://www.transportfocus.org.uk/publication/short-and-tweet-how-passengers-want-social-media-during-disruption/ (accessed on 17 January 2022).
- Drabicki, A.A.; Islam, M.F.; Szarata, A. Investigating the Impact of Public Transport Service Disruptions upon Passenger Travel Behaviour—Results from Krakow City. Energies 2021, 14, 4889. [Google Scholar] [CrossRef]
- Papangelis, K.; Nelson, J.D.; Sripada, S.; Beecroft, M. The effects of mobile real-time information on rural passengers. Transp. Plan. Technol. 2016, 39, 97–114. [Google Scholar] [CrossRef]
- Transport Focus. Passenger Information at Railway Stations-Passengers’ Experiences and Expectations. 2021. Available online: https://www.transportfocus.org.uk/publication/passenger-information-at-railway-stations/ (accessed on 17 January 2022).
- Lin, T.; Shalaby, A.; Miller, E. Transit user behaviour in response to service disruption: State of knowledge. In North American Transport Challenges in an Era of Change//Les défis des Transports en Amérique du Nord à une aire de Changement, Proceedings of Canadian Transportation Research Forum 51st Annual Conference, Toronto, ON, Canada, 1–4 May 2016; University of Toronto: Toronto, ON, Canada, 2016. [Google Scholar]
- Cheng, Y.H. Exploring passenger anxiety associated with train travel. Transportation 2010, 37, 875–896. [Google Scholar] [CrossRef]
- Harazeen, S. Effects of Information on Decisions of Passengers during Service Disruptions. Master’s Thesis, University College London, London, UK, 2011. [Google Scholar]
- Pender, B.; Currie, G.; Delbosc, A.; Shiwakoti, N. Social media use during unplanned transit network disruptions: A review of literature. Transp. Rev. 2014, 34, 501–521. [Google Scholar] [CrossRef]
- Tsuchiya, R.; Sugiyama, Y.; Yamauchi, K.; Fujinami, K.; Arisawa, R.; Nakagawa, T. Route-choice support system for passengers in the face of unexpected disturbance of train operations. WIT Trans. Built Environ. 2006, 88, 189–197. [Google Scholar] [CrossRef] [Green Version]
- Passenger Focus. Information: Rail Passengers Needs During Unplanned Disruption-Qualitative Research; Transport Focus: London, UK, 2011; Available online: https://www.transportfocus.org.uk/publication/information-rail-passengers-needs-during-unplanned-disruption/ (accessed on 17 January 2022).
- Bachok, S. Estimating, calibrating and validating demand for feeder services during incident detections. In Proceedings of the Proceedings of the 30th Conference of Australian Institutes of Transport Research (CAITR), Perth, WA, Australia, 10–12 December 2008. [Google Scholar]
- Adelé, S.; Tréfond-Alexandre, S.; Dionisio, C.; Hoyau, P.A. Exploring the behavior of suburban train users in the event of disruptions. Transp. Res. Part F 2019, 65, 344–362. [Google Scholar] [CrossRef]
- Polak, J.; Jones, P. The acquisition of pre-trip information: A stated preference approach. Transportation 1993, 20, 179–198. [Google Scholar] [CrossRef]
- Kattan, L.; de Barros, A.G.; Saleemi, H. Travel behavior changes and responses to advanced traveler information in prolonged and large-scale network disruptions: A case study of west LRT line construction in the city of Calgary. Transp. Res. Part F 2013, 21, 90–102. [Google Scholar] [CrossRef]
- Lindsay, B.R. Social media and disasters: Current uses, future options, and policy considerations; Technical Report; US Congressional Research Service: Washington, DC, USA, 2011. [Google Scholar]
- Bregman, S. Uses of Social Media in Public Transportation; The National Academies Press: Washington, DC, USA, 2012. [Google Scholar] [CrossRef]
- Omnil. EGT 2010-RER et Trains: Utilisateurs et Déplacements. 2010. Available online: https://www.omnil.fr/spip.php?article87 (accessed on 17 January 2022).
- Benzécri, J.-P. Correspondence Analysis Handbook; Marcel Dekker: New York, NY, USA, 1992. [Google Scholar]
- Greenacre, M. Correspondence Analysis in Practice, 3rd ed.; Chapman & Hall/CRC: Boca Raton, FL, USA, 2017. [Google Scholar]
- Le Roux, B.; Rouanet, H. Multiple Correspondence Analysis; SAGE Publications: Thousand Oaks, CA, USA, 2010. [Google Scholar]
- Lebart, L.; Morineau, A.; Piron, M. Statistique Exploratoire Multidimensionnelle; Dunod: Paris, France, 1995. [Google Scholar]
- Gkiotsalitis, K.; Cats, O. Public transport planning adaption under the COVID-19 pandemic crisis: Literature review of research needs and directions. Transp. Rev. 2021, 41, 374–392. [Google Scholar] [CrossRef]
Publisher’s Note: MDPI stays neutral with regard to jurisdictional claims in published maps and institutional affiliations. |
© 2022 by the authors. Licensee MDPI, Basel, Switzerland. This article is an open access article distributed under the terms and conditions of the Creative Commons Attribution (CC BY) license (https://creativecommons.org/licenses/by/4.0/).