
Spatial–Temporal Differentiation and the Driving Mechanism of Rural Transformation Development in the Yangtze River Economic Belt

Abstract
:1. Introduction
- How to measure the characteristics of the rural transformation development level. In this part, it mainly constructed the evaluation index system of rural transformation development, and it used the entropy weight TOPSIS method to evaluate the rural transformation development level of the Yangtze River Economic Belt.
- How to reveal the spatial–temporal differentiation pattern of rural transformation development. In this part, using the spatial autocorrelation analysis model, the paper revealed the evolution of the spatial pattern of rural transformation development from the perspectives of global autocorrelation and local autocorrelation.
- How to explore the driving mechanism of rural transformation development differentiation. In this part, the influencing factors of rural transformation development in the Yangtze River Economic Belt were revealed by using the Geographic Detector Model, and the driving mechanism of rural transformation development was summarized.
2. Materials and Methods
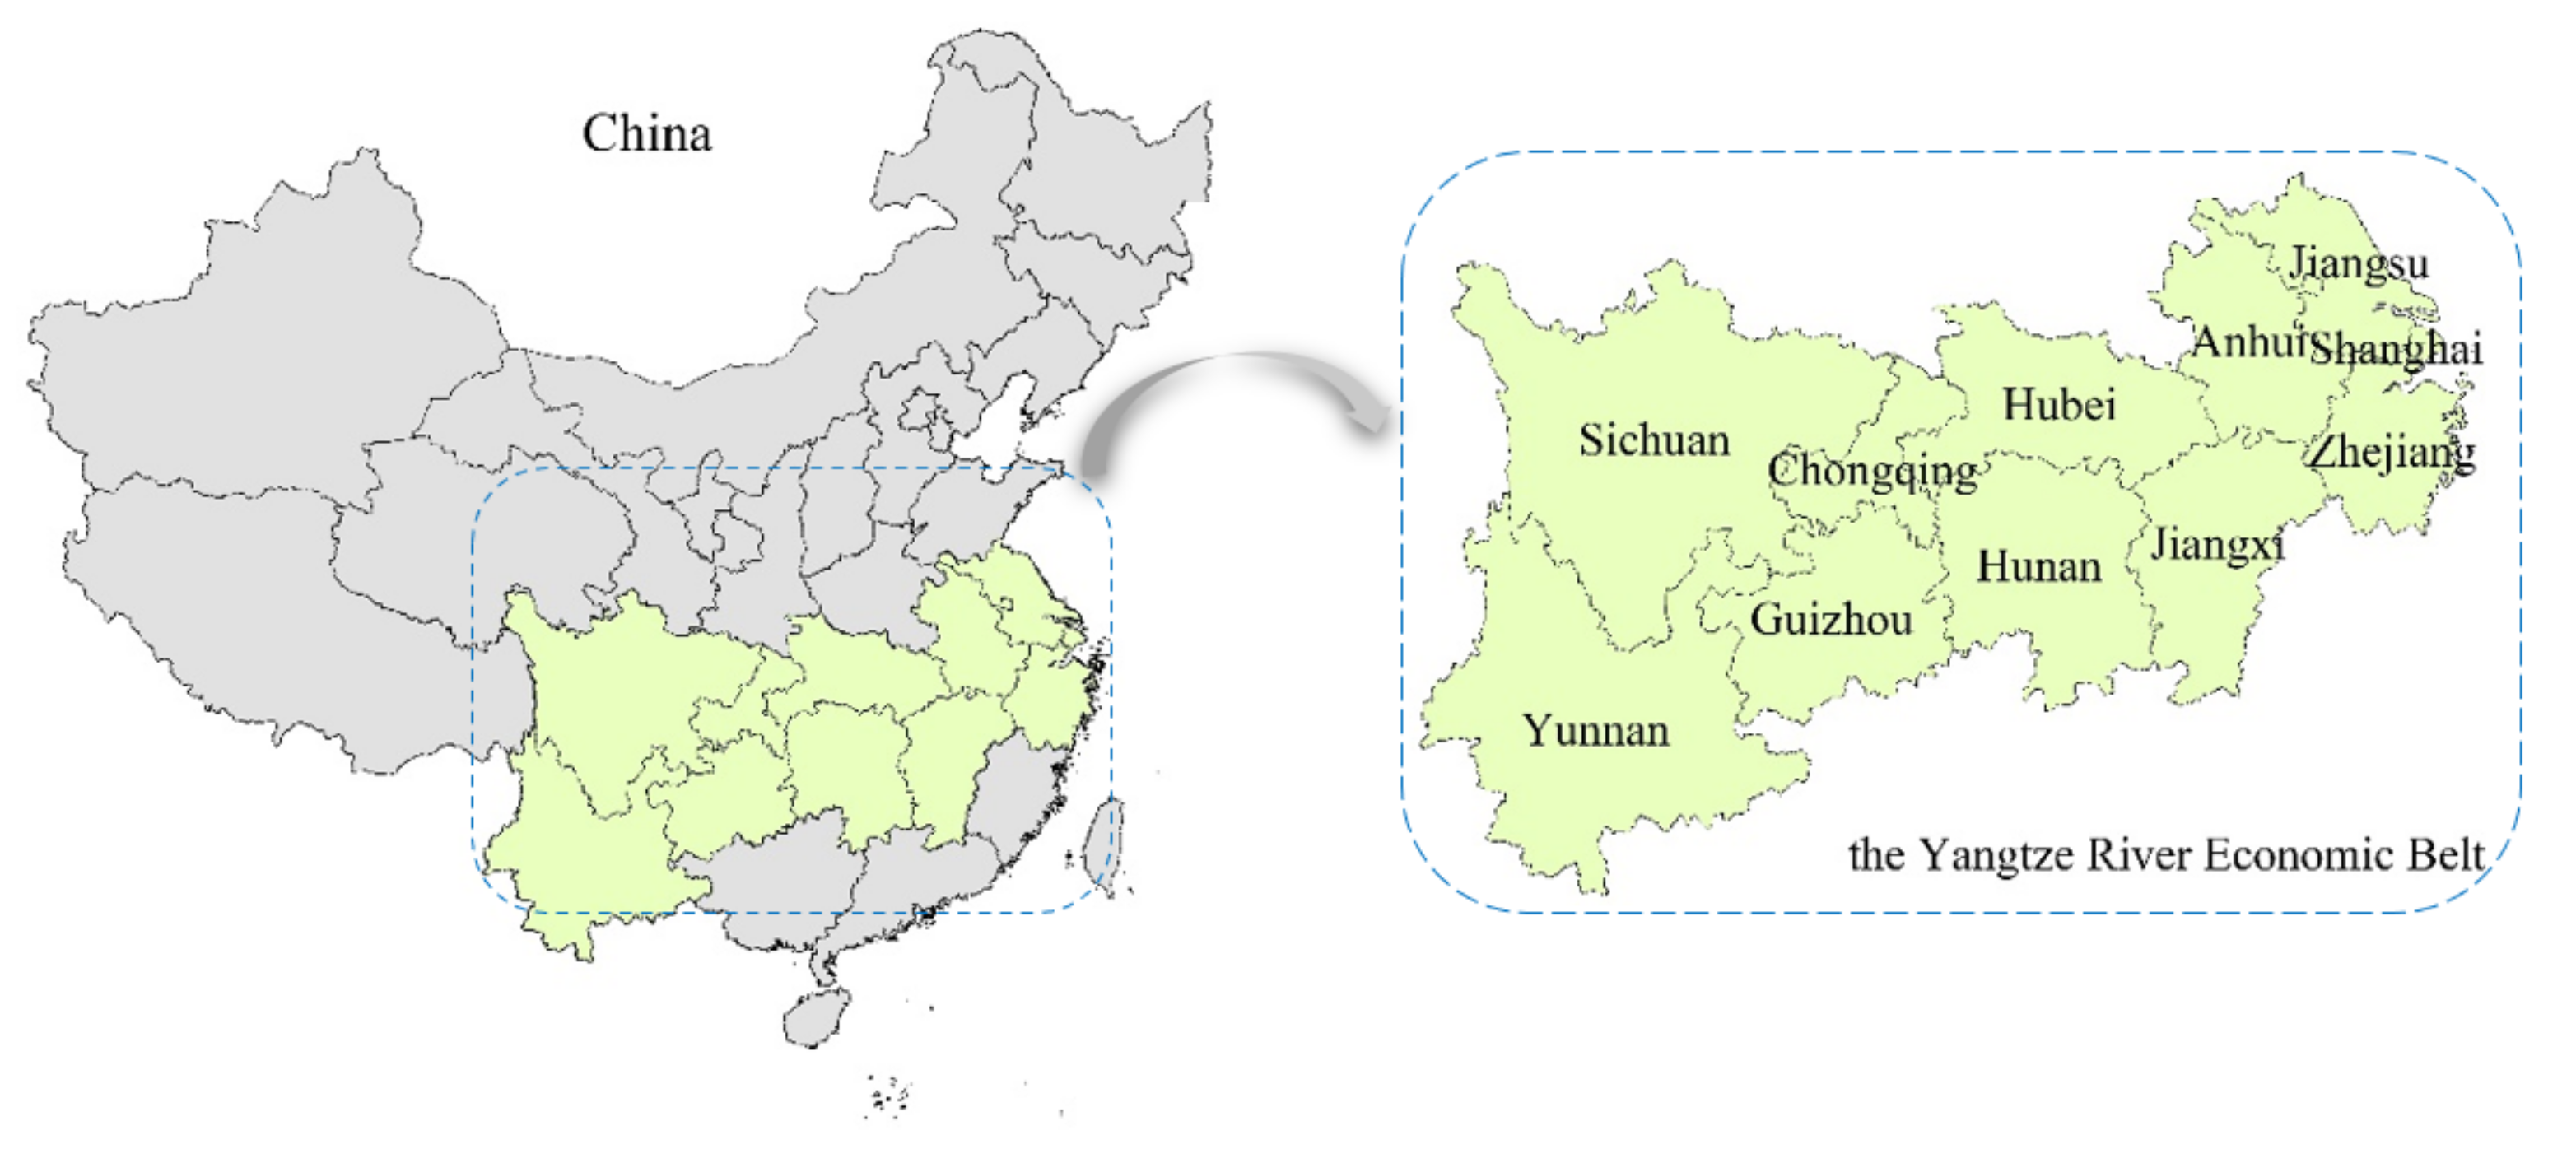
2.1. Study Area
2.2. Index System and Data Collection
2.2.1. Index System
2.2.2. Data Collection
2.3. Research Methods
2.3.1. Entropy TOPSIS Method
- ①
- Construct an evaluation index system matrix, X. ;
- ②
- Standardization of the index matrix. ;
- ③
- Calculate the evaluation index entropy value, Hi. ;
- ④
- Determine the entropy weight of the evaluation index. ;
- ⑤
- Determine the optimal solution, ;
- ⑥
- Calculate the euclidean distance between the optimal solution and the worst solution.
- ⑦
- Measure the level of rural transformation development..
2.3.2. Spatial Autocorrelation Model
- ①
- Global Moran’s I
- ②
- Local LISA index
2.3.3. Geographic Detector Model
3. Results
3.1. Temporal Variation Characteristics
3.2. Spatial Pattern Differentiation
- (1)
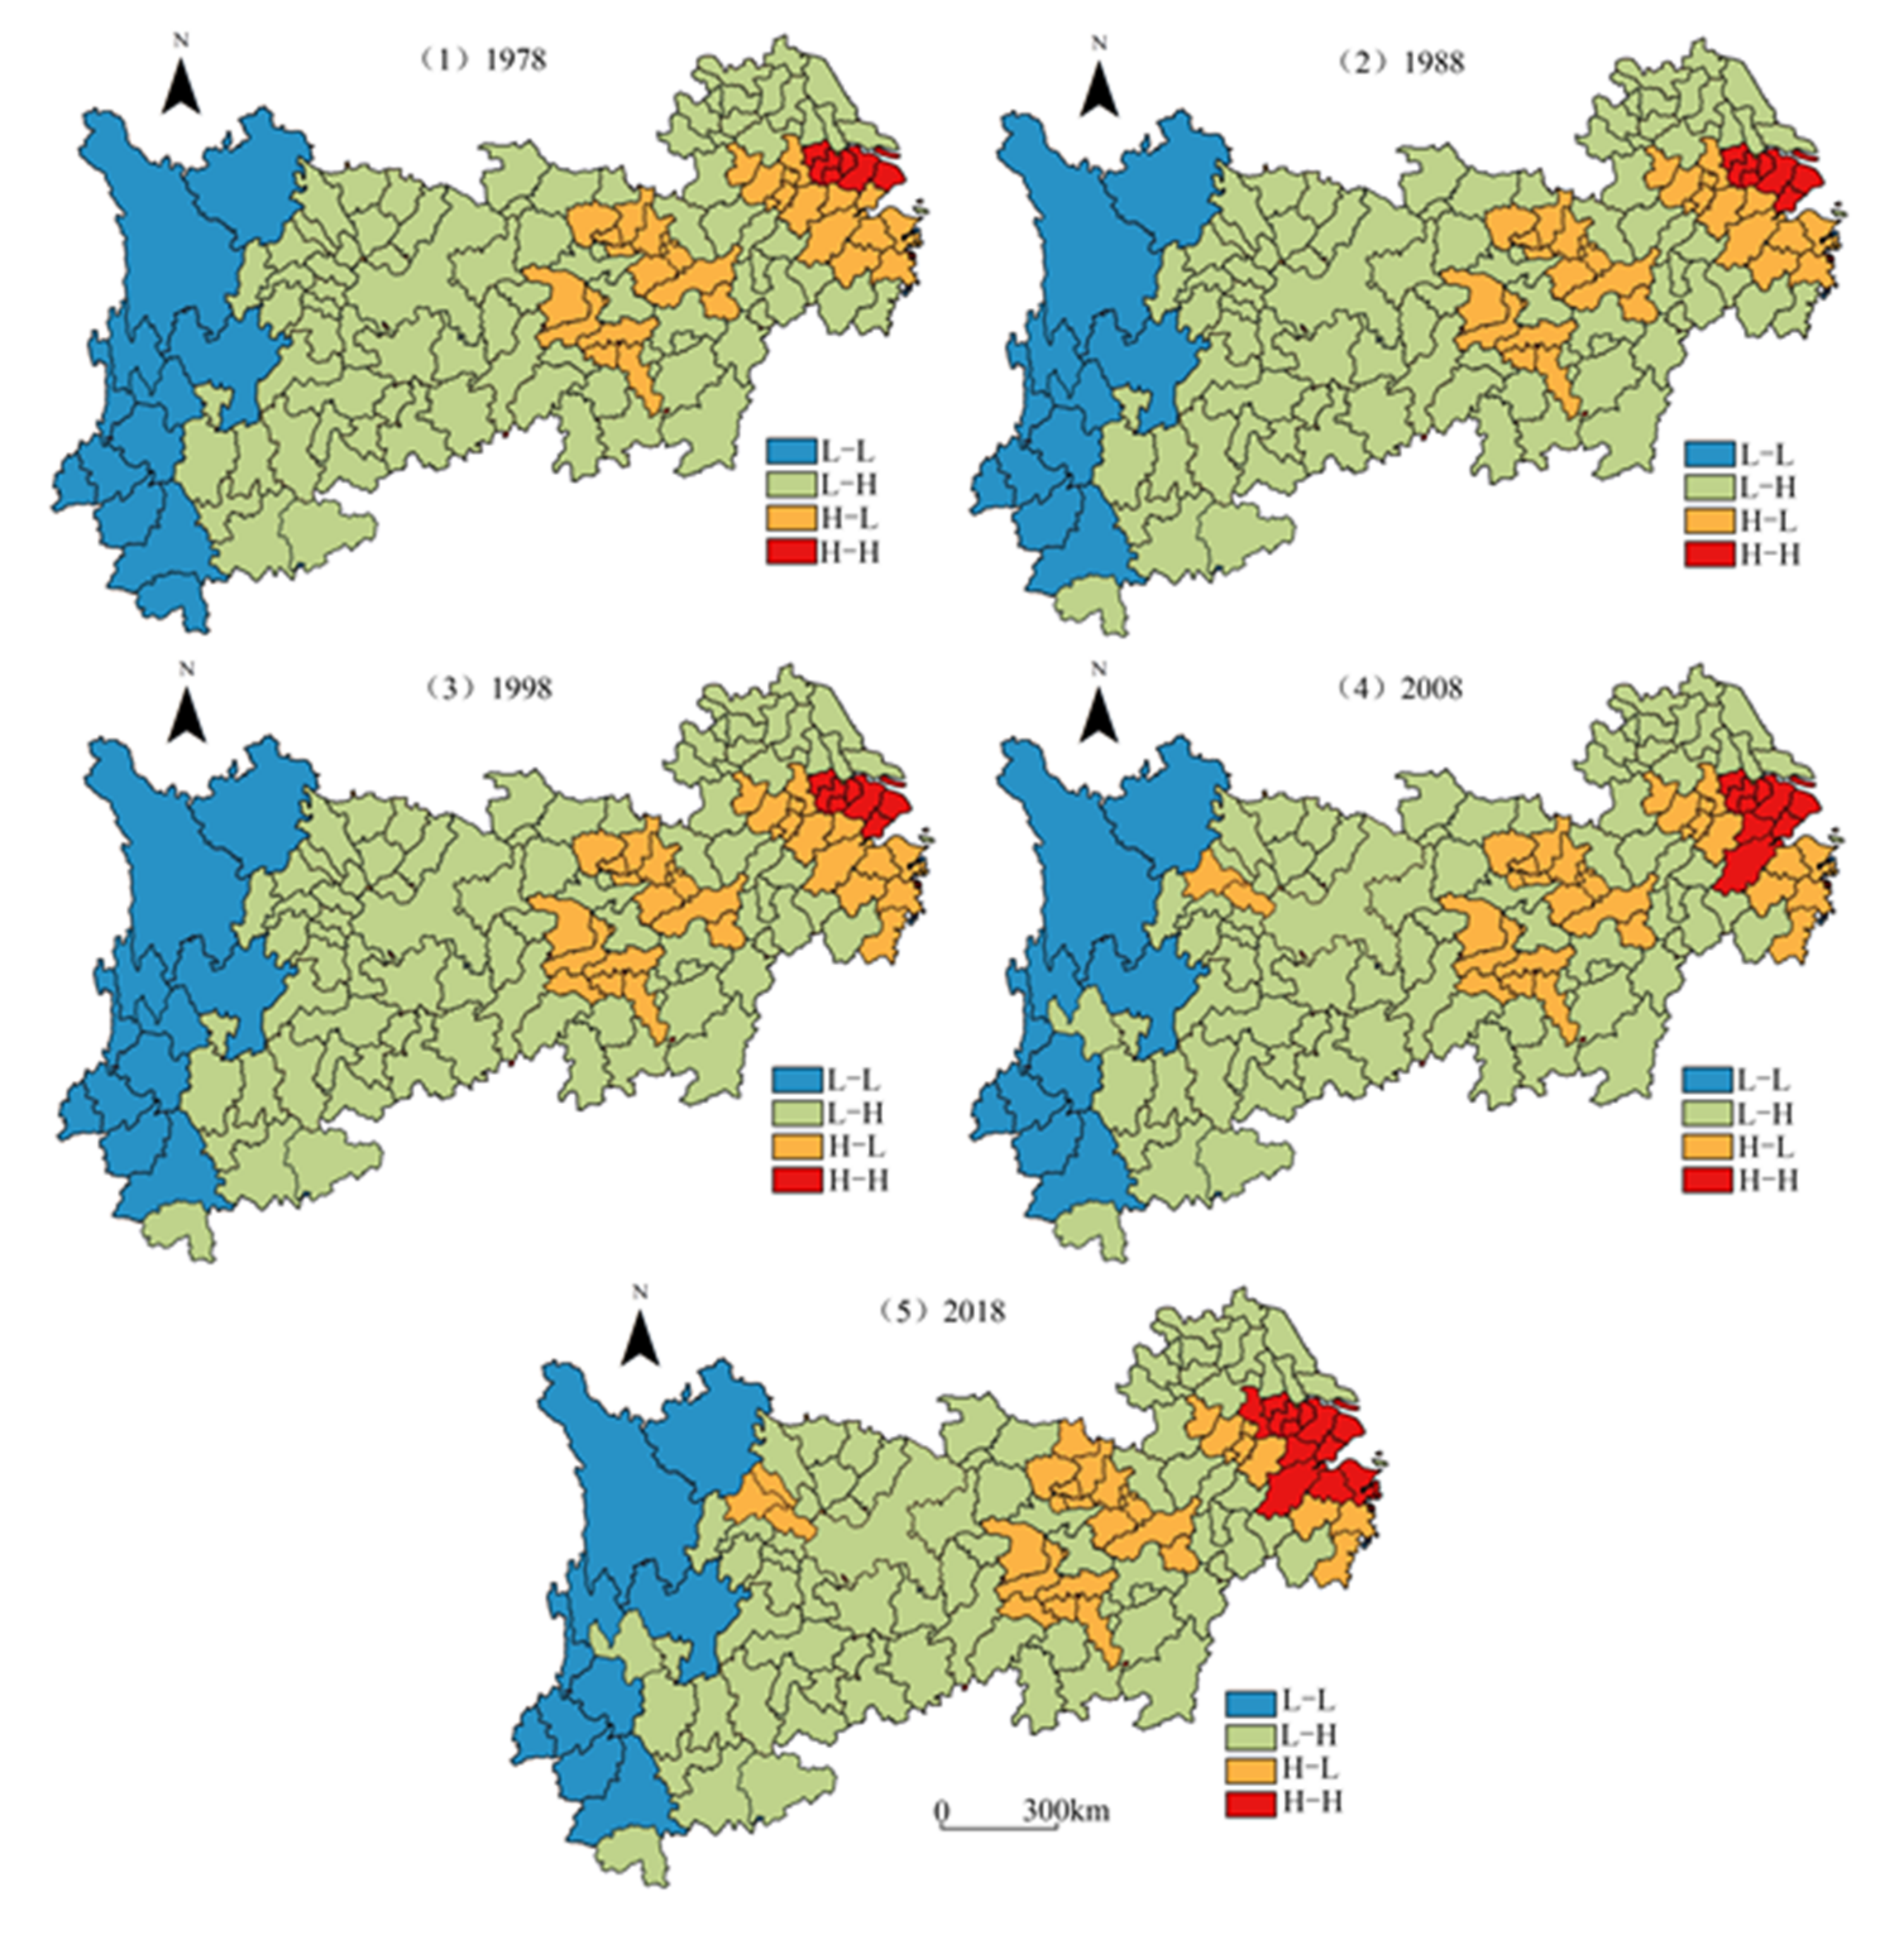
- H–H type. During the research period, this type was mainly concentrated in the Shanghai and the southern part of Jiangsu, forming a high-value hot spot for rural transformation development in the Yangtze River Economic Belt. After 2008, the Hangzhou-Shaoxing-Ningbo and Wanjiang city belt were evolved into the H–H type.
- (2)
- H–L type. This type of spatial differentiation pattern was relatively stable, mainly concentrated in the middle area of the Yangtze River; the Wuhan metropolitan area, Changsha-Zhuzhou-Xiangtan urban agglomeration, southwest Zhejiang urban agglomeration and Chengdu-Chongqing urban agglomeration were the sub-hot spot areas of rural transformation development in the Yangtze River Economic Belt.
- (3)
- L–H type. During the study period, the number of cities in the Yangtze River Economic Belt were the largest, and it was also relatively widespread. It was mainly concentrated in the northern Jiangsu region, southern Anhui region, central Guizhou economic circle and central Yunnan urban agglomeration; only a few cities such as Lijiang, Suizhou and Ziyang were replaced.
- (4)
- L–L type. This type was mainly distributed in the upper reaches of the Yangtze River, such as western Sichuan and the southwest Yunnan region. These areas had poor natural conditions and a poor geographical location; the level of rural development was at a low level, and the capacity for transformation development was low. It was a low-value spatial subsidence area in the rural transformation development of the Yangtze River Economic Belt.
3.3. Driving Mechanism
3.3.1. Analysis of Influencing Factors
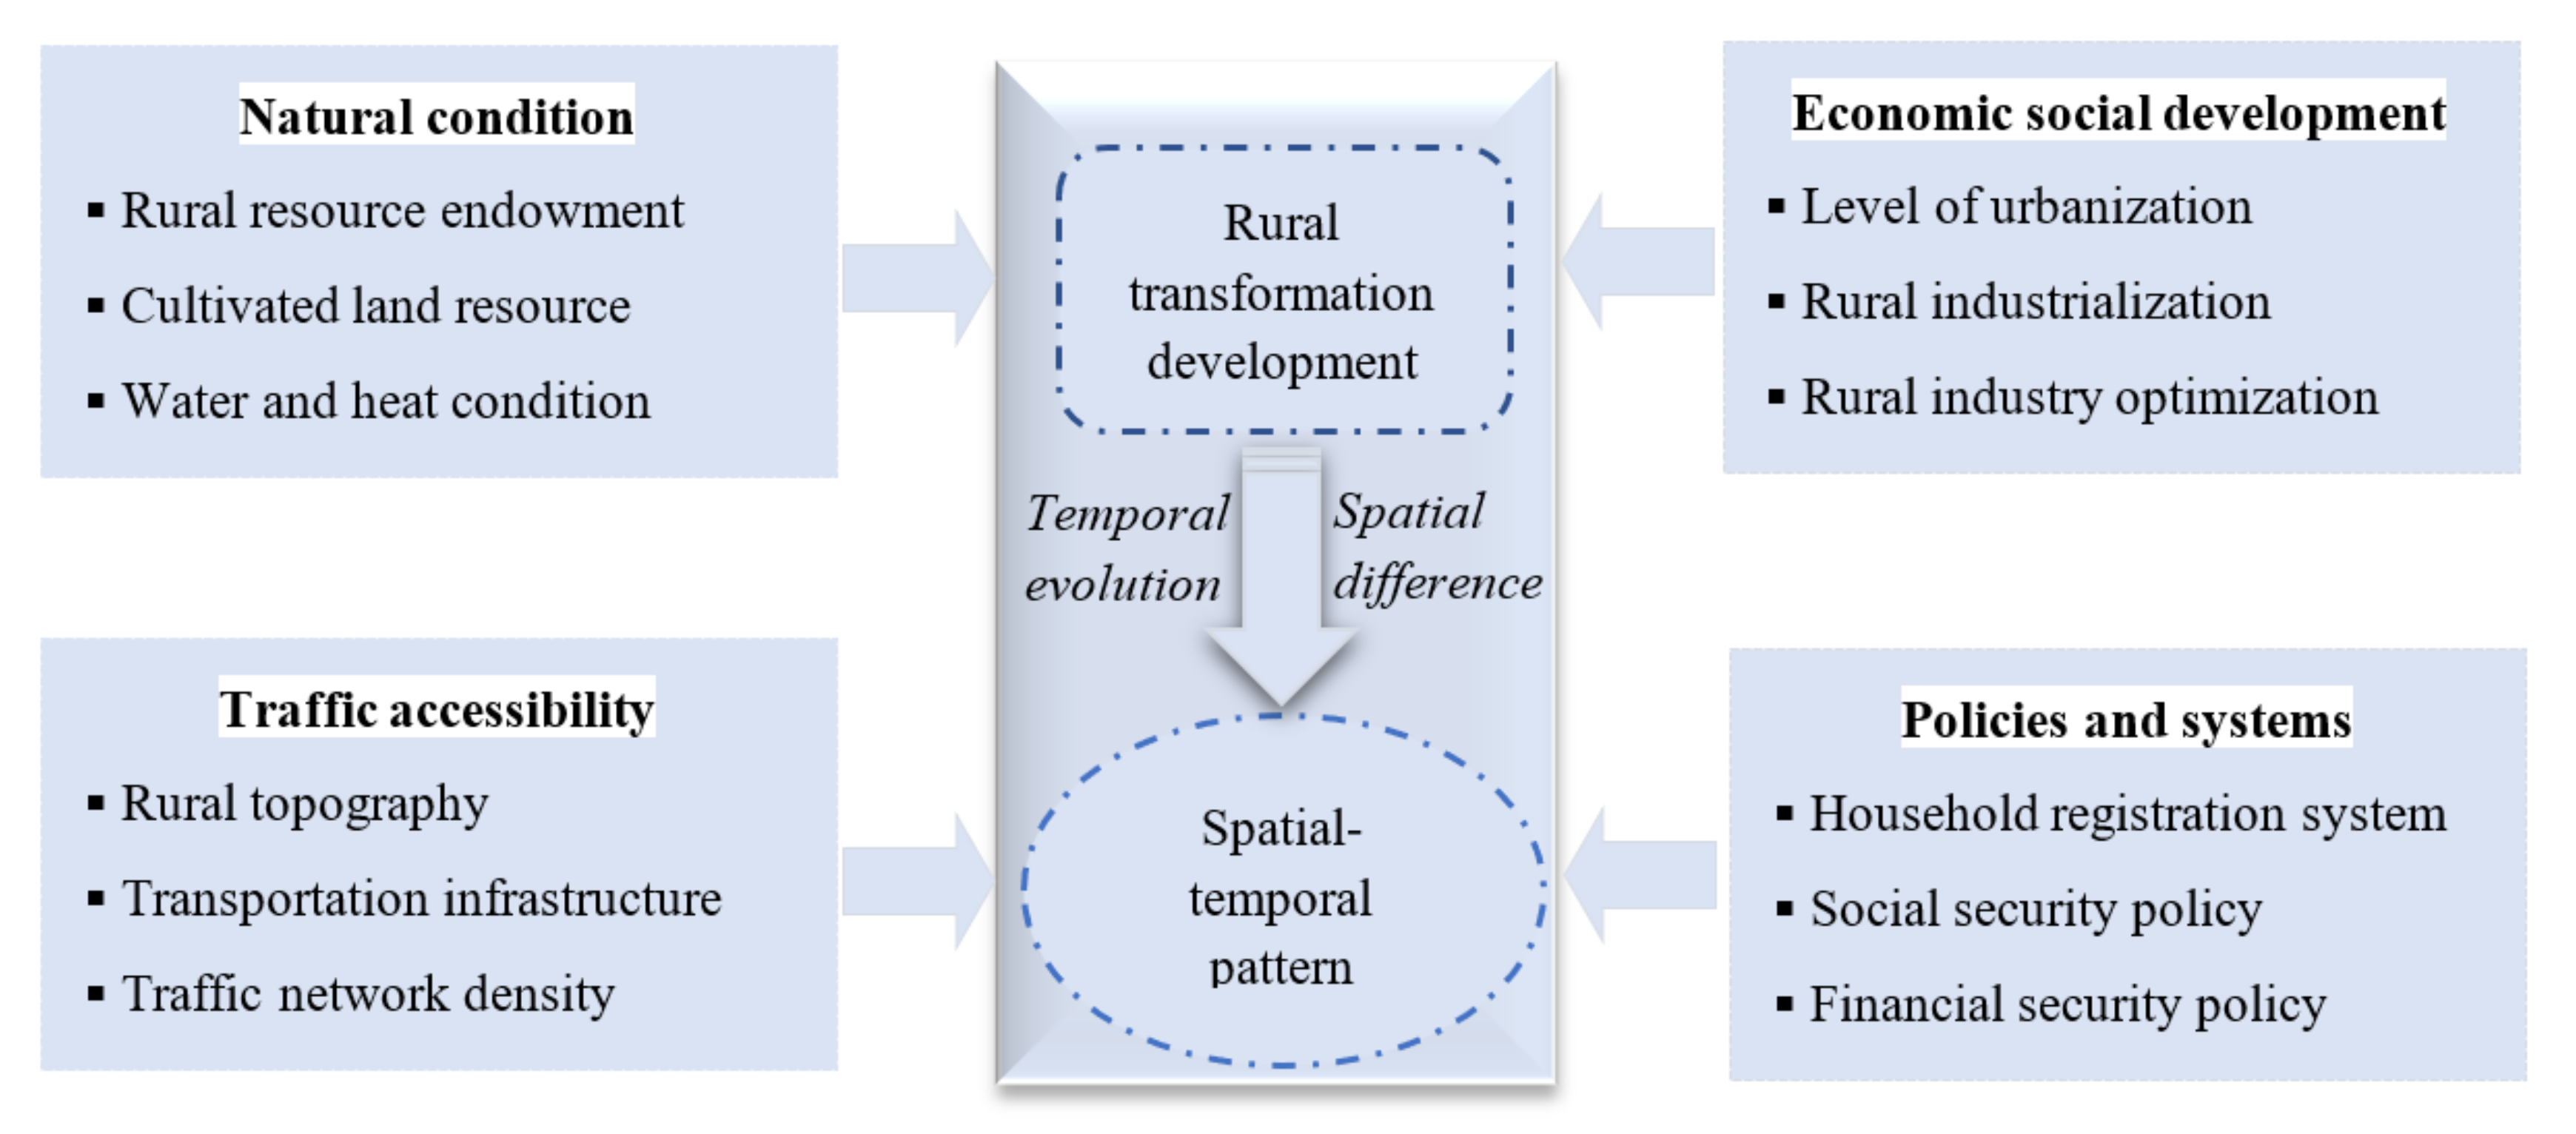
3.3.2. Analysis of the Influence Mechanism
- (1)
- Natural condition. The difference of natural factors will directly affect the rural resource endowment and land use mode, which is an important basis for the formation of the differentiation pattern of rural transformation development. However, with rapid urbanization and industrialization, the impact of the agricultural economy on rural transformation development is gradually decreasing [47]. The per capita cultivated land area in the upper, middle and lower reaches of the Yangtze River Economic Belt were taken as independent variables; the level of rural transformation development in the corresponding period was the dependent variable for the correlation analysis (Table 4). There was a positive correlation between per capita cultivated land area and rural transformation development, but this positive correlation trend appeared to be weakening. The upper reaches of the Yangtze River Economic Belt have a superior physical geographical environment; the cultivated land resource is rich, and the rural resource endowment condition is good; it plays a certain role in promoting rural transformation development. The terrain in the lower reaches of the Yangtze River Economic Belt is relatively complex, and arable land resources are scarce. This difference in natural conditions is the basic factor affecting the differentiation of rural transformation development in the Yangtze River Economic Belt.
- (2)
- Economic social development. Economic and social development factors play a leading role in rural transformation development. With the development of a regional economy and society, especially the acceleration of urbanization and industrialization, and the acceleration of urban and rural population mobility, urban capital and technology and information flow to rural areas, it leads to the constant optimization and adjustment of industrial structures in rural areas and the constant change of landscape, production and lifestyle in rural areas [48]. At the same time, rural transformation development will also have a positive effect on regional per capita GDP, and there is a mutually promoting relationship between them. The rural transformation and development levels of the top eight and the bottom eight cities in the Yangtze River Economic Belt in 2018 were extracted, respectively (Table 5). The average per capita GDP of the top eight cities and the bottom eight cities was 0.422 and 0.170; the degree of rural transformation development in cities with a high economic development level was much higher than that in cities with backward economic development. The lower reaches of the Yangtze River Economic Belt have been land of economic and social development, and rural industrialization has laid an important foundation for rural development transformation. In contrast, the process of urbanization and industrialization in the upper and middle reaches is relatively slow; the primitive accumulation of rural development is relatively weak, and the endogenous driving force for rural transformation development is insufficient. This difference in the economic and social development level was the leading factor causing the differentiation of rural transformation development in the Yangtze River Economic Belt.
- (3)
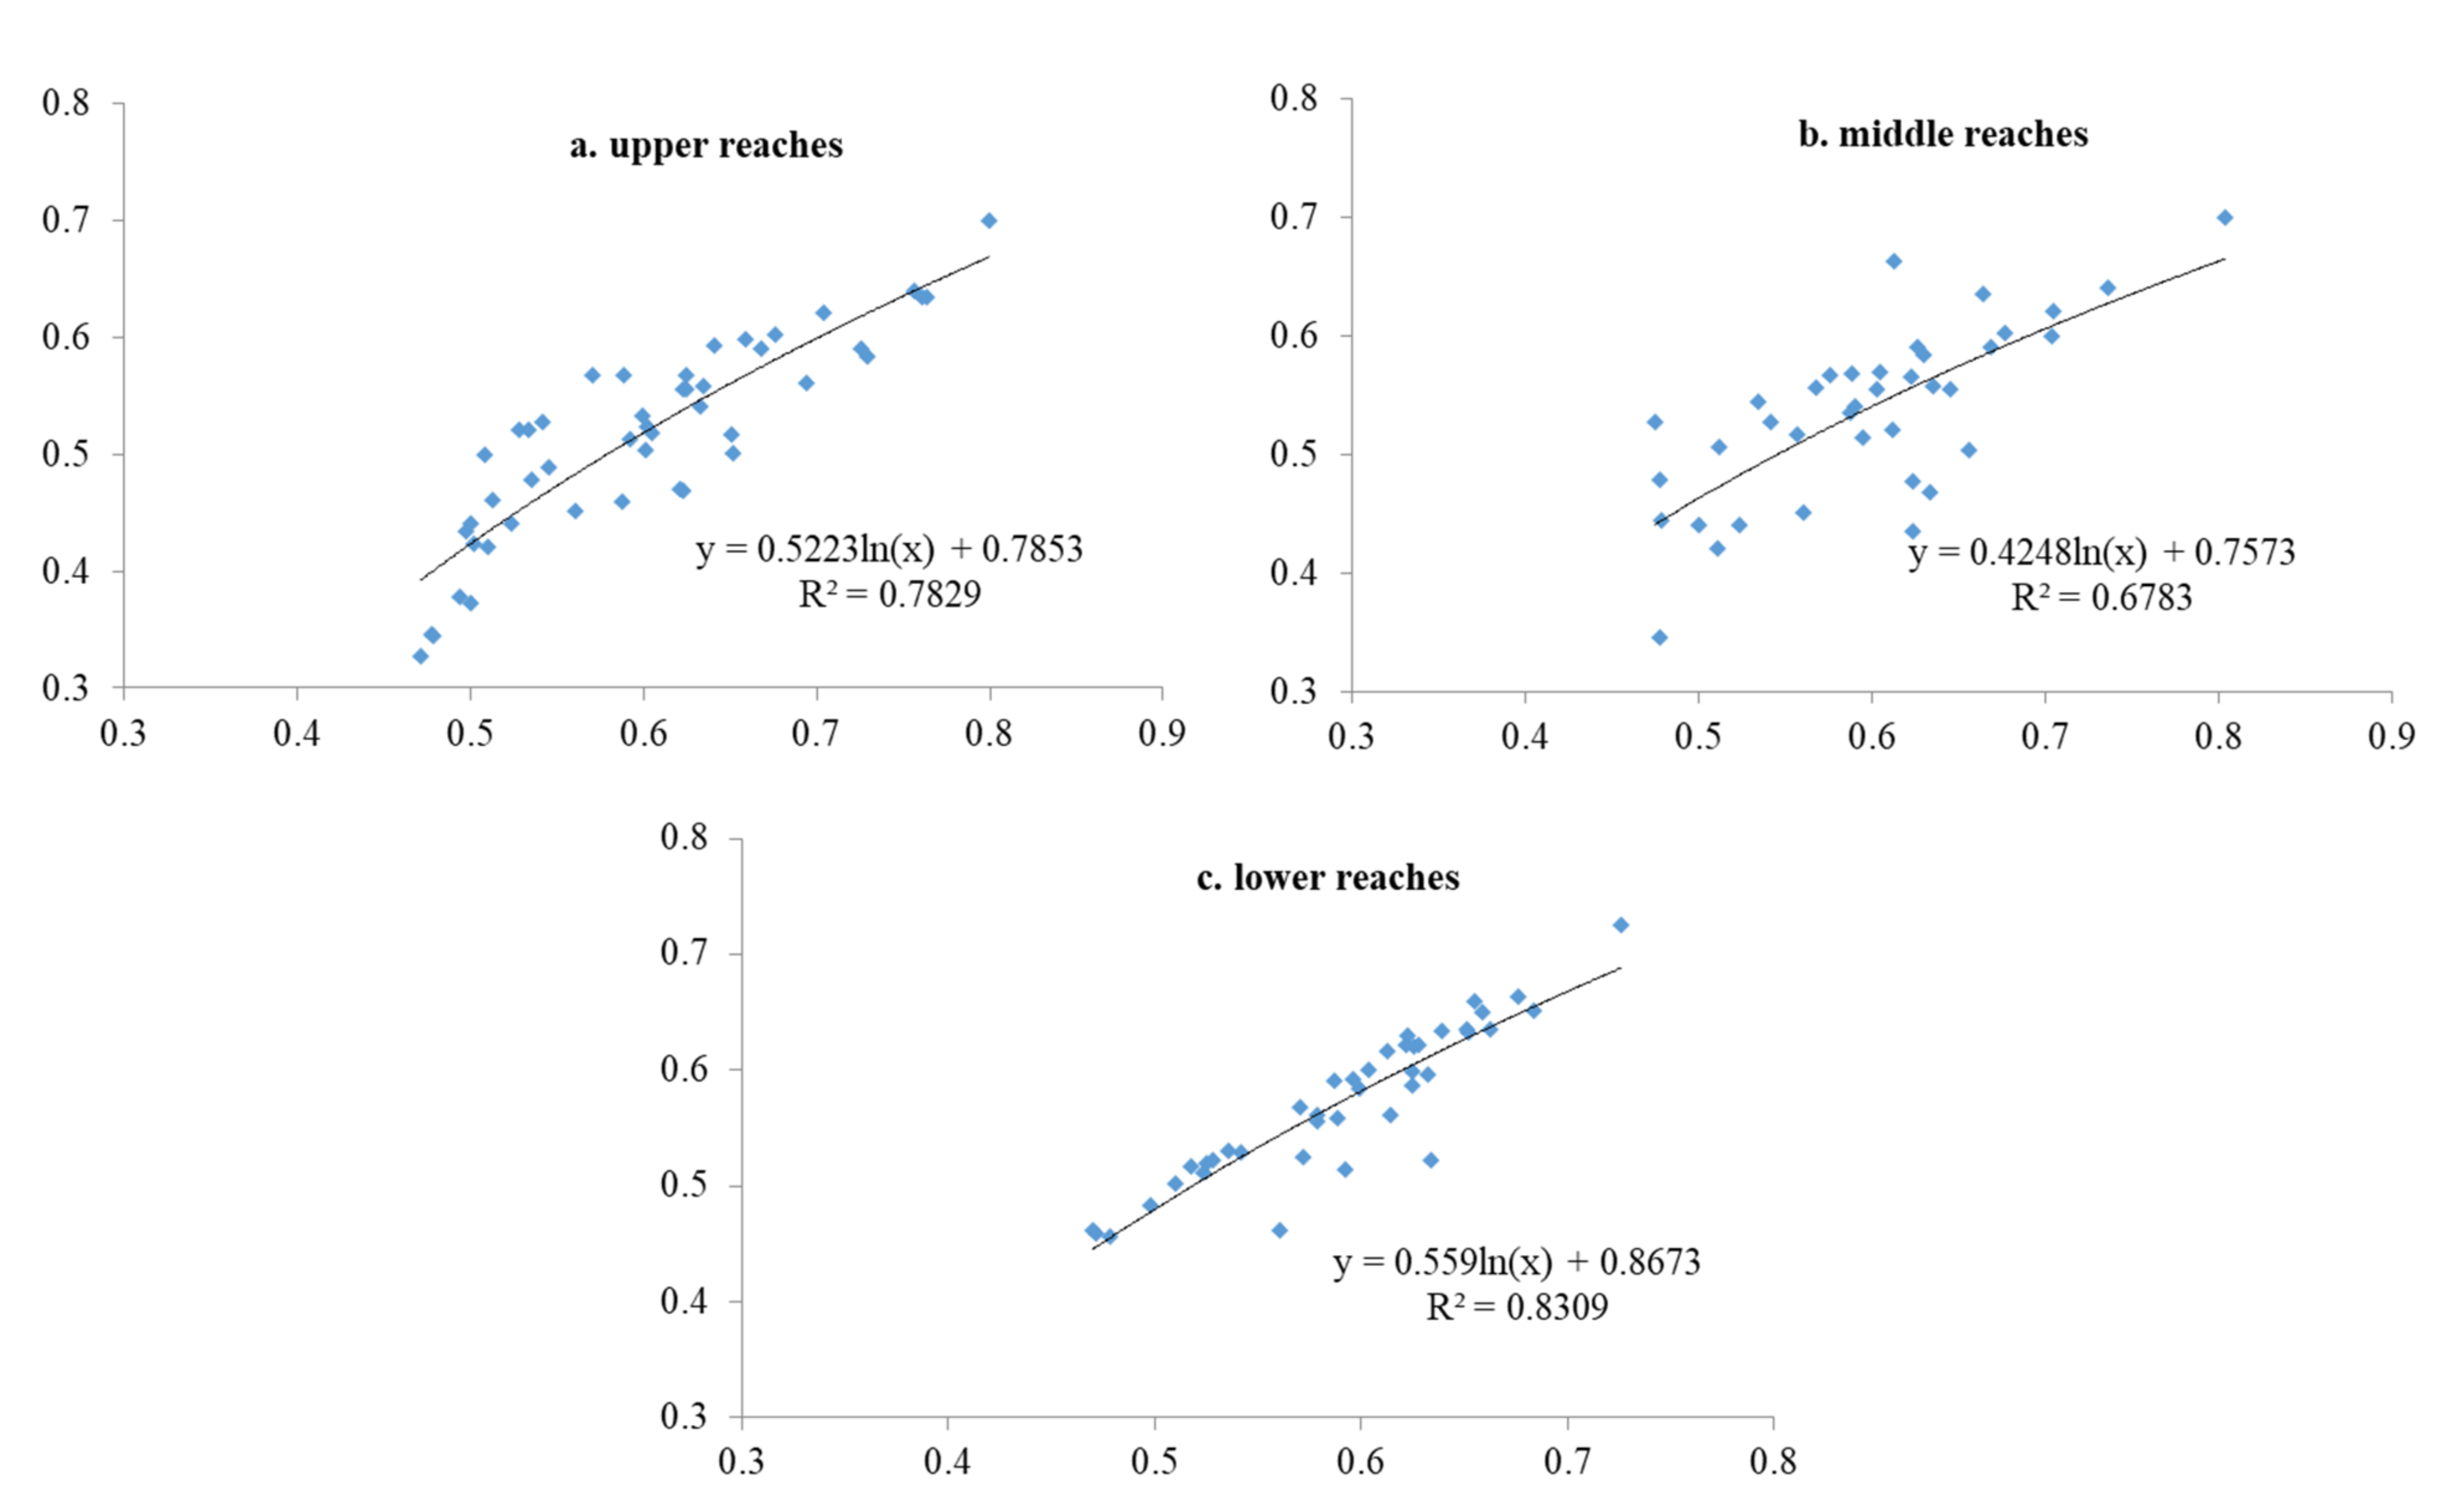
- Traffic accessibility. Traffic accessibility has an important impact on rural transformation development. Rural areas with good traffic conditions are more likely to be influenced by urban radiation, which is conducive to the flow of talent, capital and information so as to better realize rural transformation development [49]. Based on SPSS software, the rural transformation development levels in the upper, middle and lower reaches of the Yangtze River Economic Belt were taken as the dependent variable Y, and the density of traffic network was used as the independent variable X (Figure 5). The rural transformation development in the upper, middle and lower reaches showed a significant positive correlation with the traffic density network, and traffic accessibility was an important condition for rural transformation development. The lower reaches of the Yangtze River Economic Belt are flat; the rural industrialization process is earlier, and the rural transport infrastructure construction level is high; it has a significant promoting effect on the regional rural transformation development. In contrast, the upper reaches of the rural geographical location do not have advantages, and transportation infrastructure is relatively backward. The difference of traffic accessibility was the prerequisite factor affecting the rural transformation development in the Yangtze River Economic Belt.
- (4)
- Policies and systems. The policies and systems directly reflect the government’s guidance to regional rural development, and it is an important driving force to promote regional rural development transformation. When policies and systems fail to adapt to the new situation of rural development, it will inevitably lead to difficulty in exerting rural resource advantages and hinder the process of rural transformation development. Integration of urban and rural household registration systems, education policy, social security policy, as well as the adoption of financial discount policy, and so on can effectively guide various factors to flow to rural areas and are an important policy guarantee to realize rural transformation development [50,51]. At present, the lower reaches of the Yangtze River Economic Belt attach importance to rural planning and construction, establish and improve supporting policies for rural transformation development and effectively promote rural transformation development from the perspective of macro policy guidance. In contrast, the relevant policies and systems for rural development in the upper and middle reaches were not complete, and the promotion effect of policies and systems on regional rural transformation development was relatively weak. The difference of policies and systems was the driving force of the rural transformation development difference.
4. Discussion
- (1)
- On the driving mechanism of rural transformation development, Clock [11], based on the regulation theory, proposed to evaluate rural transformation from three dimensions: economic change, social and cultural restructuring and the redesign of the role of the state; this was an important paradigm for explaining the mechanism of rural transformation in developed countries. The market, state and social change mechanisms of rural transformation were more commonly used in Chinese academic circles; most of the literature on the rural transformation mechanism was not opposed to adopting the research framework of the trinity of state, market and society, which could accommodate some new characteristics in the process of rural transformation [52,53,54]. Through the empirical analysis of the driving mechanism of rural transformation development in the Yangtze River Economic Belt, it could be found that rural transformation development was the result of internal driving forces, foreign aid driving forces and policy driving forces; this empirical conclusion was basically consistent with the views of the above scholars.
- (2)
- According to the spatial agglomeration types of rural transformation development analyzed in the paper, combined with the socio-economic development conditions and leading function positioning of different spatial agglomeration types, different optimization development strategies need to be adopted [55]. ① The rural transformation development level of the H–H and H–L types was relatively high; in the future, this type of rural transformation development needs to cultivate a new rural industrial system adapted to the development of urbanization; accelerate the integration of rural first, second and third industries and guide more capital, technology and talent to flow to rural areas. We should develop new rural industries and forms of business and promote the in-depth integrated development of agriculture, tourism, cultural industries and other related industries so as to promote the upgrading of traditional rural industries. At the same time, it is necessary to strengthen the rational layout of various elements in rural areas, optimize the “three-life (production, living and ecology)” space in rural areas and improve the regional functions of this type of rural area. ② The rural transformation development level of the L–L and L–H types was relatively low; in the future, this type of rural development needs to focus on cultivating talents in rural construction and attracting college students to return home to start businesses. We will train a new type of professional farmer to improve the efficiency of agricultural production activities. We will train a number of rural administrative officials who understand agriculture and love the countryside to modernize rural governance. We should continue to deepen the reform of the rural construction land system, establish a rural collective construction land market system, build a unified urban and rural construction land market, constantly activate the vitality of rural land factors and promote the sustainable transformation and development of this type of countryside. Through classification guidance, it provides practical reference for the rural transformation development in the Yangtze River Economic Belt.
- (3)
- There are still some deficiencies and deepening directions in this paper on the spatial–temporal differentiation of rural transformation development in the Yangtze River Economic Belt under multiple time scales. What are the characteristics of different types of rural transformation development? How can one reveal the role of local government in the process of rural transformation development? In addition, household factors are an important factor affecting rural transformation development; how can one reveal the influencing mechanism of household factors on rural transformation development differentiation in the Yangtze River Economic Belt? This is the direction that this paper needs to deepen further.
5. Conclusions
- (1)
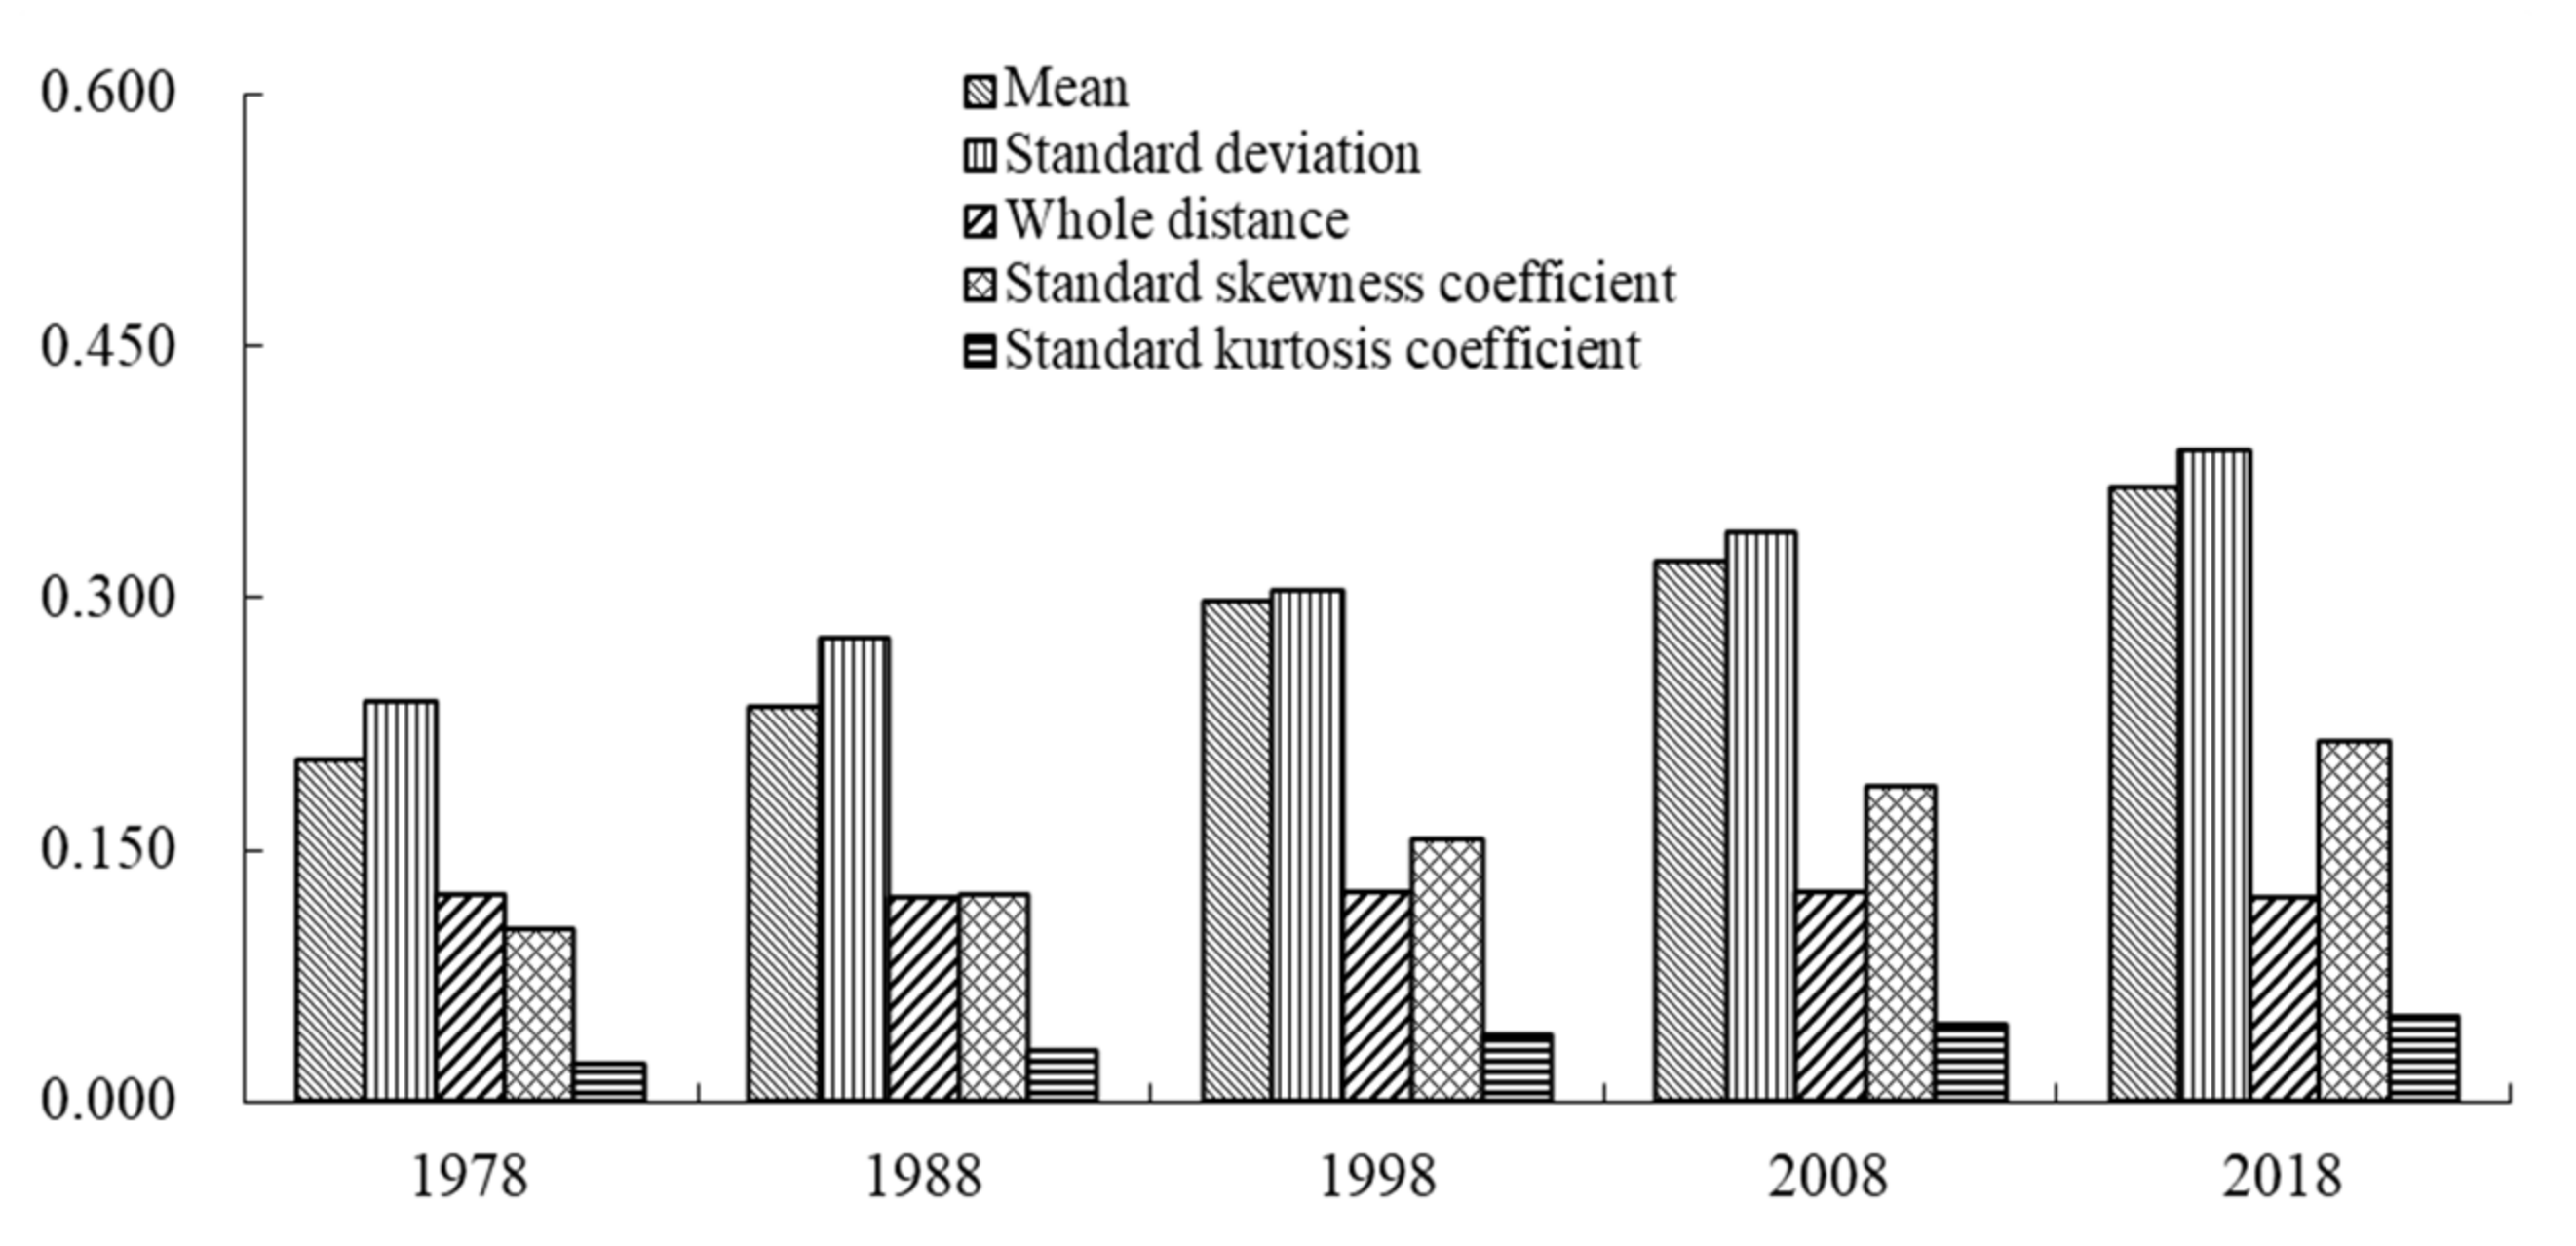
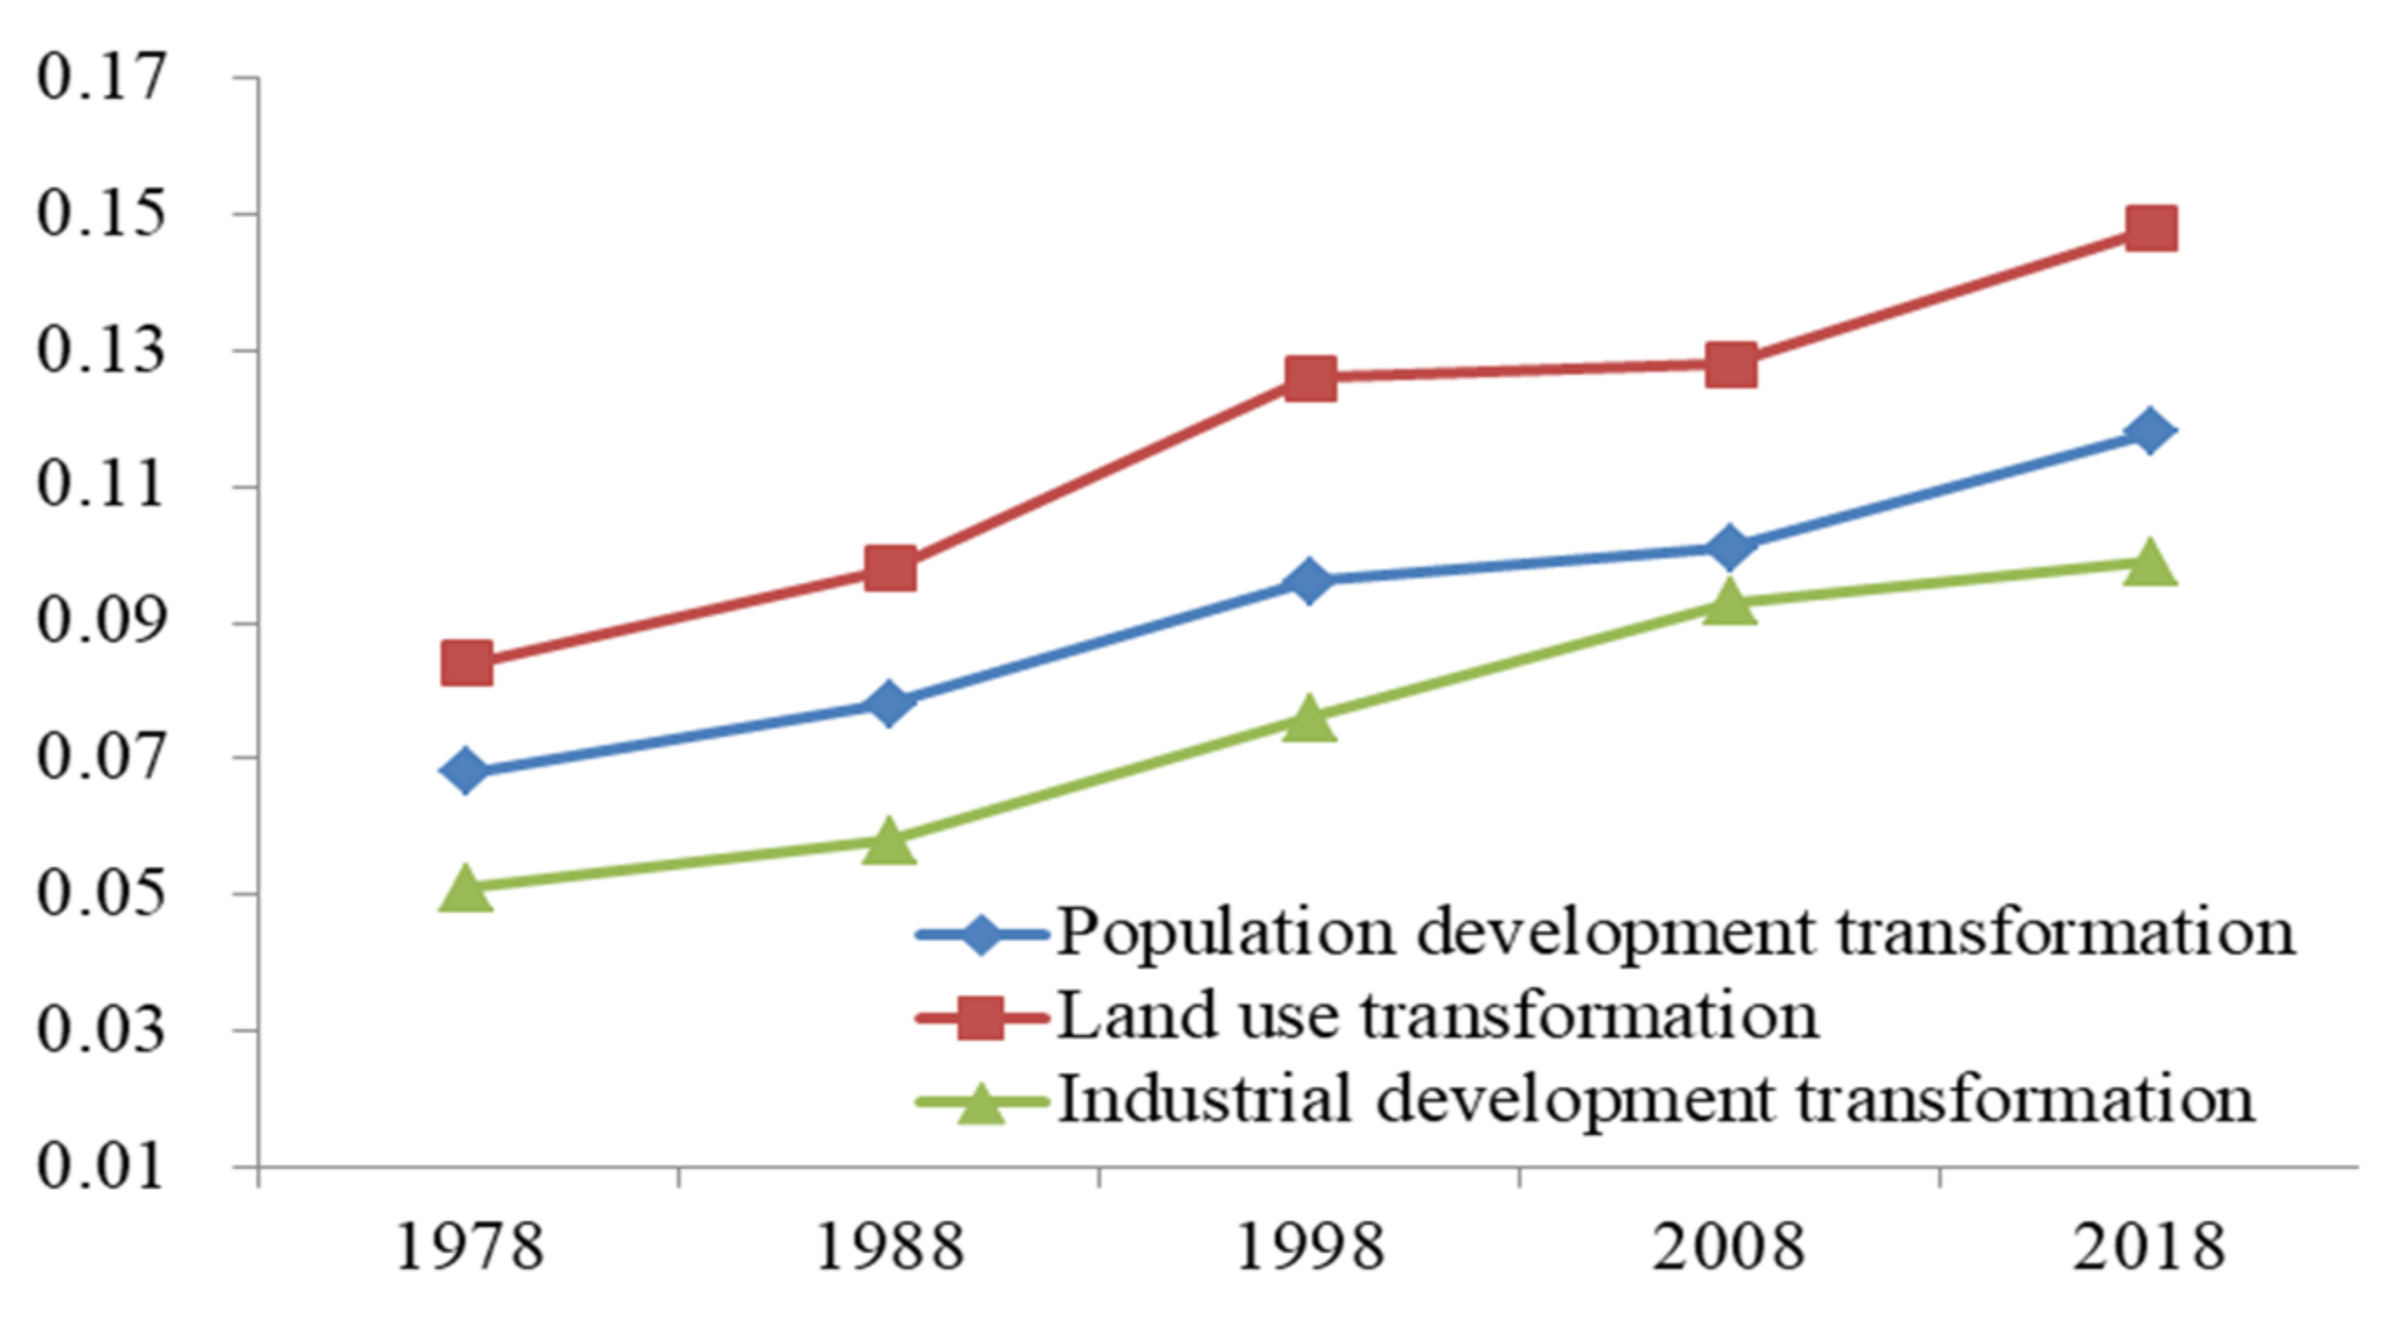
- Through the statistics of the frequency distribution index, it could be seen that the level of rural transformation development in the Yangtze River Economic Belt had a relatively high degree of imbalance since 1978, and urban units with a low level of rural transformation development accounted for a large proportion. In addition, in terms of sub-dimensional characteristics, the sub-dimensional characteristics of rural transformation development showed that land use transformation > population development transformation > industrial development transformation, indicating that there were some differences in various dimensions of rural transformation development in the Yangtze River Economic Belt region, and the rural industrial transformation development level was still at a low level.
- (2)
- Based on the GIS analysis platform, through the analysis of Global Moran’s I index, the rural transformation development has manifested the spatial distribution trend of “club convergence” in the Yangtze River Economic Belt. Through the analysis of the Local LISA Index, four different spatial agglomeration types of rural transformation development were obtained; the H–H type was mainly concentrated in southern Jiangsu, Shanghai and Hangzhou-Ningbo; the H–L type was mainly concentrated in the Wuhan metropolitan area, Changsha-Zhuzhou-Xiangtan urban agglomeration, southwest Zhejiang urban agglomeration, and Chengdu-Chongqing urban agglomeration; the L–H type was relatively widespread, while the L–L type was mainly concentrated in western Sichuan and southwest Yunnan. The spatial correlation analysis of rural transformation development is helpful to further clarify the characteristics of the rural transformation pattern in the Yangtze River Economic Belt since the reform and opening up.
- (3)
- Through the empirical study of the geographic detector model, it was concluded that natural conditions, economic social development, traffic accessibility, policies and systems were the leading factors affecting rural transformation development in the Yangtze River Economic Belt. Among them, natural conditions were the basic factors affecting the differentiation of rural transformation development, and the good natural endowment conditions in the lower reaches have laid an important foundation for rural transformation development. Economic and social development was the leading factor affecting the rural transformation; with the continuous improvement of rural industrialization and urbanization, the process of rural transformation development was faster, which was most obvious in southern Jiangsu. Transportation accessibility was a prerequisite factor affecting the differentiation of rural transformation development; rural areas with good transportation conditions were easily influenced by urban radiation, which promoted the flow of factors between urban and rural areas and promoted the transformation. Policies and systems factors were macro factors that affect the differentiation of rural transformation development; policies and systems factors directly reflected the guidance of the government to regional rural development, and they were an important driving force to promote regional rural transformation; the integration of urban and rural household registration systems, education policy and social security policy could effectively guide various factors to flow to rural areas; this was an important policy guarantee to achieve rural transformation development. In the future, the spatial–temporal pattern of rural transformation development in the Yangtze River Economic Belt will continue to evolve due to the comprehensive effect of four factors.
Author Contributions
Funding
Institutional Review Board Statement
Informed Consent Statement
Data Availability Statement
Conflicts of Interest
References
- Woods, M. Rural Geography: Processes, Responses and Experiences in Rural Restructuring; Sage: London, UK, 2005. [Google Scholar]
- Liu, Y.S.; Long, H.L.; Chen, Y.F. Progress of research on urban-rural transformation and rural development in China in the past decade and future prospects. J. Geogr. Sci. 2016, 8, 1117–1132. [Google Scholar] [CrossRef]
- Mao, D.; Wang, P. The evolution of Western rural restructuring research. Sociol. Res. 2014, 1, 194–245. [Google Scholar]
- Diao, X.S.; Eduardo, M.; Jed, S. Cities and rural transformation: A spatial analysis of rural livelihoods in Ghana. World Dev. 2019, 121, 141–157. [Google Scholar] [CrossRef]
- Fikri, Z.F.; Ivanie, D.S. Rural transformation, digitalization and subjective wellbeing: A case study from Indonesia. Habitat Int. 2020, 98, 102150. [Google Scholar]
- Peou, C. Negotiating rural-urban transformation and life course fluidity: Rural young people and urban sojourn in contemporary Cambodia. J. Rural Stud. 2016, 44, 177–186. [Google Scholar] [CrossRef]
- Boris, V. Voices from below: Artisanal and small-scale mining as a product and catalyst of rural transformation. J. Rural Stud. 2016, 47, 108–116. [Google Scholar]
- Hoggart, K.; Paniagua, A. The restructuring of rural spain. J. Rural Stud. 2001, 17, 63–80. [Google Scholar] [CrossRef]
- Liu, Y.S. Rural transformation development and new countryside construction in eastern coastal area of China. Acta Geogr. Sin. 2007, 62, 563–570. [Google Scholar]
- Long, H.L.; Zhang, Y.N.; Tu, S.S. Rural vitalization in China: A perspective of land consolidation. J. Geogr. Sci. 2019, 29, 517–530. [Google Scholar] [CrossRef] [Green Version]
- Cloke, P.; Milbourne, P. Deprivation and lifestyles in rural Wales—II. Rurality and the cultural dimension. J. Rural Stud. 1992, 8, 359–371. [Google Scholar] [CrossRef]
- Shubin, S. The changing nature of rurality and rural studies in Russia. J. Rural Stud. 2006, 22, 422–440. [Google Scholar] [CrossRef]
- Li, J.T.; Jia, L.R.; Liu, Y.S. Measuring model of rural transformation development path in Fuping County of Beijing-Tianjin-Hebei region. Habitat Int. 2018, 74, 48–56. [Google Scholar] [CrossRef]
- Phatharathananunth, S. Rural Transformations and Democracy in Northeast Thailand. J. Contemp. Asia 2016, 46, 504–519. [Google Scholar] [CrossRef]
- Li, Y.H.; Li, Y.R.; Westlund, H. Urban-rural transformation in relation to cultivated land conversion in China: Implications for optimizing land use and balanced regional development. Land Use Policy 2015, 47, 218–224. [Google Scholar] [CrossRef]
- Ge, D.Z.; Wang, Z.H.; Tu, S.S. Coupling analysis of greenhouse-led farmland transition and rural transformation development in China’s traditional farming area: A case of Qingzhou City. Land Use Policy 2019, 86, 113–125. [Google Scholar] [CrossRef]
- Klaniecki, K.; Duse, I.A.; Lutz, L.M. Applying the energy cultures framework to understand energy systems in the context of rural sustainability transformation. Energy Policy 2020, 137, 111092. [Google Scholar] [CrossRef]
- Suesse, M.; Wolf, N. Rural transformation, inequality, and the origins of microfinance. J. Dev. Econ. 2020, 143, 102429. [Google Scholar] [CrossRef] [Green Version]
- Long, H.L. Land use transition and rural transformation development. Prog. Geogr. 2012, 31, 131–138. [Google Scholar]
- Li, Z.J.; Ma, X.D.; Sun, S.S. Coupling analysis of rural transformation and land use change in Northern Jiangsu: A case study of Peixian county. J. Jiangsu Norm. Univ. 2015, 33, 36–39. [Google Scholar]
- Chen, Y.F.; Su, H.; Liu, Y.S. Reconstruction models of hollowed villages in key agricultural regions of China. Acta Geogr. Sin. 2010, 65, 727–735. [Google Scholar]
- Chen, H.W.; Zhang, J.X. Taobao villages: Rural development transformation driven by the space of flow. City Plan. Rev. 2018, 42, 93–101. [Google Scholar]
- Saltus, R.; Pithara, C. A sense of dignity in later life: A qualitative study on the views of older women migrants from minoritised backgrounds. Qual. Ageing Older Adults 2014, 15, 21–33. [Google Scholar] [CrossRef]
- Wu, X.; Cui, P. A study of the time–space evolution characteristics of urban–rural integration development in a mountainous area based on ESDA-GIS: The case of the Qinling-Daba Mountains in China. Sustainability 2016, 8, 1085. [Google Scholar] [CrossRef] [Green Version]
- Imo, E.E.; Olayanju, A.; Ibikunle, F.A.; Dahunsi, S.O. Impact of small hydropower developments on rural transformation in Nigeria. Earth Environ. Sci. 2020, 445, 012023. [Google Scholar] [CrossRef]
- Zhou, Y.; Liu, Y.S.; Wu, W.X.; Li, Y. Effects of rural-urban development transformation on energy consumption and CO2 emissions: A regional analysis in China. Renew. Sustain. Energy Rev. 2015, 52, 863–875. [Google Scholar] [CrossRef]
- Li, J.T.; Yang, Y.Y.; Jiang, N. County-rural transformation development from viewpoint of “population-land-industry” in Beijing-Tianjin-Hebei region under the background of rapid urbanization. Sustainability 2017, 9, 1637. [Google Scholar] [CrossRef]
- Chen, F.; Yu, M.; Zhu, F.W. Rethinking rural transformation caused by comprehensive land consolidation: Insight from program of whole village restructuring in Jiangsu Province, China. Sustainability 2018, 10, 2029. [Google Scholar] [CrossRef] [Green Version]
- Cheng, Z.; Cai, J.M.; Cui, L. Facilitating rural transformation development by tourism industry: A case study of Panjin, Liaoning Province. Res. Agric. Mod. 2016, 37, 143–150. [Google Scholar]
- Zheng, Z.Y.; Liao, H.P.; Yang, W.; Zhao, Z.Y. On type division and pattern characteristics of the rural areas in Chongqing. J. Southwest Univ. 2018, 40, 104–1112. [Google Scholar]
- Tu, S.S.; Long, H.L. Rural restructuring in China: Theory, approaches and research prospect. J. Geogr. Sci. 2017, 27, 1169–1184. [Google Scholar] [CrossRef]
- Wang, L.; Khan, Q.U.; Zhang, D. Rural transformation index: Measuring rural–urban disparities. In Skills Development for Inclusive and Sustainable Growth in Developing Asia-Pacific; Springer: Dordrecht, The Netherlands, 2013; pp. 213–240. [Google Scholar]
- Onyeonoru, I.P. Labor migration and rural transformation in nigeria. Int. Sociol. J. Int. Sociol. Assoc. 1994, 9, 217–221. [Google Scholar]
- Rufai, A.M.; Ogunniyi, A.I.; Salman, K.K.; Salawu, M.B.; Omotayo, A.O. Rural transformation and labor market outcomes among rural youths in Nigeria. Sustainability 2021, 13, 13794. [Google Scholar] [CrossRef]
- Xu, Y.; Peng, Q.Y.; Yin, Y.; Zhong, Q. Evaluating railway operation safety situation in China based on an improved TOPSIS method: A regional perspective. J. Adv. Transp. 2020, 2020, 1796132. [Google Scholar]
- Mahmood, T.; Ali, Z. Entropy measure and TOPSIS method based on correlation coefficient using complex q-rung orthopair fuzzy information and its application to multi-attribute decision making. Methodol. Appl. 2020, 10, 1007. [Google Scholar] [CrossRef]
- Moura, A.C.; Fonseca, B.M. ESDA (Exploratory Spatial Data Analysis) of vegetation cover in urban areas—Recognition of vulnerabilities for the management of resources in urban green infrastructure. Sustainability 2020, 12, 1933. [Google Scholar] [CrossRef] [Green Version]
- Cao, X.S.; Liu, Y.W.; Li, T.; Liao, W. Analysis of spatial pattern evolution and influencing factors of regional land use efficiency in China based on ESDA-GWR. Sci. Rep. 2019, 9, 520. [Google Scholar] [CrossRef] [PubMed]
- Robert, H. Spatial Data Analysis: Theory and Practice; Cambridge University Press: Cambridge, UK, 2003. [Google Scholar]
- Wang, J.F.; Haining, R.; Cao, Z.D. Sample surveying to estimate the mean of aheterogeneous surface: Reducing the error variance through zoning. Int. J. Geogr. Inf. Sci. 2010, 24, 523–543. [Google Scholar] [CrossRef]
- Wang, J.F.; Xu, C.D. Geodetector: Principle and prospective. Acta Geogr. Sin. 2017, 72, 116–134. [Google Scholar]
- Song, Y.Z.; Wang, J.F.; Ge, Y.; Xu, C. An optimal parameters-based geographical detector model enhances geographic characteristics of explanatory variables for spatial heterogeneity analysis: Cases with different types of spatial data. GISci. Remote Sens. 2020, 57, 593–610. [Google Scholar] [CrossRef]
- Tae, H.K.; Halbert, W. One more robust estimation of skewness and kurtosis. Financ. Res. Lett. 2004, 3, 56–73. [Google Scholar]
- Masot, A.N.; Alonso, G.C. The rural development policy in extremadura (SW Spain): Spatial location analysis of leader projects. ISPRS Int. J. Geo-Inf. 2018, 7, 76. [Google Scholar] [CrossRef] [Green Version]
- Klufova, R. Current delimitation and typology of the Czech countryside and its importance for rural development. East. Eur. Countrys. 2016, 22, 229–251. [Google Scholar] [CrossRef] [Green Version]
- Murdoch, J. Networks: A new paradigm of rural development. J. Rural Stud. 2000, 16, 407–419. [Google Scholar] [CrossRef]
- Openko, I.; Shevchenko, O.; Tykhenko, R.; Tsvyakh, O.; Moroz, Y. Assessment of Inequality to Forest Resources Access in the Context of Sustainable Development. Sci. Pap. Manag. Econ. Eng. Agric. Rural Dev. 2020, 20, 405–410. [Google Scholar]
- Collantes, F. Rural Europe reshaped: The economic transformation of upland regions, 1850–2000. Econ. Hist. Rev. 2009, 62, 306–323. [Google Scholar] [CrossRef]
- Ahmed, S.; Eklund, E. Rural accessibility, rural development, and natural disasters in Bangladesh. J. Dev. Soc. 2019, 35, 391–411. [Google Scholar] [CrossRef]
- Badri, S.A.; Kazemi, N.; Khodadadi, P. Why rural development policies have not contributed to rural development in Iran. Rural Soc. 2021, 9, 1997423. [Google Scholar] [CrossRef]
- Van, B.; Verburg, P.H. Sensitising rural policy: Assessing spatial variation in rural development options for Europe. Land Use Policy 2011, 28, 447–459. [Google Scholar]
- Long, H.L.; Li, T.T.; Zou, J. Analysis of dynamical mechanism of rural transformation development in typical regions of China. Econ. Geogr. 2011, 31, 2080–2085. [Google Scholar]
- Cao, M.M.; Peng, P.; Wang, X.; Zhou, G.H.; Zhou, R.R.; Liu, X.L. Spatial-temporal evolution characteristics of rural transformation and its influencing factors analysis in Wuling Mountain Area of Hunan Province. Resour. Environ. Yangtze Basin 2020, 29, 1930–1940. [Google Scholar]
- Cao, Z.; Li, Y.R.; Chen, Y.F. Approaches to rural transformation and sustainable development in the context of urban-rural integration. Acta Geogr. Sin. 2019, 74, 2560–2571. [Google Scholar]
- Belton, B.; Filipski, M. Rural transformation in central Myanmar: By how much, and for whom? J. Rural Stud. 2019, 67, 166–176. [Google Scholar] [CrossRef]


| System Layer | Elements Layer | Index Layer |
|---|---|---|
| Rural transformation development | Population development transformation | Urbanization rate (X1) |
| Proportion of rural non-agricultural employment (X2) | ||
| Proportion of non-agricultural income (X3) | ||
| Land use transformation | Proportion of cultivated land areas (X4) | |
| Proportion of woodland areas (X5) | ||
| Proportion of rural residential land (X6) | ||
| Industrial development transformation | Proportion of the output value of secondary and tertiary industries (X7) | |
| Proportion of machine-cultivated areas (X8) | ||
| Agricultural labor productivity (X9) |
| Time | Global Moran’s I | E(I) | Z(I) | P(I) |
|---|---|---|---|---|
| 1978 | 0.3453 | −0.1105 | 2.45 | 0.001 |
| 1988 | 0.3936 | −0.1106 | 2.48 | 0.001 |
| 1998 | 0.4378 | −0.1105 | 2.52 | 0.001 |
| 2008 | 0.4509 | −0.1104 | 2.59 | 0.001 |
| 2018 | 0.4892 | −0.1103 | 2.63 | 0.001 |
| Year | X1 | X2 | X3 | X4 | X5 | X6 | X7 |
|---|---|---|---|---|---|---|---|
| 1978 | 0.32 | 0.25 | 0.41 | 0.51 | 0.45 | 0.39 | 0.35 |
| 1988 | 0.27 | 0.21 | 0.42 | 0.56 | 0.49 | 0.42 | 0.38 |
| 1998 | 0.22 | 0.17 | 0.44 | 0.60 | 0.55 | 0.45 | 0.41 |
| 2008 | 0.17 | 0.14 | 0.49 | 0.65 | 0.59 | 0.48 | 0.44 |
| 2018 | 0.12 | 0.09 | 0.51 | 0.69 | 0.62 | 0.52 | 0.45 |
| R | 1978 | 1988 | 1998 | 2008 | 2018 |
|---|---|---|---|---|---|
| R (upper reaches) | 0.513 *** | 0.468 *** | 0.485 *** | 0.355 ** | 0.321 ** |
| R (middle reaches) | 0.536 *** | 0.501 *** | 0.472 *** | 0.401 *** | 0.352 ** |
| R (lower reaches) | 0.605 *** | 0.553 *** | 0.463 *** | 0.388 ** | 0.303 ** |
| City | Top 8 per Capita GDP(Yuan) | Rural Transformation Development Level | City | Last 8 per Capita GDP(Yuan) | Rural Transformation Development Level |
|---|---|---|---|---|---|
| Wuxi | 174,270 | 0.443 | Bozhou | 24,547 | 0.201 |
| Suzhou | 173,765 | 0.457 | Ganzhi | 24,446 | 0.187 |
| Nanjing | 152,886 | 0.432 | Shaoyang | 24,178 | 0.184 |
| Changzhou | 149,275 | 0.378 | Wenshan | 23,568 | 0.164 |
| Wuhan | 145,545 | 0.411 | Xiangxi | 22,885 | 0.172 |
| Hangzhou | 140,180 | 0.422 | Fuyang | 21,589 | 0.158 |
| Changsha | 136,920 | 0.384 | Bazhong | 19,458 | 0.152 |
| Shanghai | 134,982 | 0.455 | Zhaotong | 15,987 | 0.145 |
| Mean | 150,977 | 0.422 | Mean | 22,082 | 0.170 |
Publisher’s Note: MDPI stays neutral with regard to jurisdictional claims in published maps and institutional affiliations. |
© 2022 by the authors. Licensee MDPI, Basel, Switzerland. This article is an open access article distributed under the terms and conditions of the Creative Commons Attribution (CC BY) license (https://creativecommons.org/licenses/by/4.0/).
Share and Cite
Zhang, R.; Zhang, X. Spatial–Temporal Differentiation and the Driving Mechanism of Rural Transformation Development in the Yangtze River Economic Belt. Sustainability 2022, 14, 2584. https://doi.org/10.3390/su14052584
Zhang R, Zhang X. Spatial–Temporal Differentiation and the Driving Mechanism of Rural Transformation Development in the Yangtze River Economic Belt. Sustainability. 2022; 14(5):2584. https://doi.org/10.3390/su14052584
Chicago/Turabian StyleZhang, Rongtian, and Xiaolin Zhang. 2022. "Spatial–Temporal Differentiation and the Driving Mechanism of Rural Transformation Development in the Yangtze River Economic Belt" Sustainability 14, no. 5: 2584. https://doi.org/10.3390/su14052584
APA StyleZhang, R., & Zhang, X. (2022). Spatial–Temporal Differentiation and the Driving Mechanism of Rural Transformation Development in the Yangtze River Economic Belt. Sustainability, 14(5), 2584. https://doi.org/10.3390/su14052584