
Conventional RVS Methods for Seismic Risk Assessment for Estimating the Current Situation of Existing Buildings: A State-of-the-Art Review


Abstract
1. Introduction
- Section 2 examines the extensively used RVS methods developed over the last 30 years;
- Section 4 introduces an overview of the research projects and compares the RVS techniques;
- Section 5 is devoted to a discussion of the RVS methodologies;
- Section 6 offers conclusions and the authors’ recommendations for future studies for the further review of RVS techniques.
2. Review of Widely Used RVS Methods Developed over the Past 30 Years
- (1)
- Techniques for using instrumental and quantitative data; and
- (2)
- Methods for the acquisition of both quantitative and qualitative data [55].
2.1. RVS Standards of the United States
2.1.1. FEMA 154
- Buildings having acceptable seismic performances (); and
- Buildings that are seismically hazardous and need to be assessed with further detailed methodologies by a structural design professional specializing in seismic design ().
2.1.2. FEMA 155
- (1)
- The building poses a reasonable risk to life safety; and
- (2)
- The building is seismically hazardous [71].
2.1.3. FEMA 310
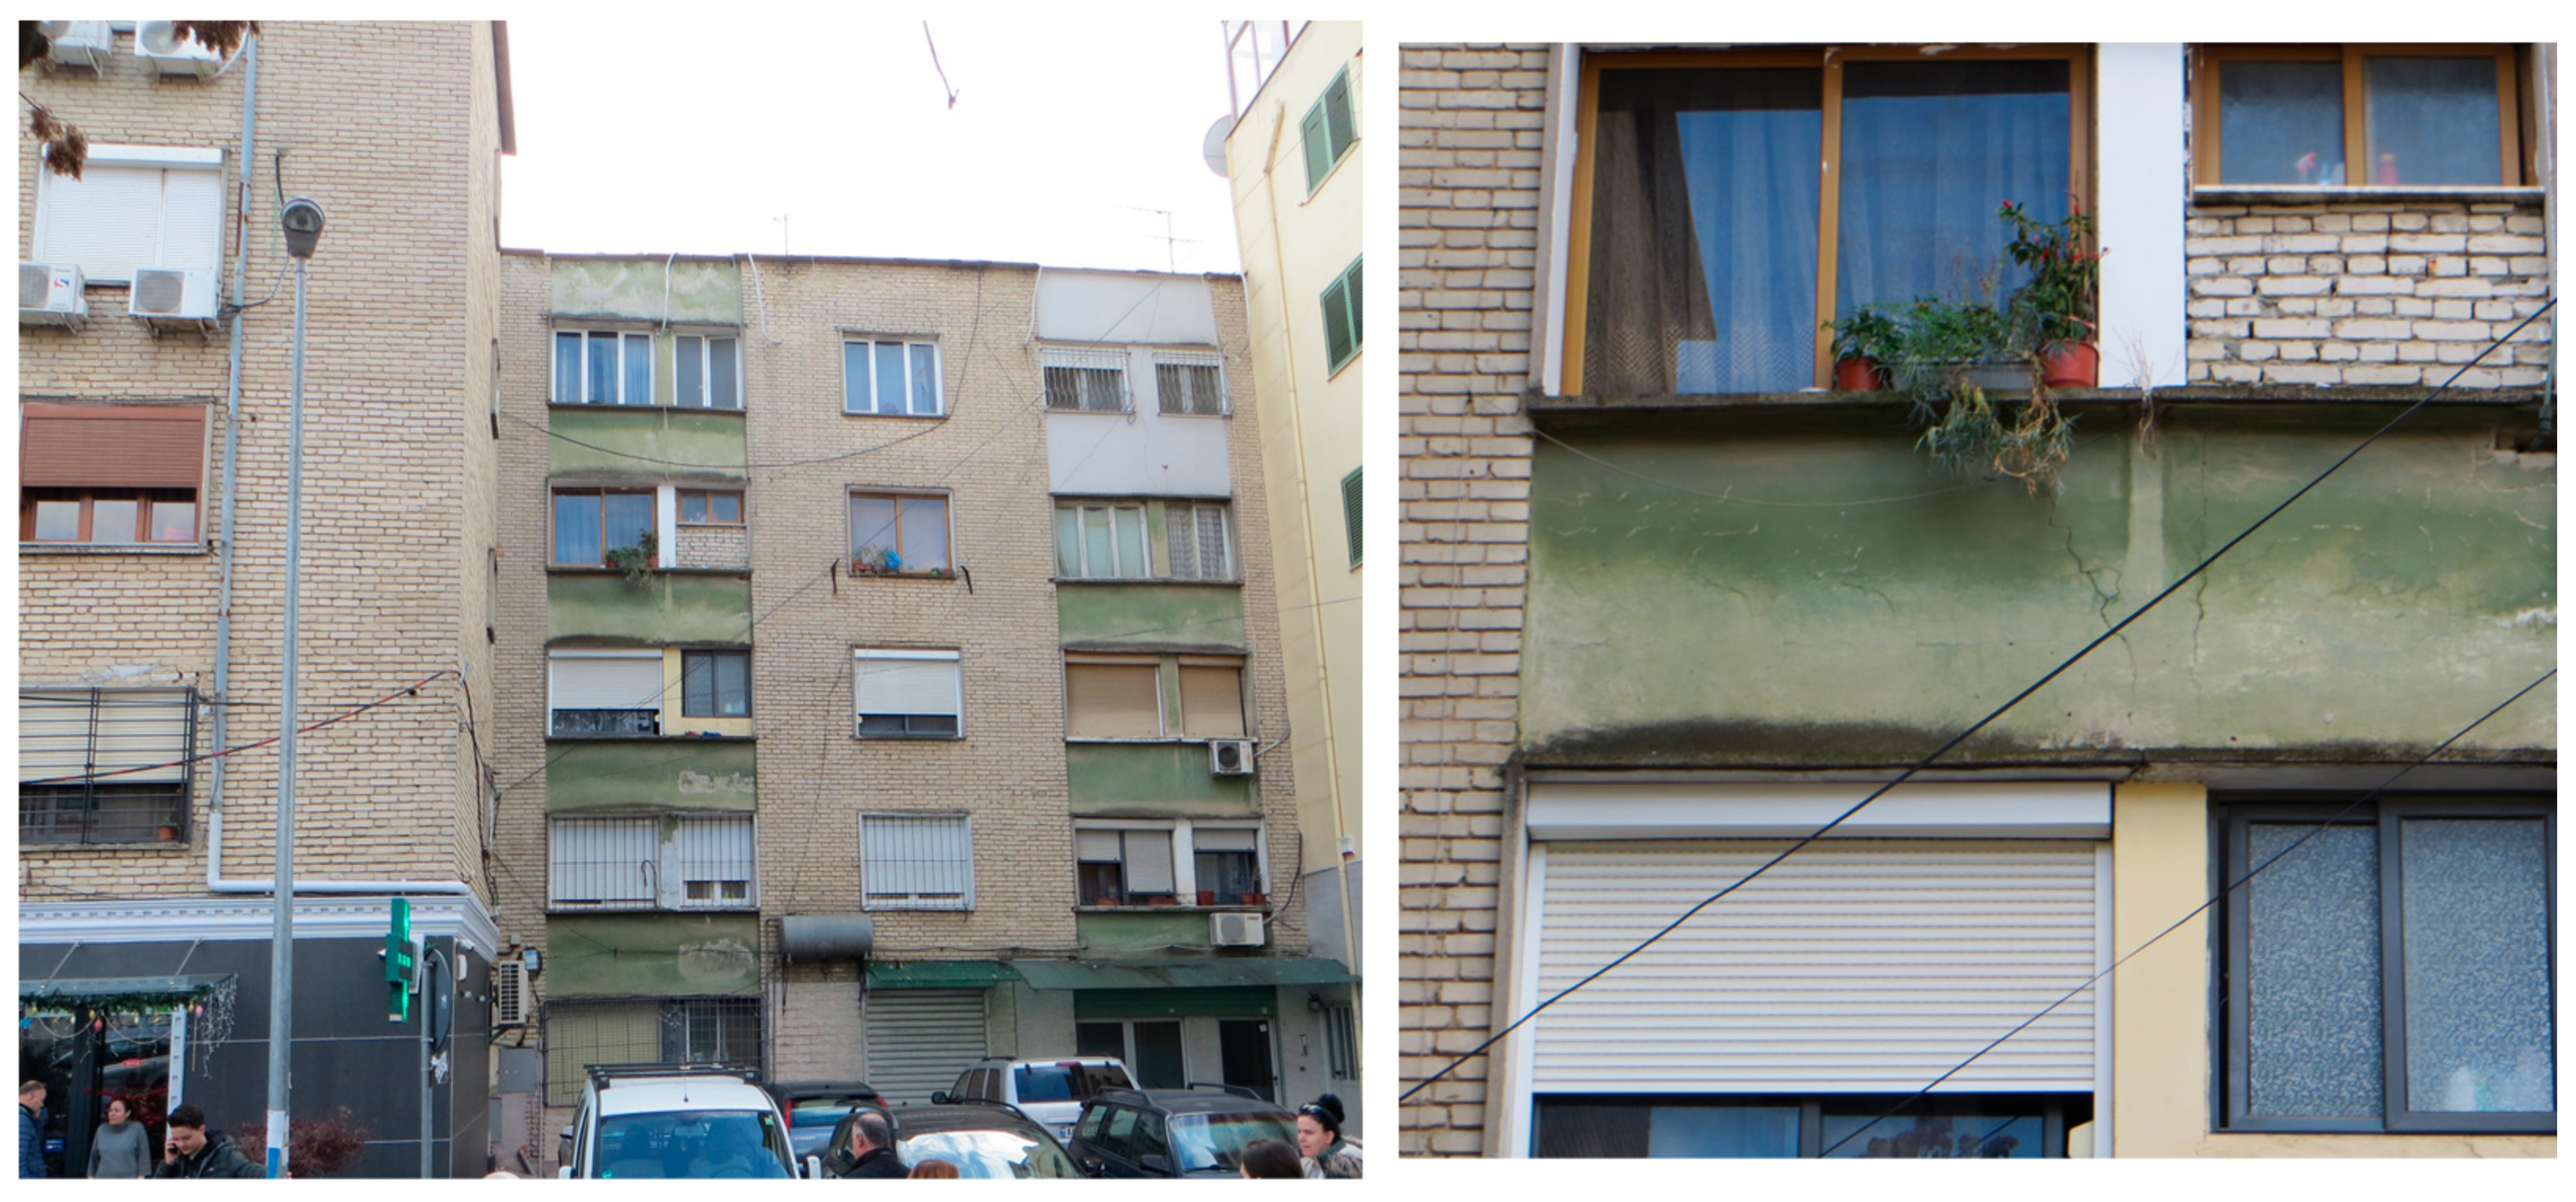
- Although there could be minor cracks in the exterior walls of URM structures, as is shown in Figure 3, for the initial occupancy damage state, they have no effect on the performance of the load-bearing system under lateral loads.
2.2. RVS Methodologies Developed by the European Union
2.2.1. EMS-98 Scale
- Negligible to slight damage (no structural damage, slight nonstructural damage);
- Moderate damage (slight structural damage, moderate nonstructural damage);
- Substantial to heavy damage (moderate structural damage, heavy nonstructural damage);
- Very heavy damage (heavy structural damage, very heavy nonstructural damage);
- Destruction (very heavy structural damage).
2.2.2. The RISK-UE Project
- 1.
- The vulnerability index () calculation of a single building:where is the vulnerability index; is the typological vulnerability index; () is the regional vulnerability factor, which is based on the building and the region characteristics given in Equation (5); and () is the seismic behavior modifier, which is based on previous damage data or expert judgement [101];
- 2.
- The calculation of the mean damage grade (). The mean damage grade () estimation is given in Equation (6):where Q is the ductility index that is based on the typology of the building and the construction features; and is the macroseismic (EMS-98) intensity, which usually varies between V and XII, and is expressed in Roman numerals. For residential buildings, 2.3 is selected as the ;
- 3.
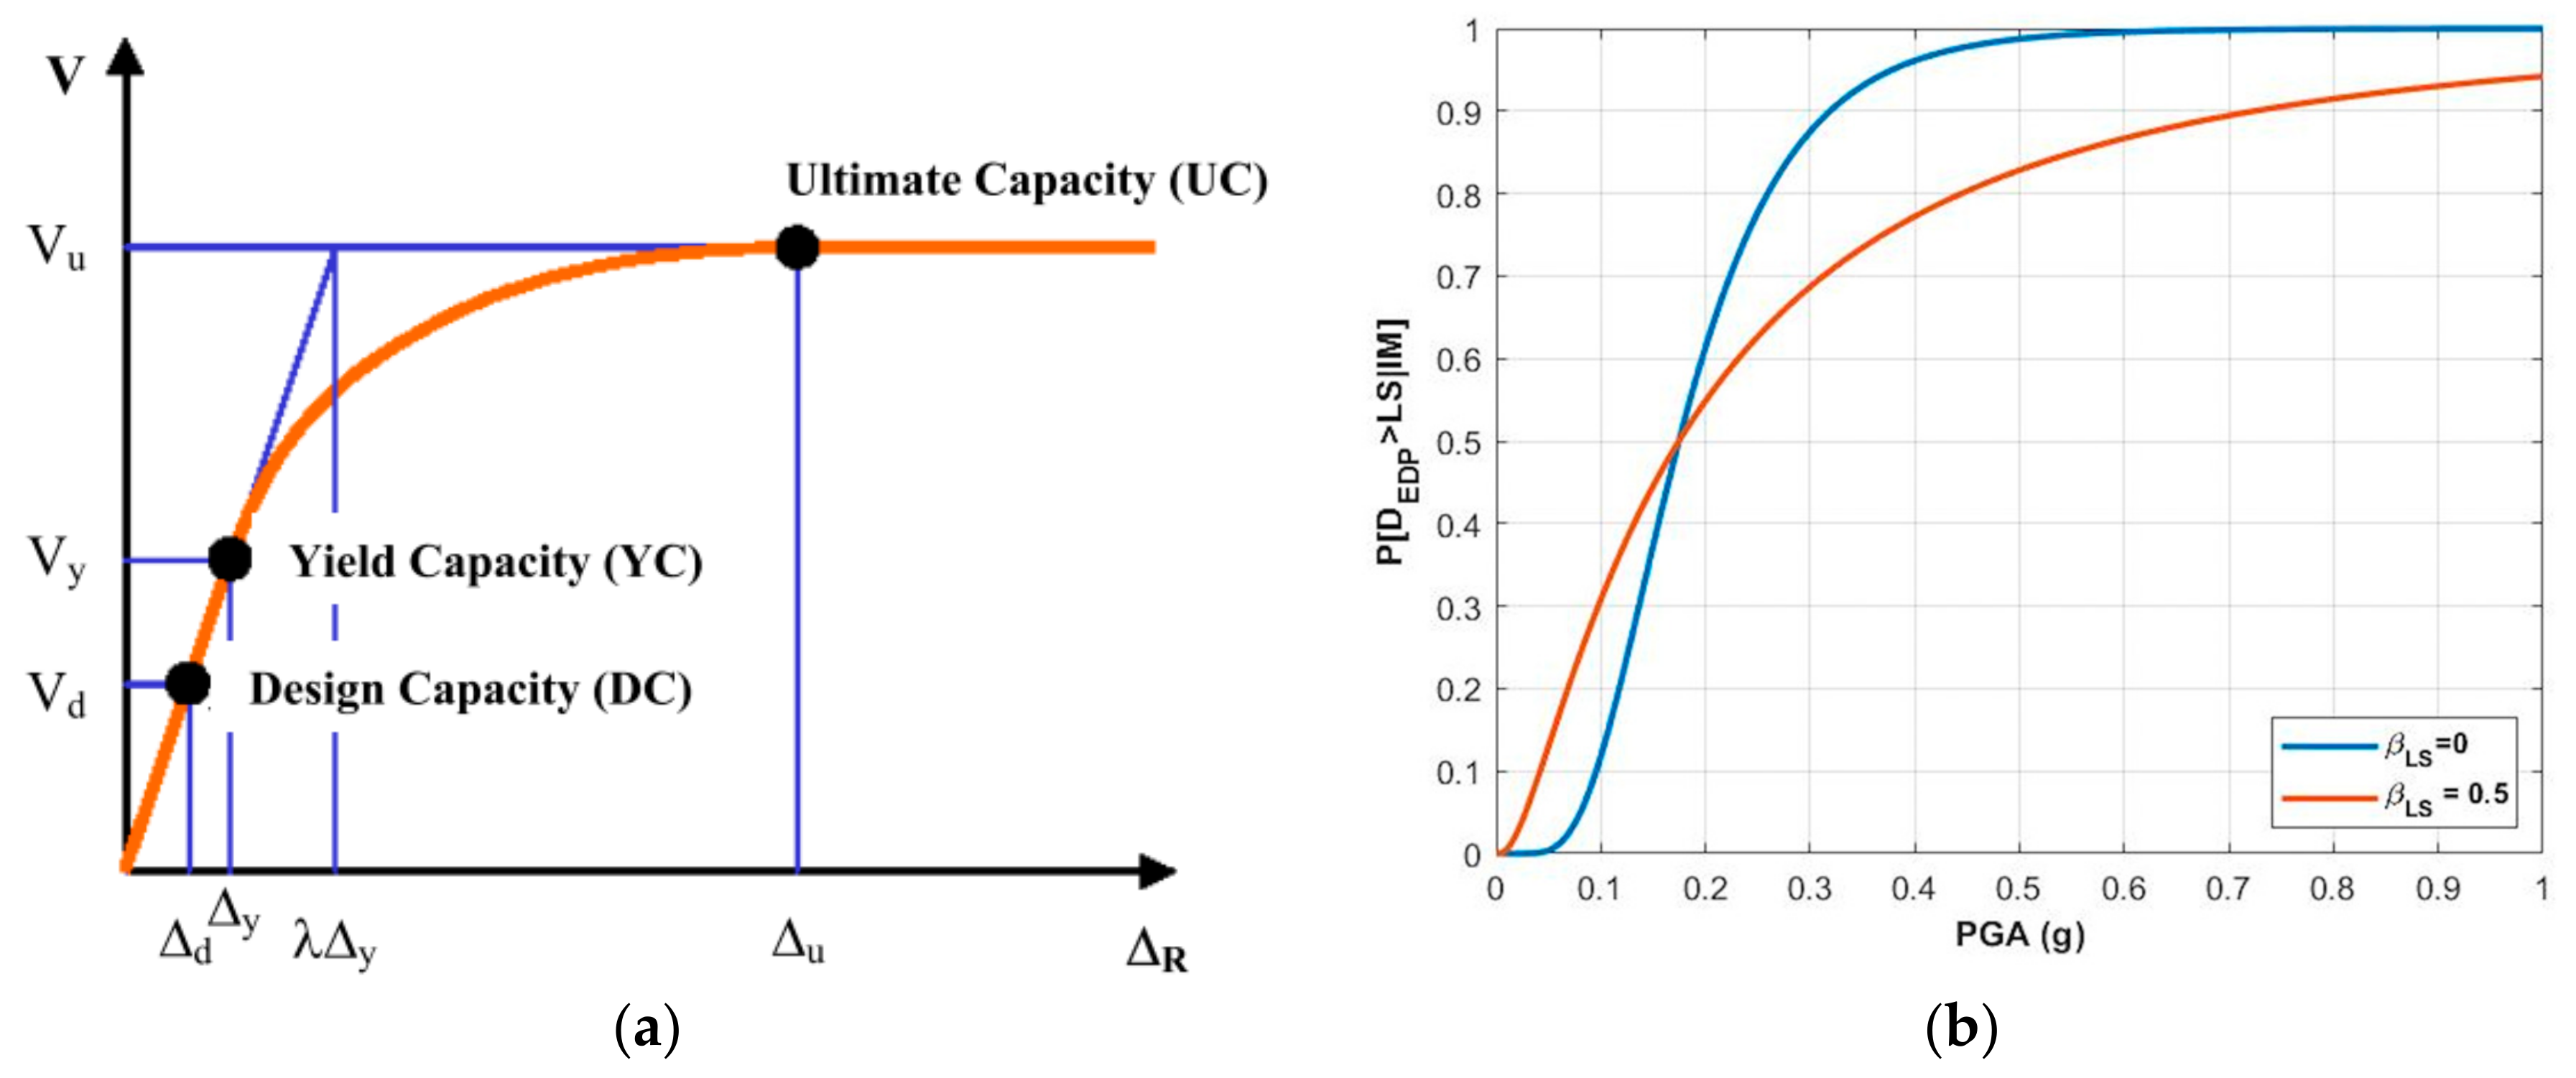
- Damage distribution evaluation (DPMs and fragility curve estimation).On the basis of the probability mass function of the binomial distribution, the probability of having damage, , which is a statistical demonstration of DPMs, is calculated with Equation (7) [94,102,103]. For various damage grades, the fragility curves consist of the , which is shown in Equation (8), and the [102]:where k = 0 to 5 is based on the EMS-98 damage thresholds; is the factorial sign; and is the weighted mean damage value. The mean damage grade () estimation is given in Equation (9), which has values ranging between 0 and 5, which are represented as . The mean damage grade estimation represents the estimated discrete damage distribution on the basis of the five damage grades described in the EMS-98 [94]:where are the discrete probability values for each damage grade shown in Equation (7). The macroseismic model (LM1) of the RISK-UE has been used by Boutaraa et al. [99] to assess the buildings of Chlef City in Algeria.The microseismic model (LM2) of the RISK-UE, which is based on the capacity and fragility model, has been used to examine urban seismic risk [90,98]. By using capacity curves (pushover curves), Figure 4 is obtained, which depicts the nonlinear behavior of the models and the variations between the design, the yield, and the ultimate structural strength level points. Fragility curves are used to estimate the likelihood of being in, or exceeding, a certain damage scenario, and they are explained in detail by Milutinovic and Trendafiloski [12]. Boutaraa et al. [99] indicate that the RISK-UE LM2 approach is appropriate for particular locations with comprehensive seismic site data, depending on the spectral acceleration, the velocity, and the displacement values.
2.3. RVS Methodology Applied in Japan
2.4. RVS Methodology Used in New Zealand
2.5. RVS Technique in Greece
2.6. Canadian RVS Methodology
| * A: | Seismicity | * B: | Soil conditions | * C: | Type of structure | ||
| * D: | Irregularities | * E: | Building importance | * F: | Max (F1, F2) | * F1: | Falling hazards to life |
| * F2: | Hazards to vital operations | ||||||
2.7. RVS Methodology Developed in Italy
2.7.1. Level I
2.7.2. Level II
2.8. RVS Methodologies Developed for the Indian Building Stock
2.9. RVS in Turkey
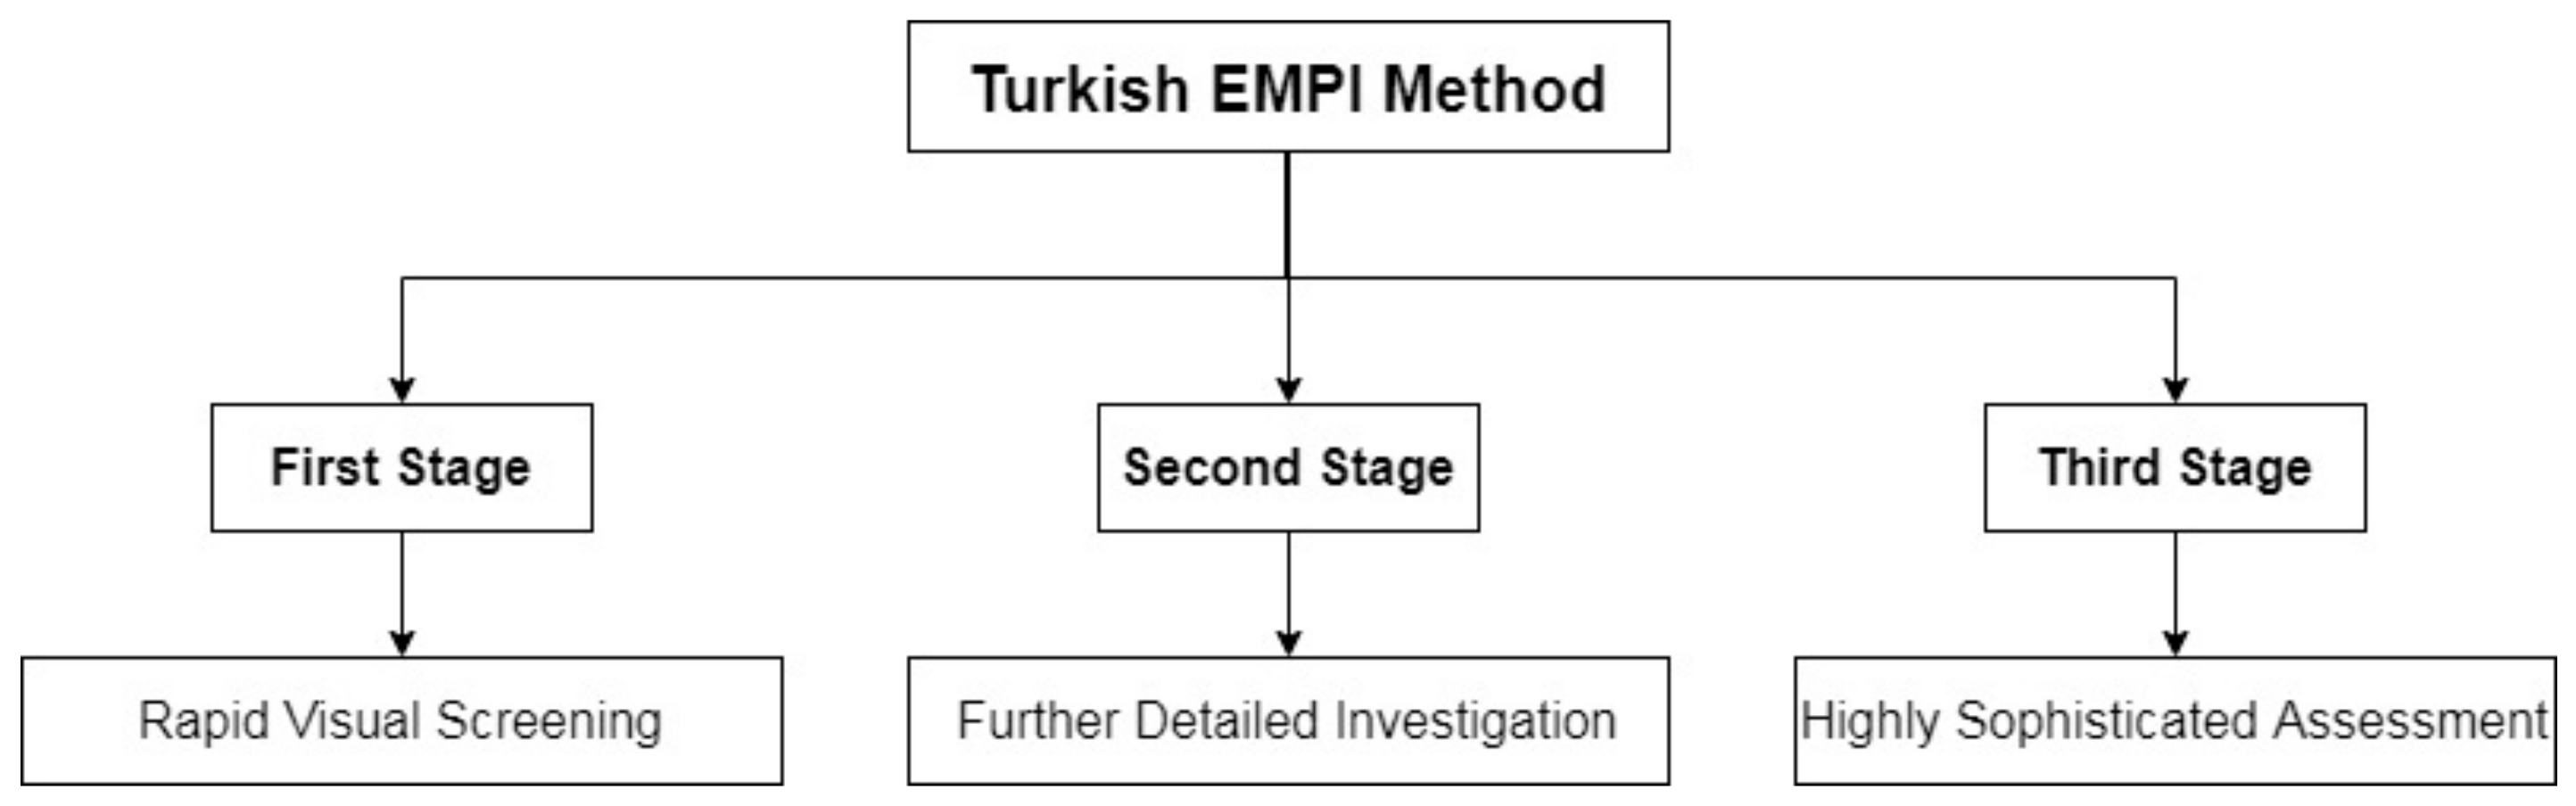
2.9.1. EMPI Method
2.9.2. The RBTE-2019 Method
3. RVS Methods Developed for Regional and Special Building Types
3.1. RVS Methodologies Developed Partially on the Basis of Previously Presented RVS Methods and Used Regionally
3.2. RVS Methodologies Developed for Special Types of Buildings
4. Overview of Research Projects Concerning Comparison of RVS Methods
4.1. Comparison of RVS Methods
4.2. Comparison of RVS with Detailed Vulnerability Assessment
5. Discussion on RVS Methodologies
6. Conclusions
Author Contributions
Funding
Institutional Review Board Statement
Informed Consent Statement
Data Availability Statement
Conflicts of Interest
References
- Coburn, A.; Spence, R. Earthquake Protection; John Wiley & Sons, Ltd.: Hoboken, NJ, USA, 2006. [Google Scholar] [CrossRef]
- Ketsap, A.; Hansapinyo, C.; Kronprasert, N.; Limkatanyu, S. Uncertainty and fuzzy decisions in earthquake risk evaluation of buildings. Eng. J. 2019, 23, 89–105. [Google Scholar] [CrossRef]
- Di Bari, R.; Belleri, A.; Marini, A.; Horn, R.; Gantner, J. Probabilistic life-cycle assessment of service life extension on renovated buildings under seismic hazard. Buildings 2020, 10, 48. [Google Scholar] [CrossRef]
- Harirchian, E.; Lahmer, T. Improved Rapid Assessment of Earthquake Hazard Safety of Structures via Artificial Neural Networks. IOP Conf. Ser. Mater. Sci. Eng. 2020, 897, 012014. [Google Scholar] [CrossRef]
- Calvi, G.M.; Pinho, R.; Magenes, G.; Bommer, J.J.; Restrepo-Vélez, L.F.; Crowley, H. Development of seismic vulnerability assessment methodologies over the past 30 years. ISET J. Earthq. Technol. 2006, 43, 75–104. [Google Scholar]
- Rossetto, T.; Ioannou, I.; Grant, D.N. Existing Empirical Fragility and Vulnerability Relationships: Compendium and Guide for Selection. GEM Tech. Rep. 2015, 1, 77. [Google Scholar]
- Porter, K.A. Rapid Observation of Vulnerability and Estimation of Risk (ROVER): End-to-end seismic risk management software. In Proceedings of the 9th US National and 10th Canadian Conference on Earthquake Engineering 2010, Including Papers from the 4th International Tsunami Symposium, Toronto, ON, Canada, 25–29 July 2010; Volume 4, pp. 3078–3087. [Google Scholar]
- Federal Emergency Management Agency (FEMA). FEMA P-154: Rapid Visual Screening of Buildings for Potential Seismic Hazards: A Handbook; Applied Technological Council (ATC): Waschington, DC, USA, 2015. [Google Scholar]
- Federal Emergency Management Agency (FEMA). FEMA 154 (ATC-21): Rapid Visual Screening of Buildings for Potential Seismic Hazards: A Handbook; Applied Technological Council (ATC): Washington, DC, USA, 1988. [Google Scholar]
- Federal Emergency Management Agency (FEMA). FEMA 154: Rapid Visual Screening of Buildings for Potential Seismic Hazards: A Handbook; Applied Technological Council (ATC): Washington, DC, USA, 2002. [Google Scholar]
- Grünthal, G. European Macroseismic Scale 1998 (EMS-98); European Seismological Commission: Luxembourg, 1998. [Google Scholar]
- Milutinovic, Z.V.; Trendafiloski, G.S. RISK-UE Project: An Advanced Approach to Earthquake Risk Scenarios with Applications to Different European Towns: WP4: Vulnerability of Current Buildings; European Commission: Brussels, Belgium, 2003. [Google Scholar]
- OASP (Greek Earthquake Planning and Protection Organization). Provisions for Pre-Earthquake Vulnerability Assessment of Public Buildings (Part A); OASP (Greek Earthquake Planning and Protection Organization): Athens, Greece, 2000. [Google Scholar]
- National Research Council (NRC). Manual for Screening of Buildings for Seismic Investigation; National Research Council of Canada: Ottawa, ON, Canada, 1993; ISBN 0-660-15381-5. [Google Scholar]
- Harirchian, E.; Lahmer, T. Earthquake Hazard Safety Assessment of Buildings via Smartphone App: A Comparative Study. IOP Conf. Ser. Mater. Sci. Eng. 2019, 652, 1. [Google Scholar] [CrossRef]
- Nanda, R.P.; Majhi, D.R. Review on Rapid Seismic Vulnerability Assessment for Bulk of Buildings. J. Inst. Eng. (India) Ser. A 2014, 94, 187–197. [Google Scholar] [CrossRef]
- Aftabur, R.; Shajib, U. Seismic vulnerability assessment of RC structures: A review. Int. J. Sci. Emerg. Technol. 2012, 4, 171–177. [Google Scholar]
- Mishra, S. Guide Book for Integrated Rapid Visual Screening of Buildings for Seismic Hazard; TARU Leading Edge Private Ltd.: Gurgaon, India, 2014. [Google Scholar]
- Aksoylu, C.; Mobark, A.; Hakan Arslan, M.; Hakkı Erkan, İ. A comparative study on ASCE 7–16, TBEC-2018 and TEC-2007 for reinforced concrete buildings. Rev. de la Construcción 2020, 19, 282–305. [Google Scholar] [CrossRef]
- Shabani, A.; Kioumarsi, M.; Zucconi, M. State of the art of simplified analytical methods for seismic vulnerability assessment of unreinforced masonry buildings. Eng. Struct. 2021, 239, 112280. [Google Scholar] [CrossRef]
- Swathi, S.; Venkataramana, K.; Rajasekaran, C. Evaluation of Performance Point of Structure Using Capacity Spectrum Method. Appl. Mech. Mater. 2018, 877, 299–304. [Google Scholar] [CrossRef]
- Weber, F.; Meier, L.; Distl, J.; Braun, C. Optimum Design of Curved Surface Sliders for Minimum Structural Acceleration and Its Sensitivity. Geosciences 2018, 8, 83. [Google Scholar] [CrossRef]
- Gentile, R.; Galasso, C. Simplicity versus accuracy trade-off in estimating seismic fragility of existing reinforced concrete buildings. Soil Dyn. Earthq. Eng. 2021, 144, 106678. [Google Scholar] [CrossRef]
- Silva, V.; Akkar, S.; Baker, J.; Bazzurro, P.; Castro, J.M.; Crowley, H.; Dolsek, M.; Galasso, C.; Lagomarsino, S.; Monteiro, R.; et al. Current Challenges and Future Trends in Analytical Fragility and Vulnerability Modelling. Earthq. Spectra 2019, 35, 37. [Google Scholar] [CrossRef]
- Abd-Elhamid, S.G.; El-Tahawy, R.M.G.E.; El-Din Fayed, M.N. Dynamic behavior of multi-story concrete buildings based on non-linear pushover & time history analyses. Adv. Sci. Technol. Eng. Syst. 2020, 5, 143–153. [Google Scholar] [CrossRef][Green Version]
- Adhikari, R.K.; D’Ayala, D.; Norris, A. Seismic Performance Evaluation of the Existing and Retrofitted Stone Masonry Houses in Nepal. In Proceedings of the 17th World Conference on Earthquake Engineering, 2020, 17WCEE; Available online: https://www.researchgate.net/publication/344352682_SEISMIC_PERFORMANCE_EVALUATION_OF_THE_EXISTING_AND_RETROFITTED_STONE_MASONRY_HOUSES_IN_NEPAL (accessed on 19 February 2022).
- Alothman, A.; Mangalathu, S.; Hashemi, J.; Al-Mosawe, A.; Alam, M.D.M.; Allawi, A. The effect of ground motion characteristics on the fragility analysis of reinforced concrete frame buildings in Australia. Structures 2021, 34, 3583–3595. [Google Scholar] [CrossRef]
- Wijaya, H.; Rajeev, P.; Gad, E.; Amirsardari, A. Effect of Infill-Wall Material Types and Modeling Techniques on the Seismic Response of Reinforced Concrete Buildings. Nat. Hazards Rev. 2020, 21, 04020031. [Google Scholar] [CrossRef]
- Rawat, A.; Mittal, V.; Chakraborty, T.; Matsagar, V. Earthquake induced sloshing and hydrodynamic pressures in rigid liquid storage tanks analyzed by coupled acoustic-structural and Euler-Lagrange methods. Thin-Walled Struct. 2019, 134, 333–346. [Google Scholar] [CrossRef]
- Estekanchi, H.E.; Mashayekhi, M.; Vafai, H.; Ahmadi, G.; Mirfarhadi, S.A.; Harati, M. A state-of-knowledge review on the endurance time method. Structures 2020, 27, 2288–2299. [Google Scholar] [CrossRef]
- Pang, Y.; Wang, X. Enhanced endurance-time-method (EETM) for efficient seismic fragility, risk and resilience assessment of structures. Soil Dyn. Earthq. Eng. 2021, 147, 106731. [Google Scholar] [CrossRef]
- Estekanchi, H.E.; Vafai, A.; Sadeghazar, M. Endurance Time method for seismic analysis and design of structures. Sci. Iran. 2004, 11, 4–361. [Google Scholar]
- Hariri-Ardebili, M.A.; Rahmani-Samani, H.; Mirtaheri, M. Seismic Stability Assessment of a High-Rise Concrete Tower Utilizing Endurance Time Analysis. Int. J. Str. Stab. Dyn. 2014, 14, 1450016. [Google Scholar] [CrossRef]
- Mashayekhi, M.R.; Mirfarhadi, S.A.; Estekanchi, H.E.; Vafai, H. Predicting probabilistic distribution functions of response parameters using the endurance time method. Struct. Des. Tall Spec. Build. 2019, 28, 1. [Google Scholar] [CrossRef]
- Mirzaee, A.; Estekanchi, H.E.; Vafai, A. Improved methodology for endurance time analysis: From time to seismic hazard return period. Sci. Iran. 2012, 19, 1180–1187. [Google Scholar] [CrossRef]
- Mackie, K.R.; Stojadinović, B. Comparison of Incremental Dynamic, Cloud, and Stripe Methods for Computing Probabilistic Seismic Demand Models. In Structures Congress 2005; American Society of Civil Engineers: New York, NY, USA, 2005; pp. 1–11. [Google Scholar] [CrossRef]
- Miano, A.; Jalayer, F.; Ebrahimian, H.; Prota, A. Cloud to IDA: Efficient fragility assessment with limited scaling. Earthq. Eng. Struct. Dyn. 2018, 47, 1124–1147. [Google Scholar] [CrossRef]
- NEHRP Consultants Joint Venture. Evaluation of the FEMA P-695 Methodology for Quantification of Building Seismic Performance Factors (NIST GCR 10-917-8); National Institute of Standards and Technology, US Department of Commerce: Gaithersburg, MD, USA, 2010. [Google Scholar]
- Baker, J.W. Efficient Analytical Fragility Function Fitting Using Dynamic Structural Analysis. Earthq. Spectra 2015, 31, 579–599. [Google Scholar] [CrossRef]
- Vamvatsikos, D.; Cornell, C.A. Incremental dynamic analysis. Earthq. Eng. Struct. Dyn. 2002, 31, 491–514. [Google Scholar] [CrossRef]
- Vamvatsikos, D.; Cornell, C.A. The Incremental Dynamic Analysis and its application to Performance-Based Earthquake Engineering. In Proceedings of the 12th European Conference on Earthquake Engineering, London, UK, 9–13 September 2002; p. 10. [Google Scholar]
- Vamvatsikos, D. Incremental Dynamic Analysis. Encycl. Earthq. Eng. 2002. [Google Scholar] [CrossRef]
- Zaker Esteghamati, M.; Farzampour, A. Probabilistic seismic performance and loss evaluation of a multi-story steel building equipped with butterfly-shaped fuses. J. Constr. Steel Res. 2020, 172, 106187. [Google Scholar] [CrossRef]
- Burton, H.V.; Deierlein, G.G. Integrating visual damage simulation, virtual inspection, and collapse capacity to evaluate post-earthquake structural safety of buildings. Earthq. Eng. Struct. Dyn. 2018, 47, 294–310. [Google Scholar] [CrossRef]
- Zaker Esteghamati, M.; Lee, J.; Musetich, M.; Flint, M.M. INSSEPT: An open-source relational database of seismic performance estimation to aid with early design of buildings. Earthq. Spectra 2020, 36, 2177–2197. [Google Scholar] [CrossRef]
- Zaker Esteghamati, M.; Banazadeh, M.; Huang, Q. The effect of design drift limit on the seismic performance of RC dual high-rise buildings. Struct. Des. Tall Spec. Build. 2018, 27, e1464. [Google Scholar] [CrossRef]
- Aksoylu, C.; Kara, N. Strengthening of RC frames by using high strength diagonal precast panels. J. Build. Eng. 2020, 31, 101338. [Google Scholar] [CrossRef]
- Eghbali, M.; Samadian, D.; Ghafory-Ashtiany, M.; Raissi Dehkordi, M. Recovery and reconstruction of schools after M 7.3 Ezgeleh-Sarpole-Zahab earthquake; part II: Recovery process and resiliency calculation. Soil Dyn. Earthq. Eng. 2020, 139, 106327. [Google Scholar] [CrossRef]
- Wasti, S.T.; Özcebe, G. Seismic Assessment and Rehabilitation of Existing Buildings; Springer Science & Business Media: Berlin/Heidelberg, Germany, 2003; Volume 29. [Google Scholar]
- Scala, S.A.; Gaudio, C.D.; Ricci, P.; Verderame, G.M.; Prota, A. The effect of retrofit intervention on empirical vulnerability curves of Italian masonry buildings. In Proceedings of the 17th World Conference on Earthquake Engineering, Sendai, Japan, 13–18 September 2020. [Google Scholar]
- Sinha, R.; Goyal, A. A National Policy for Seismic Vulnerability Assessment of Buildings and Procedure for Rapid Visual Screening of Buildings for Potential Seismic Vulnerability. 2004. Available online: https://www.researchgate.net/publication/264876838 (accessed on 19 February 2022).
- Harirchian, E.; Kumari, V.; Jadhav, K.; Das, R.R.; Rasulzade, S.; Lahmer, T. A Machine Learning Framework for Assessing Seismic Hazard Safety of Reinforced Concrete Buildings. Appl. Sci. 2020, 10, 7153. [Google Scholar] [CrossRef]
- Jainih, V.; Harith, N.S.H. Seismic vulnerability assessment in Kota Kinabalu, Sabah. IOP Conf. Ser. Earth Environ. Sci. 2020, 476, 012053. [Google Scholar] [CrossRef]
- Boissonnade, A.C.; Shah, H.C. Use of Pattern Recognition and Fuzzy Sets in Seismic Risk Analysis; Stanford University: Stanford, CA, USA, 1985; pp. 1–231. [Google Scholar]
- Sangiorgio, V.; Uva, G.; Adam, J.M. Integrated Seismic Vulnerability Assessment of Historical Masonry Churches Including Architectural and Artistic Assets Based on Macro-element Approach. Int. J. Archit. Herit. 2020, 15, 1609–1622. [Google Scholar] [CrossRef]
- Gautam, D.; Adhikari, R.; Rupakhety, R.; Koirala, P. An empirical method for seismic vulnerability assessment of Nepali school buildings. Bull. Earthq. Eng. 2020, 18, 5965–5982. [Google Scholar] [CrossRef]
- Idham, N.C. Seismic Vulnerability Assessment in Vernacular Houses: The Rapid Visual Screening Procedure for Non Engineered Building with Application to Java Indonesia. Ph.D. Thesis, Eastern Mediterranean University, Gazimağusa, Cyprus, 2011. [Google Scholar]
- Pilipinas, B. Preliminary Existing Condition Survey: The Orphan Churches of Bohol, Tagbilaran City Bohol, Philippines. 2015. Available online: https://bakaspilipinas.files.wordpress.com/2016/02/2015-oct-final-bohol-report-orphan-churches-optimzed.pdf (accessed on 15 February 2022).
- Lizundia, B.; Durphy, S.; Griffin, M.; Hortacsu, A.; Kehoe, B.; Porter, K.; Welliver, B. Rapid visual screening of buildings for potential seismic hazards: FEMA 154 and FEMA 155 updates. In Proceedings of the NCEE 2014—10th U.S. National Conference on Earthquake Engineering: Frontiers of Earthquake Engineering, Anchorage, AK, USA, 21–25 July 2014. [Google Scholar] [CrossRef]
- Shahriar, A.; Modirzadeh, M.; Sadiq, R.; Tesfamariam, S. Seismic induced damageability evaluation of steel buildings: A Fuzzy-TOPSIS method. Earthq. Struct. 2012, 3, 695–717. [Google Scholar] [CrossRef]
- Kapetana, P.; Dritsos, S. Seismic assessment of buildings by rapid visual screening procedures. In Proceedings of the 6th International Conference on Earthquake Resistant Engineering Structures, Belogna, Italy, 11 May 2007; Available online: https://www.witpress.com/Secure/elibrary/papers/ERES07/ERES07039FU1.pdf (accessed on 15 February 2022).
- Jaiswal, O.R.; Rai, D.C.; Jain, S.K. Review of Seismic Codes on Liquid-Containing Tanks. Earthq. Spectra 2007, 23, 239–260. [Google Scholar] [CrossRef]
- Harirchian, E.; Lahmer, T.; Buddhiraju, S.; Mohammad, K.; Mosavi, A. Earthquake safety assessment of buildings through rapid visual screening. Buildings 2020, 10, 51. [Google Scholar] [CrossRef]
- Tesfamariam, S.; Liu, Z. Earthquake induced damage classification for reinforced concrete buildings. Struct. Saf. 2010, 32, 154–164. [Google Scholar] [CrossRef]
- Federal Emergency Management Agency (FEMA). FEMA 155 (ATC-21-1): Rapid Visual Screening of Buildings for Potential Seismic Hazards: Supporting Documentation; Applied Technological Council (ATC): Washington, DC, USA, 1988. [Google Scholar]
- Federal Emergency Management Agency (FEMA). FEMA P-155: Rapid Visual Screening of Buildings for Potential Seismic Hazards: Supporting Documentation; Applied Technological Council (ATC): Washington, DC, USA, 2015. [Google Scholar]
- Federal Emergency Management Agency (FEMA). FEMA 155: Rapid Visual Screening of Buildings for Potential Seismic Hazards: Supporting Documentation; Applied Technological Council (ATC): Washington, DC, USA, 2002. [Google Scholar]
- Federal Emergency Management Agency (FEMA). FEMA 310: Handbook for the Seismic Evaluation of Buildings—A Prestandard; Applied Technological Council (ATC): Washington, DC, USA, 1998. [Google Scholar]
- Rojahn, C. The Applied Technology Council: An Historical Perspective. In Proceedings of the 14th World Conference on Earthquake Engineering (14WCEE), Beijing, China, 12–17 October 2008. [Google Scholar]
- Murashko, O.; Benradi, I. Analysis of World Experience in the Field of Rapid Visual Screen. 2015. [Google Scholar]
- Kegyes-Brassai, O.K. Earthquake Hazard Analysis and Building Vulnerability Assessment to Determine the Seismic Risk of Existing Buildings in an Urban Area; Széchenyi István University: Győr, Hungary, 2014. [Google Scholar]
- Federal Emergency Management Agency (FEMA). FEMA 178: NEHRP Handbook for the Seismic Evaluation of Existing Buildings—A Handbook; Applied Technological Council (ATC): Washington, DC, USA, 1992. [Google Scholar]
- Federal Emergency Management Agency (FEMA). FEMA 178: NEHRP Handbook for the Seismic Evaluation of Existing Buildings—A Handbook; Applied Technological Council (ATC): Washington, DC, USA, 1989. [Google Scholar]
- Kehoe, B. Standardizing seismic evaluation of existing buildings. In Proceedings of the 13th World Conference on Earthquake Engineering, Vancouver, BC, Canada, 1–6 August 2004; p. 12. [Google Scholar]
- Haryanto, Y.; Hu, H.-T.; Widyaningrum, A.; Alfidiah, E.; Hidayat, B.A. FEMA 310 Tier 1 seismic evaluation of existing building: A case study of a 7-story academic RC building of Jenderal Soedirman University, Indonesia. IOP Conf. Ser. Mater. Sci.Eng. 2020, 982, 012031. [Google Scholar] [CrossRef]
- Haryanto, Y.; Hu, H.-T.; Han, A.L.; Hidayat, B.A.; Widyaningrum, A.; Yulianita, P.E. Seismic Vulnerability Assessment Using Rapid Visual Screening: Case Study of Educational Facility Buildings of Jenderal Soedirman University, Indonesia. Civ. Eng. Dimens. 2020, 22, 13–21. [Google Scholar] [CrossRef]
- Karbassi, A. Performance-Based Seismic Vulnerability Evaluation of Existing Buildings in Old Sectors of Quebec. Ph.D. Thesis, École de Technologie Superieure, Montréal, QC, Canada, 2010. [Google Scholar]
- Rai, D.C. Review of Documents on Seismic Evaluation of Existing Buildings. 2005. Available online: http://www.iitk.ac.in/nicee/IITK-GSDMA/EQ03.pdf (accessed on 15 February 2022).
- Tesfamariam, S. Seismic Risk Assessment of Reinforced Concrete Buildings Using Fuzzy Based Techniques. Ph.D. Thesis, University of Ottawa, Ottawa, ON, Canada, 2008. [Google Scholar]
- Alam, N.; Alam, M.S.; Tesfamariam, S. Buildings’ seismic vulnerability assessment methods: A comparative study. Nat. Hazards 2012, 62, 405–424. [Google Scholar] [CrossRef]
- Al-Nimry, H.; Resheidat, M.; Qeran, S. Rapid assessment for seismic vulnerability of low and medium rise infilled RC frame buildings. Earthq. Eng. Eng. Vib. 2015, 14, 275–293. [Google Scholar] [CrossRef]
- Pittore, M.; Graziani, L.; Maramai, A.; Haas, M.; Parolai, S.; Tertulliani, A. Bayesian Estimation of Macroseismic Intensity from Post-Earthquake Rapid Damage Mapping. Earthq. Spectra 2018, 34, 1809–1828. [Google Scholar] [CrossRef]
- Musson, R.M.W.; Grünthal, G.; Stucchi, M. The comparison of macroseismic intensity scales. J. Seismol. 2010, 14, 413–428. [Google Scholar] [CrossRef]
- Bernardini, A.; Giovinazzi, S.; Lagomarsino, S.; Parodi, S. Implied Damage Probability Matrices in the EMS-98 Scale (Matrici di Probabilità di Danno Implicite Nella Scala EMS-98). 2007, p. 11. Available online: https://ir.canterbury.ac.nz/bitstream/handle/10092/4032/12625875_25_ANIDIS%202007_1_DPM_danno_28.03.07.pdf?sequence=1&isAllowed=y (accessed on 15 February 2022).
- Guéguen, P. (Ed.) Seismic Vulnerability of Structures; ISTE Ltd.: London, UK, 2013. [Google Scholar]
- Bernardini, A.; Giovinazzi, S.; Lagomarsino, S.; Parodi, S. The Vulnerability Assessment of Current Buildings by a Macroseismic Approach Derived from the EMS-98 Scale. 2007, p. 15. Available online: https://ir.canterbury.ac.nz/bitstream/handle/10092/3990/12625560_Girona%202007%20-%20Bernardini%20-%20Giovinazzi%20Parodi%20Lagomarsino.pdf?sequence=1 (accessed on 15 February 2022).
- Apostol, I. Seismic Vulnerability Assessment of Historical Urban Centres. Ph.D. Thesis, Universitatea Politehnica Timişoara, Timișoara, Romania, 2020. [Google Scholar]
- Lagomarsino, S.; Giovinazzi, S. Macroseismic and mechanical models for the vulnerability and damage assessment of current buildings. Bull. Earthq. Eng. 2006, 4, 415–443. [Google Scholar] [CrossRef]
- D’Ayala, D. Assessing the Seismic Vulnerability of Masonry Buildings; Woodhead Publishing: Thorston, UK, 2013. [Google Scholar] [CrossRef]
- Giovinazzi, S.; Lagomarsino, S.; Pampanin, S. Vulnerability Methods and Damage Scenario for Seismic Risk Analysis as Support to Retrofit Strategies: An European Perspective. 2006. Available online: https://ir.canterbury.ac.nz/handle/10092/439 (accessed on 15 February 2022).
- Giovinazzi, S.; Lagomarsino, S. A methodology for the seismic vulnerability analysis of the buildings (Una metodologia per l’analisi di vulnerabilità sismica del costruito). In Proceedings of the X Congresso Nazionale “L’ingegneria Sismica in Italia”, Potenza-Matera, Potenza, Italy, 9–13 September 2001; pp. 9–13. [Google Scholar]
- Giovinazzi, S. The Vulnerability Assessment and the Damage Scenario in Seismic Risk Analysis. Ph.D. Thesis, Technical University Carolo-Wilhelmina, Lanciano, Italy, 2005. Available online: https://publikationsserver.tu-braunschweig.de/receive/dbbs_mods_00001757 (accessed on 19 February 2022).
- Giovinazzi, S.; Lagomarsino, S. A macroseismic method for the vulnerability assessment of buildings. In Proceedings of the 13th World Conference on Earthquake Engineering, Vancouver, BC, Canada, 1–6 August 2004. [Google Scholar]
- Ademović, N.; Hadzima-Nyarko, M.; Zagora, N. Seismic Vulnerability Assessment of Masonry Buildings in Banja Luka and Sarajevo (Bosnia and Herzegovina) Using the Macroseismic Model; Springer: Dordrecht, The Netherlands, 2020. [Google Scholar] [CrossRef]
- Tyagunov, S.; Pittore, M.; Wieland, M.; Parolai, S.; Bindi, D.; Fleming, K.; Zschau, J. Uncertainty and sensitivity analyses in seismic risk assessments on the example of Cologne, Germany. Nat. Hazards Earth Syst. Sci. Discuss. 2013, 1, 7285–7332. [Google Scholar] [CrossRef]
- Rapone, D.; Brando, G.; Spacone, E.; De Matteis, G. Seismic vulnerability assessment of historic centers: Description of a predictive method and application to the case study of scanno (Abruzzi, Italy). Int. J. Archit. Herit. 2018, 12, 1171–1195. [Google Scholar] [CrossRef]
- Giovinazzi, S.; Lagomarsino, S. Fuzzy-random approach for a seismic vulnerability model. In Proceedings of the International Conference on Structural Safety and Reliability (ICOSSAR), Rome, Italy, 19–23 June 2005; Available online: https://www.researchgate.net/profile/Sonia-Giovinazzi-2/publication/267853035_Fuzzy-Random_Approach_for_a_Seismic_Vulnerability_Model/links/54615e670cf27487b452742a/Fuzzy-Random-Approach-for-a-Seismic-Vulnerability-Model.pdf (accessed on 19 February 2022).
- Vargas-Alzate, Y.F.; Lantada, N.; González-Drigo, R.; Pujades, L.G. Seismic risk assessment using stochastic nonlinear models. Sustainability 2020, 12, 1308. [Google Scholar] [CrossRef]
- Boutaraa, Z.; Negulescu, C.; Arab, A.; Sedan, O. Buildings Vulnerability Assessment and Damage Seismic Scenarios at Urban Scale: Application to Chlef City (Algeria). KSCE J. Civ. Eng. 2018, 22, 3948–3960. [Google Scholar] [CrossRef]
- Mouroux, P.; Le Brun, B. Risk-Ue Project: An Advanced Approach to Earthquake Risk Scenarios with Application to Different European Towns. In Assessing and Managing Earthquake Risk; Springer: Berlin/Heidelberg, Germany, 2007; pp. 479–508. [Google Scholar] [CrossRef]
- Liu, Y.; Li, Z.; Wei, B.; Li, X.; Fu, B. Seismic vulnerability assessment at urban scale using data mining and GIScience technology: Application to Urumqi (China), Geomatics. Nat. Hazards Risk 2019, 10, 958–985. [Google Scholar] [CrossRef]
- Azizi-Bondarabadi, H.; Mendes, N.; Lourenço, P.B.; Sadeghi, N.H. Empirical seismic vulnerability analysis for masonry buildings based on school buildings survey in Iran. Bull. Earthq. Eng. 2016, 14, 3195–3229. [Google Scholar] [CrossRef]
- Chieffo, N.; Formisano, A. Induced seismic-site effects on the vulnerability assessment of a historical centre in the molise Region of Italy: Analysis method and real behaviour calibration based on 2002 earthquake. Geosciences 2020, 10, 21. [Google Scholar] [CrossRef]
- Otani, S. Seismic Vulnerability Assessment Methods for Buildings in Japan. Earthq. Eng. Eng. Seismol. 2000, 2, 47–56. [Google Scholar]
- Anwar, S.F.; Asthana, A.K. Developments in Simple Seismic Safety Evaluation Methods for Existing RC Buildings in Some Countries. Int. J. Eng. Technol. Sci. Res. (IJETSR) 2017, 4, 5. [Google Scholar]
- Shiga, T. Earthquake Damage and the Amount of Walls in Reinforced Concrete Buildings. In Proceedings of the World Conference Earthquake Engineering, New Delhi, India, 10–14 January 1977; pp. 2467–2472. [Google Scholar]
- Albuquerque, P. Seismic Vulnerability Assessment of Medium-Rise Buildings Using the Index Method: The Case of Block #22 of Santa Maria Hospital; Japan Meteorological Agency: Tokyo, Japan, 2008; p. 19. [Google Scholar]
- Moseley, V.J.; Dritsos, S.E.; Kolaksis, D.L. Pre-earthquake fuzzy logic and neural network based rapid visual screening of buildings. Struct. Eng. Mech. 2007, 27, 77–97. [Google Scholar] [CrossRef]
- Japan Building Disaster Prevention Association (JBDPA). Standard for Evaluation of Seismic Capacity of Existing Reinforced Concrete Buildings; Japan Building Disaster Prevention Association (JBDPA): Tokyo, Japan, 1997. [Google Scholar]
- Japan Building Disaster Prevention Association (JBDPA). Standard for Seismic Evaluation of Existing Reinforced Concrete Buildings. Guidelines for Seismic Retrofit of Existing Reinforced Concrete Buildings, and Technical Manual for Seismic Evaluation and Seismic Retrofit of Existing Reinforced Concrete Buildi; Japan Building Disaster Prevention Association (JBDPA): Tokyo, Japan, 2005. [Google Scholar]
- Japan Building Disaster Prevention Association (JBDPA). Standard for Evaluation of Seismic Capacity of Existing Reinforced Concrete Buildings; Japan Building Disaster Prevention Association (JBDPA): Tokyo, Japan, 2017. [Google Scholar]
- Japan Building Disaster Prevention Association (JBDPA). Standard for Seismic Evaluation of Existing Reinforced Concrete Buildings, Guidelines for Seismic Retrofit of Existing Reinforced Concrete Buildings and Technical Manual for Seismic Evaluation and Seismic Retrofit of Existing Reinforced Concrete Buildings; Japan Building Disaster Prevention Association (JBDPA): Tokyo, Japan, 2001. [Google Scholar]
- Japan Association for Building Disaster Prevention. Standard for Seismic Capacity Assessment of Existing Reinforced Concrete Buildings; Japan Building Disaster Prevention Association (JBDPA): Tokyo, Japan, 1977. [Google Scholar]
- Jung, J.S.; Lee, K.S. A methodology for evaluating seismic capacity and seismic risk assessment of reinforced concrete buildings in Korea. J. Asian Archit. Build. Eng. 2020, 19, 103–122. [Google Scholar] [CrossRef]
- Alwashali, H.; Sen, D.; Jin, K.; Maeda, M. Experimental investigation of influences of several parameters on seismic capacity of masonry infilled reinforced concrete frame. Eng. Struct. 2019, 189, 11–24. [Google Scholar] [CrossRef]
- Kassem, M.M.; Mohamed Nazri, F.; Noroozinejad Farsangi, E. The seismic vulnerability assessment methodologies: A state-of-the-art review. Ain Shams Eng. J. 2020, 11, 849–864. [Google Scholar] [CrossRef]
- Ningthoujam, M.C.; Nanda, R.P. Rapid visual screening procedure of existing building based on statistical analysis. Int. J. Disaster Risk Reduct. 2018, 28, 720–730. [Google Scholar] [CrossRef]
- Kapetana, P.; Dritsos, S. Seismic assessment of buildings by rapid visual screening procedures. Earthq. Resist. Eng. Struct. 2007, 93, 409–418. [Google Scholar] [CrossRef]
- New Zealand Society for Earthquake Engineering (NZSEE). An Initial Evaluation Process for Identifying Buildings Not Safe in Earthquake; New Zealand Society for Earthquake Engineering (NZSEE): Wellington, New Zealand, 2000. [Google Scholar]
- New Zealand Society for Earthquake Engineering (NZSEE). Assessment and Improvement of the Structural Performance of Buildings in Earthquakes; New Zealand Society for Earthquake Engineering (NZSEE): Wellington, New Zealand, 2003. [Google Scholar]
- New Zealand Society for Earthquake Engineering (NZSEE). Assessment and Improvement of the Structural Performance of Buildings in Earthquakes: Section 10 Revision Seismic Assessment of Unreinforced Masonry Buildings; New Zealand Society for Earthquake Engineering (NZSEE): Wellington, New Zealand, 2006. [Google Scholar]
- New Zealand Society for Earthquake Engineering (NZSEE). Assessment and Improvement of the Structural Performance of Buildings in Earthquakes: Prioritisation, Initial Evaluation, Detailed Assessment, Improvement Measures: Recommendations of a NZSEE Study Group on Earthquake Risk Buildings; New Zealand Society for Earthquake Engineering (NZSEE): Wellington, New Zealand, 2014. [Google Scholar]
- New Zealand Society for Earthquake Engineering (NZSEE). The Seismic Assessment of Existing Buildings: Technical Guidelines for Engineering Assessments—Initial Seismic Assessment—Part B; New Zealand Society for Earthquake Engineering (NZSEE): Wellington, New Zealand, 2017. [Google Scholar]
- Gentile, R.; Galasso, C. From rapid visual survey to multi-hazard risk prioritisation and numerical fragility of school buildings in Banda Aceh, Indonesia. Earthq. Hazards 2019. [Google Scholar] [CrossRef]
- Gentile, R.; Galasso, C.; Idris, Y.; Rusydy, I.; Meilianda, E. From rapid visual survey to multi-hazard risk prioritisation and numerical fragility of school buildings. Nat. Hazards Earth Syst. Sci. 2019, 19, 1365–1386. [Google Scholar] [CrossRef]
- Özsoy Özbay, A.E.; Sanrı Karapınar, I.; Ünen, H.C. Visualization of seismic vulnerability of buildings with the use of a mobile data transmission and an automated GIS-based tool. Structures 2020, 24, 50–58. [Google Scholar] [CrossRef]
- New Zealand Society for Earthquake Engineering (NZSEE). The Seismic Assessment of Existing Buildings: Technical Guidelines for Engineering Assessment: Part A: Assessment Objectives and Principles; New Zealand Society for Earthquake Engineering (NZSEE): Wellington, New Zealand, 2017. [Google Scholar]
- Demartinos, K.; Dritsos, S. First-level pre-earthquake assessment of buildings using fuzzy logic. Earthq. Spectra 2006, 22, 865–885. [Google Scholar] [CrossRef]
- Srikanth, T.; Kumar, R.P.; Singh, A.P.; Rastogi, B.K.; Kumar, S. Earthquake vulnerability assessment of existing buildings in Gandhidham and Adipur Cities Kachchh, Gujarat (India). Eur. J. Sci. Res. 2010, 41, 336–353. [Google Scholar]
- Υπουργειο Υποδομων & Μεταφορων (O.A.Σ.Π.). Δευτεροβαθμιος Προσεισμικος Ελεγχος Κτιριων Aπο Φερουσα Τοιχοποιια (Secondary Earthquake Examination Buildings from Bearing Masonry). 2018. [Google Scholar]
- Υπουργειο Υποδομων & Μεταφορων (O.A.Σ.Π.). Δευτεροβαθμιος Προσεισμικος Ελεγχος Κτιριων Aπο Oπλισμενο Σκυροδεμα (Secondary Earthquake Examination Reinforced Concrete Buildings). 2018. [Google Scholar]
- Cheung, M.; Foo, S.; Granadino, J. Seismic Retrofit of Existing Buildings: Innovative Alternatives; ICO-MOS International World Committee: Paris, France, 2001; pp. 1–10. [Google Scholar]
- Saatcioglu, M.; Shooshtari, M.; Foo, S. Seismic screening of buildings based on the 2010 National Building Code of Canada. Can. J. Civ. Eng. 2013, 40, 483–498. [Google Scholar] [CrossRef]
- Tischer, H.; Mitchell, D.; McClure, G. Comparison of seismic screening methods for schools in a moderate seismic zone. In Proceedings of the ECCOMAS Thematic Conference—COMPDYN 2011: 3rd International Conference on Computational Methods in Structural Dynamics and Earthquake Engineering: An IACM Special Interest Conference, Programme, Corfu, Greece, 25–28 May 2011; pp. 25–28. [Google Scholar]
- Sangiorgio, V.; Uva, G.; Aiello, M.A. A multi-criteria-based procedure for the robust definition of algorithms aimed at fast seismic risk assessment of existing RC buildings. Structures 2020, 24, 766–782. [Google Scholar] [CrossRef]
- Benedetti, D.; Petrini, V. On seismic vulnerability of masonry buildings: Proposal of an evaluation procedure. Ind. Constr. 1984, 18, 66–78. [Google Scholar]
- Benedetti, D.; Benzoni, G.; Parisi, M.A. Seismic vulnerability and risk evaluation for old urban nuclei. Earthq. Eng. Struct. Dyn. 1988, 16, 183–201. [Google Scholar] [CrossRef]
- Gruppo Nazionale per la Difesa dai Terremoti (GNDT). Rischio Sismico di Edifici Pubblici—Parte I: Aspetti Metodologici; CNR Gruppo Nazionale Difesa Terremoti: Rome, Italy, 1993. [Google Scholar]
- Gruppo Nazionale per la Difesa dai Terremoti (GNDT). Rischio Sismico di Edifici Pubblici—Parte II: Risultati per la Regione Emilia-Romagna; CNR Gruppo Nazionale Difesa Terremoti: Rome, Italy, 1993. [Google Scholar]
- Stefanini, S.; Rovero, L.; Tonietti, U.; Hassani, E.; Front, S.R. Seismic vulnerability assessment of Fes Medina in Morocco. Int. Arch. Photogramm. Remote Sens. Spat. Inf. Sci. 2020, XLIV, 9–12. [Google Scholar] [CrossRef]
- Athmani, A.E.; Gouasmia, A.; Ferreira, T.M.; Vicente, R.; Khemis, A. Seismic vulnerability assessment of historical masonry buildings located in Annaba city (Algeria) using non ad-hoc data survey. Bull. Earthq. Eng. 2015, 13, 2283–2307. [Google Scholar] [CrossRef]
- Bondarabadi, H.A. Analytical and Empirical Seismic Fragility Analysis of Irregular URM Buildings with Box Behavior; Universidade do Minho: Braga, Portugal, 2018. [Google Scholar]
- CETE Méditerranée, Comparaison de Méthodes Qualitatives D’évaluation de la Vulnérabilité des Constructions aux Séismes: Plan Séisme—Action 2.4.7: Guide des Méthodes de Diagnostics de la Résistance des Bâtiments aux Séismes (Comparison of Qualitative Methods for Assessing the Vulnerability of Earthquake Constructions: Earthquake Plan—Action 2.4.7. Guide to Diagnostic Methods for the Resistance of Buildings to Earthquakes), Convention MEDD/CETE NCV05000107: Étude Réalisée Dans Le Cadre Des Projets de Service Public Du BRGM. 2008. Available online: https://side.developpement-durable.gouv.fr/Default/doc/SYRACUSE/202122/comparaison-de-methodes-qualitatives-d-evaluation-de-la-vulnerabilite-des-constructions-aux-seismes- (accessed on 15 February 2022).
- Cara, S.; Aprile, A.; Pelà, L.; Roca, P. Seismic Risk Assessment and Mitigation at Emergency Limit Condition of Historical Buildings along Strategic Urban Roadways. Application to the “Antiga Esquerra de L’Eixample” Neighborhood of Barcelona. Int. J. Archit. Herit. 2018, 12, 1055–1075. [Google Scholar] [CrossRef]
- Cara, S. Seismic Risk Assessment at Emergency Limit Condition of Urban Neighbourhoods: Application to the Eixample District of Barcelona. Master’s Thesis, Universitat Politècnica de Catalunya, Barcelona, Spain, 2016. Available online: https://upcommons.upc.edu/handle/2117/100310 (accessed on 19 February 2022).
- Guagenti, E.; Petrini, V. Il caso delle vecchie costruzioni: Verso una nuova legge danni-intensità. In Proceedings of the 4th Italian National Conference on Earthquake Engineering.
- Gruppo Nazionale per la Difesa dai Terremoti (GNDT). Manuale Per II Rilevamento Della Vulnerabilità Sismica Degli Edifici (Manual for the Detection of the Seismic Vulnerability of Buildings); Gruppo Nazionale per la Difesa dai Terremoti: Rome, Italy, 1993. [Google Scholar]
- Athmani, A. A Simplified Mechanical Approach for a Large-Scale Seismic Vulnerability Assessment of the Algerian Masonry Buildings. Int. J. Archit. Herit. 2020. [Google Scholar] [CrossRef]
- Tripura Disaster Management Authoritity. Report on Rapid Visual Screening of Twenty Schools in Tripura. Available online: https://tdma.tripura.gov.in/school-safety (accessed on 19 February 2022).
- Rai, D.C. IITK-GSDMA Guidelines for Seismic Evaluation and Strengthening of Existing Buildings; Indian Institute of Technology Kanpur: Kanpur, India, 2005. [Google Scholar]
- Jain, S.K.; Mitra, K.; Kumar, M.; Shah, M. A proposed rapid visual screening procedure for seismic evaluation of RC-frame buildings in India. Earthq. Spectra 2010, 26, 709–729. [Google Scholar] [CrossRef]
- Bureau of Indian Standards (BIS). IS 13935: Indian Standard Guidelines for Repair and Seismic Strengthening of Buildings; Bureau of Indian Standards (BIS): New Delhi, India, 2004. [Google Scholar]
- Bureau of Indian Standards (BIS). IS 13935: Indian Standard Guidelines for Repair and Seismic Strengthening of Buildings; Bureau of Indian Standards (BIS): New Delhi, India, 2009. [Google Scholar]
- Rajarathnam, S.; Santhakumar, A.R. Assessment of seismic building vulnerability based on rapid visual screening technique aided by aerial photographs on a GIS platform. Nat. Hazards 2015, 78, 779–802. [Google Scholar] [CrossRef]
- Sarmah, T.; Das, S. Earthquake Vulnerability Assessment for RCC Buildings of Guwahati City using Rapid Visual Screening. Procedia Eng. 2018, 212, 214–221. [Google Scholar] [CrossRef]
- Pandit, A.V.; Patil, V.S. General Methodology for Seismic Evaluation of Buildings. Int. Res. J. Eng. Technol. 2018, 7, 286–290. [Google Scholar]
- Bhalkikar, A.; Ramancharla, P. Defining vulnerability score modifiers for parameters that affect rapid visual survey score: A numerical study. In Proceedings of the 16th World Conference of Earthquake Engineering, Santiago, Chile, 9–13 January 2017; p. 9. [Google Scholar]
- Harirchian, E.; Jadhav, K.; Mohammad, K.; Aghakouchaki Hosseini, S.E.; Lahmer, T. A Comparative Study of MCDM Methods Integrated with Rapid Visual Seismic Vulnerability Assessment of Existing RC Structures. Appl. Sci. 2020, 10, 6411. [Google Scholar] [CrossRef]
- Kumar, S.A.; Rajaram, C.; Mishra, S.; Kumar, R.P.; Karnath, A. Rapid visual screening of different housing typologies in Himachal, Pradesh, India. Nat. Hazards 2017, 85, 1851–1875. [Google Scholar] [CrossRef]
- National Disaster Management Authority of Home Affairs Government of India. A Primer on Rapid Visual Screening (RVS) Consolidating Earthquake Safety Assessment Efforts in India; Government of India: New Delhi, India, 2020. [Google Scholar]
- Ansal, A.; Özaydın, K.; Edinçliler, A.; Erdik, M.; Akarun, L.; Kabasakal, H.; Aydınoğlu, N.; Polat, Z.; Şengezer, B.; Sağlam, F.; et al. Earthquake Master Plan for Istanbul, Metropolital Municipality of Istanbul, Planning and Construction Directorate; Geotechnical and Earthquake Investigation Department: Istanbul, Turkey, 2003. [Google Scholar]
- Murty, C.V.R.; Rai, D.C.; Kumar, H.; Mitra, K.; Bose, A.K.; Kaushik, H.B.; Jaiswal, A.; Kumar, R.P. A methodology for documenting housing typologies in the moderate-severe seismic zones. In Proceedings of the 15th World Conference on Earthquake Engineering, Lisbon, Portugal, 24–28 September 2012. [Google Scholar]
- Bhalkikar, A.; Pradeep Kumar, R. A comparative study of different rapid visual survey methods used for seismic assessment of existing buildings. Structures 2021, 29, 1847–1860. [Google Scholar] [CrossRef]
- Ministry for Environment and Urban Planning. Principles for Identifying Risky Buildings; Ministry for Environment and Urban Planning: Ankara, Turkey, 2019. [Google Scholar]
- Balamir, M. Urban seismic risk management: The earthquake master plan of Istanbul (EMPI). In Proceedings of the 13th World Conference on Earthquake Engineering, Vancouver, BC, Canada, 1–6 August 2004; p. 22. [Google Scholar]
- Sen, Z. Rapid visual earthquake hazard evaluation of existing buildings by fuzzy logic modeling. Expert Syst. Appl. 2010, 37, 5653–5660. [Google Scholar] [CrossRef]
- Ozdemir, P.; Taskin, B. Seismic safety screening method for Istanbul metropolitan city, Wind and Earthquake Engineering. In Proceedings of the 10th East Asia-Pacific Conference on Structural Engineering and Construction, EASEC 2010, Bangkok, Thailand, 3–5 August 2006; Volume 3, pp. 255–260. [Google Scholar]
- Sucuoǧlu, H.; Yazgan, U.; Yakut, A. A screening procedure for seismic risk assessment in urban building stocks. Earthq. Spectra 2007, 23, 441–458. [Google Scholar] [CrossRef]
- Ministry of Public Works and Settlement. TEC-2018: Turkish Earthquake Code 2018, 2018.
- Tyagunov, S.; Grünthal, G.; Wahlström, R.; Stempniewski, L.; Zschau, J. Seismic risk mapping for Germany. Nat. Hazards Earth Syst. Sci. 2006, 6, 573–586. [Google Scholar] [CrossRef]
- Schwarz, J.; Raschke, M.; Maiwald, H. Seismic Risk Studies for Central Germany on the Basis of the European Macroseismic Scale. In Proceedings of the 12th European Conference on Earthquake Engineering, London, UK, 9–13 September 2002. [Google Scholar]
- Chang, K.-T. Geographic Information System. In International Encyclopedia of Geography; John Wiley & Sons, Ltd.: Hoboken, NJ, USA, 2017; pp. 1–9. [Google Scholar] [CrossRef]
- Lee, K.; Nakano, Y.; Yi, W.; Choi, H. Seismic Capacity and Vulnerability of Existing RC Public Buildings in Korea; Bulletin of Earthquake Resistant Structure Research Center: Tokyo, Japan, 2001; pp. 15–20. [Google Scholar]
- Lee, K.S.; Jung, J.-S.; Choi, Y.-C. Seismic Risk Assessment of Existing Low-rise Reinforced Concrete Buildings in Korea. Archit. Res. 2018, 20, 17–25. [Google Scholar]
- Inoue, A.; Islam, M.R.; Nakajima, Y. Suggested Modification of Japanese Seismic Evaluation and Retrofit for RC Buildings for Its Application in Bangladesh. 2017, pp. 1–12. Available online: https://www.google.com.hk/url?sa=t&rct=j&q=&esrc=s&source=web&cd=&ved=2ahUKEwiar5WVx5X2AhUySmwGHWQXCBkQFnoECAkQAQ&url=https%3A%2F%2Fwww.wcee.nicee.org%2Fwcee%2Farticle%2F16WCEE%2FWCEE2017-551.pdf&usg=AOvVaw1MSxugsh1xcSm8ykzzynjp (accessed on 15 February 2022).
- Eddine Cherif, S.; Chourak, M.; Abed, M.; Pujades, L. Seismic risk in the city of Al Hoceima (north of Morocco) using the vulnerability index method, applied in Risk-UE project. Nat. Hazards 2017, 85, 329–347. [Google Scholar] [CrossRef]
- Cherif, S.; Chourak, M.; Abed, M.; Douiri, A. Potential seismic damage assessment of residential buildings in Imzouren City (Northern Morocco). Buildings 2018, 8, 179. [Google Scholar] [CrossRef]
- Cherif, S.; Chourak, M.; Abed, M. Assessment of the Seismic Vulnerability of the City of Al Hoceima (North of Morocco) by the Risk-EU Method. In Proceedings of the 13th Arab Structural Engineering Conference, Blida, Algeria, 13–15 December 2015; pp. 1–6. [Google Scholar]
- Vallejo, C.B. Rapid Visual Screening of Buildings in the City of Manila, Philippines. In Proceedings of the 5th Civil Engineering Conference in the Asian Region and Australasian Structural Engineering Conference, Sydney, Australia, 8–12 August 2010; p. 513. [Google Scholar]
- Clemente, S.J.C.; Arreza, J.S.B.; Cortez, M.A.M.; Imperial, J.R.C.; Malabanan, M.J.F. Risk Assessment of Seismic Vulnerability of All Hospitals in Manila Using Rapid Visual Screening (RVS). IOP Conf. Ser. Earth Environ. Sci. 2020, 479, 012002. [Google Scholar] [CrossRef]
- Ferreira, T.M.; Vicente, R.; Mendes da Silva, J.A.R.; Varum, H.; Costa, A. Seismic vulnerability assessment of historical urban centres: Case study of the old city centre in Seixal, Portugal. Bull. Earthq. Eng. 2013, 11, 1753–1773. [Google Scholar] [CrossRef]
- Lantada, N.; Irizarry, J.; Barbat, A.H.; Goula, X.; Roca, A.; Susagna, T.; Pujades, L.G. Seismic hazard and risk scenarios for Barcelona, Spain, using the Risk-UE vulnerability index method. Bull. Earthq. Eng. 2010, 8, 201–229. [Google Scholar] [CrossRef]
- Swiss Society of Civil Engineers and Architects (SIA). Assessment of Existing Buildings with Respect to Earthquakes; Technical Note 2018; Swiss Society of Civil Engineers and Architects (SIA): Zurich, Switzerland, 2004. (In German) [Google Scholar]
- Achs, G.; Adam, C. A Rapid-Visual-Screening Methodology for the Seismic Vulnerability Assessment of Historic Brick-Masonry Buildings in Vienna. In Proceedings of the 15th World Conference on Earthquake Engineering (15WCEE), Lisbon, Portugal, 24–28 September 2012; Volume 154. [Google Scholar]
- Murashko, O.; Adamov, O. A new approach to the dynamic certification in Ukraine. In Proceedings of the 5th International Conference of Young Scientists GEODESY, Architecture & Construction, Lisbon, Portugal, 24–28 September 2012; pp. 112–113. [Google Scholar]
- Dorofeev, V.; Yegupov, K.; Murashko, O.; Bezushko, D. Numerical modeling of multistory confined masonry structures in seismic regions of Ukraine. In Proceedings of the 8th International Conference on Material Technologies and Modeling, Ariel, Isral, July 28–1 August 2014. [Google Scholar]
- Dorofeev, V.; Yegupov, K.; Murashko, O.; Adamov, O. A new approach to buildings seismic resistance assessment in Ukraine. In Proceedings of the Second European Conference on Earthquake Engineering and Seismology, Istanbul, Turkey, 25–29 August 2014; pp. 138–143. [Google Scholar]
- Didier, M.; Baumberger, S.; Tobler, R.; Esposito, S.; Ghosh, S.; Stojadinovic, B. Improving post-earthquake building safety evaluation using the 2015 Gorkha, Nepal, Earthquake rapid visual damage assessment data. Earthq. Spectra 2017, 33, S415–S434. [Google Scholar] [CrossRef]
- National Society for Earthquake Technology-Nepal (NSET). Department of Urban Development & Building Construction (DUDBC), Seismic Vulnerability Evaluation Guideline for Private and Public Buildings, Part I: Pre Disaster Vulnerability Assessment; National Society for Earthquake Technology-Nepal (NSET): Lalitpur, Nepal, 2009. [Google Scholar]
- Applied Technology Council (ATC). ATC-20: Procedures for Postearthquake Safety Evaluation of Buildings; Applied Technology Council (ATC): Redwood, CA, USA, 1989; p. 144. [Google Scholar]
- Applied Technology Council (ATC). ATC 20-2: Addendum to the ATC-20 Postearthquake Building Safety Evaluation Procedures; Applied Technology Council (ATC): Redwood, CA, USA, 1995. [Google Scholar]
- Rupakheti, D.; Apichayakul, P. Development of rapid visual screening form for Nepal based on the data collected from—Its 2015 earthquake. IOP Conf. Ser. Earth Environ. Sci. 2019, 365, 012027. [Google Scholar] [CrossRef]
- Nie, N.H.; Bent, D.H.; Hull, C.H. SPSS: Statistical Package for the Social Sciences; McGraw-Hill: New York, NY, USA, 1975. [Google Scholar]
- Wahyuni, E.; Aji, P.; Budi, F. Study of Rapid Visual Screening of Buildings for High Potential Seismic Hazard According to Indonesian Standard. IPTEK J. Proc. Ser. 2017, 3, 19–22. [Google Scholar] [CrossRef]
- Pujianto, A.; Prayuda, H.; Rosyidi, S.A.P.; Monika, F.; Faizah, R. Rapid Visual Screening (RVS) for School Buildings after Earthquake in Lombok, West Nusa Tenggara, Indonesia. Proc. First Int. Conf. Constr. Infrastruct. Mater. 2019, 650. [Google Scholar] [CrossRef]
- Boen, T. Kajian Cara Cepat Keamanan Bangunan Tembokan Sederhana Satu atau Dua Lantai yang Rusak akibat Gempa dan Kajian Risiko Komponen Non-Struktural. World Seism. Saf. Initiat. (Indones.) 2007, 34. [Google Scholar]
- Ruggieri, S.; Perrone, D.; Leone, M.; Uva, G.; Aiello, M.A. A prioritization RVS methodology for the seismic risk assessment of RC school buildings. Int. J. Disaster Risk Reduct. 2020, 51, 101807. [Google Scholar] [CrossRef]
- WHO; PAHO. Hospital Safety Index, Guide for Evaluators; Pan American Health Organization, World Health Organization: Washington, DC, USA, 2018; p. 174. [Google Scholar]
- Perrone, D.; Aiello, M.A.; Pecce, M.; Rossi, F. Rapid visual screening for seismic evaluation of RC hospital buildings. Structures 2015, 3, 57–70. [Google Scholar] [CrossRef]
- Lang, D.H.; Verbicaro, M.I.; Singh, Y. Seismic Vulnerability Assessment of Hospitals and Schools. 2009. Available online: https://www.researchgate.net/profile/Dominik-Lang-3/publication/238792309_SEISMIC_VULNERABILITY_ASSESSMENT_OF_HOSPITALS_AND_SCHOOLS_BASED_ON_QUESTIONNAIRE_SURVEY/links/598d60d2458515c333ac1322/SEISMIC-VULNERABILITY-ASSESSMENT-OF-HOSPITALS-AND-SCHOOLS-BASED-ON-QUESTIONNAIRE-SURVEY.pdf (accessed on 15 February 2022).
- SAARC Disaster Management Centre. Rapid Structural and Non-structural Assessment of School and Hospital Buildings in SAARC Countries; SAARC Disaster Management Centre: New Delhi, India, 2011; pp. 1–56. [Google Scholar]
- National Institute of Building Sciences (NIBS). Integrated Rapid Visual Screening of Schools: A How-to Guide to Mitigate Multihazard Effects Against School Facilities; National Institute of Building Sciences (NIBS): Washington, DC, USA, 2011. [Google Scholar]
- Lucksiri, K.; Miller, T.H.; Gupta, R.; Pei, S.; Van De Lindt, J.W. A procedure for rapid visual screening for seismic safety of wood-frame dwellings with plan irregularity. Eng. Struct. 2012, 36, 351–359. [Google Scholar] [CrossRef][Green Version]
- Lucksiri, K.; Miller, T.H.; Gupta, R.; Pei, S.; Van De Lindt, J.W. Implementation of plan irregularity rapid visual screening tool for wood-frame, single-family dwellings. J. Earthq. Eng. 2013, 17, 497–516. [Google Scholar] [CrossRef]
- Achs, G.; Adam, C. Risk assessment of historic residential brick-masonry buildings in Vienna by rapid-visual-screening. In Proceedings of the ECCOMAS Thematic Conference—COMPDYN 2011: 3rd International Conference on Computational Methods in Structural Dynamics and Earthquake Engineering: An IACM Special Interest Conference, Programme, Corfu, Greece, 25–28 May 2011. [Google Scholar]
- Bektaş, N.; Kegyes-Brassai, O. An overview of S-RVS methods considering to enhance traditional RVS methods presented in a case study of existing buildings. In Proceedings of the 12th IEEE International Conference on Cognitive Infocommunications (CogInfoCom), Online, 23–25 September 2021; pp. 821–826. [Google Scholar]
- Teddy, L.; Hardiman, G.; Nuroji, N. The Application of Rapid Visual Analysis (RVS) in Architectural Process as Support Disaster Resilient in Indonesia. 2016. Available online: http://repository.unsri.ac.id/id/eprint/60462 (accessed on 15 February 2022).
- Barbat, A.H.; Carreño, M.L.; Pujades, L.G.; Lantada, N.; Cardona, O.D.; Marulanda, M.C. Seismic vulnerability and risk evaluation methods for urban areas. A review with application to a pilot area. Struct. Infrastruct. Eng. 2010, 6, 17–38. [Google Scholar] [CrossRef]
- Wang, Y. Enhanced Rapid Visual Screening (E-RVS) Method for Prioritization of Seismic Retrofits in Oregon; Oregon Department of Geology and Mineral Industries: Portland, OR, USA, 2007. [Google Scholar]
- Chen, Y. Evaluation of Simplified Seismic Vulnerability Assessment Procedures for Reinforced Concrete Buildings. 2015. Available online: https://ir.canterbury.ac.nz/handle/10092/11466 (accessed on 15 February 2022).
- Ansary, M.A.; Reja, M.Y.; Jahan, I. Rethinking the public building as post disaster shelters—In the context of old Dhaka. In Proceedings of the 9th US National and 10th Canadian Conference on Earthquake Engineering, Toronto, ON, Canada, 25–29 July 2010; p. 10. [Google Scholar]
- Aldemir, A.; Guvenir, E.; Sahmaran, M. Rapid screening method for the determination of regional risk distribution of masonry structures. Struct. Saf. 2020, 85, 101959. [Google Scholar] [CrossRef]
- Aung, M.M.M.; Aye, M.N. Seismic Safety Assessment of Existing Low-rise RC Buildings with Rapid Visual Screenings and Preliminary Evaluation Methods. AJSTD 2021, 1, 29–36. [Google Scholar] [CrossRef]
- Harith, N.S.H.; Jainih, V.; Ladin, M.A.; Adiyanto, M.I. Assessing the Vulnerability of Kota Kinabalu Buildings. Civil Engineering Architecture 2021, 9, 68–77. [Google Scholar] [CrossRef]
- Tischer, H. Rapid Seismic Vulnerability Assessment of School Buildings in Québec. Ph.D. Thesis, McGill University, Montréal, QC, Canada, 2012. [Google Scholar]


|
|
|
|
|
|
|
|
|
|
|
|
|
|
|
| Wall | Roof | |
|---|---|---|
|
|
|
|
|
|
|
|
|
|
|
|
| ||
|
|
|
|
|
|
|
|
|
|
| Region of Seismicity | Level of Performance | Required Checklists | |||||
|---|---|---|---|---|---|---|---|
| Region of Low Seismicity | Basic Structural | Supplemental Structural | Geologic Site Hazard and Foundation | Basic Nonstructural | Supplemental Nonstructural | ||
| Low | LS | ✓ | |||||
| IO | ✓ | ✓ | ✓ | ||||
| Moderate | LS | ✓ | ✓ | ✓ | |||
| IO | ✓ | ✓ | ✓ | ✓ | ✓ | ||
| High | LS | ✓ | ✓ | ✓ | ✓ | ||
| IO | ✓ | ✓ | ✓ | ✓ | ✓ | ||
| Lateral-Force-Resisting System | |||
|---|---|---|---|
|
|
| |
|
|
| |
|
|
| |
|
|
| |
|
|
| |
| Diaphragms | |||
|
|
|
|
| Connections | |||
|
|
| |
|
| ||
| Geologic Site Hazards and Foundation Checklist | |||
|
| ||
| Nonstructural Checklist | |||
|
|
| |
|
|
| |
|
|
| |
|
|
| |
|
|
| |
| |||
| Masonry Structures |
|
|
|
| |
|
| |
|
| |
| RC Structures |
|
|
| Building Classes | |||
|---|---|---|---|
| Rubble stone, field stone | Simple stone | Massive stone | |
| Adobe | Wooden slabs (URM) | Masonry vaults (URM) | |
| Composite slabs (URM) | RC slabs (URM) | Reinforced or confined masonry | |
| Overall strengthened masonry | RC moment frames | RC shear walls | |
| Regularly infilled RC frames | Irregular RC frames | RC dual systems | |
| Precast concrete tilt-up walls | Steel frames with URM infill walls | Steel moment frames | |
| Steel braced frames | Wooden structures | Steel and RC composite systems | |
| Precast concrete frames with concrete shear walls | Steel frames with cast-in-place concrete shear walls | ||
| Damage Grade | Damage Grade Label | ||||
|---|---|---|---|---|---|
| LM1 | LM2 | FEMA/NIBS (HAZUS) | |||
| 0 | - | D0 | None | None | None |
| 1 | - | D1 | Slight | Minor | Slight |
| 2 | - | D2 | Moderate | Moderate | Moderate |
| 3 | - | D3 | Substantial to heavy | Severe | Extensive |
| 4 | - | D4 | Very heavy | Complete | Complete |
| 5 | - | D5 | Destruction | ||
| Risk Level | |
|---|---|
| >100 | Low |
| 80–100 | Low |
| 67–79 | Low to Medium |
| 34–66 | Medium |
| 20–<34 | High |
| <20 | Very High |
| Parameters | |||
|---|---|---|---|
| M | RC | ||
| P1 | Type and organization of the resisting system | [0, 45] | [0, −2] |
| P2 | Quality of the resisting system | [0, 45] | [0, −0.50] |
| P3 | Conventional strength | [0, 45] | [0.25, −0.25] |
| P4 | Building position and foundations | [0, 45] | [0, −0.5] |
| P5 | Horizontal diaphragms | [0, 45] | [0, −0.50] |
| P6 | Plan configuration | [0, 45] | [0, −0.50] |
| P7 | Configuration in elevation | [0, 45] | [0, −1.50] |
| P8 | Maximum distance between walls | [0, 45] | [0, −0.50] |
| P9 | Roof | [0, 45] | [0, −0.50] |
| P10 | Nonstructural elements | [0, 45] | [0, −0.50] |
| P11 | Current condition | [0, 45] | [0, −2.45] |
| Weight | |||
|---|---|---|---|
| Parameter | GNDT | M.GNDT | |
| P1 | Typology of resisting system | - | 2.50 |
| P2 | Organization of the resisting system | 1.00 | 1.00 |
| P3 | Conventional strength | 1.50 | 1.50 |
| P4 | Maximum distance between walls | 0.25 | 0.25 |
| P5 | Horizontal diaphragms | 1.00 | 1.00 |
| P6 | Number of floors | - | 0.75 |
| P7 | Location and soil conditions | 0.75 | 0.75 |
| P8 | Aggregate position and interaction | - | 0.75 |
| P9 | Plan regularity | 0.50 | 0.50 |
| P10 | Vertical regularity | 0.50 | 0.50 |
| P11 | Roof system | 0.25 | 0.25 |
| P12 | Interventions | - | 0.50 |
| P13 | General state of preservation | 1.00 | 1.00 |
| P14 | Nonstructural elements | 0.25 | 0.25 |
| Seismic Intensity Zone | |
|---|---|
| Zone I | 60 < PGV < 80 |
| Zone II | 40 < PGV < 60 |
| Zone III | 20 < PGV < 40 |
| Parameter | Value |
|---|---|
| Soft story | No; Yes |
| Heavy overhangs | No; Yes |
| Apparent quality | Good; Moderate; Poor |
| Short columns | No; Yes |
| Pounding effect | No; Yes |
| Topographic effect | No; Yes |
| Initial Scores | Vulnerability Scores | ||||
|---|---|---|---|---|---|
| Zone I | [70, 90] | Short Column | −5 | Apparent Quality | [−15, −10] |
| Zone II | [80, 125] | Soft Story | [−15, 20] | Heavy Overhang | [−15, −10] |
| Zone III | [−15, 20] | Pounding Effect | [0, −3] | Topographic Effects | [0, −2] |
| Seismic Vulnerability | Decision | |
|---|---|---|
| Low | No further detailed assessment required! | |
| Moderate | Further detailed assessment required! | |
| High | Demolish and reconstruct! | |
| USA | European Union | Japan | New Zealand | Greece | Canada | Italy | India | Turkey | ||||||
|---|---|---|---|---|---|---|---|---|---|---|---|---|---|---|
| FEMA P-154 [8] | FEMA 310 [68] | EMS-98 Scale [11] | RISK-UE Project [12] | JBDPA [109,110,111,112,113] | NZSEE [123] | OASP [13] | NRCC [14] | GNDT [138] | IITK-GSDMA [150] | EMPI [161] | RBTE-2019 [164] | |||
| Vulnerability Parameters | Building Irregularities | Vertical Irregularity | ✓ | ✓ | ✓ | ✓ | ✓ | ✓ | ✓ | ✓ | ✓ | ✓ | ✓ | ✓ |
| Plan Irregularity | ✓ | ✓ | ✓ | ✓ | ✓ | ✓ | ✓ | ✓ | ✓ | ✓ | ✓ | ✓ | ||
| Pounding Effect | ✓ | ✓ | ✓ | × | × | ✓ | ✓ | ✓ | × | ✓ | ✓ | ✓ | ||
| Basic Building Information | Structure Type | ✓ | ✓ | ✓ | ✓ | ✓ | ✓ | ✓ | ✓ | ✓ | ✓ | ✓ | ✓ | |
| Foundation Type | × | ✓ | × | ✓ | ✓ | ✓ | × | ✓ | × | ✓ | × | × | ||
| No. of Story | ✓ | ✓ | ✓ | ✓ | ✓ | ✓ | ✓ | ✓ | ✓ | ✓ | ✓ | ✓ | ||
| Construction Year | ✓ | ✓ | × | ✓ | ✓ | ✓ | ✓ | ✓ | ✓ | ✓ | ✓ | ✓ | ||
| Occupancy | ✓ | ✓ | ✓ | ✓ | ✓ | × | ✓ | ✓ | ✓ | ✓ | × | ✓ | ||
| Building Technical Information | Prior Strengthening | × | × | ✓ | ✓ | × | ✓ | ✓ | × | ✓ | × | × | × | |
| Prior Damage | × | ✓ | ✓ | × | ✓ | × | ✓ | × | ✓ | × | × | × | ||
| Maintenance | × | ✓ | ✓ | ✓ | × | × | ✓ | × | ✓ | ✓ | ✓ | ✓ | ||
| Pre-Code | ✓ | × | ✓ | ✓ | × | ✓ | ✓ | ✓ | × | ✓ | × | × | ||
| Post-Benchmark | ✓ | ✓ | ✓ | ✓ | × | × | × | ✓ | × | × | × | × | ||
| Falling Hazards | ✓ | × | × | × | × | × | × | ✓ | ✓ | ✓ | ✓ | × | ||
| Site Seismicity and Soil Characteristics | Site Seismicity | ✓ | ✓ | ✓ | ✓ | × | ✓ | ✓ | ✓ | × | ✓ | × | × | |
| Soil Type | ✓ | ✓ | ✓ | ✓ | × | ✓ | ✓ | ✓ | ✓ | ✓ | × | ✓ | ||
| Liquefaction | ✓ | ✓ | × | × | × | ✓ | × | ✓ | × | ✓ | × | × | ||
Publisher’s Note: MDPI stays neutral with regard to jurisdictional claims in published maps and institutional affiliations. |
© 2022 by the authors. Licensee MDPI, Basel, Switzerland. This article is an open access article distributed under the terms and conditions of the Creative Commons Attribution (CC BY) license (https://creativecommons.org/licenses/by/4.0/).
Share and Cite
Bektaş, N.; Kegyes-Brassai, O. Conventional RVS Methods for Seismic Risk Assessment for Estimating the Current Situation of Existing Buildings: A State-of-the-Art Review. Sustainability 2022, 14, 2583. https://doi.org/10.3390/su14052583
Bektaş N, Kegyes-Brassai O. Conventional RVS Methods for Seismic Risk Assessment for Estimating the Current Situation of Existing Buildings: A State-of-the-Art Review. Sustainability. 2022; 14(5):2583. https://doi.org/10.3390/su14052583
Chicago/Turabian StyleBektaş, Nurullah, and Orsolya Kegyes-Brassai. 2022. "Conventional RVS Methods for Seismic Risk Assessment for Estimating the Current Situation of Existing Buildings: A State-of-the-Art Review" Sustainability 14, no. 5: 2583. https://doi.org/10.3390/su14052583
APA StyleBektaş, N., & Kegyes-Brassai, O. (2022). Conventional RVS Methods for Seismic Risk Assessment for Estimating the Current Situation of Existing Buildings: A State-of-the-Art Review. Sustainability, 14(5), 2583. https://doi.org/10.3390/su14052583