Abstract
Continuous monitoring of surface water resources is often challenging due to the lack of monitoring systems in remote areas and the high spatial distribution of water bodies. The Google Earth Engine (GEE) platform, which houses a large set of remote sensing datasets and geospatial processing power, has been applied in various aspects of surface water resources monitoring to solve some of the challenges. PyGEE-SWToolbox is a freely available Google Earth Engine-enabled open-source toolbox developed with Python to be run in Jupyter Notebooks that provides an easy-to-use graphical user interface (GUI) that enables the user to obtain time series of Landsat, Sentinel-1, and Sentinel-2 satellite imagery, pre-process them, and extract surface water using water indices, such as the Normalized Difference Water Index (NDWI), Modified NDWI (MNDWI), Automated Water Extraction Index (AWEI), and Dynamic Surface Water Extent (DSWE). The validation of the toolbox is carried out at four reservoir and lake locations: Elephant Butte Lake, Hubbard Creek Reservoir, Clearwater Lake, and Neversink Reservoir in the United States. A time series of the water surface area generated from PyGEE-SWToolbox compared to the observed surface areas yielded good results, with ranging between 0.63 and 0.99 for Elephant Butte Lake, Hubbard Creek Reservoir, and Clearwater Lake except the Neversink Reservoir with a maximum of 0.52. The purpose of PyGEE-SWToolbox is to provide water resource managers, engineers, researchers, and students a user-friendly environment to utilize the GEE platform for water resource monitoring and generation of datasets. The toolbox is accompanied by a step-by-step user manual and Readme documentation for installation and usage.
1. Introduction
Information on the spatial and temporal dynamics is vital to the management and protection of water resources. Given the vast spatial distribution of surface water resources, conventional methods of monitoring have become difficult and expensive, particularly in remote areas. Remote sensing technologies have increasingly become an appealing alternative [1]. Remote sensing methods have been applied in monitoring of various water resources, such as flood monitoring [2], satellite-derived bathymetry [3], wetland inundation dynamics [4], shoreline extraction [5] and gap-filling of time series data [6].
Climate change is expected to have adverse impacts on water resources, which could have enormous environmental and economic implications [7]. Climate change results in alterations in hydrological regimes, such as changes in precipitation and temperature patterns, resulting in changes in water quantity and quality [8,9]. To assess the impacts of climate change on water resources, historical baseline data on the dynamics of these resources are required to quantify the extent of change. Generating historical data on a large spatial and temporal scale requires the application of remote sensing methods to augment the limited or no-data regions. Analyzing large sets of remote sensing data for a very long period requires expensive computing resources and extensive man-hours. The Google Earth Engine (GEE) [10] platform provides the usability of satellite imagery for large-scale applications. The GEE platform offers easy access to, manipulation of, and analysis of a large volume of geospatial data [4].
GEE’s conventional use requires users to be capable of writing JavaScript codes using the GEE online Code Editor or Python codes using the GEE Python API to perform geospatial analysis [10,11]. For some researchers and water resource managers with limited programming experience or who are unfamiliar with the programming languages required to communicate with the GEE platform, this may be problematic.
The significance of this study is to introduce a new open-source toolbox developed by the authors with a graphical user interface (GUI) called PyGEE-SWToolbox to support users with little to no knowledge of the use of the GEE platform and its coding requirements as a solution to some of the challenges faced by non-programmers in utilizing the GEE platform. The toolbox combines existing GEE python packages, our developed codes, and some existing implementations under a comprehensive framework for retrieving, processing, and analyzing geospatial datasets for surface water analysis. The toolbox is intended for researchers, water resource managers, planners, and students who would like to utilize the geospatial datasets and cloud computing power of the GEE platform to monitor changes in surface water resources. Practical applications of the PyGEE-SWToolbox to some selected reservoirs and lakes in the USA are illustrated.
2. Methods
2.1. Toolbox Development and Capabilities
The toolbox was developed with Python version 3.8 (compatible with higher versions) in Jupyter Notebook [12]. The toolbox uses the GEE Python API to communicate with the GEE platform for data retrieval, processing, and computations. A GEE account is required to authenticate the GEE python API. The toolbox relies heavily on geemap [13], a Python package for interactive mapping with GEE, ipyleaflet, and ipywidgets. It combines other freely available Python packages, such as geetools, eemont [14], hydrafloods, Numpy, and pandas. Plotly Python package is used for interactive time series plotting. The capabilities or functionalities of the PyGEE-SWToolbox can be summarized as follows:
- retrieve and process satellite imagery from the GEE platform;
- extract surface water from satellite imagery;
- perform water occurrence frequency analysis;
- visualize satellite imagery, water extent maps, and computed water occurrence maps;
- generate a time series of surface water dynamics and export time series to CSV format;
- estimate water depth using surface water extent and digital elevation models (DEMs);
- export satellite imagery and computed maps to a Google Drive or download them to the user’s local computer.
The toolbox runs in a conda environment where the required python packages have been installed. The creation of the conda environment and installation of the required packages have been detailed in the accompanying toolbox user manual. Although the toolbox was developed and tested on a Windows platform, it can be run on all operating systems that support a conda environment. The toolbox has been designed with a presentation layer, which is the GUI that handles user input requirements and displays the processed satellite imagery, computed water maps, and time series of surface water dynamics.The GUI runs in a Jupyter Notebook within a web browser with an internet connection. Retrieval and processing of satellite imagery are carried out on the GEE platform. No processing of satellite imagery or computation of water maps are carried out on the user’s computer except the display of imagery.
PyGEE-SWToolbox provides the means to export or download satellite imagery and computed water maps to the user’s Google drive or to a local drive. The output can be imported into other GIS applications. Figure 1 shows the framework of the toolbox, i.e., the steps and components involved in the process to obtain satellite imagery and extract the surface water for analysis. Figure 2 shows a screenshot of the GUI of PyGEE-SWToolbox.
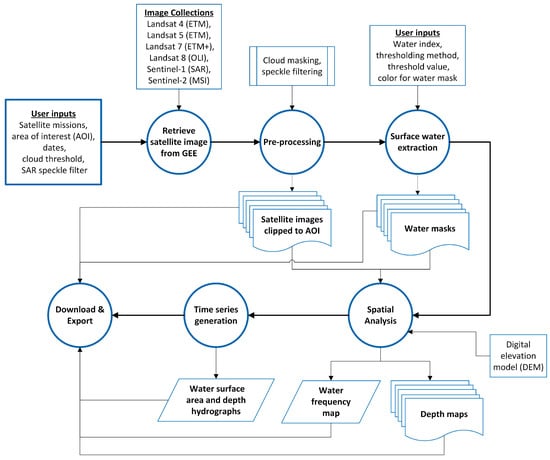
Figure 1.
Flow chart of the operational framework and functionalities of PyGEE-SWToolbox.
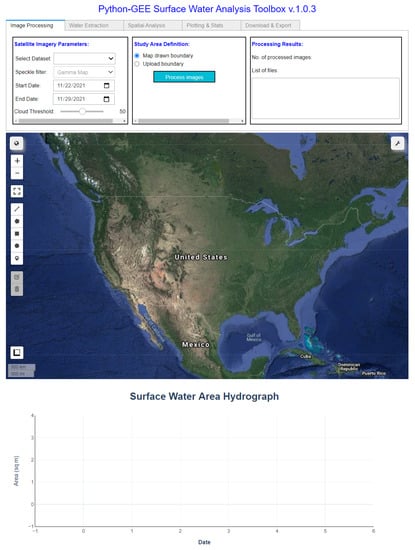
Figure 2.
A screenshot of the GUI of PyGEE-SWToolbox.
2.2. Available Satellite Imagery
PyGEE-SWToolbox provides easy access to all surface reflectance images from Landsat 4 (ETM), Landsat (ETM), Landsat 7 (EMT+), and Landsat 8 (OLI) Collection 1 Tier 1 image collections, as well as Sentinel-1 Synthetic Radar Aperture (SAR) and Sentinel-2 multi-spectral imagery (MSI). Furthermore, the National Agricultural Imagery Program’s (NAIP) high-resolution imagery is available, which is limited to the US. The choice of which Landsat mission to be used for an area of interest is figured out by the toolbox based on the user-specified dates with a preference for newer missions. The Landsat 7 imagery is limited to the periods 1999/01/01–2003/05/31 (before the Scan Line Corrector (SLC) failed) and 2012/05/05–2014/04/11 to fill the gap between the end of Landsat 5 and the beginning of Landsat 8 data collection. The Landsat 7 spacecraft carries an SLC instrument that compensates for the forward motion of the satellite that failed on 31 May 2003. Without an operating SLC, the sensor’s line of sight traces a zig-zag pattern along the satellite ground track, which leaves data gaps (https://www.usgs.gov/landsat-missions/landsat-7 accessed on 03 February 2022). All images retrieved based on selected satellite mission and study period are pre-processed (described in the following section) and clipped to the user’s area of interest (AOI) on the GEE server and not downloaded to the user’s computer. The imagery is viewed using the PyGEE-SWToolbox Mapper, which is connected to the GEE server. The toolbox utilizes the Red, Green, Blue, Near-Infrared (NIR), Shortwave-Infrared 1 (), and Shortwave-Infrared 2 () bands of the Landsat, Sentinel-2, and NAIP imagery for surface water analysis. The pixel_qa and QA60 bands of the Landsat and Sentinel-2, respectively, are used as quality control bands.
The list of available satellite imagery including their time of coverage, temporal, and spatial resolution is summarized in Table 1.

Table 1.
Summary of available satellite imagery datasets that can accessed in PyGEE-SWToolbox.
2.3. Image Pre-Processing
The satellite imagery retrieved using the parameters set by the user undergoes the pre-processing methods described in the following sub-sections.
2.3.1. Cloud Masking
The Landsat and Sentinel-2 imagery available on the GEE platform have a cloud cover percentage property, which is used to filter the images retrieved based on a user-defined cloud cover threshold. The quality assessment bands provided by the data provider contain a per-pixel cloud mask that is further used to mask out contaminated pixels in the filtered image collection.
2.3.2. Down-Sampling
The and bands of the Sentinel-2 images have a 20 m spatial resolution as compared to the 10 m resolution of the Red, Green, Blue, and NIR bands. The 20 m bands are down-sampled to 10 m using bilinear interpolation.
2.3.3. Speckle Filtering
Speckle noise inherent in the Sentinel-1 datasets undergo speckle filtering using the user-selected filtering algorithms available in PyGEE-SWToolbox. The filtering methods available are the Perona-Malik [15], Gamma Maximum A-posterior [16], Refined Lee [17], Lee Sigma [18], and P-Median filters, which are all implemented in the hydrafloods python package and a simple boxcar mean filter. Slope correction [19] is applied to the Sentinel-1 datasets as implemented in the hydrafloods package using the Shuttle Radar Topography Mission (SRTM) Digital Elevation Model (DEM).
All images retrieved from the GEE have been orthorectified and atmospherically corrected by the data provider; hence, no orthorectification and atmospheric correction is carried out.
2.4. Surface Water Extraction
PyGEE-SWToolbox is equipped with surface water extraction methods, such as the Normalized Difference Water Index (NDWI) [20], modified NDWI (MNDWI) [21], Automated Water Extraction Index (AWEI) [22], and the Dynamic Surface Water Extent (DSWE) [23], for the MSI images. The DSWE algorithm is used by the United States Geological Survey (USGS) to produce Level-3 analysis-ready datasets through the Earth Resources Observation (EROS) Center [6]. The DSWE dataset is not available on GEE so a python script of the algorithm was developed by adapting the GEE Javascript scripts by Soulard et al. [24] and Walker et al. [6]. It should be noted that the AWEI and DSWE water extraction algorithms are only applicable to the Landsat imagery.
Surface water extraction from the SAR images is carried out using Otsu’s method [25] and the Edge Otsu [26] thresholding algorithms available in the toolbox based on the user-selected polarization. The Edge Otsu implementation in the hydrafloods package is used in the toolbox. It should be noted that the user can also use the Otsu and Edge Otsu thresholding methods for extracting water pixels in the multi-spectral images.
2.5. Water Depth Estimation
The method for estimating the depth of water is based on the algorithm used by the Floodwater Depth Estimation Tool (FwDET v2.0) [27], which uses a flood extent and a DEM to calculate water depth. The implementation of this method adapts the GEE implementation of the FwDET by [28].
2.6. PyGEE-SWToolbox Use
The use of PyGEE-SWToolbox requires the user to have a GEE account. The download and installation process is elaborated in the Readme file and the toolbox user manual located in the Github repository. PyGEE-SWToolbox can be used by launching the Jupyter Notebook that ships with the toolbox or creating a Jupyter Notebook within the same directory of the toolbox, which gives the notebook access to PyGEE-SWToolbox modules. Figure 3 shows an example of loading the PyGEE-SWToolbox. In this example, the GEE Python API is loaded and authenticated. The authentication is only required on the first use of the toolbox. The toolbox module is then loaded, which displays the GUI. The user manual contains detailed steps on how to use the PyGEE-SWToolbox.
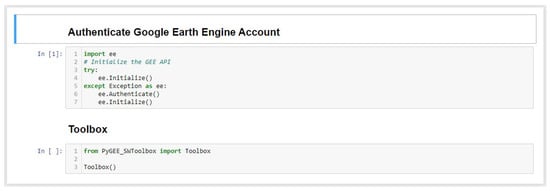
Figure 3.
Example of loading and launching PyGEE-SWToolbox.
3. PyGEE-SWToolbox Validation
3.1. Validation Sites and Data Sources
The toolbox is applied to four reservoirs and lakes across the US to generate a time series of surface water area dynamics. The reservoirs considered are the Elephant Butte Lake (New Mexico), Hubbard Creek Reservoir (Texas), Neversink Reservoir (New York), and Clearwater Lake (Missouri), as shown in Figure 4. These reservoirs were selected based on the availability of water elevation data and recent bathymetry data.
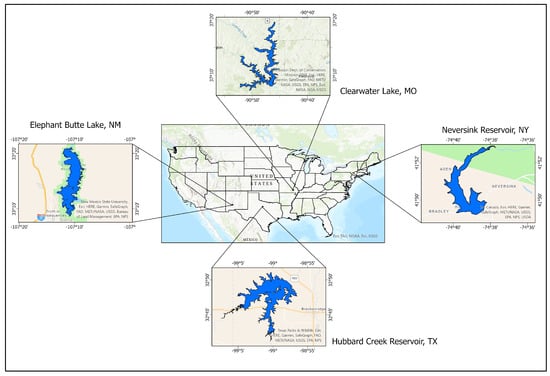
Figure 4.
Location map of study sites.
Water surface elevation in each reservoir or lake at 15-minute intervals was obtained from the USGS National Water Dashboard (https://dashboard.waterdata.usgs.gov/app/nwd/ accessed on 10 November 2021) and aggregated to a daily average. Elevation-area-capacity tables for the Neversink Reservoir and Clearwater Lake were obtained from USGS publications [29,30], while that of the Elephant Butte Lake and Hubbard Creek Reservoir was obtained from the Water Data for Texas of the Texas Water Development Board website (https://www.waterdatafortexas.org/reservoirs/statewide accessed on 28 October 2021) (TWDB). Table 2 shows the list of study sites including data sources.
Table 2.
List of study sites and data sources.
The elevation-area-capacity tables were used to convert the daily water elevations for each reservoir into a time series of surface water areas, which is herein considered observed data. The PyGEE-SWToolbox was used to generate time series of surface water areas for all the study sites from Landsat imagery using the commonly used water extraction indices: NDWI, MNDWI, and AWEI. The AWEI method has two formulas: one for areas where there is a likelihood of shadows caused by land features and the case where no shadow is expected. The formula for AWEI with shadows, termed AWEIsh, was used in this study because most reservoirs are located in valleys where the surrounding mounting ridges will likely cast shadows. The Landsat imagery was sampled using a 20% cloud-cover threshold. The imagery retrieved by the toolbox was manually inspected to remove all images that still had cloud contamination after the cloud-cover filtering process to obtain a good dataset for comparison with the observed data. A simple water index threshold >0 was used to extract water pixels. It should be noted that the expected extent of surface water at the spillway elevation for each study site was mapped into a shapefile and used as the boundary or AOI in PyGEE-SWToolbox for analysis.
3.2. Accuracy Assessment
The time series of surface water area generated with the PyGEE-SWToolbox is statistically compared to the observed data generated from the elevation-area-capacity tables to quantify the level of accuracy. At each study site, the observed data are filtered based on date to match the dates that satellite imagery is available. The statistics used for accuracy assessment are the Coefficient of determination (), Root Mean Squared Error (RMSE), Mean Absolute Error (MAE), and Percent Bias (PBIAS). The PBAIS measures the average tendency of the estimated data to be larger or smaller than the observed data, where positive values indicate underestimation and negative values indicate overestimation [31]. The performance metrics were computed using the hydrostats python package [32].
3.3. Results
A time series of surface water dynamics at all the study sites were computed using PyGEE-SWToolbox, exported, post-processed, and compared with observed data, as described in Section 3.1. Figure 5, Figure 6, Figure 7 and Figure 8 compares the time series of satellite-derived surface water extents for the three water indices used and the observed data at each site and associated errors. For clarity, only the time series of the best performing water index is plotted against the observed. The satellite-derived surface water dynamics match very well with the observed data in terms of a temporal trend, except between 05/05/2012 and 11/04/2014 where the SLC failed on Landsat 7, which resulted in data gaps.
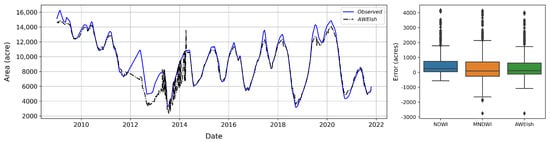
Figure 5.
Time series of surface water extent at Elephant Butte Lake, NM (left). Box plot of the distribution of surface extent errors (right).
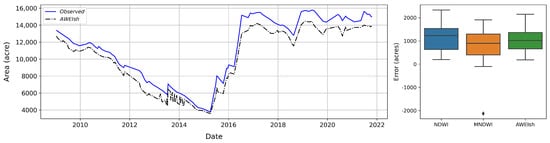
Figure 6.
Time series of surface water extent at Hubbard Creek Reservoir, TX (left). Box-plot of the distribution of surface extent errors (right).
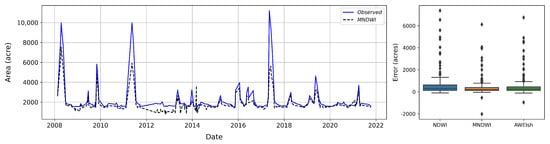
Figure 7.
Time series of surface water extent at Clearwater Lake, MO (left). Box-plot of the distribution of surface extent errors (right).
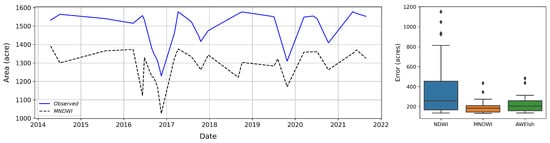
Figure 8.
Time series of surface water extent at Neversink Reservoir, NY (left). Box-plot of the distribution of surface extent errors (right).
All the water extraction indices used performed very well at all the sites, with an ranging between 0.63 and 0.99, except at the Neversink Reservoir, where the maximum is 0.52 using the MNDWI water index. A similar trend was seen in the RMSE and MAE metrics. The PBIAS at all locations for every water index was positive, which indicates the general underestimation of surface water extents. The underestimation can be attributed to cloudy pixels and shadows. Water detection near the shorelines is often inaccurate because they are laden with sediment and also shallow waters with visible bottoms are often classified as non-water pixels.
The large difference between the observed and the satellited-derived water surface area at the Neversink Reservoir was due to cloud contamination. Although our validation of the toolbox sampled satellite imagery with a maximum cloud cover of 20%, the imagery for the Neversink Reservoir still contained a lot of cloudy pixels that should be removed during the cloud masking process, which reduces the number of analysis-ready pixels for water surface area computation. Table 3 summarizes the performance metrics at each site.
Table 3.
Summary of performance assessment.
Overall, the validation results show that PyGEE-SWToolbox offers the capability to monitor and generate historical datasets on the dynamics of surface water resources. Although the validation of the toolbox was carried out at four sites using Landsat, the toolbox applies to all locations around the world subject to the availability of the satellite images for the study area, excluding the DSWE water extraction method, which is only applicable to the US.
4. Conclusions
This paper presents PyGEE-SWToolbox, a freely available and open-source GEE-enabled python toolbox that gives the user the ability to obtain time series of satellite imagery and process and extract surface water characteristics at any location around the world. The toolbox is easy to use through the graphical user interface (GUI) provided. PyGEE-SWToolbox offers the ability to monitor surface water dynamics at short and long temporal scales using using different remote sensing water extraction algorithms and different satellite platforms to provide vital information for water resource management and climate change impact assessment. The satisfactory results of the toolbox validation have demonstrated that it can be used for monitoring the dynamics of surface water resources and generating a time series for same.
PyGEE-SWToolbox can be a valuable tool for policy makers and water resource managers as a supplement to field measurements or as the main source of information at locations with no gauges. It is also intended for researchers, engineers, water resource managers, and students who would like to utilize the geospatial datasets and cloud computing power of the GEE platform to monitor changes in water resources with little to no knowledge on the use of the GEE platform and its coding requirements. The toolbox can be accessed on Github (https://github.com/collinsowusu/PyGEE-SWToolbox accessed on 15 February 2022) and Zenodo (https://zenodo.org/record/5664523 accessed on 15 February 2022) repositories. The repositories contain a step-by-step user manual and Readme file for the toolbox.
Author Contributions
Conceptualization, C.O. and A.J.K.; methodology, C.O. and N.J.S.; software, C.O., N.J.S., M.T.M. and A.J.K.; validation, C.O., N.J.S. and M.T.M.; writing—original draft preparation, C.O.; writing—review and editing, N.J.S., M.T.M. and A.J.K.; supervision, A.J.K.; funding acquisition, A.J.K. All authors have read and agreed to the published version of the manuscript.
Funding
The research is based upon work supported by the Natural Resources Conservation Service, U.S. Department of Agriculture, and The Nature Conservancy, under award number 68-5C16-17-015. Any opinions, findings, conclusions, or recommendations expressed in this publication are those of the authors and do not necessarily reflect the views of the Natural Resources Conservation Service or The Nature Conservancy. The authors also acknowledge the funding and administrative support from the Center for the Management, Utilization, and Protection of Water Resources (TTU Water Center) at the Tennessee Technological University.
Data Availability Statement
The datasets used in the validation of PyGEE-SWToolbox are openly available at https://github.com/collinsowusu/PyGEE-paper-2021 (accessed on 15 February 2022).
Acknowledgments
The authors would like to thank Google for making their Google Earth Engine platform available for this work. The authors also would like to thank Jessica J. Walker (USGS) for providing the Javascript code for the DSWE implementation and all the developers of the Python packages used.
Conflicts of Interest
The authors declare no conflict of interest.
References
- Legleiter, C.J.; Harrison, L.R. Remote Sensing of River Bathymetry: Evaluating a Range of Sensors, Platforms, and Algorithms on the Upper Sacramento River, California, USA. Water Resour. Res. 2019, 55, 2142–2169. [Google Scholar] [CrossRef]
- DeVries, B.; Huang, C.; Armston, J.; Huang, W.; Jones, J.W.; Lang, M.W. Rapid and robust monitoring of flood events using Sentinel-1 and Landsat data on the Google Earth Engine. Remote Sens. Environ. 2020, 240, 111664. [Google Scholar] [CrossRef]
- Casal, G.; Harris, P.; Monteys, X.; Hedley, J.; Cahalane, C.; McCarthy, T. Understanding satellite-derived bathymetry using Sentinel 2 imagery and spatial prediction models. Giscience Remote Sens. 2020, 57, 271–286. [Google Scholar] [CrossRef]
- Wu, Q.; Lane, C.R.; Li, X.; Zhao, K.; Zhou, Y.; Clinton, N.; DeVries, B.; Golden, H.E.; Lang, M.W. Integrating LiDAR data and multi-temporal aerial imagery to map wetland inundation dynamics using Google Earth Engine. Remote Sens. Environ. 2019, 228, 1–13. [Google Scholar] [CrossRef] [PubMed] [Green Version]
- Vos, K.; Splinter, K.D.; Harley, M.D.; Simmons, J.A.; Turner, I.L. CoastSat: A Google Earth Engine-enabled Python toolkit to extract shorelines from publicly available satellite imagery. Environ. Model. Softw. 2019, 122, 104528. [Google Scholar] [CrossRef]
- Walker, J.J.; Soulard, C.E.; Petrakis, R.E. Integrating stream gage data and Landsat imagery to complete time-series of surface water extents in Central Valley, California. Int. J. Appl. Earth Obs. Geoinf. 2020, 84, 101973. [Google Scholar] [CrossRef]
- Luo, M.; Liu, T.; Meng, F.; Duan, Y.; Bao, A.; Xing, W.; Feng, X.; De Maeyer, P.; Frankl, A. Identifying climate change impacts on water resources in Xinjiang, China. Sci. Total Environ. 2019, 676, 613–626. [Google Scholar] [CrossRef] [PubMed]
- Buytaert, W.; Célleri, R.; Timbe, L. Predicting climate change impacts on water resources in the tropical Andes: Effects of GCM uncertainty. Geophys. Res. Lett. 2009, 36. [Google Scholar] [CrossRef] [Green Version]
- Erwin, K.L. Wetlands and global climate change: The role of wetland restoration in a changing world. Wetl. Ecol. Manag. 2009, 17, 71–84. [Google Scholar] [CrossRef]
- Gorelick, N.; Hancher, M.; Dixon, M.; Ilyushchenko, S.; Thau, D.; Moore, R. Google Earth Engine: Planetary-scale geospatial analysis for everyone. Remote Sens. Environ. 2017, 202, 18–27. [Google Scholar] [CrossRef]
- Amani, M.; Ghorbanian, A.; Ahmadi, S.A.; Kakooei, M.; Moghimi, A.; Mirmazloumi, S.M.; Moghaddam, S.H.A.; Mahdavi, S.; Ghahremanloo, M.; Parsian, S.; et al. Google Earth Engine Cloud Computing Platform for Remote Sensing Big Data Applications: A Comprehensive Review. IEEE J. Sel. Top. Appl. Earth Obs. Remote Sens. 2020, 13, 5326–5350. [Google Scholar] [CrossRef]
- Kluyver, T.; Ragan-Kelley, B.; Pérez, F.; Granger, B.E.; Bussonnier, M.; Frederic, J.; Kelley, K.; Hamrick, J.B.; Grout, J.; Corlay, S.; et al. Jupyter Notebooks—A Publishing Format for Reproducible Computational Workflows. In Positioning and Power in Academic Publishing: Players, Agents and Agendas; Loizides, F., Schmidt, B., Eds.; IOS Press: Amsterdam, The Netherlands, 2016; pp. 87–90. [Google Scholar] [CrossRef]
- Wu, Q. geemap: A Python package for interactive mapping with Google Earth Engine. J. Open Source Softw. 2020, 5, 2305. [Google Scholar] [CrossRef]
- Montero, D. eemont: A Python package that extends Google Earth Engine. J. Open Source Softw. 2021, 6, 3168. [Google Scholar] [CrossRef]
- Perona, P.; Malik, J. Scale-space and edge detection using anisotropic diffusion. IEEE Trans. Pattern Anal. Mach. Intell. 1990, 12, 629–639. [Google Scholar] [CrossRef] [Green Version]
- Lopes, A.; Touzi, R.; Nezry, E. Adaptive speckle filters and scene heterogeneity. IEEE Trans. Geosci. Remote Sens. 1990, 28, 992–1000. [Google Scholar] [CrossRef]
- Lee, J.S. Speckle analysis and smoothing of synthetic aperture radar images. Comput. Graph. Image Process. 1981, 17, 24–32. [Google Scholar] [CrossRef]
- Lee, J.-S.; Wen, J.-H.; Ainsworth, T.; Kun-Shan Chen, K.-S.; Chen, A. Improved Sigma Filter for Speckle Filtering of SAR Imagery. IEEE Trans. Geosci. Remote Sens. 2009, 47, 202–213. [Google Scholar] [CrossRef]
- Vollrath, A.; Mullissa, A.; Reiche, J. Angular-Based Radiometric Slope Correction for Sentinel-1 on Google Earth Engine. Remote Sens. 2020, 12, 1867. [Google Scholar] [CrossRef]
- McFEETERS, S.K. The use of the Normalized Difference Water Index (NDWI) in the delineation of open water features. Int. J. Remote Sens. 1996, 17, 1425–1432. [Google Scholar] [CrossRef]
- Xu, H. Modification of normalised difference water index (NDWI) to enhance open water features in remotely sensed imagery. Int. J. Remote Sens. 2006, 27, 3025–3033. [Google Scholar] [CrossRef]
- Feyisa, G.L.; Meilby, H.; Fensholt, R.; Proud, S.R. Automated Water Extraction Index: A new technique for surface water mapping using Landsat imagery. Remote Sens. Environ. 2014, 140, 23–35. [Google Scholar] [CrossRef]
- Jones, J. Improved Automated Detection of Subpixel-Scale Inundation—Revised Dynamic Surface Water Extent (DSWE) Partial Surface Water Tests. Remote Sens. 2019, 11, 374. [Google Scholar] [CrossRef] [Green Version]
- Soulard, C.E.; Walker, J.J.; Petrakis, R.E. Implementation of a surfacewater extent model in cambodia using cloud-based remote sensing. Remote Sens. 2020, 12, 984. [Google Scholar] [CrossRef] [Green Version]
- Otsu, N. A Threshold Selection Method from Gray-Level Histograms. IEEE Trans. Syst. Man Cybern. 1979, 9, 62–66. [Google Scholar] [CrossRef] [Green Version]
- Donchyts, G.; Schellekens, J.; Winsemius, H.; Eisemann, E.; van de Giesen, N. A 30 m resolution surfacewater mask including estimation of positional and thematic differences using landsat 8, SRTM and OPenStreetMap: A case study in the Murray-Darling basin, Australia. Remote Sens. 2016, 8, 386. [Google Scholar] [CrossRef] [Green Version]
- Cohen, S.; Raney, A.; Munasinghe, D.; Loftis, J.D.; Molthan, A.; Bell, J.; Rogers, L.; Galantowicz, J.; Brakenridge, G.R.; Kettner, A.J.; et al. The Floodwater Depth Estimation Tool (FwDET v2.0) for improved remote sensing analysis of coastal flooding. Nat. Hazards Earth Syst. Sci. 2019, 19, 2053–2065. [Google Scholar] [CrossRef] [Green Version]
- Peter, B.G.; Cohen, S.; Lucey, R.; Munasinghe, D.; Raney, A.; Brakenridge, G.R. Google Earth Engine Implementation of the Floodwater Depth Estimation Tool (FwDET-GEE) for Rapid and Large Scale Flood Analysis. IEEE Geosci. Remote Sens. Lett. 2020, 1–5. [Google Scholar] [CrossRef]
- Richards, J.M.; Huizinga, R.J. Bathymetric Contour Map, Surface Area and Capacity Table, and Bathymetric Difference Map for Clearwater Lake near Piedmont, Missouri, 2017; Technical Report; USGS: Reston, VA, USA, 2018. [CrossRef] [Green Version]
- Nystrom, E.A. Bathymetry of Ashokan, Cannonsville, Neversink, Pepacton, Rondout, and Schoharie Reservoirs, New York, 2013–15; Technical Report; USGS: Reston, VA, USA, 2018. [CrossRef] [Green Version]
- Moriasi, D.N.; Gitau, M.W.; Pai, N.; Daggupati, P. Hydrologic and water quality models: Performance measures and evaluation criteria. Trans. Asabe 2015, 58, 1763–1785. [Google Scholar] [CrossRef] [Green Version]
- Roberts, W.; Williams, G.P.; Jackson, E.; Nelson, E.J.; Ames, D.P. Hydrostats: A Python Package for Characterizing Errors between Observed and Predicted Time Series. Hydrology 2018, 5, 66. [Google Scholar] [CrossRef] [Green Version]
Publisher’s Note: MDPI stays neutral with regard to jurisdictional claims in published maps and institutional affiliations. |
© 2022 by the authors. Licensee MDPI, Basel, Switzerland. This article is an open access article distributed under the terms and conditions of the Creative Commons Attribution (CC BY) license (https://creativecommons.org/licenses/by/4.0/).