Abstract
Urban sustainability is a critical target under the sustainable development goals (SDGs), especially considering the response of cities to most of the resource and carbon footprints of human beings. The circular economy (CE) strategy offers an innovative and important pathway for forwarding sustainable urban development in terms of resource saving and waste mitigation. A particularly important measure of the circular economy is the urban industrial symbiosis, which, as an imitation of the ecological system, is viewed as an effective way to achieve the sustainable and low-carbon transformation of industries and downtown areas. However, evidence of its comprehensive environmental benefit is less reported. With this circumstance, this paper aims at identifying the environmental benefits of urban industrial symbiosis, with a focus on urban carbon footprints (CFP). With this basis, we shall also discuss the promotion of urban industrial symbiosis as a critical component in support of the carbon neutrality strategy. A hybrid approach integrating a process-based inventory analysis and an input–output analysis (IOA) is developed to analyze urban CFPs. Results imply that considerable savings in resources and the reduction of CFPs could be achieved via the coal-aluminum-electricity-steel industrial symbiosis. In detail, the eight designed synergies, with the aluminum-electricity-steel plants as the hubs, could reduce CO by 1.09 Mt per year, which accounted for 3.63% of the total CFPs in the city in a business-as-usual (BAU) scenario in 2012. This could partly offset the increase of CO emissions due to the economy’s expansion and realize a second mitigation effect apart from the efficiency change in technologies. A crucial understanding of the function of industrial symbiosis in accelerating the sustainable transformation of cities could then be reached. Finally, further implications on policy when tackling the gaps in regional eco-industrial development are proposed and discussed.
1. Introduction
To tackle the climate change, a number of countries have announced a national carbon neutrality strategy [1,2,3]. From the perspective of carbon mitigation, the potential could come from various sources, including technology innovation, efficiency measures as well as systematic innovation [4,5,6]. Among these countermeasures, how to explore the carbon mitigation potential from the perspective of industrial and urban systems is critical [7]. Industrial sectors rely extensively on fossil fuels, the highest carbon emitters, and in turn face many challenges regarding compliance with the set emission standards [8]. Additionally, the cost of carbon mitigation within each industry seperately sector is continuously increasing.
Among a series of technical and socioeconomic countermeasures to enhance urban sustainability is urban industrial symbiosis, which is defined as the exchange of waste and byproducts between cities and industries; it is a preventative and regenerative pathway for optimizing urban metabolism [9,10,11,12]. Considering that urban resources (e.g., materials, fossil fuels, land, and water) are limited, waste regeneration plays an important role in breaking through the limitation [13]. In this way, the sustainability of the urban built environment, which can be described as a form of urban resource that multiplies resource efficiency, can hereby be improved [1,14]. Particularly, the circular economy, of which urban industrial symbiosis is one critical practice, is well-recognized as quite an effective way to achieve low-carbon benefits [15,16,17,18]. However, the experience of mitigating urban carbon dioxide (CO) emissions is less proved.
This paper tries to explore the potential contribution of urban industrial symbiosis to carbon neutrality through a case study in China, where the aim was to realize its carbon neutrality target by 2060, and with the world’s largest urban and industrial scale. To meet the hotspot policy requirements of the “Post COP26”, we particularly focus on low-carbon benefits and utilize carbon footprints (CFPs) at the urban level as a quantitative indicator to present the cost and benefits. To the best of our knowledge, there have been rather few studies investigating the urban CFPs due to both the methodology and data availability limitations, particularly in China [16]. How improvements at the enterprise level can be analyzed with improvements at the regional level in a unified framework is the main challenge. This paper develops a hybrid approach that integrates a process-based inventory analysis and an input–output analysis (IOA) for the quantification of urban CFPs in order to overcome the shortcomings of the traditional IPCC approach, life cycle analysis, and IOA. Up-to-date (2012) and first-hand data of urban industrial symbiosis are also collected to complement the data scarcity in this field. A typical industrial city with a coal-aluminum-electricity-steel industrial system as its core is selected as the case study. Our study will hence be valuable for the follow-up implications. We hope that this research will be helpful for the urban planning policy makers to understand the other very related field of China’s cutting-edge eco-industrial progress and urban transformation.
The rest of this paper is organized as follows: after this introduction, Section 2 introduces the concept of urban industrial symbiosis in detail and highlights its contribution to carbon neutrality; Section 3 presents the methods and data; Section 4 introduces the case city; Section 5 presents the analytical results and discussion; finally, Section 6 draws the conclusions and implications.
2. Carbon Neutrality Strategy and Industrial Symbiosis
To tackle the challenge of climate change, a number of countries have committed to the carbon neutrality strategy. The realization of carbon neutrality relies on a wide range of technologies across sectors, involving almost all industries and economic activities. International organizations sorted out the key technologies of decarbonization in key sectors (for instance, industry, transportation, construction, and housing) years ago, from which every country could develop their road map toward decarbonization. These assessments include technological solutions, from smart power grids to synthetic fuels. IEA has set up a long-term project focusing on five sectors that have difficulties with reducing emissions, cumulatively including information on the level of maturity and other details for 433 technologies.
Some researchers have explored the socio-economic pathways of different countries under the carbon neutral target in trying to find a way that can balance cost-efficiency and meeting the 1.5 C or 2 C target at the same time [19]. Those evaluations made use of global integrated assessment models (IAMs) to provide a trans-regional contrast of confiding routes for net-zero CO within one consistent framework [20,21], or took national-scale models into consideration in order to more precisely capture regional details such as national circumstances, resource endowment, and other socio-economic development options [22,23], finally suggesting electricity/energy demand-side/CDR decarbonization pathway options for the main GHG-emitting countries [24,25,26,27].
Back in China, the central government proposes to realize carbon neutrality by 2060, and we summarize the key technology road map in Figure 1. We could see that the integration of the power sector and the industrial sector will be an important potential in realizing carbon neutrality. In addition, China’s industrialization interacts with the process of urbanization; therefore, a second potential could come from the proper design of integrated industrial and urban systems.
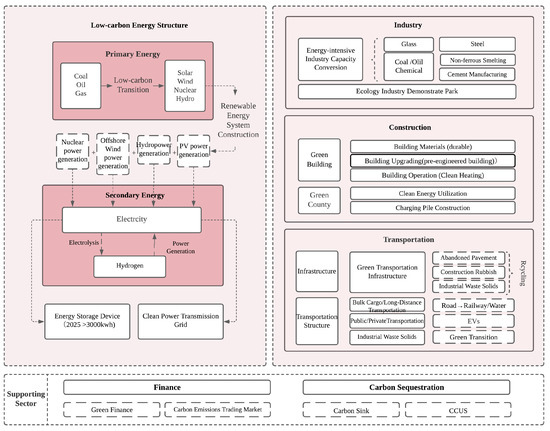
Figure 1.
China’s technology road map to realize carbon neutrality.
Urban industrial symbiosis is a significant part of the industrial ecology (IE) subject. The so-called “Industrial Ecology” was developed in the late 1980s [26,27] to offer a new analytical framework for understanding how industrial systems impact the environment. Compared with a traditional pollution-prevention strategy, it focused on the system optimization of our environmental and socioeconomic system, with a special emphasis on industrial and socioeconomic metabolism (illustrated in Figure 2). The concept of “Industrial Ecology” was promoted and practiced as various policy realms combined with other concepts such as the “Circular Economy and 3R (Reduce, Reuse, and Recycle)” in Germany, “Sound Material-Cycle Society” in Japan, “Green Growth” in South Korea, as well as the “Circular Economy” and “Eco-Industrial Parks” in China [3,27,28,29,30].

Figure 2.
IE as evolutionary thinking.
In the idea of urban industrial symbiosis (Figure 3), it aims to realize the optimization of urban metabolism (resource consumption, transformation, and related emissions) via industrial and urban system integration, in which the integration of material and energy flow is a key point. Through the exchange of waste and byproducts between industries, and between industries and cities, resource efficiency could be enhanced, and as a result, carbon mitigation could be realized by such systematic innovation.
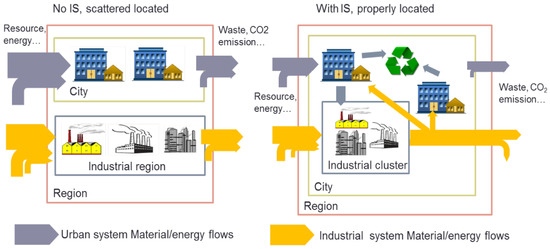
Figure 3.
Prioritization scheme of urban industrial symbiosis.
3. Materials and Methods
3.1. Model Integration Scheme
The process model and input–output analysis integration scheme is illustrated in Figure 4. A process-based inventory analysis tracks the flows and emission inventories specifically related to symbiosis networks, for example, the waste exchange and corresponding reductions in emissions of companies. IOA is applied to further evaluate the changes in the specific impact of products (or wastes) flowing into and out of the symbiosis network (e.g., some upstream and downstream flows illustrated in Figure 4). Finally, based on the IOA and the carbon emission coefficients of each sector and material, the carbon footprint is calculated and benchmarked.
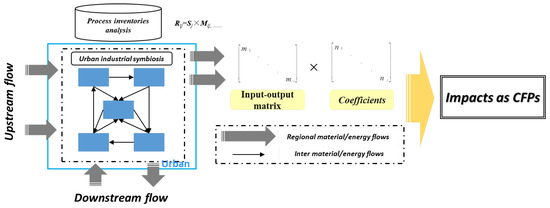
Figure 4.
Model integration scheme: linkage of inventory analysis and IOA.
3.2. Hybrid Approach for CFP Analysis
Carbon Footprint (CFP) is the equivalent carbon dioxide emissions generated by human activities directly and indirectly within the boundaries of a specific system (nation, region, urban, and/or enterprise) [31,32]. It is considered as the primary tool for explaining carbon emissions related to human civilization [16,25]. In general, the CFP analytical approach can be divided into three types: (a) IPCC method (Intergovernmental Panel on Climate Change emission inventory and factors), which is a bottom-up approach to account for the CFPs according to the fuel sources consumed on site but usually ignores the indirect emissions within the total life cycles [33,34]; (b) Life-cycle analysis (LCA) based on process analysis can quantify direct and indirect emissions, but mainly focuses on the CFP of microscopic entities such as products [35], consumers [36], and enterprises [37]; (c) Compared with the LCA method, the IOA method can use the input–output table (IOT) that contains aggregated information on sectors to measure the emissions of macroscopic bodies such as countries, regions, and cities [25,31]. However, it cannot reflect the information specifically related to the symbiotic process [3]. According to the pros and cons of each approach, this paper applies a hybrid approach that integrates a process inventory analysis and an IOA to quantify urban level CFPs.
The IOA, developed by Wassily Leontief in 1936, is an advanced and popular tool for investigating the interaction among different sectors of the national and regional economy [38]. In using the IOA to evaluate CFPs at the urban level, in which IOTs are usually unavailable, provincial level IOTs are applied. The basic structure of IOT is illustrated in Table 1, and the key mathematical functions are subsequently described.

Table 1.
Conceptual framework of IOA model in this research.
The production structure matrix is the key element of the IOA, which expresses the complex economic relationship within the economic system. To measure the CFP in terms of production and consumption, the accounting approach for the total output is as follows (Equations (1) and (2)):
where A is the direct consumption coefficient matrix, presenting the direct input of sector i into sector j; X is the total output vector; represents the intermediate output; Y is the final demand vector, including consumption, import, and export within the system; is the input x of sector i into sector j; and i and j represent different sectors.
Based on Equations (1) and (2), we can further get the following equations:
where is the inverse Leontief matrix, which represents the total demand; is the diagonal matrix of Y, which allocates the intermediate demands of the production sectors; is the final demand of sector i; is the total demand of each sector. In this way, it is able to measure each sectors’ intermediate and total demands in the matrix and disclose the economic relationship between each sector. Based on above, carbon emissions will be calculated with the help of the environmental coefficient matrix:
where C is the carbon intensity vector representing the per unit carbon emission; is the diagonal matrix of C; E is the matrix of carbon emission; represents the input of carbon emission from sector i to sector j. In order to calculate the CFP of the production and consumption perspectives, Equations (9) and (10) are developed:
where is carbon emissions from production, to be calculated as the sum of each row of matrix E; is carbon emissions embodied in consumption, which is the sum of each column of matrix E.
3.3. The Setting of Scenarios
We mainly compare the CFs in 2012, with the business-as-usual scenario (without implementation and planning for urban industrial symbiosis) and the urban industrial symbiosis scenario. In addition, the year 2002 is also used as a baseline scenario (to see the change in BAU 2012). In total, three scenarios are analyzed:
- a.
- Baseline scenario in 2002, named BL 2002;
- b.
- Business-as-usual scenario in 2012: Regular technological development and economic growth by 2012, named BAU 2012;
- c.
- Urban Industry Symbiosis Scenario 2012: Considering multiple urban industry symbiosis programs based on local conditions, named UIS 2012.
3.4. Data Source
For the analysis of the urban industrial symbiosis, the data used come from first-hand surveys and second-hand company reports and statistics. One co-author of this paper took part in the local planning project survey in 2016, which was for the city of Guiyang and was based on the project “Guiyang city 13th five-year plan for industries under optimized environmental capacity” (2016–2017). Around 50 companies in various industry categories such as iron/steel, cement, phosphorus-chemical, coal-chemical, power generation, and agriculture were surveyed. With the help of local government agencies, 100 survey sheets were distributed to collect the data from companies and sectoral inventories, such as resource and energy consumption, waste generation and disposal, as well as the material and waste flow for the companies; consultation with agencies and experts from local governments was also conducted. In early 2017, 55 completed questionnaires were returned and verified. As supporting material, the data were also gathered from reports of certain technical enterprises and the open municipal official documents to make up for the gaps in the remaining data. Baseline year for the data applied in this paper is 2012, in line with the IOTs.
For the data related to input–output analysis, cities do not usually have IOTs; therefore, we used the provincial level IOTs, which is the usual way in existing studies [3,5,25,31]. The IPCC method was combined with the Guizhou Province Energy Statistical Yearbook (ESY) to calculate for the sectoral energy and emission inventories. Finally, we aggregated 42 departments into five summary departments according to IOT—respectively named agriculture, industry, construction, transportation, and service—in order to coordinate the departmental classification of IOT and ESY.
4. Introduction to the Case City
The location information is illustrated in Figure 5.
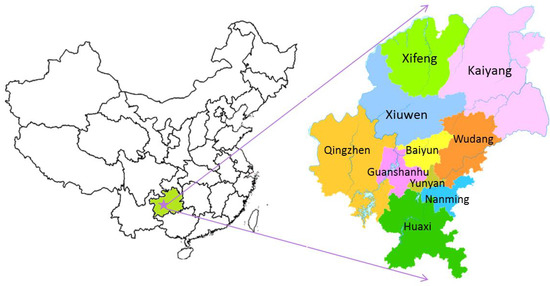
Figure 5.
Geographical information of Guiyang city in China.
Similar to most Chinese cities, Guiyang has experienced rapid economic growth and a significant increase in resource consumption. Figure 6 shows its domestic resource consumption, including metal and non-metal ores, biomass, and fossils. The total amount increased by 3.5 times, from to tons. As regards waste generation, the amount nearly doubled from 2000 to 2014. From the perspective of per capita resource consumption and GDP, the increase in the speed of the former is faster than that of the latter, revealing that the decoupling of resource consumption and economic growth in Guiyang still has not happened (illustrated in Figure 7). In this circumstance, Guiyang needs to deepen its CE promotion, strengthen the practice of urban industrial symbiosis, as well as pay more attention to and act on the exchange of large amounts of waste between the industrial sector and downtown areas.
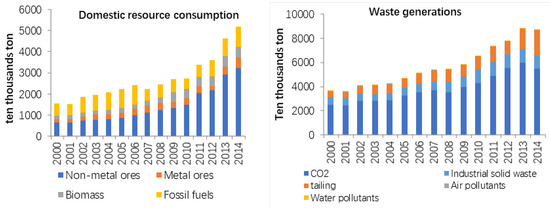
Figure 6.
Resource consumption and waste generation in Guiyang, 2000–2014.
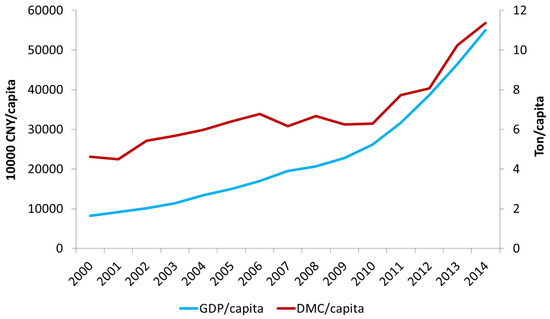
Figure 7.
Per capita GDP and direct material consumption in Guiyang, 2000–2014.
The following part will be based on the hybrid method we constructed in the previous section, to trace the improvements of urban environmental improvement in Guiyang and the impact of urban industrial symbiosis on the reduction of CFP in urban areas.
5. Results and Discussions
5.1. Design of Urban Industrial Symbiosis Scenarios
Based on the supply and demand match highlighted in Figure 8 and the scenario design, the urban industrial symbiosis is designed as follows:
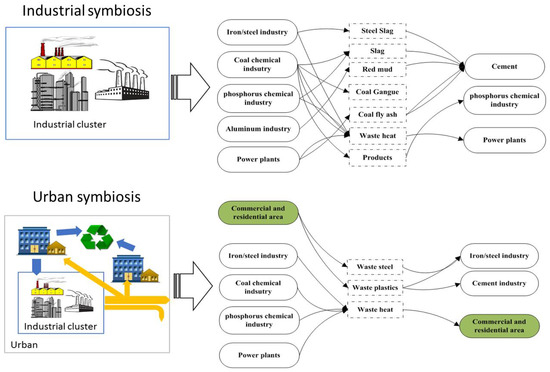
Figure 8.
Supply and demand match analysis for Guiyang.
- a.
- Industrial solid waste exchanges: slag and coal gangue are recycled in the cement industry;
- b.
- Urban symbiosis for solid waste: urban municipal solid waste is recycled in the furnaces of iron and steel, and the cement industry replaces fossil fuels such as coke;
- c.
- Waste heat use: including the utilization of industrial waste heat and the provision of waste heat from industries to downtown areas (such as central heating systems for commercial and residential buildings) and the agricultural sector (such as from steam to greenhouses to produce high value-added agricultural products).
- d.
- Traditional recycling: such as scrap steel recycling.
Based on the matching analysis of the local industrial and urban supply chain, the symbiotic network is illustrated in Figure 9. Accordingly, Table 2 summarizes the detailed scale and the exchanged values of the material, wastes, and byproducts in the designed synergies. The aluminum, electricity, and steel sectors are identified as the hubs for the designed urban industrial symbiosis; the waste and byproduct exchanges include:
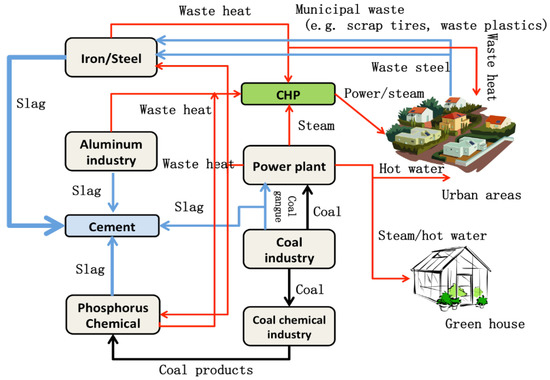
Figure 9.
Urban industrial symbiosis design in Guiyang.

Table 2.
Summary of process data from the symbiotic network.
- (a)
- The substitution of steel-making waste (steel slag) for saved concrete raw material (such as the clinker), at the scale of 120 kt/y;
- (b)
- The substitution of cement material with phosphorus slag, at the scale of 500 kt/y;
- (c)
- The substitution of aluminum-making waste for concrete raw material, to save clinker and related resource and energy in producing clinker, at the scale of 400 kt/y;
- (d)
- Coal gangue resulting from power generation could be recycled and used to substitute cement raw materials, at the scale of 100 kt/y;
- (e)
- To recycle and use coal flying ash, to substitute cement raw materials, at the scale of 200 kt/y;
- (f)
- To recycle and reuse waste plastics, to substitute the fossil fuel consumption in the furnace of the steel plant, at the scale of 10 kt/y;
- (g)
- Waste heat recovery and provision to the steel and chemical plant, as substitute for the in-plant steam generation, so as to reduce fossil fuel consumption. The waste heat is also provided to CHP for the urban district central heating system, and the total scale is 300 t/y;
- (h)
- Recycling of steel scrap to save the raw material and energy consumption in the steel plant, at the scale of 100 kt/y.
For more detailed local situation, industry, technical, and economic data, refer to text in previous research [3]. With the process analysis of the symbiosis network synergy, the CFP is evaluated. It should be noted that not all the synergies in Figure 10 are caused by data availability (for example, in the case of certain project data where the business is confidential).
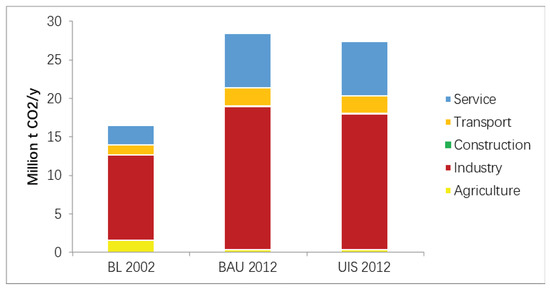
Figure 10.
The CFP effect of UIS and non-UIS.
5.2. Scenarios Analysis
The BAU scenario and the urban industry symbiosis scenario are evaluated based on the urban CFPs.
As a basis for calculation, the calculation of industry carbon intensity is summarized in Table 3. It can be seen that the process of industrialization and urbanization has accelerated, and industrial carbon intensity has risen sharply.

Table 3.
Comparison of two years of carbon intensity.
Furthermore, scenarios are compared and illustrated in Figure 10. Considering the urban CFPs altogether within the research term, the number of CFPs of Guiyang City varied from 16.5 MtCO in BL2002 to 28.4 MtCO in BAU2012. From the sectorial perspective, in the BL2002 scenario, the CFPs of agriculture, industry, construction, transport, and service were 1.54, 11.08, 0.02, 1.30, and 2.56 Mt CO/year. As for BAU2012, the numbers changed to 0.39, 18.57, 0.08, 2.31, and 7.04 Mt CO/year. Except for the agricultural sector, all the other sectors’ CFPs dramatically increased, corresponding to the accelerated industrial development and economic scaling-up in Guiyang during the research period. As for the agricultural sector, the absolute value of CFPs was identified to have decreased. The main driving forces behind this were technological efficiency enhancement and the intensification of agricultural production in the region. It is known that for developing countries, how to improve efficiency within the amount of the increasing consumption and impact in order to achieve decoupling is critical.
In contrast with BL2002 and BAU2012, the benefit of the UIS2012 scenario is analyzed. In particular, contrast with BAU2012 can uncover the additional advantages of the development of urban industrial symbiosis. It emphasizes the reduction of 1.09 Mt CO/year in the CFPs of UIS2012; in contrast with BAU2012, it accounts for 3.63% of total CFPs in BAU2012, which is quite a remarkable advantage. It was noted that out of the 1.09 Mt CO/year mitigation on the CFPs, a mitigation of 1.03 Mt CO/year comes from industries. As the scenario projection is focused on aluminum, steel, and power plants, therefore, the most critical sector for CFP mitigation is the industrial sector. It is also meaningful as the case city is an industrial city. For example, according to China’s five-year planning on energy conservation and pollution control, the five-year period usually requires 10–20% in energy conservation, which means 2–4% annually. If we compare these numbers, the benefit comes from urban industrial symbiosis (a systematic innovation), which contributes approximately one year of energy savings and the corresponding carbon mitigation effect.
We further investigate the benefits of each type of urban industrial symbiosis (illustrated in Figure 11). In detail, conventional regeneration, urban symbiosis for SW (solid waste) as well as waste heat use enable the reduction of CFPs by 839.00, 108.80, 93.60, and 49.05 ktCO/year, respectively. Because of the mass of exchange, industrial solid waste regeneration is the most efficient in reaching the urban CFP reduction goal.
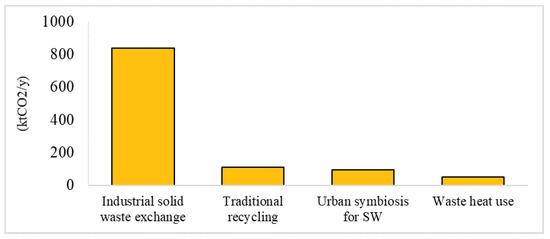
Figure 11.
CFP reduction for each type of symbiosis.
6. Discussion
The analytical consequence highlights the benefits of urban IS on urban CFP mitigation. From the point of view of life cycle, urban industrial symbiosis can reduce CFPs through the saving of upstream resources by turning waste into raw materials. Moreover, although the regeneration of material and energy of MSW is less efficient than industrial waste, merit is highlighted as they belong to the emerging format of resource and energy reuse to some extent. With more recognition and more mature and efficient technologies, they can also become the key driver of urban CFP mitigation.
- a.
- As a final part of this section, research limitations and future concerns are discussed. From the perspective of urban CFP accounting methodology, uncertainty will be generated by using the provincial-level IOTs to present the interaction of sectors at the urban level. Hence, in the future, conducting an urban-level survey so that more detailed urban IO data could be compiled will significantly improve the current approach. Particular, in future studies, a sensitivity analysis on the coefficient matrix (in this study, we only borrowed the matrix from provincial IoTs, but it has the potential to use localized data to adjust and verify the coefficient matrix) will be helpful to test and verify the IOA.
- b.
- When tracing the urban CFPs, the trans-boundary issues (e.g., material and waste flows that go into and out of Guiyang) are not analyzed in depth at the current stage. As discussed in Section 2, one merit of urban industrial symbiosis is the optimization of the location of facilities and infrastructures, based on an optimized regional material and energy flow network. In this way, the regional supply chain can be improved from a broad viewpoint. A multi-regional input–output model (MRIO) is a powerful tool for investigating the impacts related to the trans-boundary flows. In our next stage of research, MRIO of the effects of urban industrial symbiosis on regional metabolism will be considered.
7. Conclusions and Implications
By optimizing the flow of resources and energy in the closed loop, the urban industrial symbiosis is recognized as a practical way of accelerating regional metabolism. On the other hand, its low-carbon benefits are rarely shown in China. In order to better reflect the policy enlightenment of the “post-Paris era”, this article innovatively studied the role of urban industrial symbiosis in Guiyang, a typical industrial city in China, in the relief of urban CFP. A hybrid approach integrating a process-based inventory analysis and an input–output analysis (IOA) was developed to analyze urban CFPs and tested in the case study. The results emphasized urban industrial symbiosis, which can provide additional CFP mitigation effects by improving the closed loop of the life cycle in terms of industrial solid waste exchange, recycling in the traditional way, the utilization of municipal solid waste, and waste heat utilization. Compared with the BAU2012 scenario, there was a reduction of over one million tons of CO emissions/year, accounting for over 3% of the total urban CFPs. The analytical results provided essential perspectives on the function of the urban industrial symbiosis in accelerating the transition towards urban sustainability. Research limitations and future concerns were also addressed to forward future research on urban industrial symbiosis in order to help to optimize the regional supply chain.
Finally, critical policy implications are raised and discussed based on the results and discussions:
- (1)
- Generalizing urban industrial symbiosis: it enables the optimization of the supply chain and the relationship of industries and areas, except for rural areas, by improving the life-cycle closing loops, hence offering an effective and efficient pathway for urban transition. The local stakeholders are encouraged to apply urban industrial symbiosis to regional planning. The academic field and local decision makers are urged to abandon the traditional sense of removing industries or end-of-pipe pollution control, and to make an effort to foster system innovation.
- (2)
- To support the generalization of urban industrial symbiosis, efficient technologies are the basis. National circular technologies and product inventories and standards, technical guidance for the planning of industrial parks while considering symbiosis, as well as quality standards for the input material as guidance for waste generators are all encouraged to be established and/or enhanced.
- (3)
- Carbon footprint analysis provides a powerful policy tool for dealing with emissions-related issues. However, it must be considered that the premise of CFP is still challenging, partly because of the lack of reliable city data. Therefore, the construction of related databases, e.g., a multi-regional input–output dataset and an urban-level inventory dataset, are highly recommended so as to provide a fundamental basis for CFPs such as the development of decision support tools.
Author Contributions
L.H. conceived of the idea of the research, made the structure, supervised this research work and provided guidance. J.H. conducted the data collection and wrote the text. All authors have read and agreed to the published version of the manuscript.
Funding
This research was supported by joint project funded by National Science Foundation, China (NSFC), and the Dutch Research Council (NWO): ‘Towards Inclusive Circular Economy: Transnational Network for Wise-waste Cities (IWWCs)’ (NSFC-NWO, NSFC project number: 72061137071; NWO project number: 482.19.608).
Institutional Review Board Statement
Not applicable.
Informed Consent Statement
Not applicable.
Data Availability Statement
Not applicable.
Acknowledgments
The authors of this study are grateful to the following projects for their support: NWO project of “Smart Industrial Parks (SIPs) in China: Towards Joint Design and Institutionalization” (No. 467-14-003) and the project of Climate KIC: International Intelligence and Business Development Network on Circular Economy Business Opportunities with China (int-CEB) from the European side.
Conflicts of Interest
The authors declare no no conflict of interest.
Abbreviations
The following abbreviations are used in this manuscript:
| CFP | Carbon footprint |
| UIS | Urban industrial symbiosis |
| DMC | Domestic material consumption |
| GDP | Cross domestic production |
| CNY | Chinese yuan |
| kt | Thousand ton |
| GJ | Giga joules |
| tce | Ton coal equivalent. 1 tce = 29.27 GJ |
References
- Rodić, L.; Wilson, C.D. Resolving Governance Issues to Achieve Priority Sustainable Development Goals Related to Solid Waste Management in Developing Countries. Sustainability 2017, 9, 404. [Google Scholar] [CrossRef] [Green Version]
- Kharrazi, A.; Qin, H.; Zhang, Y. Urban Big Data and Sustainable Development Goals: Challenges and Opportunities. Sustainability 2016, 8, 1293. [Google Scholar] [CrossRef] [Green Version]
- Dong, L.; Fujita, T.; Dai, M.; Geng, Y.; Ren, J.; Fujii, M.; Wang, Y.; Ohnishi, S. Towards a preventative eco-industrial development: An industrial and urban symbiosis case in one typical industrial city in China. J. Clean. Prod. 2016, 114, 387–400. [Google Scholar] [CrossRef]
- Mattoni, B.; Gugliermetti, F.; Bisegna, F. A multilevel method to assess and design the renovation and integration of Smart Cities. Sustain. Cities Soc. 2015, 15, 105–119. [Google Scholar] [CrossRef]
- Dong, L.; Fujita, T.; Zhang, H.; Dai, M.; Fujii, M.; Ohnishi, S.; Geng, Y.; Liu, Z. Promoting low-carbon city through industrial symbiosis: A case in China by applying HPIMO model. Energy Policy 2013, 61, 864–873. [Google Scholar] [CrossRef]
- Dong, J.F.; Wang, Q.; Deng, C.; Wang, X.M.; Zhang, X.L. How to Move China toward a Green-Energy Economy: From a Sector Perspective. Sustainability 2016, 8, 337. [Google Scholar] [CrossRef] [Green Version]
- Wells, P.; Zapata, C. Renewable Eco-industrial Development. J. Ind. Ecol. 2012, 16, 665–668. [Google Scholar] [CrossRef]
- Taddeo, R.; Simboli, A.; Ioppolo, G.; Morgante, A. Industrial Symbiosis, Networking and Innovation: The Potential Role of Innovation Poles. Sustainability 2017, 9, 169. [Google Scholar] [CrossRef] [Green Version]
- Shi, L.; Yu, B. Eco-Industrial Parks from Strategic Niches to Development Mainstream: The Cases of China. Sustainability 2014, 6, 6325–6331. [Google Scholar] [CrossRef] [Green Version]
- Dong, L.; Gu, F.; Fujita, T.; Hayashi, Y.; Gao, J. Uncovering opportunity of low-carbon city promotion with industrial system innovation: Case study on industrial symbiosis projects in China. Energy Policy 2014, 65, 388–397. [Google Scholar] [CrossRef]
- Berkel, R.V.; Fujita, T.; Hashimoto, S.; Fujii, M. Quantitative Assessment of Urban and Industrial Symbiosis in Kawasaki, Japan. Environ. Sci. Technol. 2009, 43, 1271–1281. [Google Scholar] [CrossRef] [PubMed] [Green Version]
- Dong, L.; Dai, M.; Liang, H.; Zhang, N.; Mancheri, N.; Ren, J.; Dou, Y.; Hu, M. Material flows and resource productivity in China, South Korea and Japan from 1970 to 2008: A transitional perspective. J. Clean. Prod. 2017, 141, 1164–1177. [Google Scholar] [CrossRef]
- Lombardi, D.R.; Laybourn, P. Redefining Industrial Symbiosis. J. Ind. Ecol. 2012, 16, 28–37. [Google Scholar] [CrossRef]
- De Jong, M.; Joss, S.; Schraven, D.; Zhan, C.; Weijnen, M. Sustainable–smart–resilient–low carbon–eco–knowledge cities; making sense of a multitude of concepts promoting sustainable urbanization. J. Clean. Prod. 2015, 109, 25–38. [Google Scholar] [CrossRef] [Green Version]
- Dong, H.; Fujita, T.; Geng, Y.; Dong, L.; Ohnishi, S.; Sun, L.; Dou, Y.; Fujii, M. A review on eco-city evaluation methods and highlights for integration. Ecol. Indic. 2016, 60, 1184–1191. [Google Scholar] [CrossRef]
- Geng, Y.; Fujita, T.; Park, H.S.; Chiu, A.S.; Huisingh, D. Recent progress on innovative eco-industrial development. J. Clean. Prod. 2015, 114, 1–10. [Google Scholar] [CrossRef]
- Ghisellini, P.; Cialani, C.; Ulgiati, S. A review on circular economy: The expected transition to a balanced interplay of environmental and economic systems. J. Clean. Prod. 2015, 114, 11–32. [Google Scholar] [CrossRef]
- Dong, L.; Liang, H. Spatial analysis on China’s regional air pollutants and CO2 emissions: Emission pattern and regional disparity. Atmos. Environ. 2014, 92, 280–291. [Google Scholar] [CrossRef]
- Chen, M.; Liu, W.; Tao, X. Evolution and assessment on China’s urbanization 1960–2010: Under-urbanization or over-urbanization? Habitat Int. 2013, 38, 25–33. [Google Scholar] [CrossRef]
- NBS. China Statistical Yearbook; National Bureau of Statistics: Beijing, China, 2011.
- UN. World Urbanization Prospects the 2011 Revision; United Nations, Department of Economic and Social Affairs, Population Division: New York, NY, USA, 2012. [Google Scholar]
- Courtonne, J.Y.; Alapetite, J.; Longaretti, P.Y.; Dupré, D.; Prados, E. Downscaling material flow analysis: The case of the cereal supply chain in France. Ecol. Econ. 2015, 118, 67–80. [Google Scholar] [CrossRef]
- Yu, C.; Dijkema, G.P.; De Jong, M.; Shi, H. From an eco-industrial park towards an eco-city: A case study in Suzhou, China. J. Clean. Prod. 2015, 102, 264–274. [Google Scholar] [CrossRef]
- Dong, L.; Zhang, H.; Fujita, T.; Ohnishi, S.; Li, H.; Fujii, M.; Dong, H. Environmental and economic gains of industrial symbiosis for Chinese iron/steel industry: Kawasaki’s experience and practice in Liuzhou and Jinan. J. Clean. Prod. 2013, 59, 226–238. [Google Scholar] [CrossRef]
- Takiguchi, H.; Takemoto, K. Japanese 3R Policies Based on Material Flow Analysis. J. Ind. Ecol. 2008, 12, 792–798. [Google Scholar] [CrossRef]
- Oh, D.-S.; Kim, K.-B.; Jeong, S.-Y. Eco-Industrial Park Design: A Daedeok Technovalley case study. Habitat Int. 2005, 29, 269–284. [Google Scholar] [CrossRef]
- Krausmann, F.; Gingrich, S.; Nourbakhch-Sabet, R. The Metabolic Transition in Japan. J. Ind. Ecol. 2011, 15, 877–892. [Google Scholar] [CrossRef]
- Van Berkel, R.; Fujita, T.; Hashimoto, S.; Geng, Y. Industrial and urban symbiosis in Japan: Analysis of the Eco-Town program 1997–2006. J. Environ. Manag. 2009, 90, 1544–1556. [Google Scholar] [CrossRef]
- Park, H.-S.; Won, J.-Y. Ulsan Eco-industrial Park: Challenges and Opportunities. J. Ind. Ecol. 2007, 11, 11–13. [Google Scholar] [CrossRef]
- Hertwich, E.G.; Peters, G.P. Carbon Footprint of Nations: A Global, Trade-Linked Analysis. Environ. Sci. Technol. 2009, 43, 6414–6420. [Google Scholar] [CrossRef] [Green Version]
- Leontief, W. Quantitative input-output relations in the economic system. Rev. Econ. Stat. 1936, 18, 105–125. [Google Scholar] [CrossRef] [Green Version]
- Giljum, S.; Hubacek, K. Conceptual foundations and applications of physical input-output tables. In Handbook of Input-Output Economics in Industrial Ecology; Springer: Dordrecht, The Netherlands, 2009; pp. 1–75. [Google Scholar]
- Liu, Z.; Guan, D.; Wei, W.; Davis, S.J.; Ciais, P.; Bai, J.; Peng, S.; Zhang, Q.; Hubacek, K.; Marland, G.; et al. Reduced carbon emission estimates from fossil fuel combustion and cement production in China. Nature 2015, 524, 335–338. [Google Scholar] [CrossRef] [Green Version]
- Baldini, C.; Gardoni, D.; Guarino, M. A critical review of the recent evolution of Life Cycle Assessment applied to milk production. J. Clean. Prod. 2017, 140 Pt 2, 421–435. [Google Scholar] [CrossRef]
- Heinonen, J.; Jalas, M.; Juntunen, J.K.; Ala-Mantila, S.; Junnila, S. Situated lifestyles: I. How lifestyles change along with the level of urbanization and what the greenhouse gas implications are—A study of Finland. Environ. Res. Lett. 2013, 8, 025003. [Google Scholar] [CrossRef]
- Liu, H.; Wang, X.; Yang, J.; Zhou, X.; Liu, Y. The ecological footprint evaluation of low carbon campuses based on life cycle assessment: A case study of Tianjin, China. J. Clean. Prod. 2017, 144, 266–278. [Google Scholar] [CrossRef]
- Mi, Z.; Zhang, Y.; Guan, D.; Shan, Y.; Liu, Z.; Cong, R.; Yuan, X.C.; Wei, Y.M. Consumption-based emission accounting for Chinese cities. Appl. Energy 2016, 184, 1073–1081. [Google Scholar] [CrossRef] [Green Version]
- Wiedmann, T. Editorial: Carbon Footprint and Input-Output Analysis—An Introduction. Econ. Syst. Res. 2009, 21, 175–186. [Google Scholar] [CrossRef]
Publisher’s Note: MDPI stays neutral with regard to jurisdictional claims in published maps and institutional affiliations. |
© 2022 by the authors. Licensee MDPI, Basel, Switzerland. This article is an open access article distributed under the terms and conditions of the Creative Commons Attribution (CC BY) license (https://creativecommons.org/licenses/by/4.0/).