
Incentives for Innovation in Robotics and Automated Construction: Based on a Tripartite Evolutionary Game Analysis


Abstract
:1. Introduction
2. Literature Review
2.1. RAAC in the Construction Industry
- Architectural prefabrication of RAAC. This system originated from the successful industrialization of the Japanese automobile manufacturing industry utilizing robots [29]. This category includes the manufacture of sizeable prefabricated building elements. This method takes inspiration from the experience of other manufacturing industries that have applied RAAC to automate the industrialization of prefabricated building components using an automated approach. Various building materials (concrete, wood, steel, stone, etc.) and low-level components are transformed into high-level building components through a highly mechanized, automated, and robot-supported chain [24]. This category also contains additive manufacturing technologies (3D printing technologies) [30]. Perkins et al. [31] review many cases involving the application of 3D printing technology to the construction industry, discussing its application prospects, challenges, and advantages. Although limited by technology and material costs, additive manufacturing technology is still in the experimental stage [32]; it has progressed and can now be used to print large-scale components [33,34].
- On-site automation. This type aims to achieve construction site automation—a controlled, automated environment established at an RAAC field factory [35]. Using single-task construction robots (usually industrial robotic arms) as automation tools, it can perform single repetitive tasks, or multiple machines can collaborate on complex assignments [36]. This method is popular with research institutes and architectural universities because of its flexibility, allowing it to be combined with other traditional construction methods. Wagner et al. [12,37,38] propose combining on-site automated systems with traditional timber frame construction, showing future robotic timber frame construction possibilities. Reichenbach et al. [8] review the current practice in integrating on-site automation and concrete production. Goessens et al. [39] present the feasibility of using industrial robotic arms to build masonry structures. Moreover, some Japanese, Korean, and German scholars focus on on-site automation for building demolition [40].
- Remotely operated equipment and exoskeletons. This category addresses extreme and hazardous environmental problems that traditional construction methods cannot handle. It includes ground, air, sea, and even space robots [41] that can be remotely operated or require command. These robots have been developed for sampling studies in extreme environments, exploring and monitoring hazardous areas, and navigating and collecting data at construction sites, and have automated excavation and transportation [42,43,44,45]. This category also includes augmentation devices arch construction workers wear that can enhance workers’ abilities, mitigate the effects of the environment on workers, help them lift heavy objects, and reduce fatigue to improve recognized productivity [46].
2.2. Evolutionary Game Theory
2.3. Literature Gaps
3. Methodology
3.1. Description of the Gamer
- Government: The government can promote the development of RAAC technology by developing programs, regulations, and incentives [57]. RAAC has been proven to increase productivity and promote sustainability in the construction industry [3,58]. The government aims to motivate construction companies to adopt RAAC through incentive policies. However, excessive subsidies will cause substantial financial pressure, and the government should consider the strength of the incentive policy.
- Construction Company: The ultimate pursuit of construction companies is financial gain [54]. RAAC is considered the key to increasing productivity and sustainability in the construction industry. However, higher R&D costs and investment risks have discouraged most construction companies from innovating. Construction companies doubt whether they can get sufficient compensation from government incentives and recruit relevant expertise from universities.
- Public Universities: For Chinese public universities, subject assessment scores (SAS) are an essential indicator. According to [59], the quality of talent training is the crucial factor affecting SAS. The quality of graduates depends on the employment situation and the evaluation of employers. Public universities need to weigh the ability of government fiscal policies to compensate them for the additional cost of training RAAC talent and the need of construction companies for RAAC talent.
3.2. Basic Assumptions
- Assumption I
- 2.
- Assumption II
- 3.
- Assumption III
3.3. Establishment of Payoff Model
4. Evolutionary Stability Analysis
4.1. Asymptotic Stability Analysis
- Asymptotic stability analysis of government:Let , , and , .When , . This means that the government will get the same benefits regardless of whether it chooses the incentive strategy or not. When > y*, the probability of construction companies choosing innovative strategies exceeds y*. To satisfy . . is the evolutionary stable point, which indicates that the probability that the government will choose the incentive is increasing, and eventually, the government will determine the incentive strategy. When y < y*, the probability of construction companies choosing innovative strategies are more diminutive than y*. To protect , is the evolutionary stable point. The probability that the government will choose to incentivize continues to decline and eventually choose not to incentivize.Let , , and , .When , . This means that the government’s strategy will not change over time. When > *, the probability that public universities will choose the strategy to develop RAAC talent exceeds *. To safeguard , is the evolutionary stable point, suggesting that the government’s probability of choosing incentives improves; ultimately, the government will choose an incentive strategy. When *, the probability of construction companies choosing strategies for RAAC talent cultivation is less than *. To guarantee , is the evolutionary stable point. The government’s probability of choosing to incentivize continues to decline and eventually chooses not to incentivize.
- Asymptotic stability analysis of construction companies:Let , , and ,When , . This means that the benefits of RAAC innovation for construction companies are the same as the benefits of maintaining traditional construction methods. When > , the probability that the government choosing to incentivize exceeds . To secure , is the evolutionary stable point. It shows that the strategy of construction companies will change from non-innovation to innovation and eventually get a stable innovation strategy. When , the probability that the government choosing to incentivize is less than . To guarantee , is the evolutionary stable point. The probability that an architectural firm will choose to innovate continues to decline and eventually choose not to innovate.Let , , and ,When , . This means that the benefits of RAAC innovation for construction companies are the same as the benefits of maintaining traditional construction methods. When > , the probability that public universities will choose the strategy to develop RAAC talent exceeds . To secure , is the evolutionary stable point. This suggests that the strategy of construction companies will shift from non-innovation to innovation and eventually acquire a stable innovation strategy. When , the probability of construction companies choosing strategies for RAAC talent cultivation is less than . To ensure that , is the evolutionary stable point. Construction companies will move from innovation to non-innovation and ultimately choose not to innovate.
- Asymptotic stability analysis of public universities:Let , , and ,When , . The probability that a public university chooses to train RAAC talent does not change over time. When > , the probability that the government choosing to incentivize exceeds . To secure , is the evolutionary stable point. This indicates that the strategy of public universities is gradually tending to cultivate RAAC talents and eventually acquire a stable cultivation strategy. When , the probability that the government choosing to incentivize is less than . To guarantee , is the evolutionary stable point. The probability that public universities choose to train RAAC talent continues to decline and eventually decide not to cultivate.
4.2. Analysis of the Trend of Tripartite Evolutionary Game
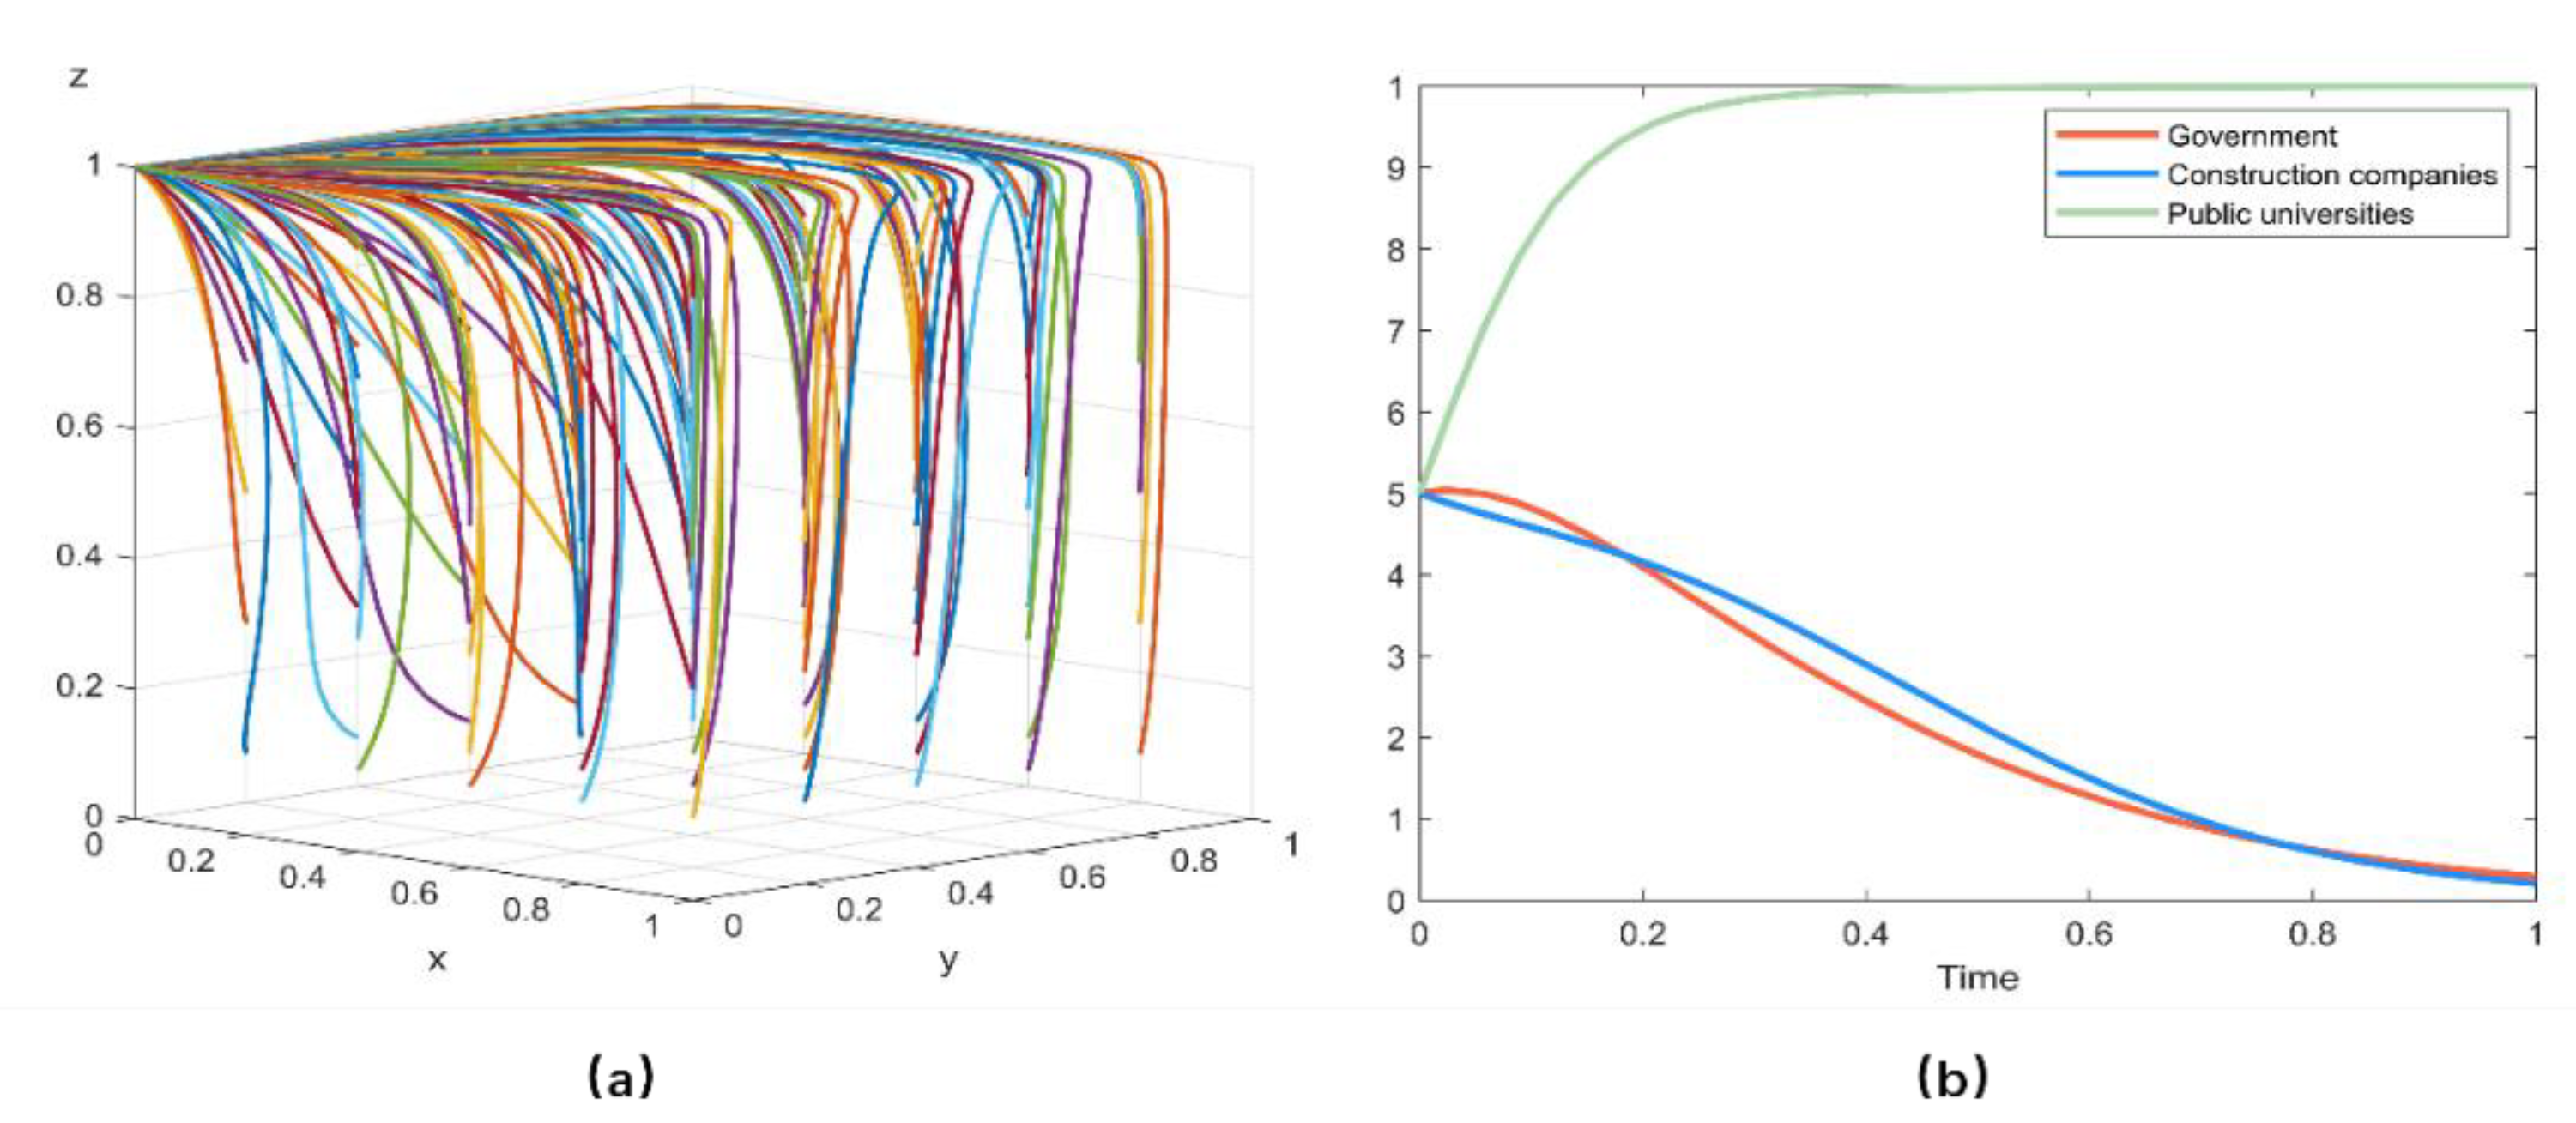
- When ; ; . The eigenvalues of the Jacobi matrix corresponding to the evolutionary stability point are negative, indicating that is ESS. This represents when the cost of the government subsidies for public schools is larger than the fines the government imposes on construction companies for non-innovation; the cost of RAAC innovation for construction companies is greater than the sum of the economic and the reputational and innovation cost savings from acquiring RAAC talent from universities; and the cost of RAAC talent cultivation for public universities is less than the academic evaluation benefits of public universities for RAAC talent cultivation. (No incentive, Non-innovative, Cultivation) is ESS.
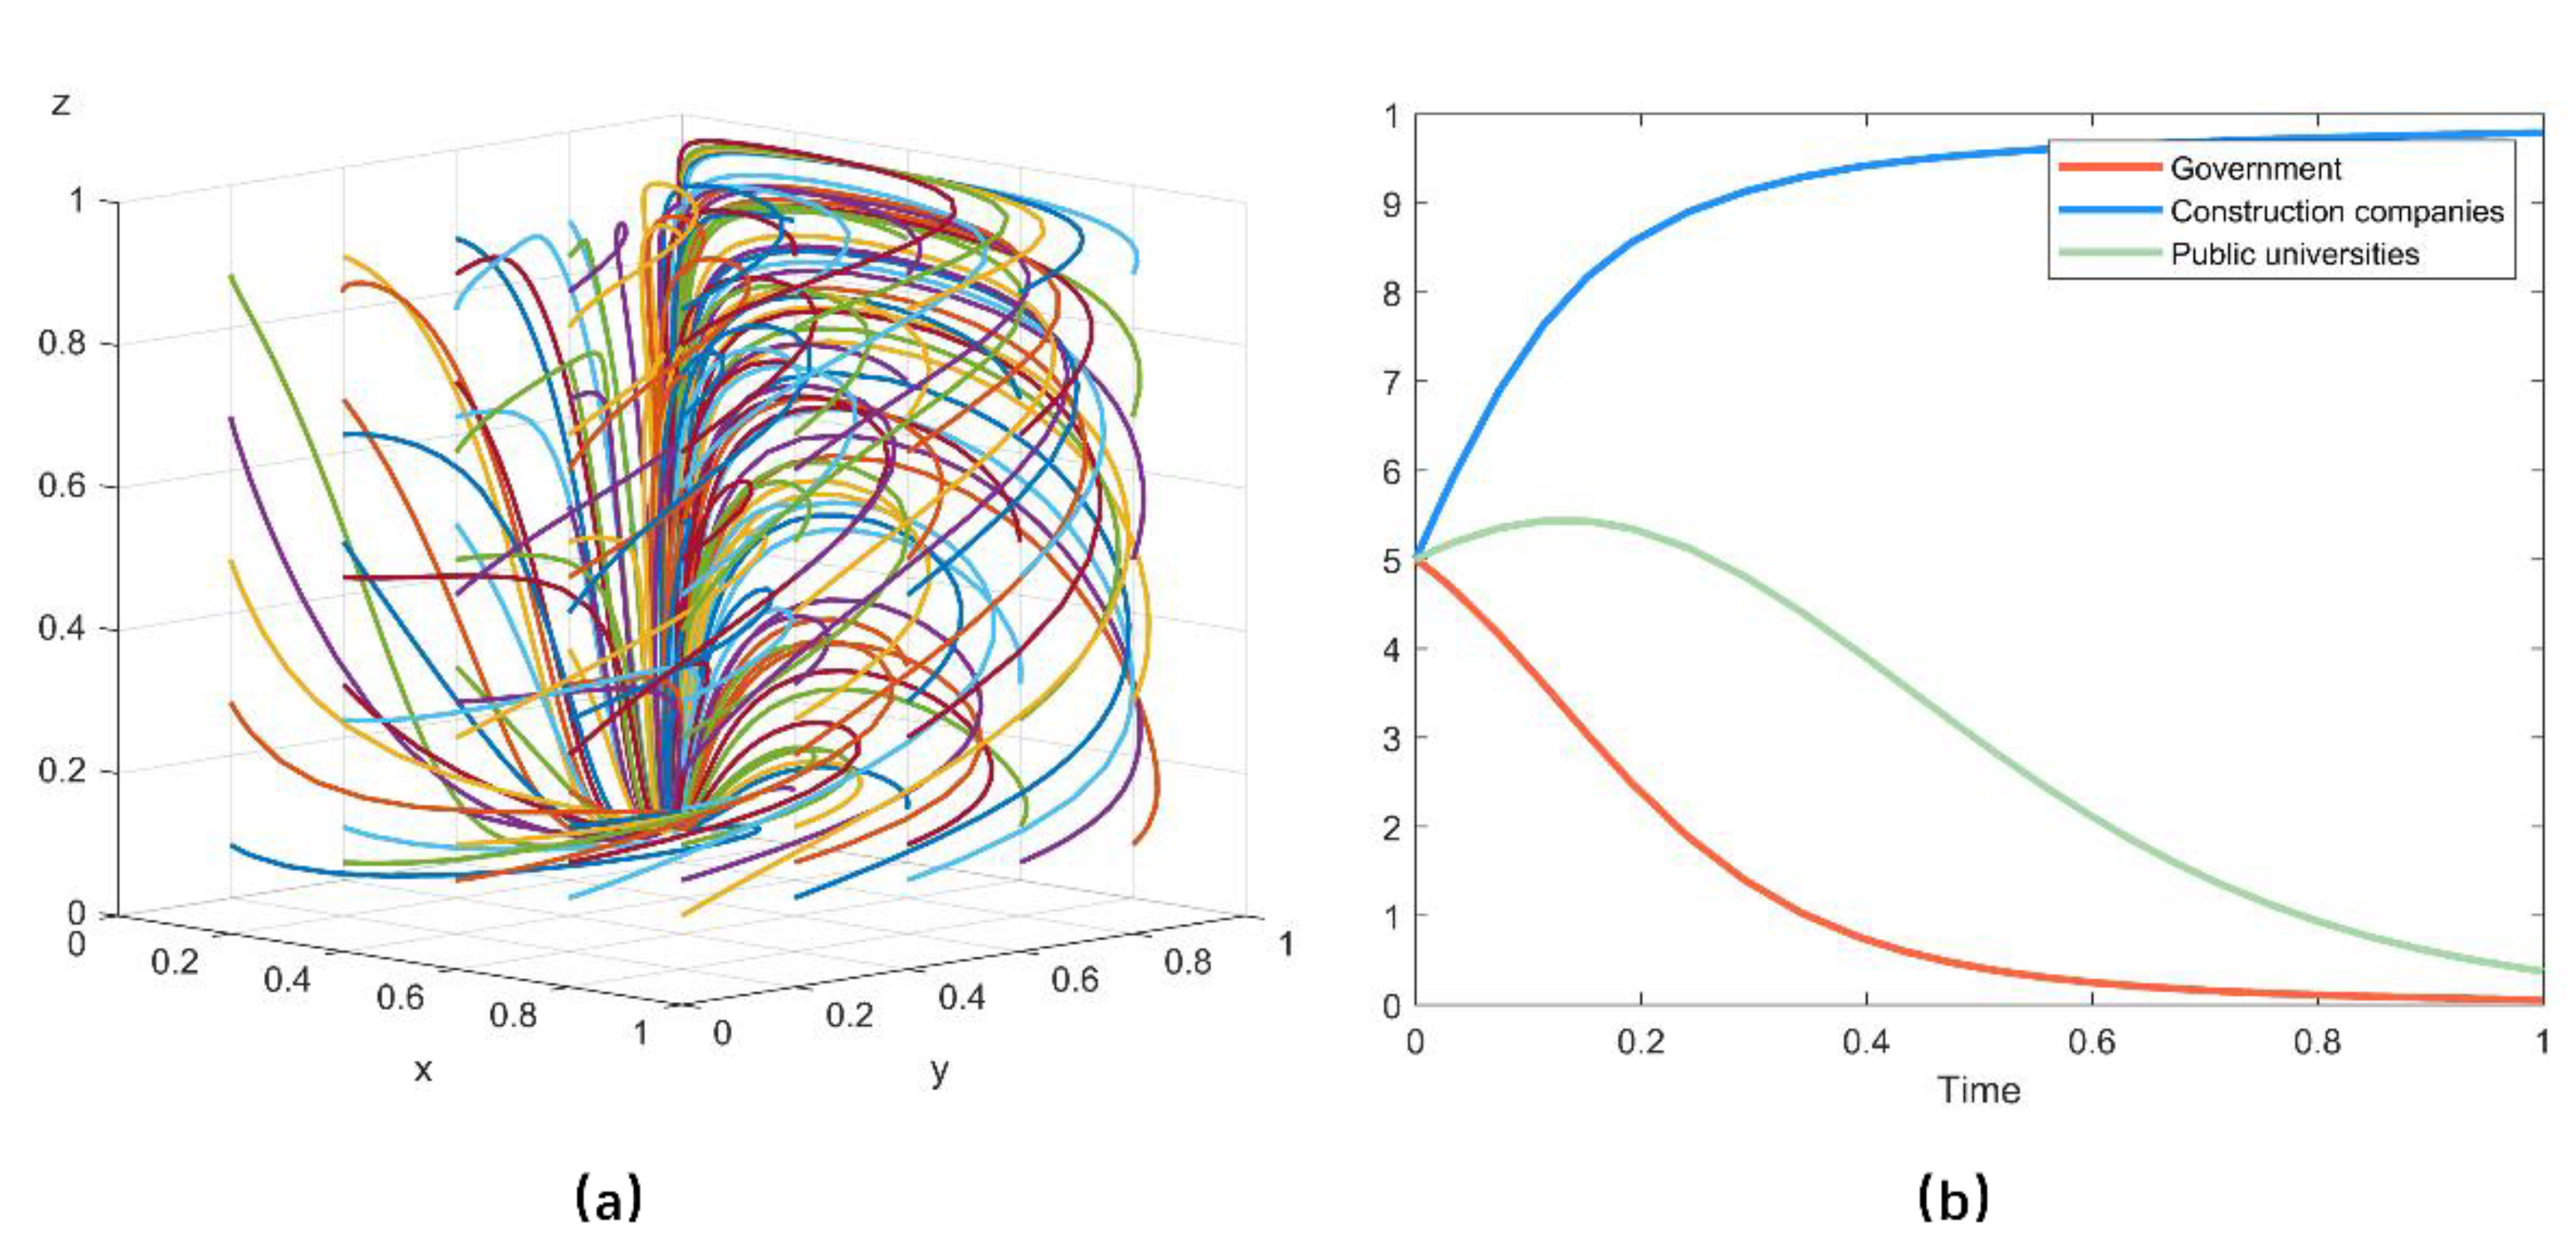
- When ; ; . The eigenvalues of the Jacobi matrix corresponding to the evolutionary stability point are negative, indicating that is ESS. This stands for when satisfying the extra benefits by the entire construction industry chain when construction companies innovate with RAAC when the government incentives is less than the sum of the extra benefits by the entire construction industry chain when construction companies innovate with RAAC when the government does not incentivize and the subsidies that construction companies gain from the government for RAAC innovation; the cost of innovation for construction companies is less than the sum of the economic benefits increment for construction companies when they innovate and the reputation and the brand value of construction companies for innovation; and the cost of RAAC talent cultivation for public universities is more than the academic evaluation benefits of public universities. (No incentive, Innovative, Non-cultivation) is ESS.
- When ; . The eigenvalues of the Jacobi matrix corresponding to the evolutionary stability point are negative, indicating that is ESS. This means that the cost of innovation for construction companies is greater than the sum of the government’s subsidies and the economic benefits and brand value gained from innovation versus the penalty for not innovating. (Incentive, Non-innovative, Non-cultivation) is ESS.
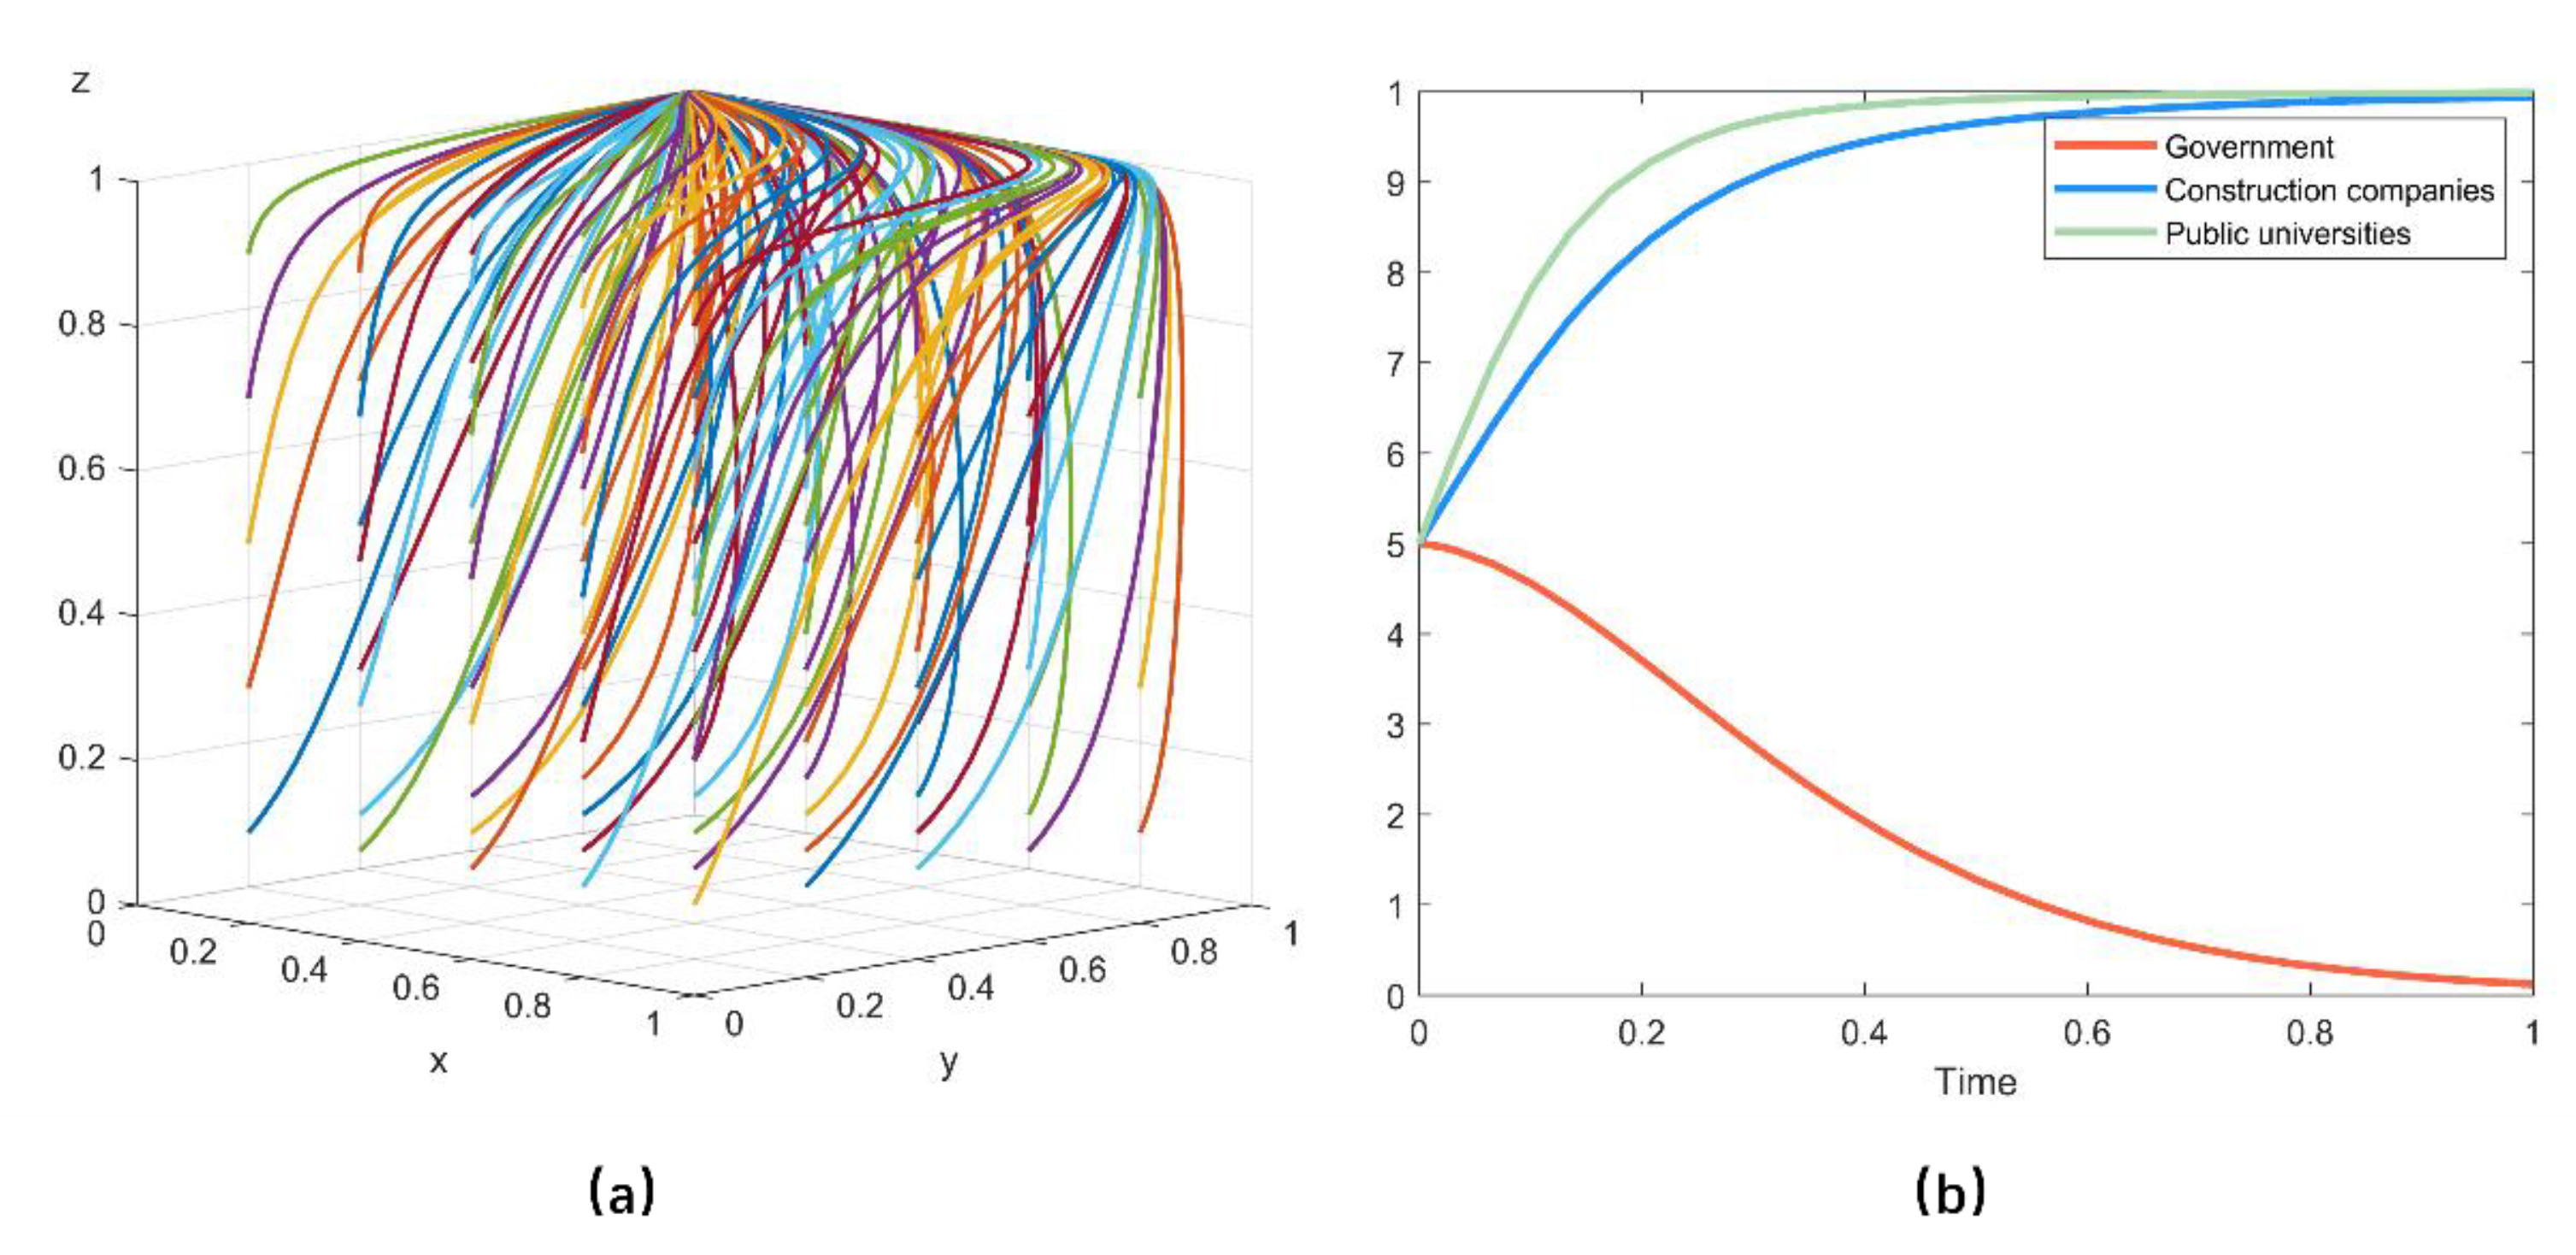
- When ; ; . The eigenvalues of the Jacobi matrix corresponding to the evolutionary stability point are negative, indicating that is ESS. This represents when satisfying the benefits from RAAC innovation with government incentives is less than the sum of the innovative government subsidies for construction companies and benefits from RAAC innovation without government incentives and government subsidies for universities; the RAAC innovation costs for construction companies is less than the sum of the innovation cost savings from acquiring RAAC talent from universities and economic and the reputational benefits for construction companies when they innovate; and the cost of RAAC talent cultivation for public universities is less than the academic evaluation benefits of public universities for RAAC talent cultivation. (No incentive, Innovative, Cultivation) is ESS.
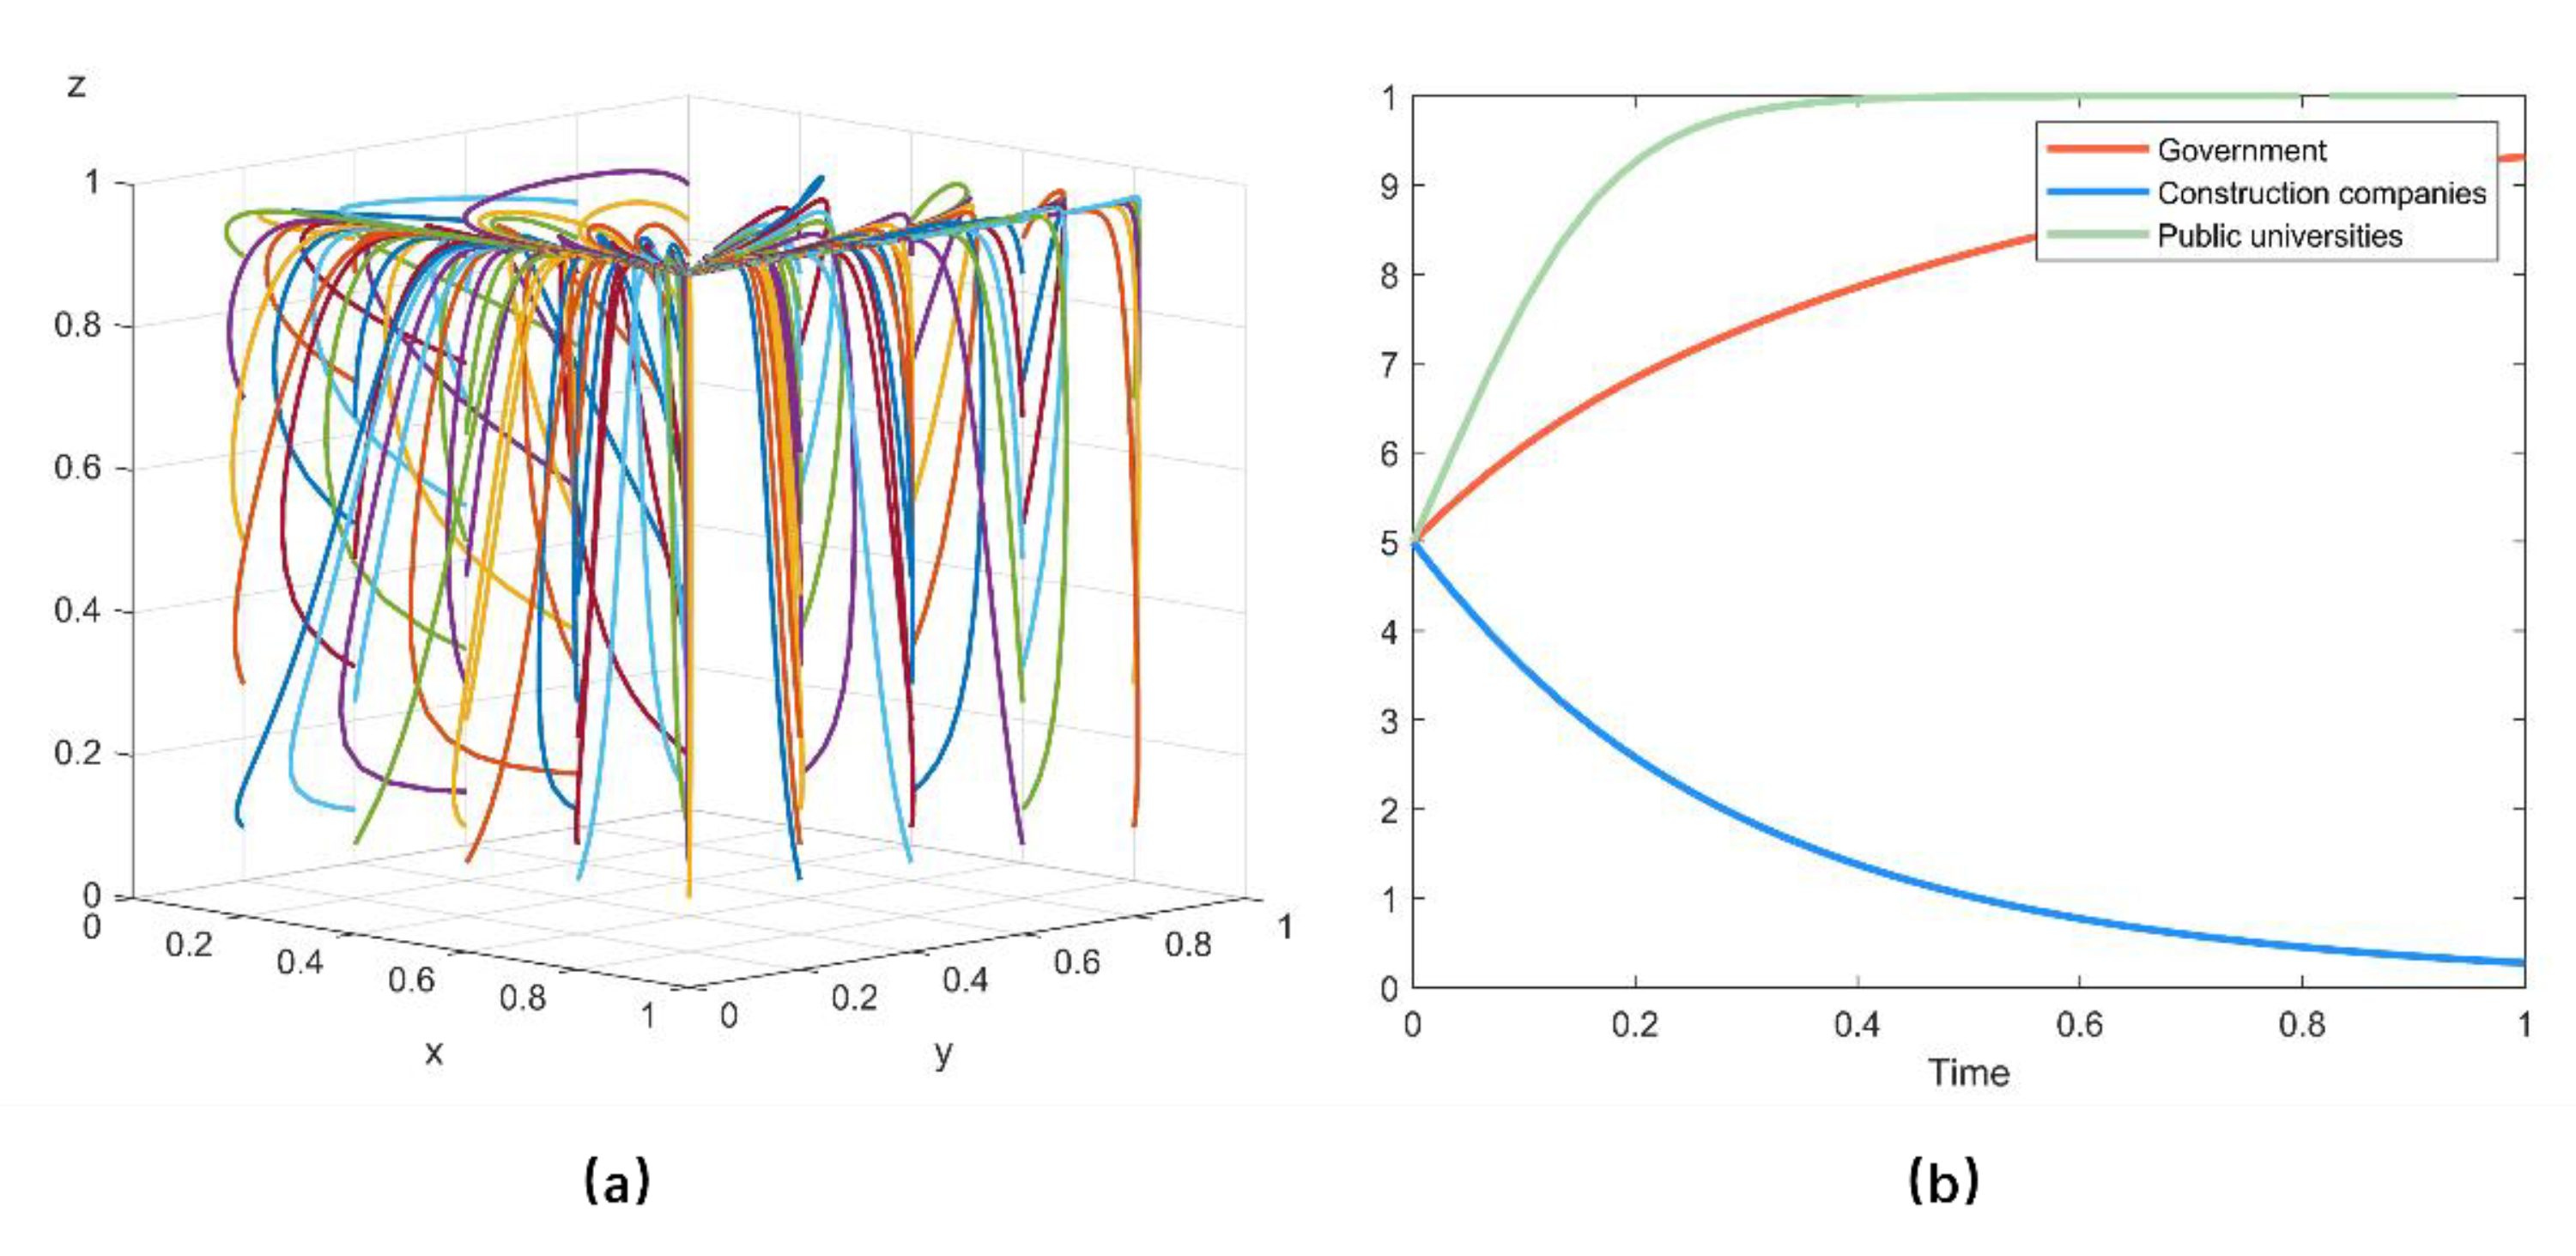
- When ; ; . The eigenvalues of the Jacobi matrix corresponding to the evolutionary stability point are negative, indicating that is ESS. This represents when meeting the government proceeds from fines for poor environmental performance due to non-innovation by construction companies is more than the government financial subsidies for public universities; the RAAC innovation costs for construction companies is greater than the sum of the government financial subsidies for construction companies and the innovation cost savings from acquiring RAAC talent from universities and the economic and the reputational benefits for construction companies when they innovate, and the government fines for non-innovation of construction companies; and the cost of developing talent at public universities is less than the sum of academic evaluation benefits of public universities and subsidies received by public universities from the government and academic evaluation penalties of public universities for RAAC talent cultivation. (Incentive, Non-innovative, Cultivation) is ESS.
- When ; ; . The eigenvalues of the Jacobi matrix corresponding to the evolutionary stability point are negative, indicating that is ESS. This represents when satisfying the benefits from RAAC innovation with government incentives is more than the sum of the government subsidies to construction companies and additional revenue generated by construction company innovation when government incentives are not available; the RAAC innovation costs for construction companies is less than the sum of the government fines for construction companies and the economic and the reputational benefits for construction companies from innovating and the government subsidies for construction companies; and the cost of the RAAC talent cultivation for public universities is higher than the sum of the government subsidies granted to universities and the academic evaluation benefits of public universities for RAAC talent cultivation and the academic evaluation penalties of public universities for RAAC talent cultivation. (Incentive, Innovative, Non-cultivation) is ESS.
- When ; ; . The eigenvalues of the Jacobi matrix corresponding to the evolutionary stability point are negative, indicating that is ESS. This represents when meeting the benefits from RAAC innovation with government incentives is more than the sum of the government subsidies to construction companies and universities and additional revenue generated by construction company innovation when government incentives are not available; the RAAC innovation costs for construction companies is lower than the sum of the government fines for construction companies and the economic and the reputational benefits for construction companies from innovating and the government subsidies for construction companies and the innovation cost savings from acquiring RAAC talent from universities; and the cost of the RAAC talent cultivation for public universities is lower than the sum of the government subsidies granted to universities and the academic evaluation benefits of public universities for RAAC talent cultivation and the academic evaluation penalties of public universities for RAAC talent cultivation. (Incentive, Innovative, Cultivation) is ESS.
5. Numerical Simulation
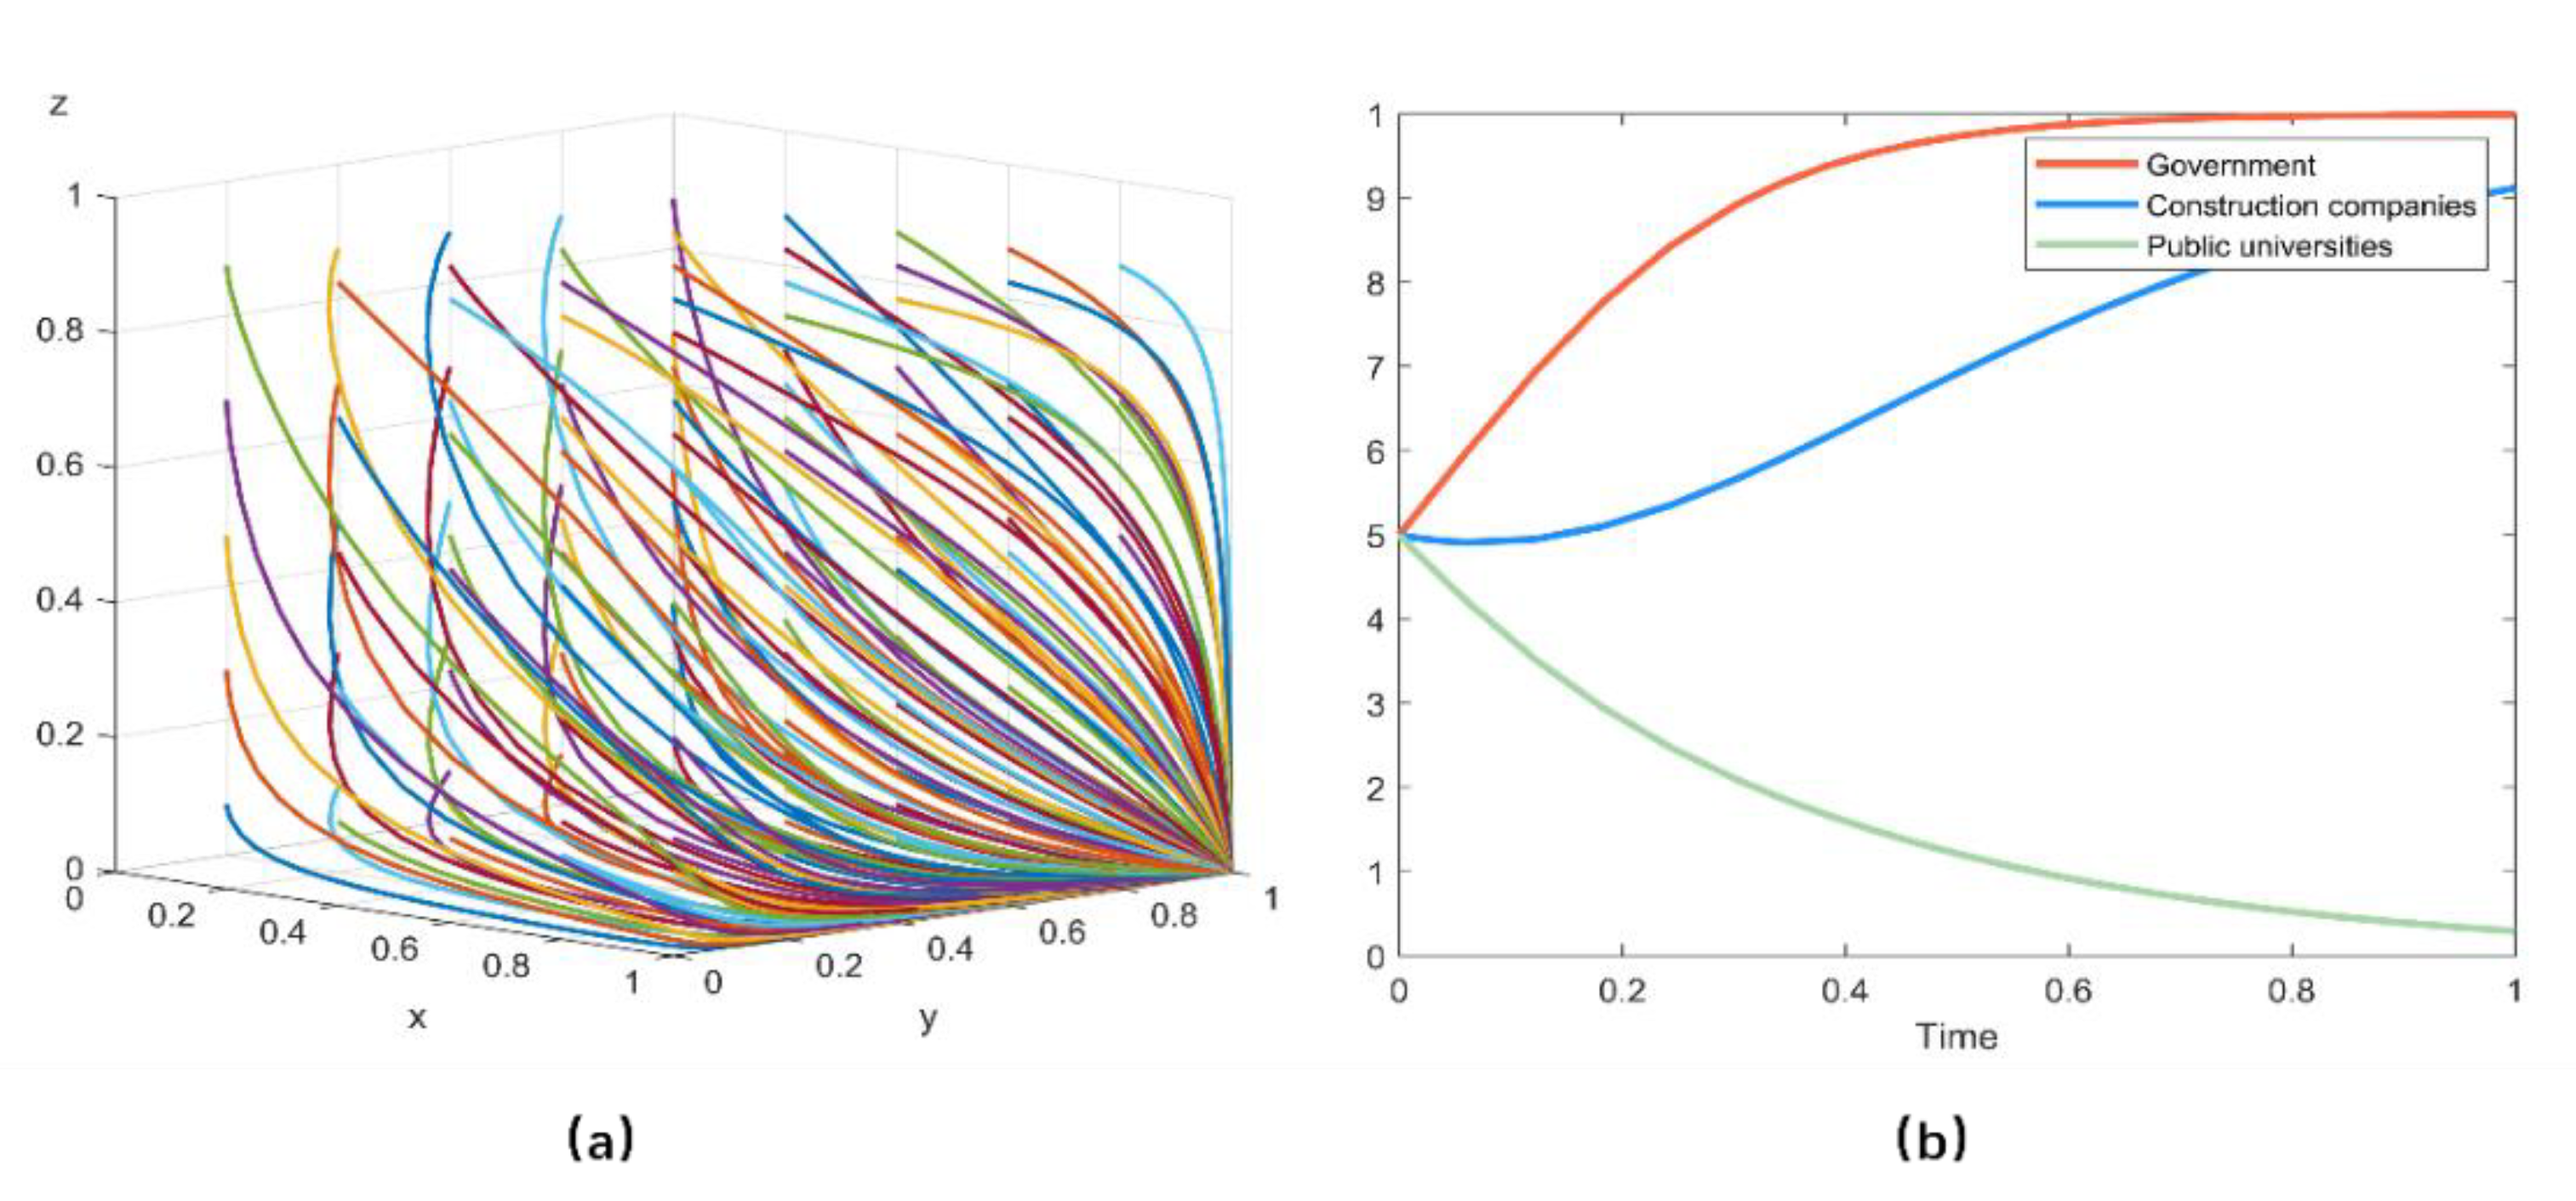
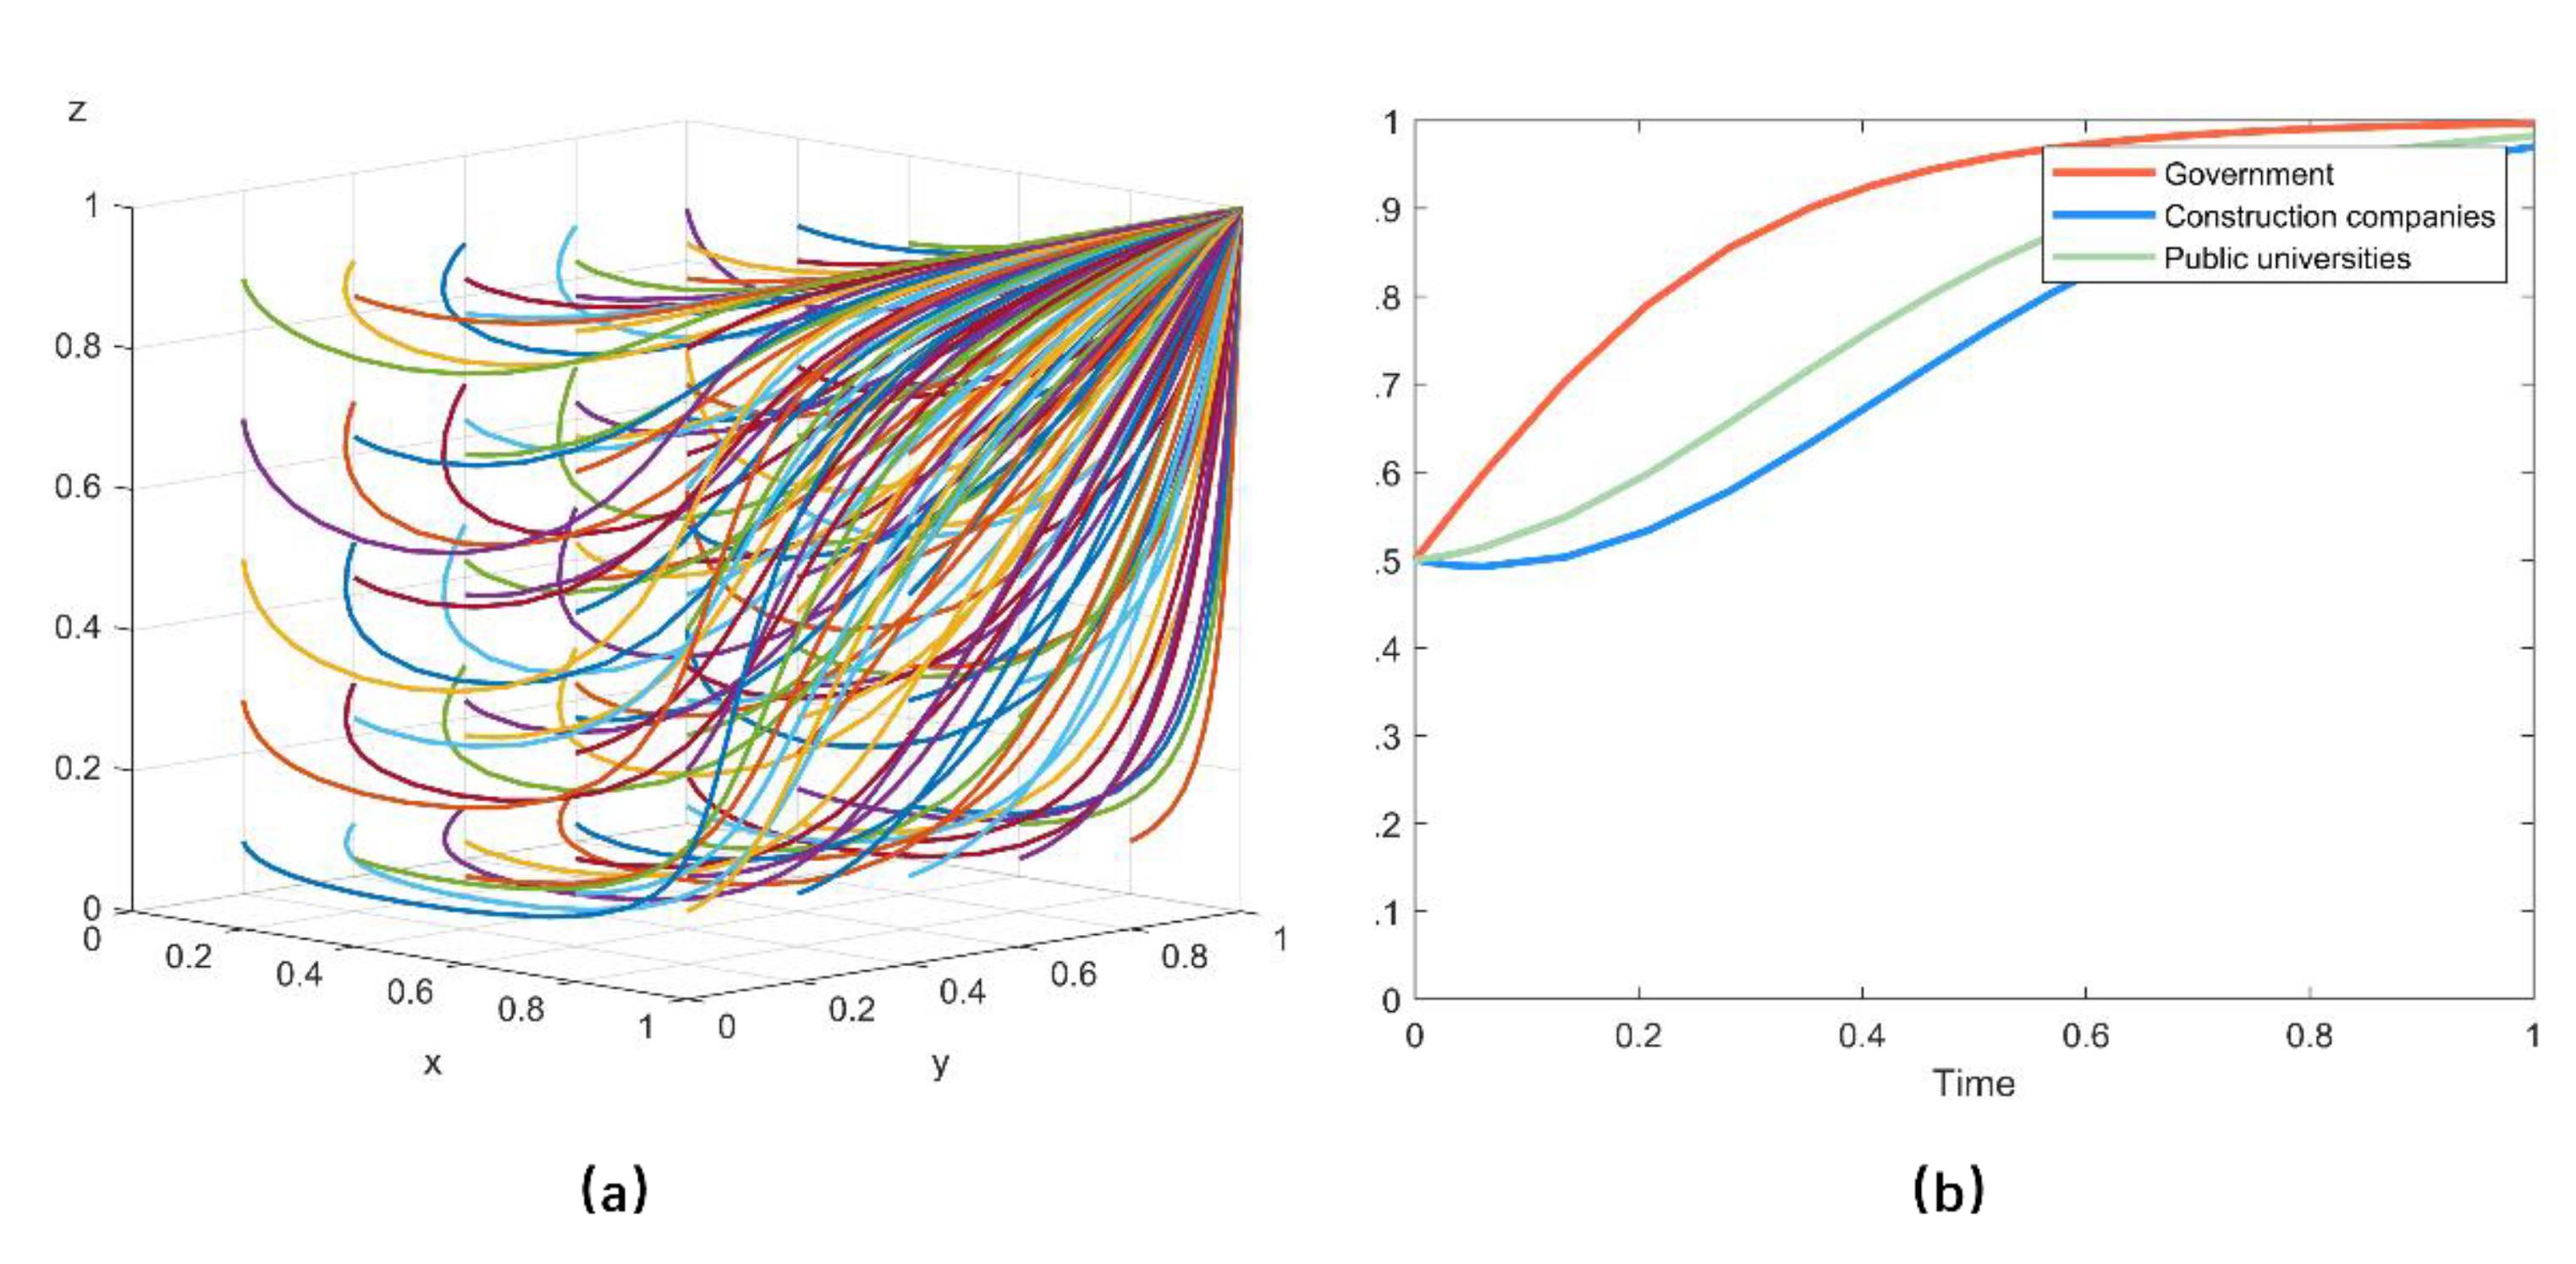
5.1. The Evolutionary Trajectory of ESS
- Assumption i
- Assumption ii
- Assumption iii
- Assumption iv
- Assumption v
- Assumption vi
- Assumption vii
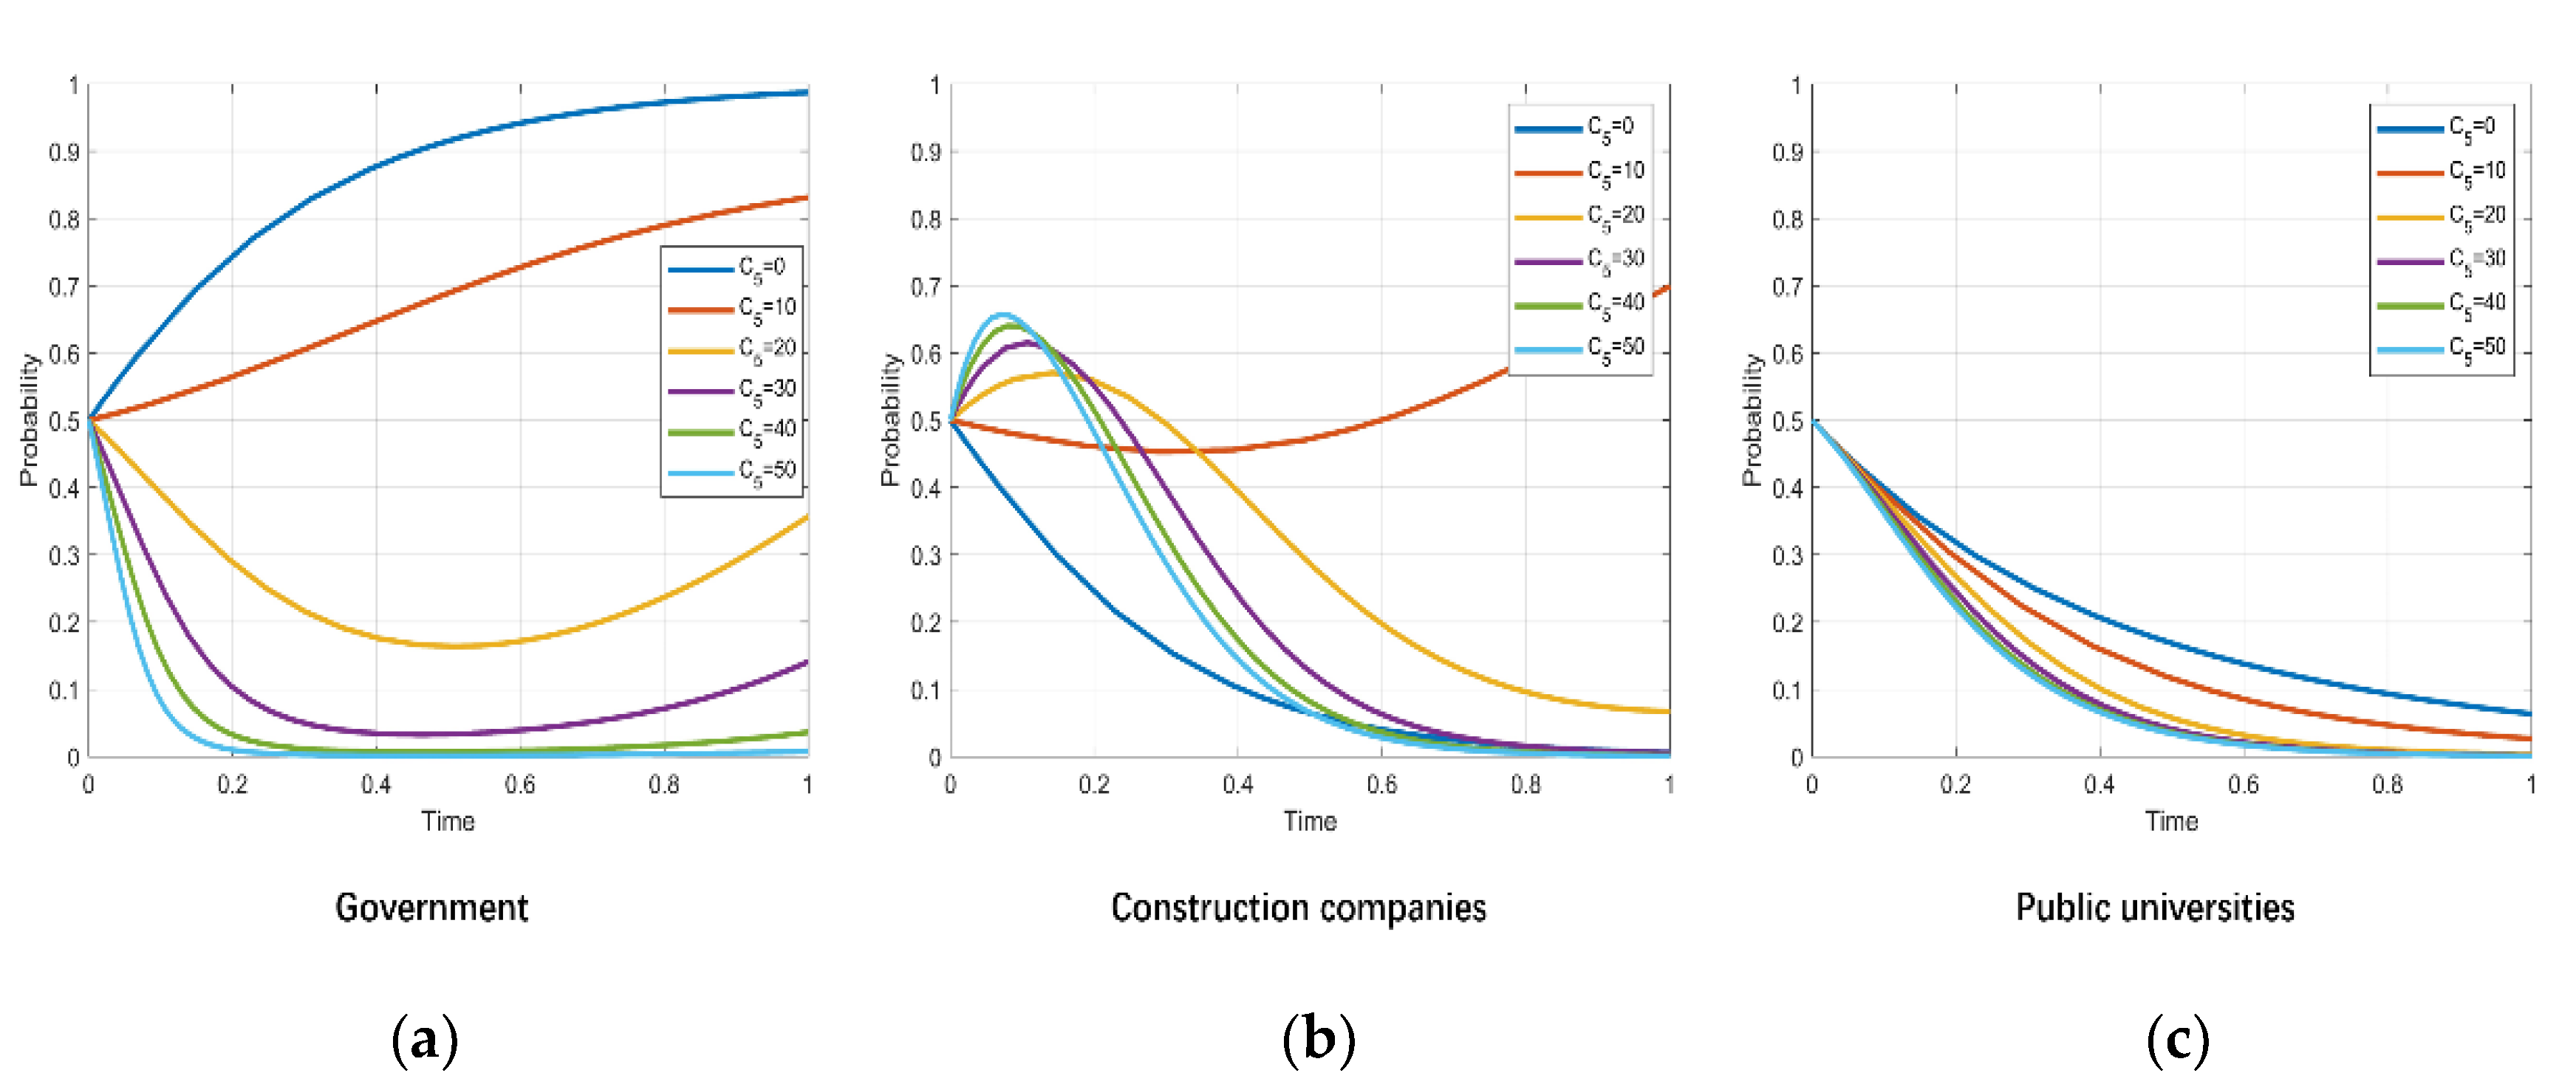
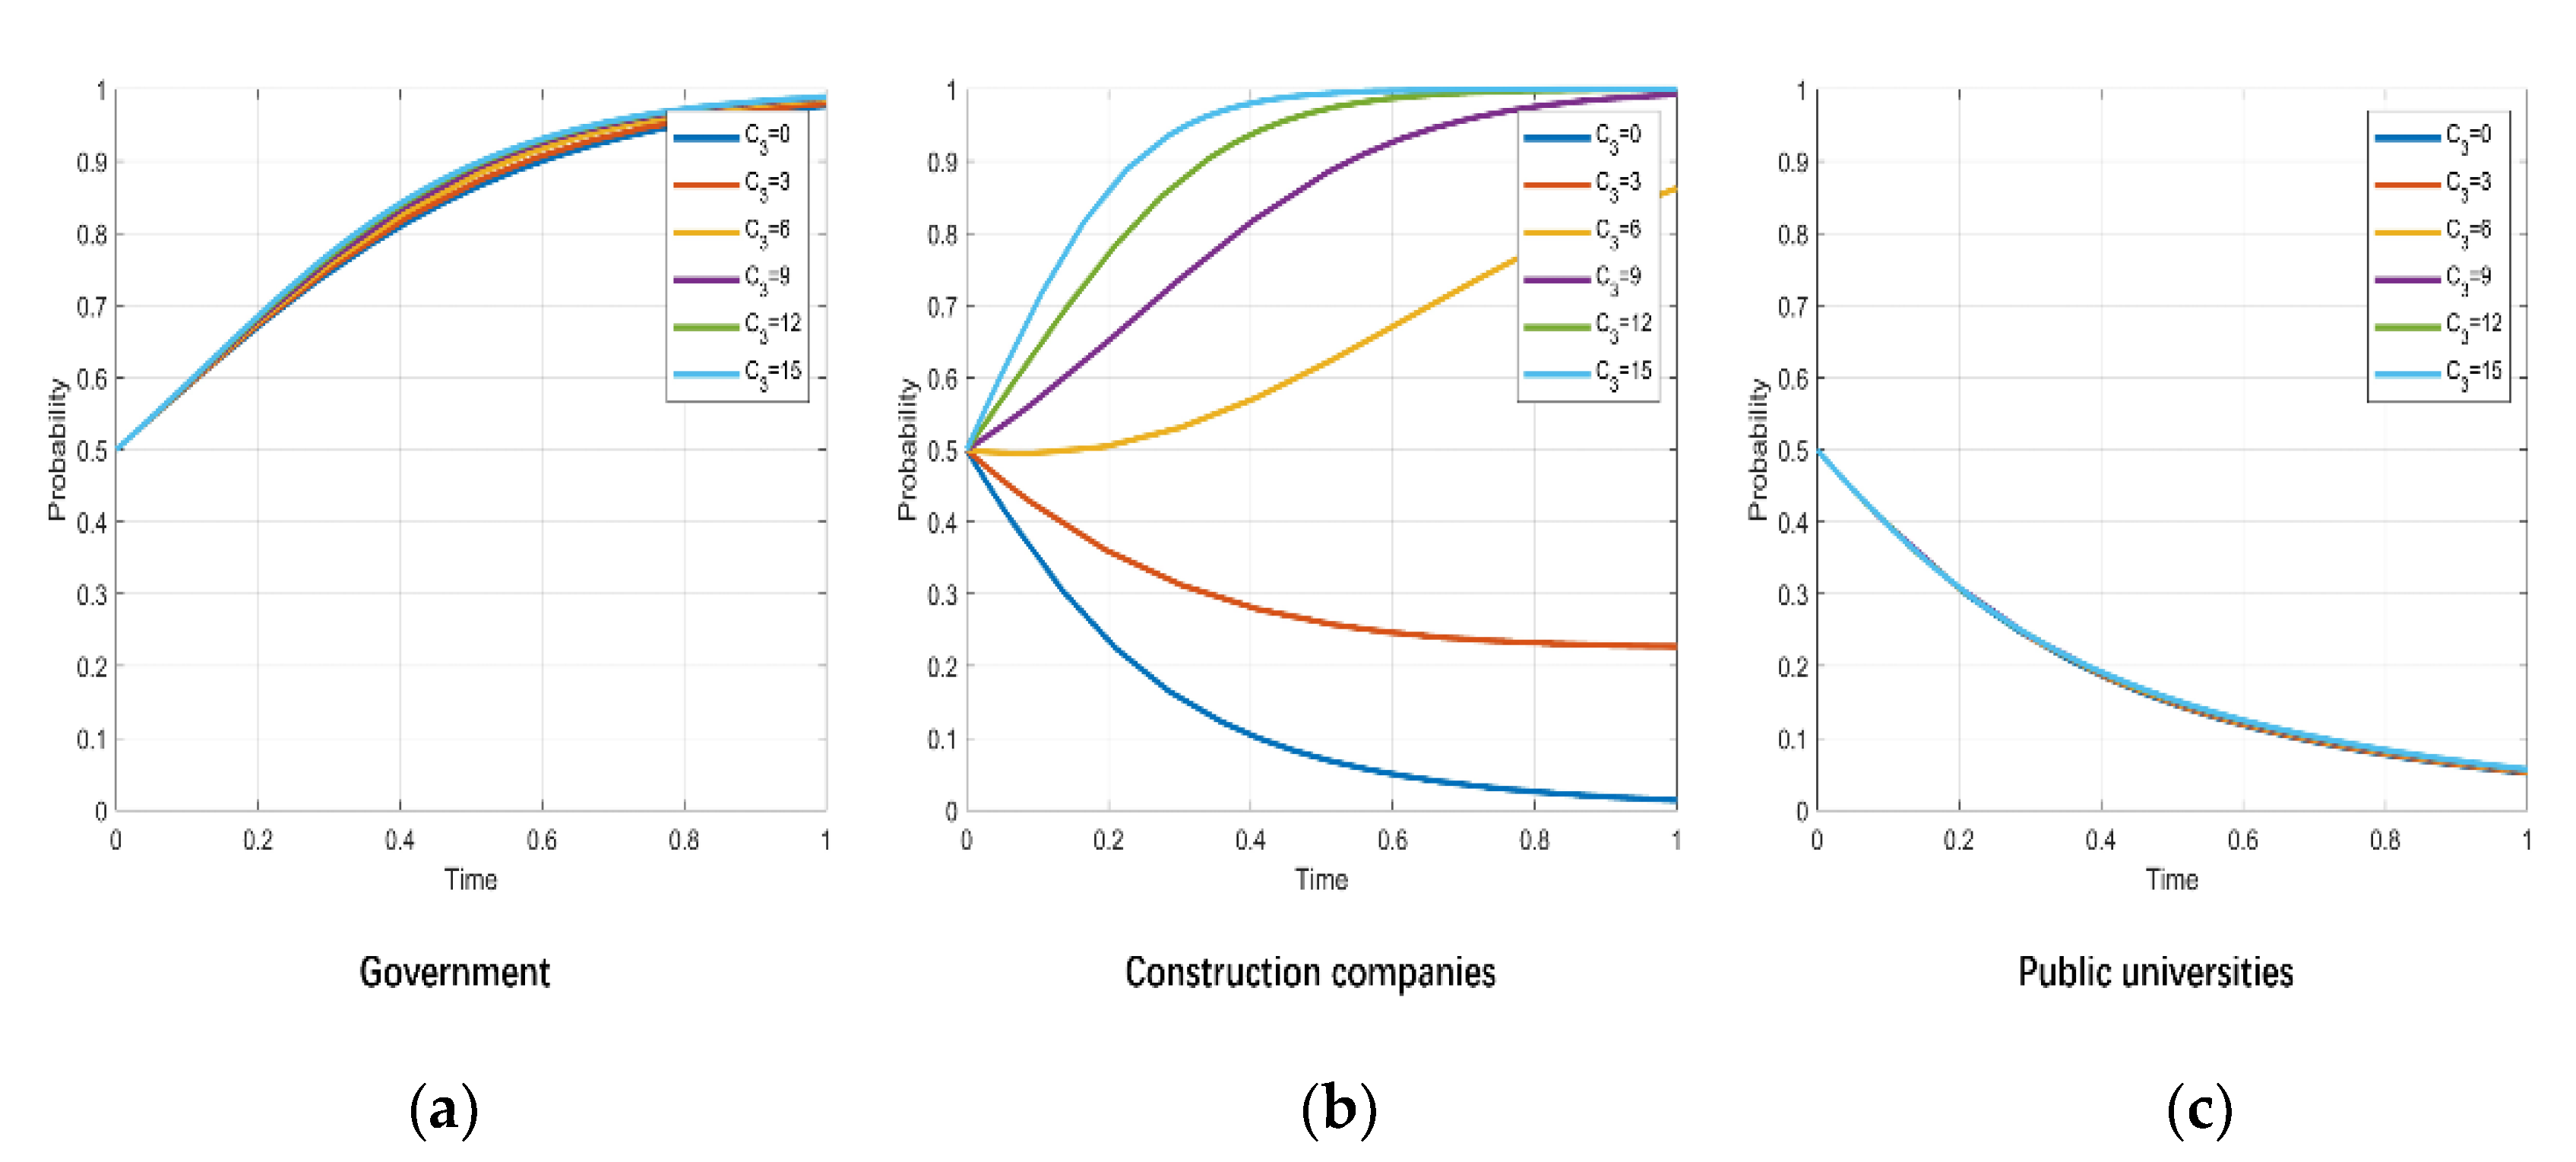
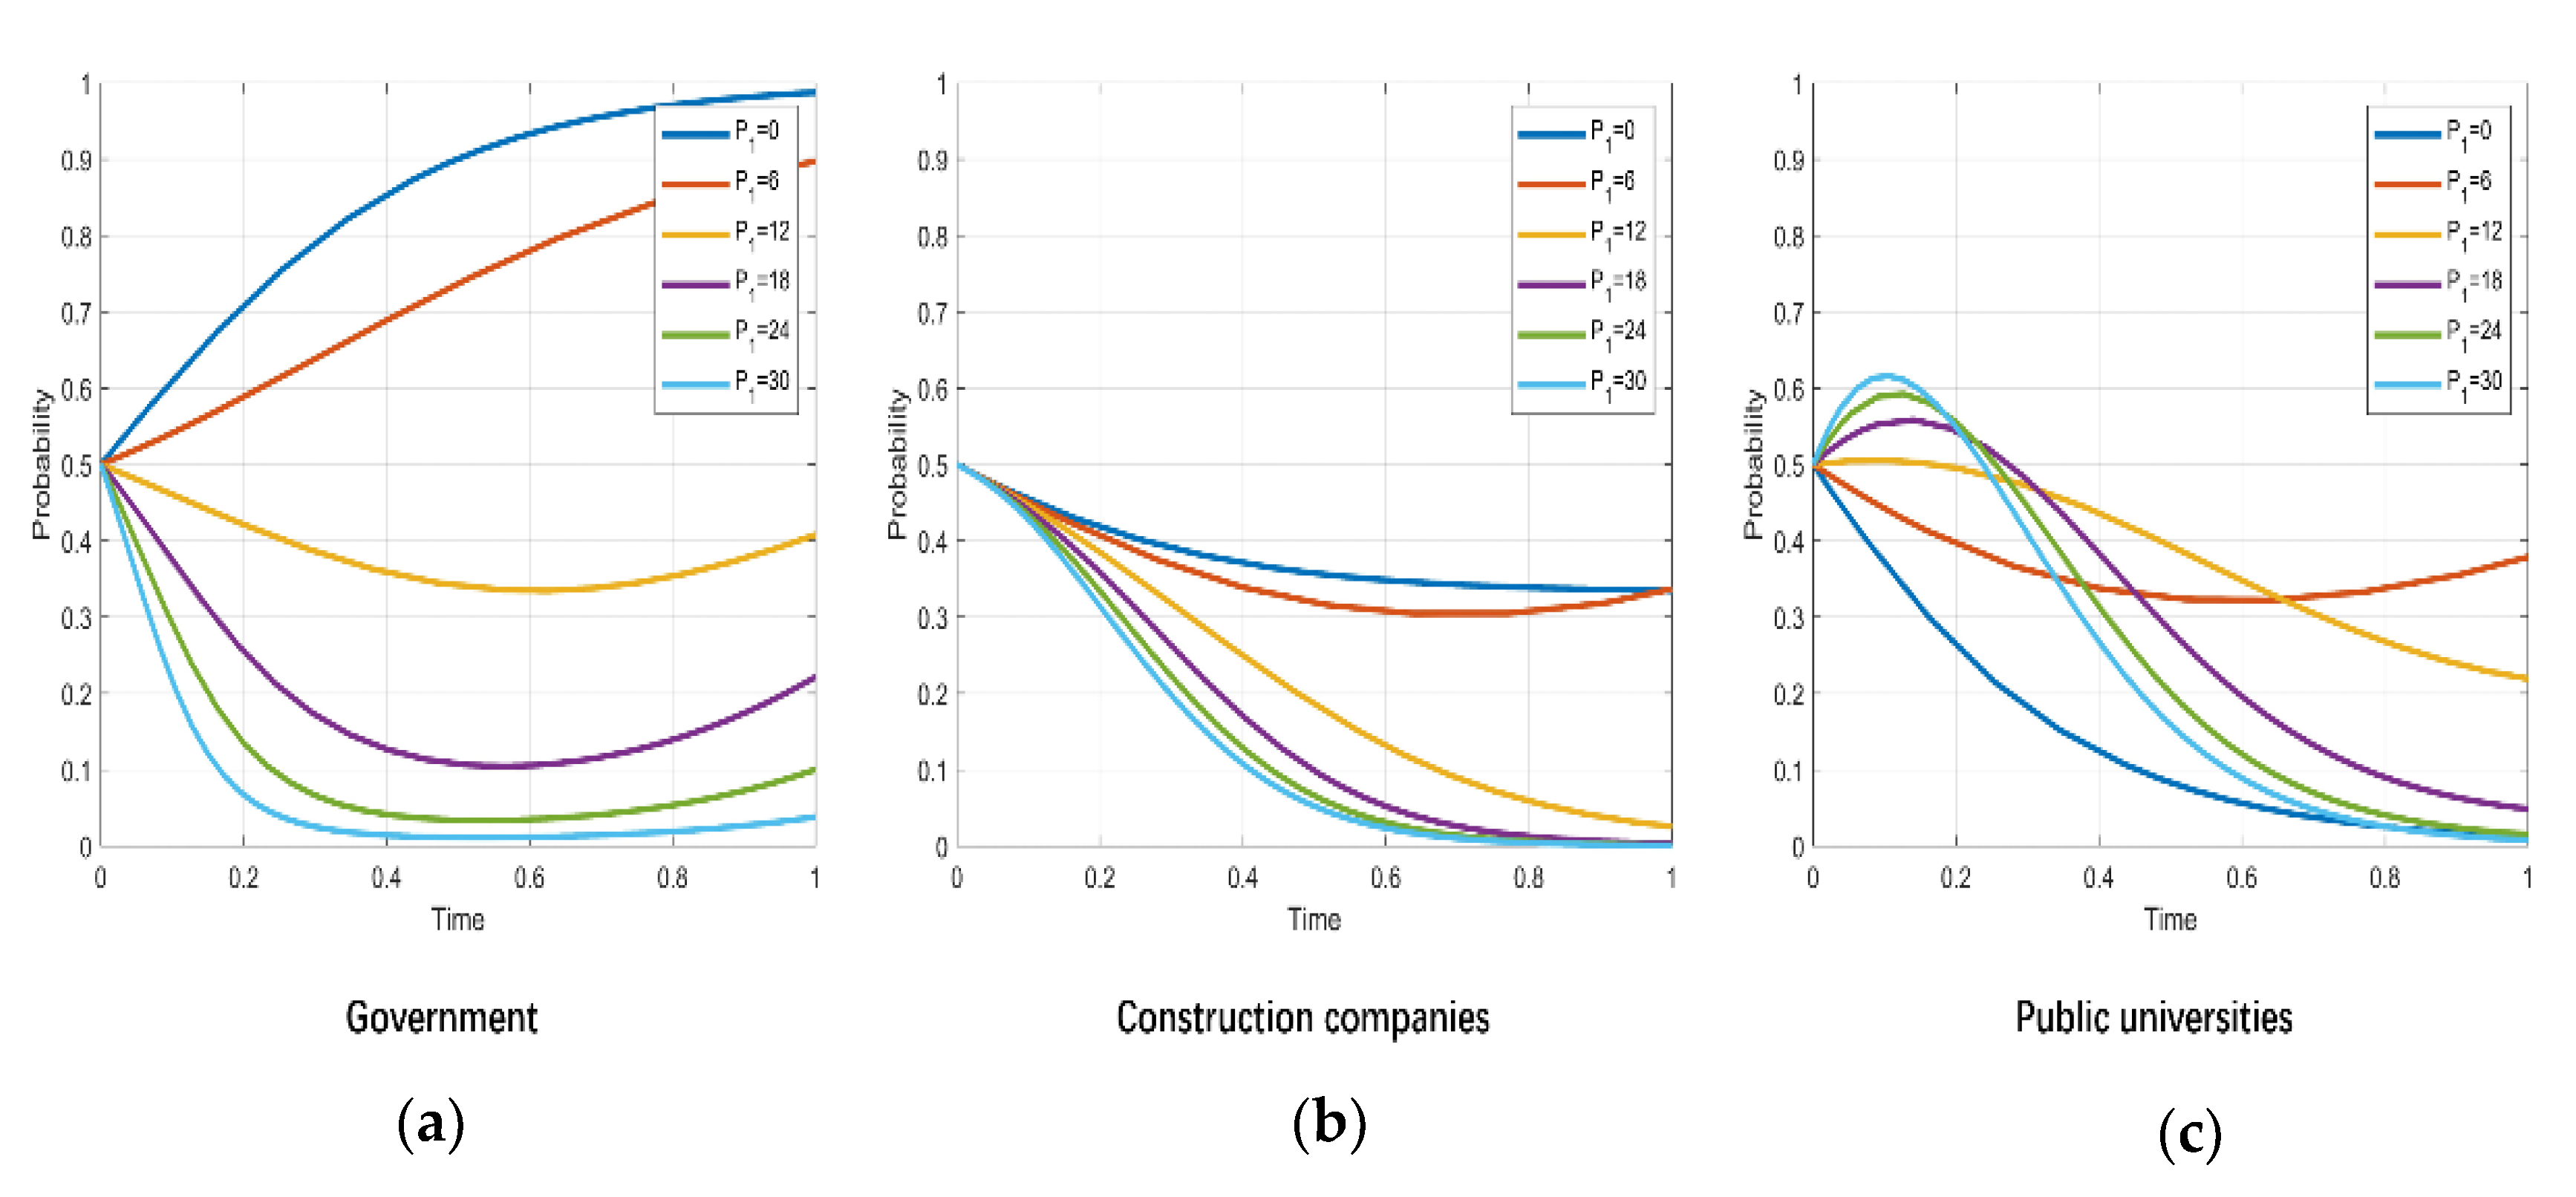
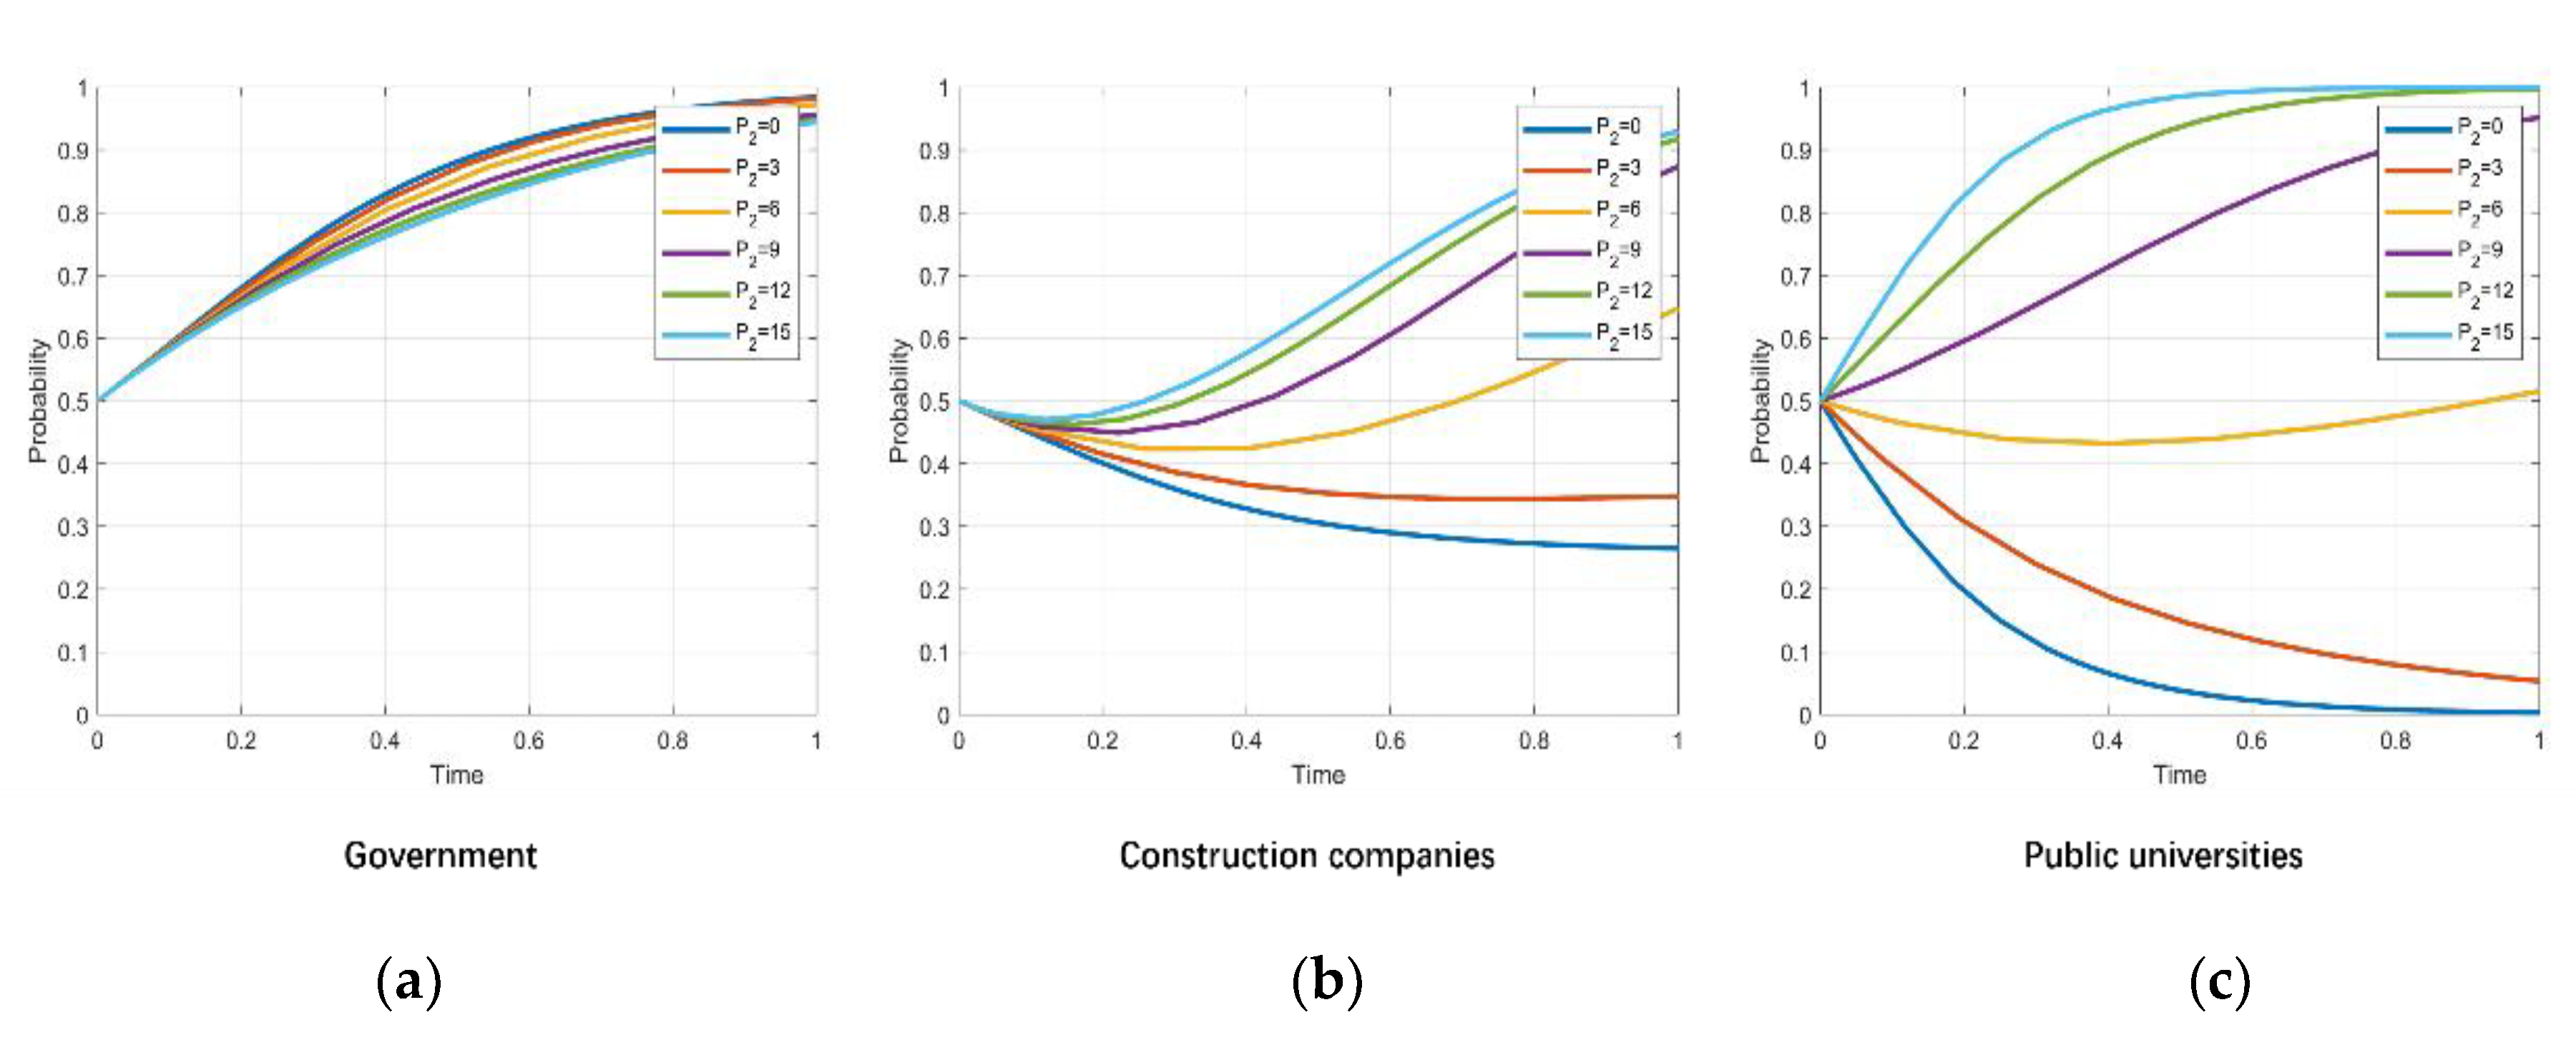
5.2. Impact of Incentive Policy on Evolutionary Results and Trajectories
- 1.
- The effect of
- 2.
- The effect of
- 3.
- The effect of
6. Discussion and Policy Implications
6.1. Comparison with Previous Studies and Working Hypotheses
6.2. Policy Implications
- Construction companies need to continuously improve their strength to meet the technical requirements of RAAC innovation, reduce the cost of innovation, and improve their risk degree capability. Public universities should establish a plan for RAAC talent training, gradually accumulate research technologies and talents in related directions, and reduce the cost of talent training.
- Government can promote the development and implementation of RAAC technology by implementing policies that create compound incentives and developing a policy mix of financial and reputational incentives. On the one hand, the government needs to introduce a system to regulate industry standards, and on the other hand, the government needs to provide some financial support to help construction companies to relieve their worries about the high cost of RAAC innovations. At the same time, the government can increase the brand benefits of RAAC innovation for construction companies by organizing exhibitions and granting “progress awards” to active companies. For construction companies that refuse to innovate, the government needs to fine them for poor environmental performance resulting from their construction methods.
- At present, China’s construction companies are reluctant to innovate due to insufficient investment in R&D in the construction field [68]. The government needs to provide research funding support to public universities for the purchase of relevant equipment. In addition, RAAC-related academic achievements and the employment rate of RAAC talents should be taken into consideration in the academic evaluation.
7. Conclusions
- Through EGT analysis, the strategic decisions of government, construction companies, and public universities interact, and the ESS (Incentive, Innovative, Cultivation) can be achieved.
- Financial incentives can motivate construction companies to innovate as well as universities to train talent. Still, once the financial incentive becomes too large, financial pressure is put on the government, which thus chooses not to incentivize.
- Improving reputational incentives for construction firms and academic evaluations of public universities can increase the probability that construction companies and universities respond to promoting RAAC innovation and accelerate the realization of the tripartite ESS.
- High financial subsidies do not necessarily work well. Our research shows that higher financial subsidies tend to make the final decision of the tripartite non-innovative. In contrast, appropriately increasing reputational and academic evaluation rewards can effectively increase the likelihood that construction companies and public universities will choose RAAC innovations.
- For the government, construction companies, and public universities to achieve the ultimate ESS, they need a reasonable set of compounding incentives. The government should set a reasonable financial cost and reputational reward for incentives. Construction companies need to accelerate technology upgrades and reduce the cost of innovation. Public universities need to accelerate the construction of experimental environments to prepare for the training of relevant technical talents.
Author Contributions
Funding
Institutional Review Board Statement
Informed Consent Statement
Data Availability Statement
Conflicts of Interest
References
- Healey, P.; Shaw, T. Planners, plans and sustainable development. Reg. Stud. 1993, 27, 769–776. [Google Scholar] [CrossRef]
- Capra, F.; Luisi, P.L. The Systems View of Life: A Unifying Vision; Cambridge University Press: Cambridge, UK, 2014. [Google Scholar] [CrossRef]
- Porritt, J. Capitalism as if the World Matters; Routledge: London, UK, 2012. [Google Scholar] [CrossRef]
- Du Pisani, J.A. Sustainable development—historical roots of the concept. Environ. Sci. 2006, 3, 83–96. [Google Scholar] [CrossRef]
- Ayres, R.; Turton, H.; Casten, T. Energy efficiency, sustainability and economic growth. Energy 2007, 32, 634–648. [Google Scholar] [CrossRef]
- Yang, Y.; Pan, M.; Pan, W. ‘Co-evolution through interaction’ of innovative building technologies: The case of modular integrated construction and robotics. Autom. Constr. 2019, 107, 102932. [Google Scholar] [CrossRef]
- García de Soto, B.; Agustí-Juan, I.; Joss, S.; Hunhevicz, J. Implications of Construction 4.0 to the workforce and organizational structures. Int. J. Constr. Manag. 2019, 19, 1–13. [Google Scholar] [CrossRef]
- Reichenbach, S.; Kromoser, B. State of practice of automation in precast concrete production. J. Build. Eng. 2021, 43, 102527. [Google Scholar] [CrossRef]
- de Soto, B.G.; Skibniewski, M.J. Future of robotics and automation in construction. In Construction 4.0; Routledge: London, UK, 2020; pp. 289–306. [Google Scholar] [CrossRef]
- Bechthold, M. The return of the future: A second go at robotic construction. Archit. Des. 2010, 80, 116–121. [Google Scholar] [CrossRef]
- Brell-Çokcan, S.; Braumann, J. Rob/Arch 2012: Robotic Fabrication in Architecture, Art and Design; Springer: Vienna, Austria, 2013. [Google Scholar] [CrossRef]
- Wagner, H.J.; Alvarez, M.; Kyjanek, O.; Bhiri, Z.; Buck, M.; Menges, A. Flexible and transportable robotic timber construction platform—TIM. Autom. Constr. 2020, 120, 103400. [Google Scholar] [CrossRef]
- Gramazio, F.; Kohler, M.; Willmann, J. The Robotic Touch: How Robots Change Architecture: Gramazio & Kohler Research ETH Zurich 2005–2013; Park Books: Zurich, Switzerland, 2014. [Google Scholar] [CrossRef]
- Horn, R.; Groenewolt, A.; Krieg, O.D.; Gantner, J. Ökobilanzierung von lebensende-optionen. Bauphysik 2018, 40, 298–306. [Google Scholar] [CrossRef]
- Chen, H.; Wang, J.; Miao, Y. Evolutionary game analysis on the selection of green and low carbon innovation between manufacturing enterprises. Alex. Eng. J. 2021, 60, 2139–2147. [Google Scholar] [CrossRef]
- Delgado, J.M.D.; Oyedele, L.; Ajayi, A.; Akanbi, L.; Akinade, O.; Bilal, M.; Owolabi, H. Robotics and automated systems in construction: Understanding industry-specific challenges for adoption. J. Build. Eng. 2019, 26, 100868. [Google Scholar] [CrossRef]
- Bogue, R. What are the prospects for robots in the construction industry? Ind. Robot. Int. J. 2018, 45, 1–6. [Google Scholar] [CrossRef]
- Cao, J.; Wu, X.; Zhou, G. The evolution of manufacturers green operation mode and the role playing by governments. Sci. Res. Manag. 2013, 34, 108–115. [Google Scholar]
- Yahya, M.Y.B.; Hui, Y.L.; Yassin, A.B.M.; Omar, R.; anak Robin, R.O.; Kasim, N. The challenges of the implementation of construction. In MATEC Web of Conferences; EDP Sciences: Les Ulis, France, 2019; Volume 266, p. 05012. [Google Scholar] [CrossRef]
- Mydin, M.A.O.; Mohd Nawi, M.N.; Mohd Yunos, M.Y.; Utaberta, N.U. Decisive success factors in executing prefabrication system in Malaysia. Aust. J. Basic Appl. Sci. 2015, 9, 160–163. [Google Scholar]
- Chang, Y.; Li, X.; Masanet, E.; Zhang, L.; Huang, Z.; Ries, R. Unlocking the green opportunity for prefabricated buildings and construction in China. Resour. Conserv. Recycl. 2018, 139, 259–261. [Google Scholar] [CrossRef]
- Hong, J.; Shen, G.Q.; Mao, C.; Li, Z.; Li, K. Life-cycle energy analysis of prefabricated building components: An input–output-based hybrid model. J. Clean. Prod. 2016, 112, 2198–2207. [Google Scholar] [CrossRef] [Green Version]
- Luo, L.Z.; Mao, C.; Shen, L.Y.; Li, Z.D. Risk factors affecting practitioners’ attitudes toward the implementation of an industrialized building system. Eng. Constr. Archit. Manag. 2015, 22, 622–643. [Google Scholar] [CrossRef]
- Bock, T.; Linner, T. Robotic Industrialization; Cambridge University Press: Cambridge, UK, 2015. [Google Scholar] [CrossRef] [Green Version]
- Menges, A.; Sheil, B.; Glynn, R.; Skavara, M. (Eds.) Fabricate: Rethinking Design and Construction; UCL Press: London, UK, 2017; Volume 3. [Google Scholar] [CrossRef]
- Wei-Guo, X. Parametric Non-Linear Architecture Design; Tsinghua University Press: Beijing, China, 2016; pp. 190–191. [Google Scholar]
- Wei-Guo, X. Ditigal Architecture Design Works; Urban Architect: New York City, USA, 2016; pp. 190–191. [Google Scholar] [CrossRef]
- Bock, T. The future of construction automation: Technological disruption and the upcoming ubiquity of robotics. Autom. Constr. 2015, 59, 113–121. [Google Scholar] [CrossRef]
- Linner, T.; Bock, T. Evolution of large-scale industrialisation and service innovation in Japanese prefabrication industry. Constr. Innov. 2012, 12, 156–178. [Google Scholar] [CrossRef] [Green Version]
- Praveena, B.A.; Lokesh, N.; Buradi, A.; Santhosh, N.; Praveena, B.L.; Vignesh, R. A comprehensive review of emerging additive manufacturing (3D printing technology): Methods, materials, applications, challenges, trends and future potential. Mater. Today Proc. 2021. [Google Scholar] [CrossRef]
- Perkins, I.; Skitmore, M. Three-dimensional printing in the construction industry: A review. Int. J. Constr. Manag. 2015, 15, 1–9. [Google Scholar] [CrossRef] [Green Version]
- Wu, P.; Wang, J.; Wang, X. A critical review of the use of 3-D printing in the construction industry. Autom. Constr. 2016, 68, 21–31. [Google Scholar] [CrossRef] [Green Version]
- Lim, S.; Buswell, R.A.; Le, T.T.; Austin, S.A.; Gibb, A.G.; Thorpe, T. Developments in construction-scale additive manufacturing processes. Autom. Constr. 2012, 21, 262–268. [Google Scholar] [CrossRef] [Green Version]
- Zhang, X.; Li, M.; Lim, J.H.; Weng, Y.; Tay, Y.W.D.; Pham, H.; Pham, Q.C. Large-scale 3D printing by a team of mobile robots. Autom. Constr. 2018, 95, 98–106. [Google Scholar] [CrossRef]
- Linner, T. Automated and Robotic Construction: Integrated Automated Construction Sites; Technische Universität München: Munich, Germany, 2013. [Google Scholar]
- Bock, T.; Linner, T. Robot Oriented Design; Cambridge University Press: Cambridge, UK, 2015. [Google Scholar] [CrossRef] [Green Version]
- Bechert, S.; Knippers, J.; Krieg, O.D.; Menges, A.; Schwinn, T.; Sonntag, D. Textile fabrication techniques for timber shells. In Advances in Architectural Geometry; Park Books: Zurich, Switzerland, 2016. [Google Scholar] [CrossRef]
- Leng, Y.; Shi, X.; Hiroatsu, F. Application of robots to the construction of complex structures using standardized timbers. In ISARC. Proceedings of the International Symposium on Automation and Robotics in Construction; IAARC Publications: Kitakyushu City, Japan, 27 October 2020. [Google Scholar] [CrossRef]
- Goessens, S.; Mueller, C.; Latteur, P. Feasibility study for drone-based masonry construction of real-scale structures. Autom. Constr. 2018, 94, 458–480. [Google Scholar] [CrossRef]
- Lee, D.W.; Han, S.W.; Cha, Y.; Lee, K.H.; Kim, T.Y.; Oh, D.Y.; Im, S.A.; Bang, Y.J.; Park, J.W.; Ryoo, S.B.; et al. Prognostic influence of body mass index and body weight gain during adjuvant FOLFOX chemotherapy in Korean colorectal cancer patients. BMC Cancer 2015, 15, 690. [Google Scholar] [CrossRef] [PubMed] [Green Version]
- Sauder, J.; Hilgemann, E.; Bienstock, B.; Parness, A. An automaton rover enabling long duration in-situ science in extreme environments. In Proceedings of the 2017 IEEE Aerospace Conference, Big Sky, MT, USA, 4–11 March 2017. [Google Scholar] [CrossRef]
- Di Stefano, G.; Romeo, G.; Mazzini, A.; Iarocci, A.; Hadi, S.; Pelphrey, S. The Lusi drone: A multidisciplinary tool to access extreme environments. Mar. Pet. Geol. 2018, 90, 26–37. [Google Scholar] [CrossRef]
- Wong, C.; Yang, E.; Yan, X.T.; Gu, D. Autonomous robots for harsh environments: A holistic overview of current solutions and ongoing challenges. Syst. Sci. Control. Eng. 2018, 6, 213–219. [Google Scholar] [CrossRef]
- Rakha, T.; Gorodetsky, A. Review of Unmanned Aerial System (UAS) applications in the built environment: Towards automated building inspection procedures using drones. Autom. Constr. 2018, 93, 252–264. [Google Scholar] [CrossRef]
- Asadi, K.; Ramshankar, H.; Pullagurla, H.; Bhandare, A.; Shanbhag, S.; Mehta, P.; Kundu, S.; Han, K.; Lobaton, E.; Wu, T. Vision-based integrated mobile robotic system for real-time applications in construction. Autom. Constr. 2018, 96, 470–482. [Google Scholar] [CrossRef]
- De Looze, M.P.; Bosch, T.; Krause, F.; Stadler, K.S.; O’sullivan, L.W. Exoskeletons for industrial application and their potential effects on physical work load. Ergonomics 2016, 59, 671–681. [Google Scholar] [CrossRef] [PubMed] [Green Version]
- Van Rhijn, J.G.; Vodegel, R. Being honest about one’s intentions: An evolutionary stable strategy for animal conflicts. J. Theor. Biol. 1980, 85, 623–641. [Google Scholar] [CrossRef]
- Hines, W. Evolutionary stable strategies: A review of basic theory. Theor. Popul. Biol. 1987, 31, 195–272. [Google Scholar] [CrossRef]
- Coninx, K.; Deconinck, G.; Holvoet, T. Who gets my flex? An evolutionary game theory analysis of flexibility market dynamics. Appl. Energy 2018, 218, 104–113. [Google Scholar] [CrossRef]
- Zhang, L.; Chen, L.; Wu, Z.; Zhang, S.; Song, H. Investigating young consumers’ purchasing intention of green housing in China. Sustainability 2018, 10, 1044. [Google Scholar] [CrossRef] [Green Version]
- Von Neumann, J.; Morgenstern, O. Theory of Games and Economic Behavior; Princeton University Press: Princeton, NJ, USA, 2007. [Google Scholar] [CrossRef]
- Chen, J.; Xiong, W.; Xu, L.; Di, Z. Evolutionary game analysis on supply side of the implement shore-to-ship electricity. Ocean. Coast. Manag. 2021, 215, 105926. [Google Scholar] [CrossRef]
- Sun, Y.; Liu, B.; Fan, J.; Qiao, Q. The multi-player evolutionary game analysis for the protective development of ecotourism. Environ. Sci. Policy 2021, 126, 111–121. [Google Scholar] [CrossRef]
- Wang, J.; Qin, Y.; Zhou, J. Incentive policies for prefabrication implementation of real estate enterprises: An evolutionary game theory-based analysis. Energy Policy 2021, 156, 112434. [Google Scholar] [CrossRef]
- Yang, K.; Wang, W.; Xiong, W. Promoting the sustainable development of infrastructure projects through responsible innovation: An evolutionary game analysis. Util. Policy 2021, 70, 101196. [Google Scholar] [CrossRef]
- Qiao, W.; Yin, X. Understanding the impact on energy transition of consumer behavior and enterprise decisions through evolutionary game analysis. Sustain. Prod. Consum. 2021, 28, 231–240. [Google Scholar] [CrossRef]
- Cohen, C.; Pearlmutter, D.; Schwartz, M. A game theory-based assessment of the implementation of green building in Israel. Build. Environ. 2017, 125, 122–128. [Google Scholar] [CrossRef]
- Bock, T.; Linner, T. Construction Robots: Volume 3: Elementary Technologies and Single-Task Construction Robots; Cambridge University Press: Cambridge, UK, 2016. [Google Scholar] [CrossRef]
- Overview of the Fourth Round of National Discipline Evaluation. 2019. Available online: http://www.cdgdc.edu.cn/xwyyjsjyxx/xkpgjg/283494.shtml (accessed on 18 December 2021).
- Friedman, D. On economic applications of evolutionary game theory. J. Evol. Econ. 1998, 8, 15–43. [Google Scholar] [CrossRef] [Green Version]
- Zhao, X.; Liu, L.; Di, Z.; Xu, L. Subsidy or punishment: An analysis of evolutionary game on implementing shore-side electricity. Reg. Stud. Mar. Sci. 2021, 48, 102010. [Google Scholar] [CrossRef]
- Page, K.M.; Nowak, M.A. Unifying evolutionary dynamics. J. Theor. Biol. 2002, 219, 93–98. [Google Scholar] [CrossRef]
- Keqing, W.; Xinglai, F. Improved replicated dynamic equations and its stability analysis. Pure Appl. Math. 2015, 4, 3. [Google Scholar]
- Friedman, D. Evolutionary games in economics. Econom. J. Econom. Soc. 1991, 59, 637–666. [Google Scholar] [CrossRef] [Green Version]
- Sandholm, W.H. Local stability under evolutionary game dynamics. Theor. Econ. 2010, 5, 27–50. [Google Scholar] [CrossRef] [Green Version]
- Pan, M.; Linner, T.; Pan, W.; Cheng, H.M.; Bock, T. Influencing factors of the future utilisation of construction robots for buildings: A Hong Kong perspective. J. Build. Eng. 2020, 30, 101220. [Google Scholar] [CrossRef] [Green Version]
- Warszawski, A.; Navon, R. Implementation of robotics in building: Current status and future prospects. J. Constr. Eng. Manag. 1998, 124, 31–41. [Google Scholar] [CrossRef]
- Dimos, C.; Pugh, G. The effectiveness of R&D subsidies: A meta-regression analysis of the evaluation literature. Res. Policy 2016, 45, 797–815. [Google Scholar] [CrossRef]


| Parameters | Meanings | Domain |
|---|---|---|
| The tax revenue of the government when construction companies choose not to innovate | ||
| Extra benefits by the entire construction industry chain when construction companies innovate with RAAC when the government does not incentivize | ||
| Extra benefits by the entire construction industry chain when construction companies innovate with RAAC when the government incentivizes | ||
| Government fines for poor environmental performance due to non-innovation by construction companies | ||
| The cost of improved environmental benefits of traditional construction methods | ||
| Economic benefits for construction companies when they do not innovate | ||
| Economic benefits increment for construction companies when they innovate | ||
| Reputation and brand value of construction companies for RAAC innovation | ||
| Cost of RAAC innovation for construction companies | ||
| Subsidies that construction companies gain from the government for RAAC innovation | ||
| Innovation cost savings from acquiring RAAC talent from universities | ||
| Subsidies that public universities gain from the government for RAAC talent cultivation | ||
| Academic evaluation benefits of public universities for RAAC talent cultivation | ||
| Academic evaluation penalties of public universities for RAAC talent cultivation | ||
| Cost of RAAC talent cultivation for public universities | ||
| Probability of the government choosing to incentivize | ||
| Probability of the government choosing not to incentivize | ||
| Probability of the construction company choosing to innovate | ||
| Probability of the construction company choosing not to innovate | ||
| Probability of the public universities choosing to cultivate | ||
| Probability of the public universities choosing not to cultivate |
| Stakeholders | Construction Companies | ||
|---|---|---|---|
| Government Incentive (x) | Public universities Cultivate (z) |
, , |
, , |
| Public universities Not to cultivate (1−z) |
, , |
, , | |
| Government No incentive (1−x) | Public universities Cultivate (z) |
, , |
, , |
| Public universities Not to cultivate (1−z) | , , 0 | , , 0 | |
| Equilibrium Point | Eigenvalue 1 | Eigenvalue 2 | Eigenvalue 3 | Conditions | Stability |
|---|---|---|---|---|---|
| Unstable | |||||
|
, , | ESS | ||||
|
, , | ESS | ||||
|
, | ESS | ||||
|
, , | ESS | ||||
|
, , | ESS | ||||
|
, , | ESS | ||||
|
, , | ESS |
Publisher’s Note: MDPI stays neutral with regard to jurisdictional claims in published maps and institutional affiliations. |
© 2022 by the authors. Licensee MDPI, Basel, Switzerland. This article is an open access article distributed under the terms and conditions of the Creative Commons Attribution (CC BY) license (https://creativecommons.org/licenses/by/4.0/).
Share and Cite
Yi, L.; Hiroatsu, F. Incentives for Innovation in Robotics and Automated Construction: Based on a Tripartite Evolutionary Game Analysis. Sustainability 2022, 14, 2475. https://doi.org/10.3390/su14042475
Yi L, Hiroatsu F. Incentives for Innovation in Robotics and Automated Construction: Based on a Tripartite Evolutionary Game Analysis. Sustainability. 2022; 14(4):2475. https://doi.org/10.3390/su14042475
Chicago/Turabian StyleYi, Leng, and Fukuda Hiroatsu. 2022. "Incentives for Innovation in Robotics and Automated Construction: Based on a Tripartite Evolutionary Game Analysis" Sustainability 14, no. 4: 2475. https://doi.org/10.3390/su14042475
APA StyleYi, L., & Hiroatsu, F. (2022). Incentives for Innovation in Robotics and Automated Construction: Based on a Tripartite Evolutionary Game Analysis. Sustainability, 14(4), 2475. https://doi.org/10.3390/su14042475