Article

Resource Recycling Utilization of Distillers Grains for Preparing Cationic Quaternary Ammonium—Ammonium Material and Adsorption of Acid Yellow 11

1
College of Environmental Science and Engineering, Shaanxi University of Science & Technology, Xi’an 710021, China
2
Key Laboratory of Cleaner Production and Integrated Resource Utilization of China National Light Industry, Beijing Technology and Business University, Beijing 100048, China
3
Liquor Making Biological Technology and Application of Key Laboratory of Sichuan Province, Sichuan University of Science & Engineering, Zigong 643000, China
4
Key Laboratory of Wuliangye-Flavor Liquor Solid-State Fermentation, China National Light Industry, Yibin 644000, China
*
Author to whom correspondence should be addressed.
Sustainability 2022, 14(4), 2469; https://doi.org/10.3390/su14042469
Submission received: 19 December 2021 / Revised: 25 January 2022 / Accepted: 14 February 2022 / Published: 21 February 2022

Abstract

:
Using distillers grains (DG) as raw material after pre-treatment with sodium hydroxide (NaOH) and modified with cationic etherification agent 3-chloro-2-hydroxypropyltrimethylammonium chloride (CHPTAC), cationic quaternary ammonium distillers grains adsorption material (CDG) was successfully prepared. The optimal adsorption conditions were an adsorption temperature of 25 °C, adsorption time of 180 min, amount of adsorbent at 8.5 g/L, initial dye concentration of 100 mg/L, and pH of dye solution 7.0. The structure of CDG was characterized by FTIR, EDS, SEM, BET, ultraviolet spectrum analysis, and analysis of the zeta potential, while the adsorption mechanism was studied by adsorption kinetics, isotherms, and thermodynamics. The results showed that CHPTAC modified the distillers grains successfully and induced the formation of CDG with a large number of pore structures and good adsorption effect. The highest adsorption yield was above 98%, while after eight rounds of adsorption–desorption experiments, the adsorption rate was 81.80%. The adsorption mechanism showed that the adsorption process of acid yellow 11 (AY11) by CDG conforms to the pseudo-second-order kinetic model, mainly with chemical and physical adsorption such as pore adsorption and electrostatic adsorption. Thermodynamics conforms to the Freundlich isothermal model, and the adsorption process is a spontaneous, endothermic and entropy-increasing process.

1. Introduction

At present, the excessive use of dyes and large amounts of emissions are not only causing water pollution but also could threaten human health, therefore the subject has attracted increased attention from scholars. Data show that more than 700,000 tons of organic dyes are produced every year [1], of which about 35,000 to 70,000 tons of organic dyes are released in wastewater without any treatment [2]. Azo dyes are the most important class of synthetic dyes and pigments, accounting for 60–80% of all organic colorants. They are widely used on substrates such as textile fibers, leather, plastics, paper, hair, mineral oil, wax, food, and cosmetics [3,4,5,6]. When wastewater with the azo dye enters a body of water, it could hinder the penetration of light and seriously affect aquatic organisms [7]. At the same time, dyes can contaminate groundwater and eventually enter into the human body, causing health problems, as most azo dyes are toxic and/or carcinogenic [8]. Therefore, looking for a cost-efficient method for azo dye wastewater treatment has become a demand of today’s society and industry.
In the dye industry, several wastewater treatment methods have been applied in order to remove azo dyes, based on electrochemical treatment [9], flocculation [10], chemical oxidation [11], liquid–liquid extraction [12], biological oxidation [13], ion exchange [14], photocatalytic degradation [15], precipitation [16], adsorption [17] and membrane separation [18]. The adsorption method [19] is widely used to remove organic dyes from wastewater due to its fast decolorization and simple operation. In addition, more and more materials are used as adsorbents, such as silica-based materials [20], metal oxides [21], activated carbon [22], zeolite [23], alumina [24], silica [25], biomaterials [26], and polymers [27]. However, the adsorbents mentioned above still have the disadvantages of poor selectivity, inconvenient separation, difficult recovery, and high cost. Therefore, searching for new adsorbents with high adsorption capacity, high stability, low cost, and recyclability has become a current hotspot of investigations.
Acid yellow 11 (AY11) is an azo dye in acid dyes [28,29,30], yellow powder, and its structural formula is shown in Figure 1. Its molecular structure contains an azo group (-N=N-), being easily soluble in water as an anionic dye. The AY11 dye contamination of wastewaters has the characteristics of high chroma, high chemical stability, and high resistance toward biodegradation, being harmful to the environment and human health.
Cellulose is one of the most widespread biological macromolecules in nature [31]. Therefore, it can be considered as an inexpensive, biodegradable, and renewable biopolymer, which has received extensive attention due to its unique physical and chemical properties [32]. Despite various advantages, natural cellulose itself does not have a high adsorption capacity if it is directly used as an adsorbent without modification. In these cases, the adsorption capacity may be low and the selectivity is poor [33]. Therefore, in order to improve its adsorption capacity, many investigations have concentrated on the modification of cellulose through esterification, etherification, or graft copolymerization in order to improve the adsorption capacity and the renewable ability of cellulose.
Distillers grains (DG) are the main by-product in the production process of liquor, which contains cellulose as its main component [34]. At present, DG are mainly used directly as feed in livestock farming, but the rate of usage is low, resulting in a large amount of DG accumulation. At the same time, fresh DG have high water content, are perishable and deteriorate, and long-term accumulation will cause not only a severe waste of resources but also environmental pollution. The use of waste distillers grains to prepare adsorbent materials could not only solve the problem of resource optimization and utilization of DG, but also could use waste distillers grains as raw materials for adsorbents.
Quaternary ammonium salt is a relatively common cationic compound that can interact with negatively charged substances on the surface. At present, trimethylamine [35], 3-chloro-2-hydroxypropyl trimethylammonium chloride [36], and tetraacetylethylenediamines [37] were used to prepare quaternized cationized cellulose, used as an adsorbent to treat anionic dye wastewater [38].
Therefore, in this study, the cationic etherification agent 3-chloro-2-hydroxypropyltrimethyl- ammonium chloride (CHPTAC) was used to modify the alkalized distillers grains to obtain a cationic distillers grain adsorbent (CDG). The applied etherification process could introduce a quaternary ammonium cationic group (-N(CH3)3) on the long cellulose chain, which strengthens the electrostatic interaction between the anionic group in CDG (-SO3) and the AY11 molecule. At the same time, the introduction of new groups may expand the molecular structure and increase its contact site and area with the AY11 molecule, thereby improving the adsorption rate of CDG to AY11 component of the wastewater. This study could also provide a theoretical basis for the recycling of biological waste and the application of waste DG as an adsorbent in the removal of azo dye wastewater, realizing the environmental protection concept of “treatment of waste by waste”.

2. Materials and Methods

2.1. Materials and Chemicals

In the present investigation, the used DG were obtained from a winery in Xi’an, Shaanxi (China). Chemical reagents included analytically pure sodium hydroxide (NaOH), hydrochloric acid (HCl), 3-chloro-2-hydroxypropyl trimethylammonium chloride (CHPTAC), acid yellow 11 (AY11) and absolute ethanol (CH3CH2OH). The water used was distilled water.

2.2. Pre-treatment of DG and Preparation of CDG

To begin, 15 g of 120 mesh of DG powder was introduced into a 250 mL three-necked flask with 200 mL, 10% NaOH solution. In the next step, the reaction mixture was placed on a water bath at 30 °C, 110 RPM for 180 min. When the reaction was completed, the as-obtained mixture was filtered with distilled water and 95% ethanol solution, washed until reaching neutrality, and dried completely in an oven at 60 °C to obtain the alkalized DG. Then, the alkalized DG were introduced in a 250 mL three-necked flask, adding 200 mL of NaOH solution with a mass fraction of 20%, and reacting at 30 °C, 110 RPM on a water bath for 120 min, and CTA was added to continue the reaction. After the reaction was completed, it was filtered and washed with 95% ethanol and distilled water again, until reaching the neutral pH, and dried in an oven at 60 °C to obtain CDG. The schematic diagram of the reactions [29] are shown in Figure 2.

2.3. Characterization of CDG

The Vector-22 Fourier Transform Infrared Spectrometer (FTIR) (Vector-22, Bruker, Karlsruhe, Germany) was used to analyze the functional groups of CDG. The scanning range was set 4000–500 cm−1, and the number of scans was 32. The energy dispersive spectrometer (EDS) (EDAX Octane Prime, EDAX, Mahwah, NJ, USA) was used to analyze the type and content of the component elements in the material micro area. The surface morphology of CDG was observed by FEI Q45 scanning electron microscope (SEM) (FEI-Q45, FEI, Hillsboro, OR, USA).
The Brunauer–Emmett–Teller (BET) (ASAP2460, Mike Corporation, Norcross, GA, USA) was used to study the surface area and the porosity of DG and CDG; this analysis was carried out by N2 adsorption–desorption isotherm and the surface area was calculated by BET plot. UV-2006A ultraviolet-visible spectrophotometer (UV-2006A, Brucher, German) measured the absorbance of the solution after adsorption; the surface charge of CDG was analyzed using a zeta potentiometer (zeta potential) (JS94HM, ZKT, Shanghai, China). The conditions of the zeta potential determined CDG were concentration 40 % w/v, temperature 25 °C, the average size of the dispersed particles was 80–160 μm, the sample surfaces were probed with either aqueous 1 mM KCl solution, 0.05 M KOH solution to raise the pH, or 0.05 M HCl to decrease the pH to 4. The zeta potential was determined by the Helmholtz–Smoluchowski Equation (1) [39]:
ζ = d I d P η ξ r ξ 0 L A
where d I is the differential streaming current, d P is the differential pressure drop, η is the solution viscosity, ξ r is the solution relative permittivity, ξ 0 is the vacuum permittivity, L is the length of the streaming channel, A and is the cross-section of the streaming channel.

2.4. Batch Adsorption Experiment

The adsorption performance of CDG toward AY11 dye was investigated by the addition of 0.13 g of CDG to 20 mL of AY11 dye solution, containing 200 mg of coloring agent per 1000 mL aqueous solution, and by changing the adsorption temperature (25–45 °C), adsorption time (40–290 min), the amount of adsorbent (1.5–10.5 g /L), the initial concentration of AY11 (50–400 mg/L), and the pH of adsorption (1.0–9.0, adjusted by adding 1 M NaOH or 1 M HCl). The adsorbent was dispersed entirely into the solution at a constant temperature and with a specific adsorption time, the condition was showed as Table 1. After the adsorption process, the CDG was centrifuged and separated from the supernatant, and distilled water was used as a control. The absorbance was measured at 417 nm with an ultraviolet spectrophotometer, and the residual concentration/absorption rate of the dye was calculated using the following equations:
q e = ( C 0 C e ) × V m
η = C 0 C e C 0 × 100 %
where C0 and Ce were the initial concentration of AY11 and the concentration after the adsorption process (mg/L), V was the initial volume of the dye (mL), m was the amount of adsorbent (g), qe was the adsorption capacity (mg/g), and η was the efficiency of removal.

2.5. Regeneration Performance

The CDG after adsorption was soaked in 0.1 mol/L NaOH solution and shaken at 180 RPM for 10 min. Afterward, it was washed five times with deionized water and dried in a vacuum oven at 60 °C to obtain the regenerated CDG. In the last step, adsorption experiments were conducted to analyze the ability of the regenerated CDG to adsorb AY11. In order to investigate the reusability of CDG, the adsorption–desorption cycle was repeated eight times.

2.6. Adsorption Mechanism

2.6.1. Adsorption Kinetic Model

The kinetic model in the adsorption process mainly investigates the change in the adsorption amount with time and obtains the relationship between the adsorption amount and time, using a kinetic model to fit [40]. Pseudo-first-order kinetic models and pseudo-second-order kinetic models are commonly used as solid–liquid adsorption kinetic models [41].
Pseudo-first-order kinetics [42] were first used to study the variation of the adsorption amount with the adsorption time, using the following Equation (4):
q t = q e ( 1 e k 1 t )
The pseudo-second-order kinetic model was used to describe the adsorption capacity of the adsorbent [43], using the following Equation (5):
q t = k 2 q e 2 t 1 + k 2 q e t
where qe and qt were the adsorption capacities at adsorption equilibrium (mg/g); k1 was the pseudo-first-order adsorption rate constant (min−1), and k2 was the pseudo-second-order adsorption rate constant, (g/mg·min−1).

2.6.2. Adsorption Isotherm Model

The adsorption isotherm model was used to describe the relationship between the adsorption amount and the equilibrium concentration of the solution when the adsorption reached the equilibrium at a specific temperature, from which the interaction mechanism between the adsorbent and the adsorbate can be inferred, and it could also be used to select the optimal adsorption agent [44].
The adsorption isotherm represents the distribution of adsorbed molecules between the liquid and solid phase when the adsorption reaches its equilibrium [45]. The establishment of a more suitable balance curve could optimize the adsorption system [45].
The Langmuir adsorption isotherm model assumes that molecular adsorption is a process of monomolecular surface adsorption; the surface of the adsorbent is uniform and has some of the same adsorption sites. When the kinetics reach equilibrium, no further adsorption occurs and the adsorbed particles are completely independent from other adsorption particles, as there is no interaction between them [46,47], as described by Equation (6):
q e = a b C e 1 + a C e
where Ce (mg/L) was the concentration of the equilibrium, qe (mg/g) was the equilibrium adsorption capacity at this concentration.
The Freundlich adsorption isotherm is an empirical equation which could be used to predict whether or not the adsorbent surface is uniform; if it is not, the adsorption amount increases with the increase in solution concentration, and there is an interaction force between the adsorbed molecules [48,49], as described in Equation (7):
q e = K F C e 1 n
where Ce (mg/L) is the equilibrium concentration, and qe (mg/g) is the equilibrium adsorption capacity at the concentration. KF (L/mg) is the Freundlich adsorption constant related to the adsorption capacity, which characterizes the strength of the interaction between the adsorbent and the dye (the higher the KF means higher adsorption capacity of the adsorbent). 1/n is the non-uniformity factor of the Freundlich model and represents the adsorption strength. When 0 < l/n < 1, it indicates that the adsorption process was favorable and easy to proceed; if 1/n = 1, the adsorption reaction was linear and there was no interaction between the adsorbates; when 1/n > 1, adsorption, the process is negative, and the adsorption reaction is more difficult.

2.6.3. Adsorption Thermodynamic Model

The adsorption thermodynamic model investigates the effect of the temperature of the solution, which is adsorbed at different solution concentrations. The related thermodynamic parameters [50] (ΔG0, ΔS0, ΔH0) are described in Equations (8) and (9):
Δ G 0 = R T ln K
ln K = Δ S 0 R Δ H 0 R T
K = q e C e
where T is the temperature (K); R is gas constant, and K is the adsorption equilibrium constant, Ce (mg/L) is the concentrations of adsorption equilibrium, and qe (mg/g) is the adsorption capacity of adsorption equilibrium.

3. Results and Discussion

3.1. FTIR Analysis of DG and CDG

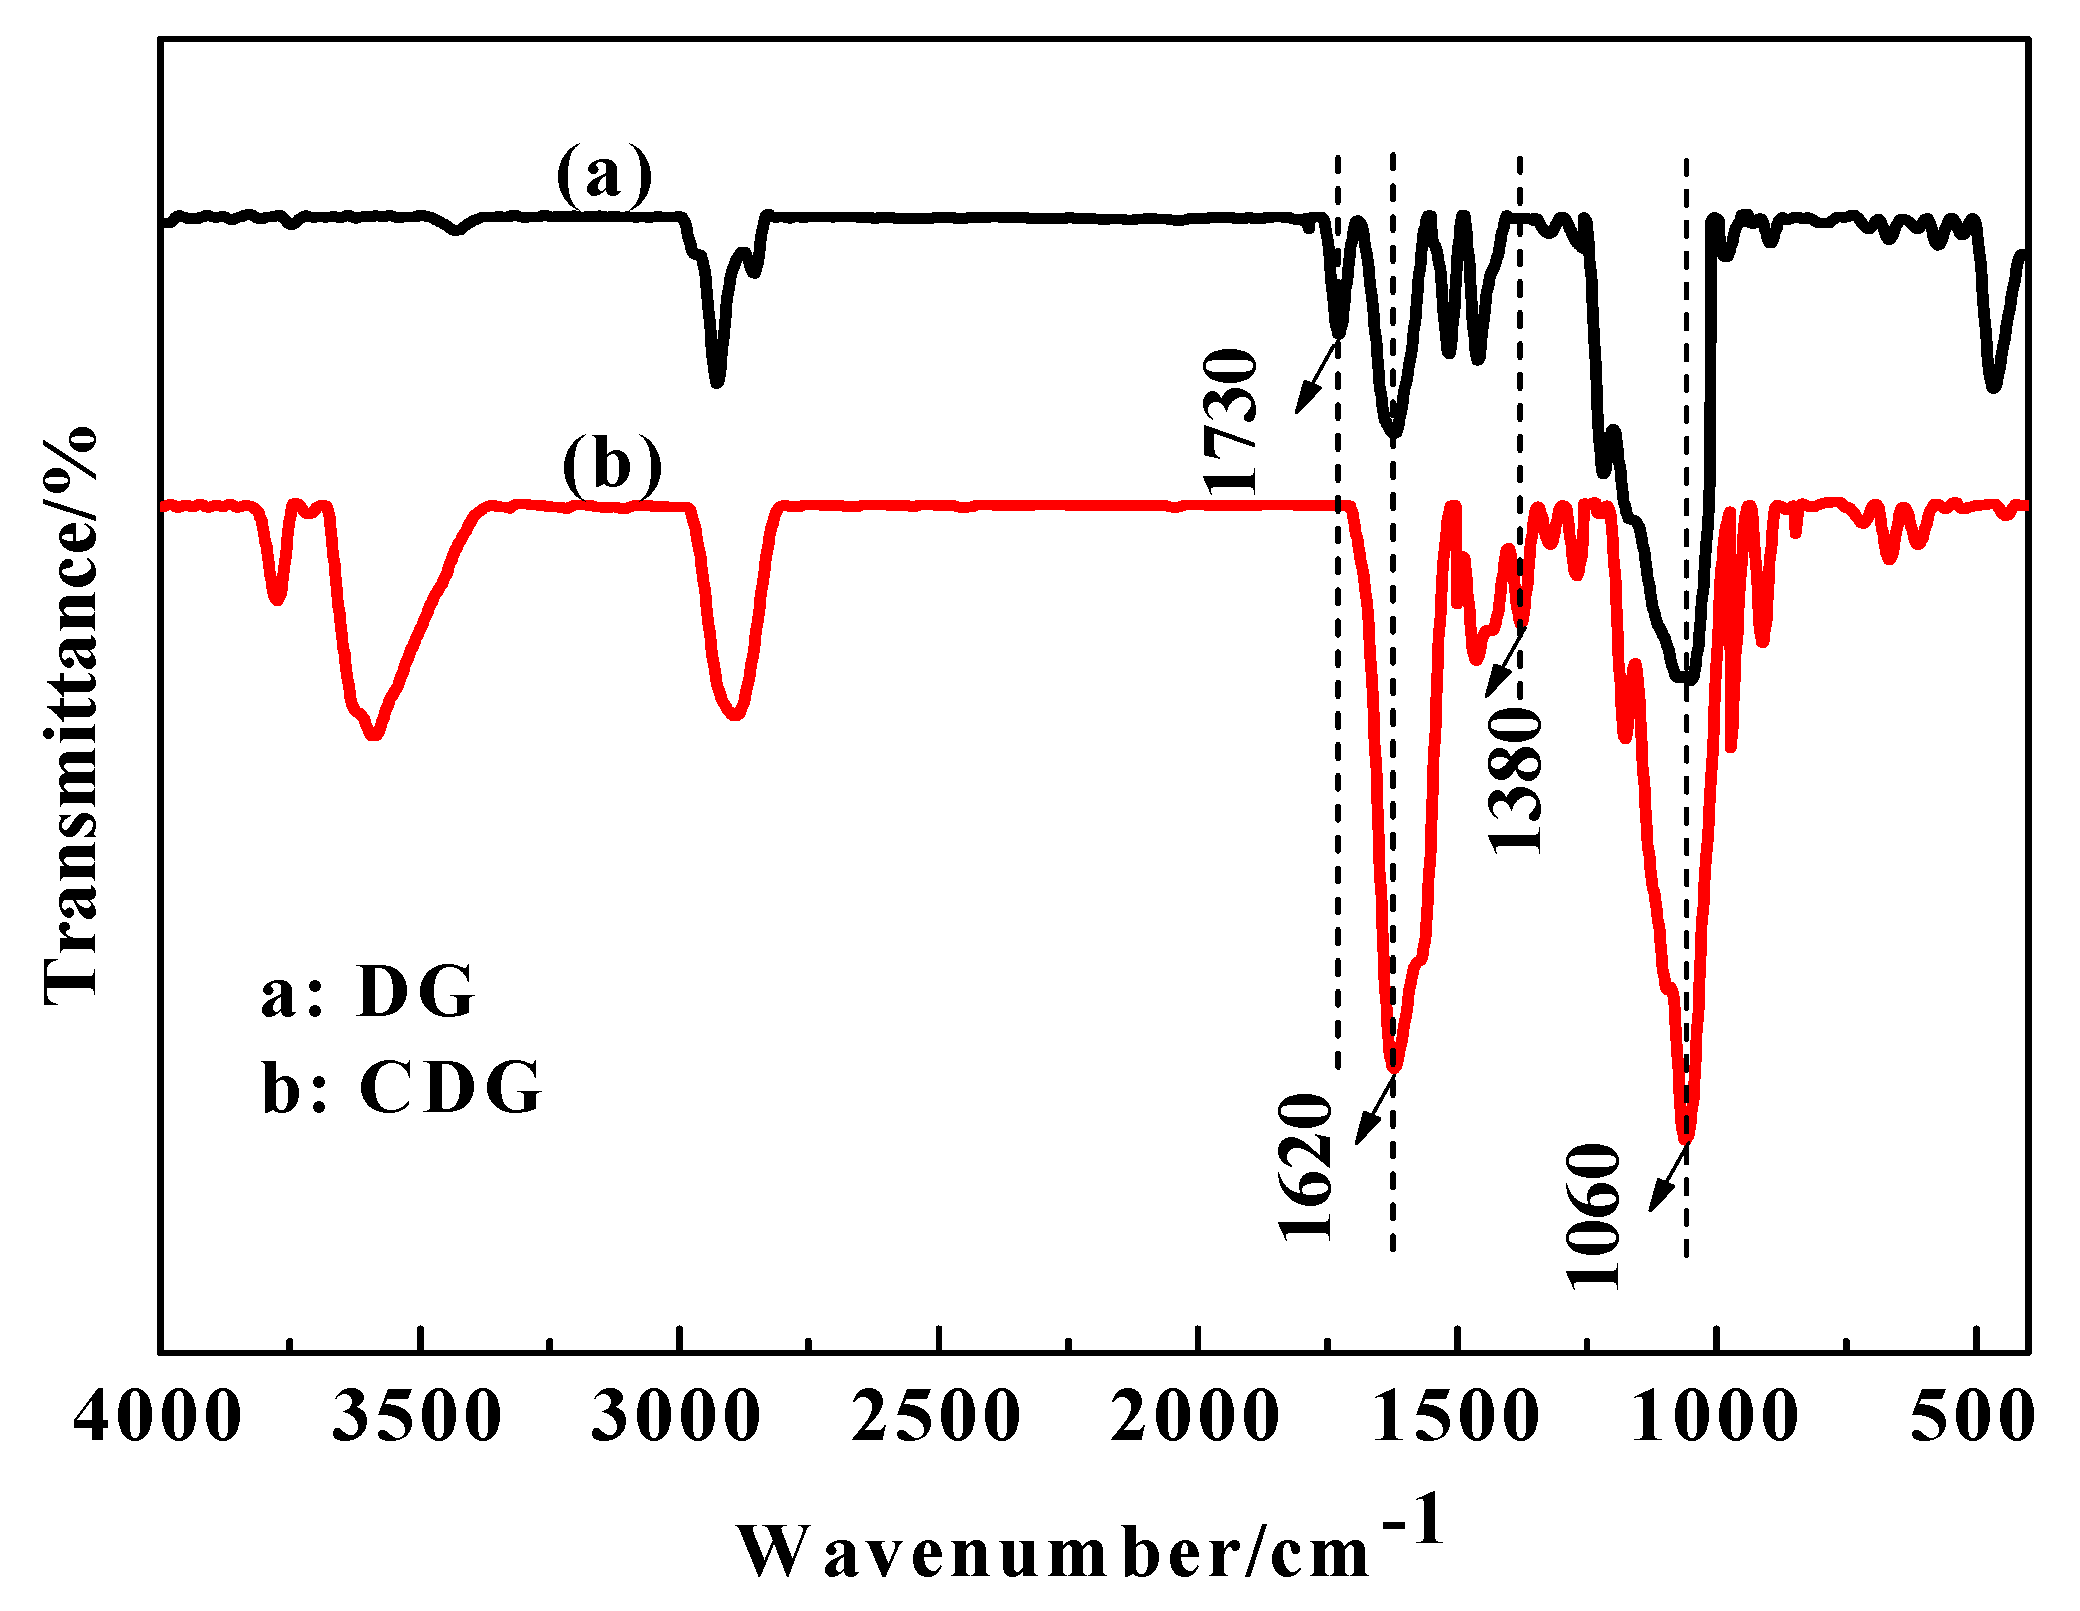
The FTIR spectra of DG and CDG are shown in Figure 3. It can be seen that the spectra of CDG and DG are basically similar; the small differences are as follows:
For CDG, the peaks appearing at 3550 cm−1 and 3650 cm−1 could be attributed to the O-H stretching vibration of the hydroxyl group [51], as the hydrogen bond was destroyed during the modification process, the internal structure of the DG was opened, and the hydroxyl groups in the DG were exposed.
The absorption peak at 1060 cm−1 was enhanced due to the change in absorption peak of the C-O-C bond on the molecular chain of the quaternized product [52].
The characteristic absorption peak of C-N at 1380 cm−1 for CDG indicates that the C-N functional group was successfully introduced into the DG, while the absorption peak of CDG at 1620 cm−1 was also significantly enhanced, which could be attributed to the presence of -CH3 in the quaternary ammonium salt, which undergoes bending oscillation. The absorption peak at 1730 cm−1 disappeared, which could have been caused by the bending vibration of the alcoholic hydroxyl group. These results indicate that the CHPTAC successfully modified the DG, and CDG was successfully obtained.

3.2. EDS Structure Characterization of DG and CDG

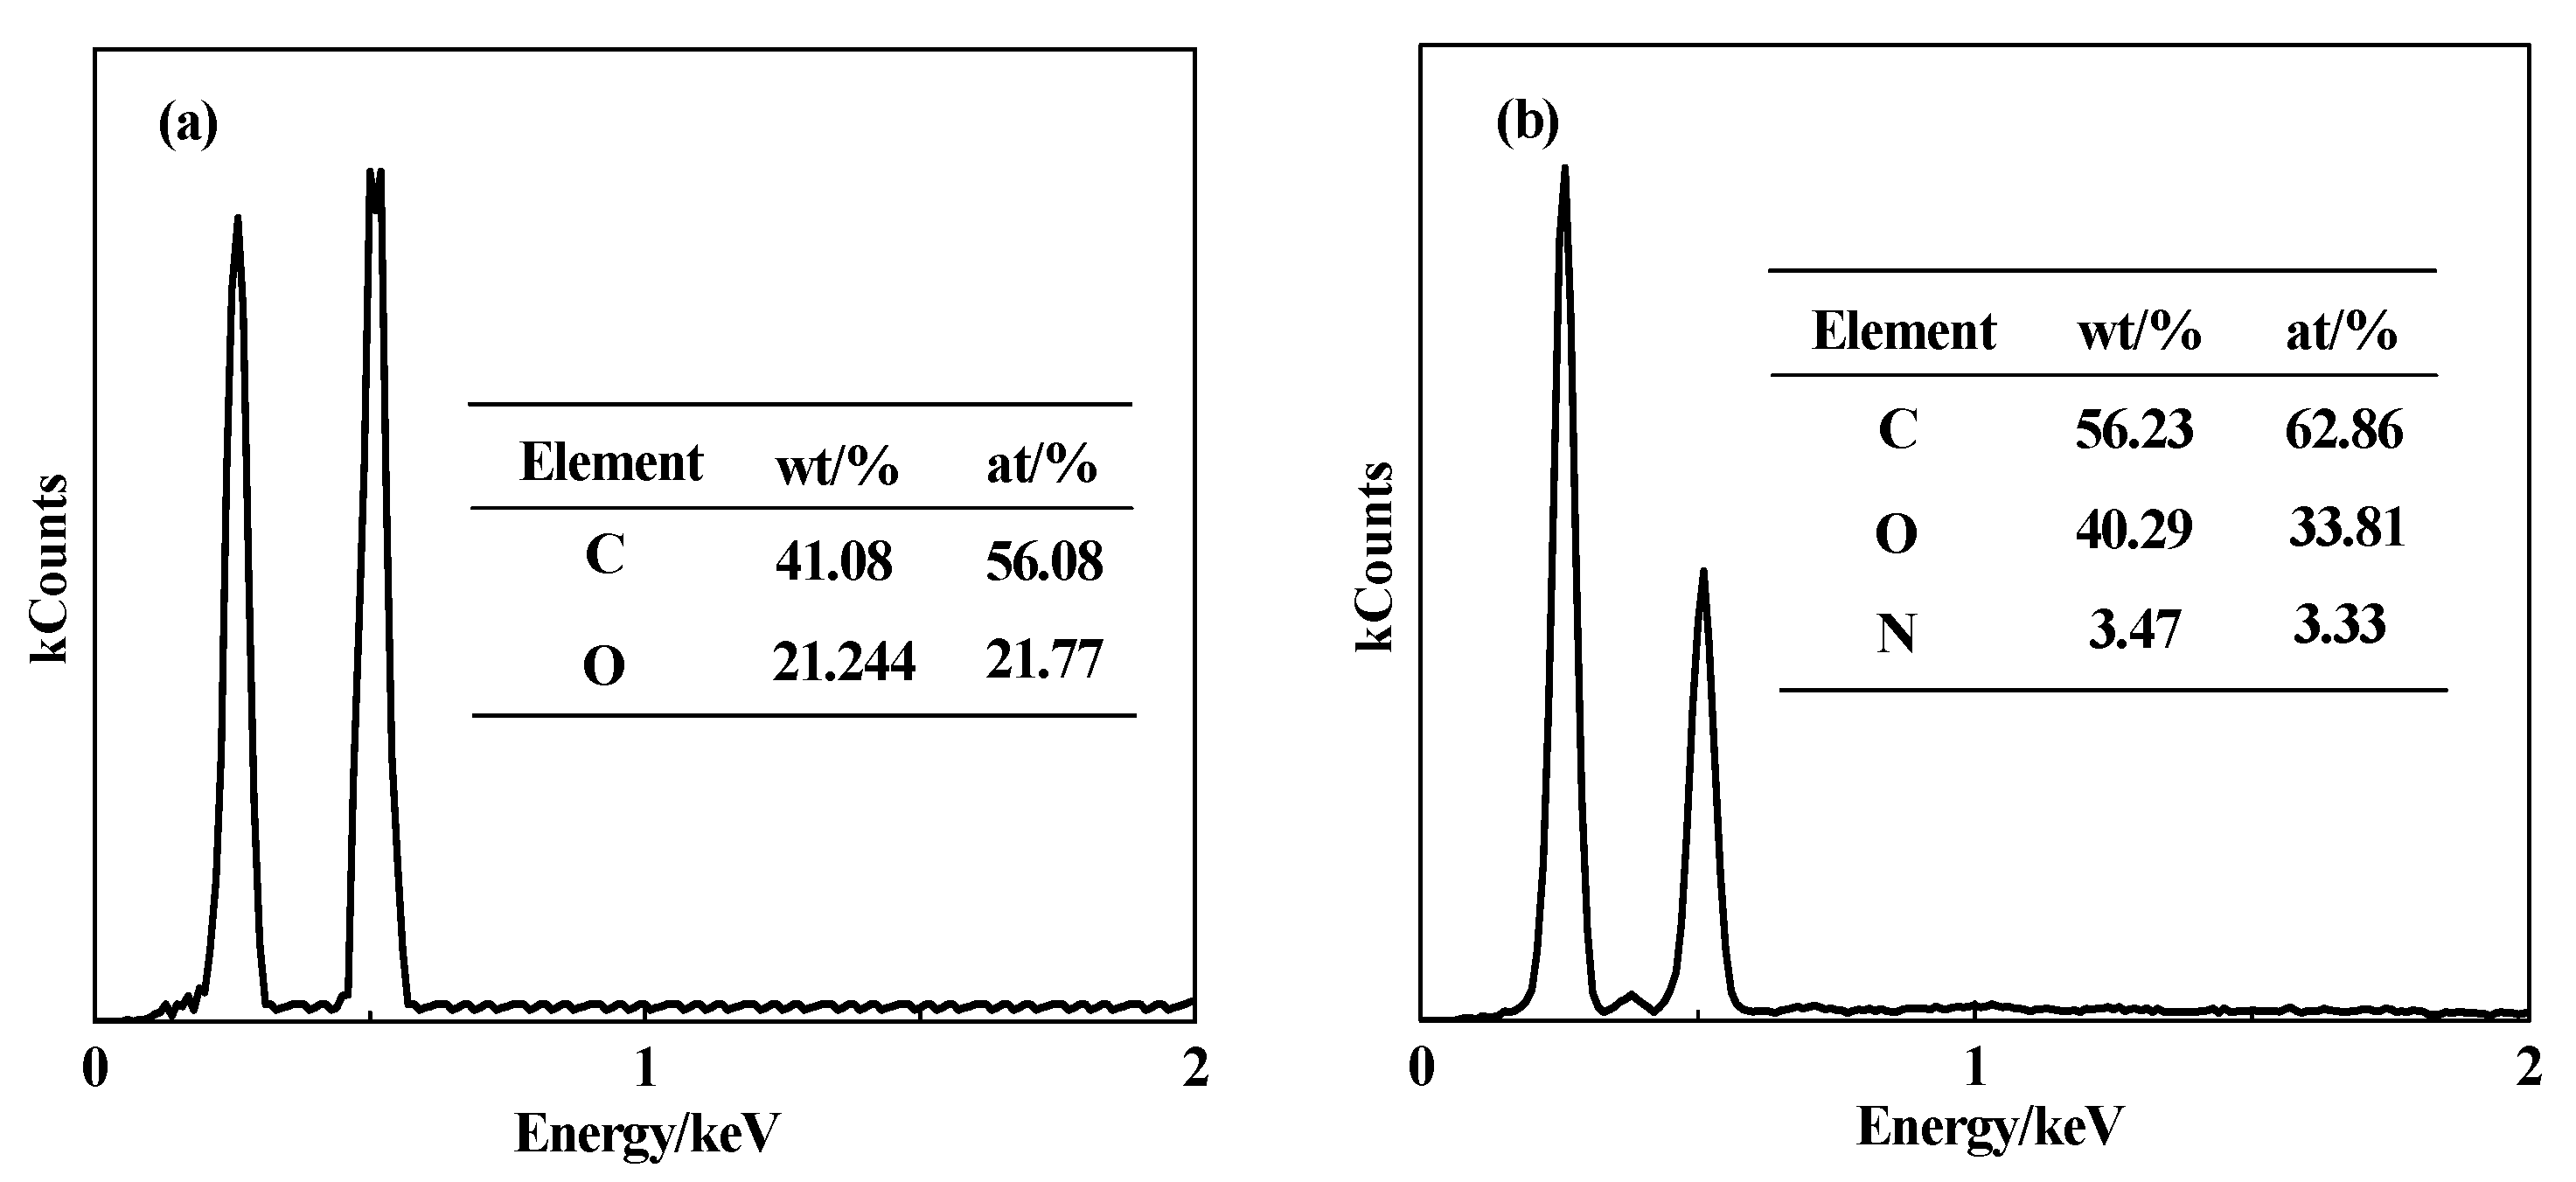
The EDS images of DG and CDG can be observed in Figure 4. We can see that the mass percentage of C element in the CDG increased by 15.15%, O element increased by 19.05%, and N element increased by 3.47%. The main reason is that DG is mainly composed of C, H, and O elements, and -N(CH3)3 group is introduced when CTA modifies DG, and NaOH participates in the ring-opening reaction as a catalyst during the modification process. This result shows that CTA modified DG successfully, and further corroborates the characterization results of FTIR.

3.3. SEM Analysis of DG and CDG

The SEM images of DG and CDG can be observed in Figure 5. It can be seen that the surface of DG is smooth and has a dense structure of lignocellulose fibers; however, many pore structures appeared on the surface of CDG. This could be attributed to the fact that the cell wall in CDG was modified by alkali treatment and became loose and swollen, increasing the porosity. After modification, the ability of mass transfer of CDG was improved, and more adsorption and binding sites were exposed on the surface, which could be beneficial to the entry of AY11 dye molecules, improving in this way the adsorption performance of CDG.

3.4. The BET Analysis of CDG

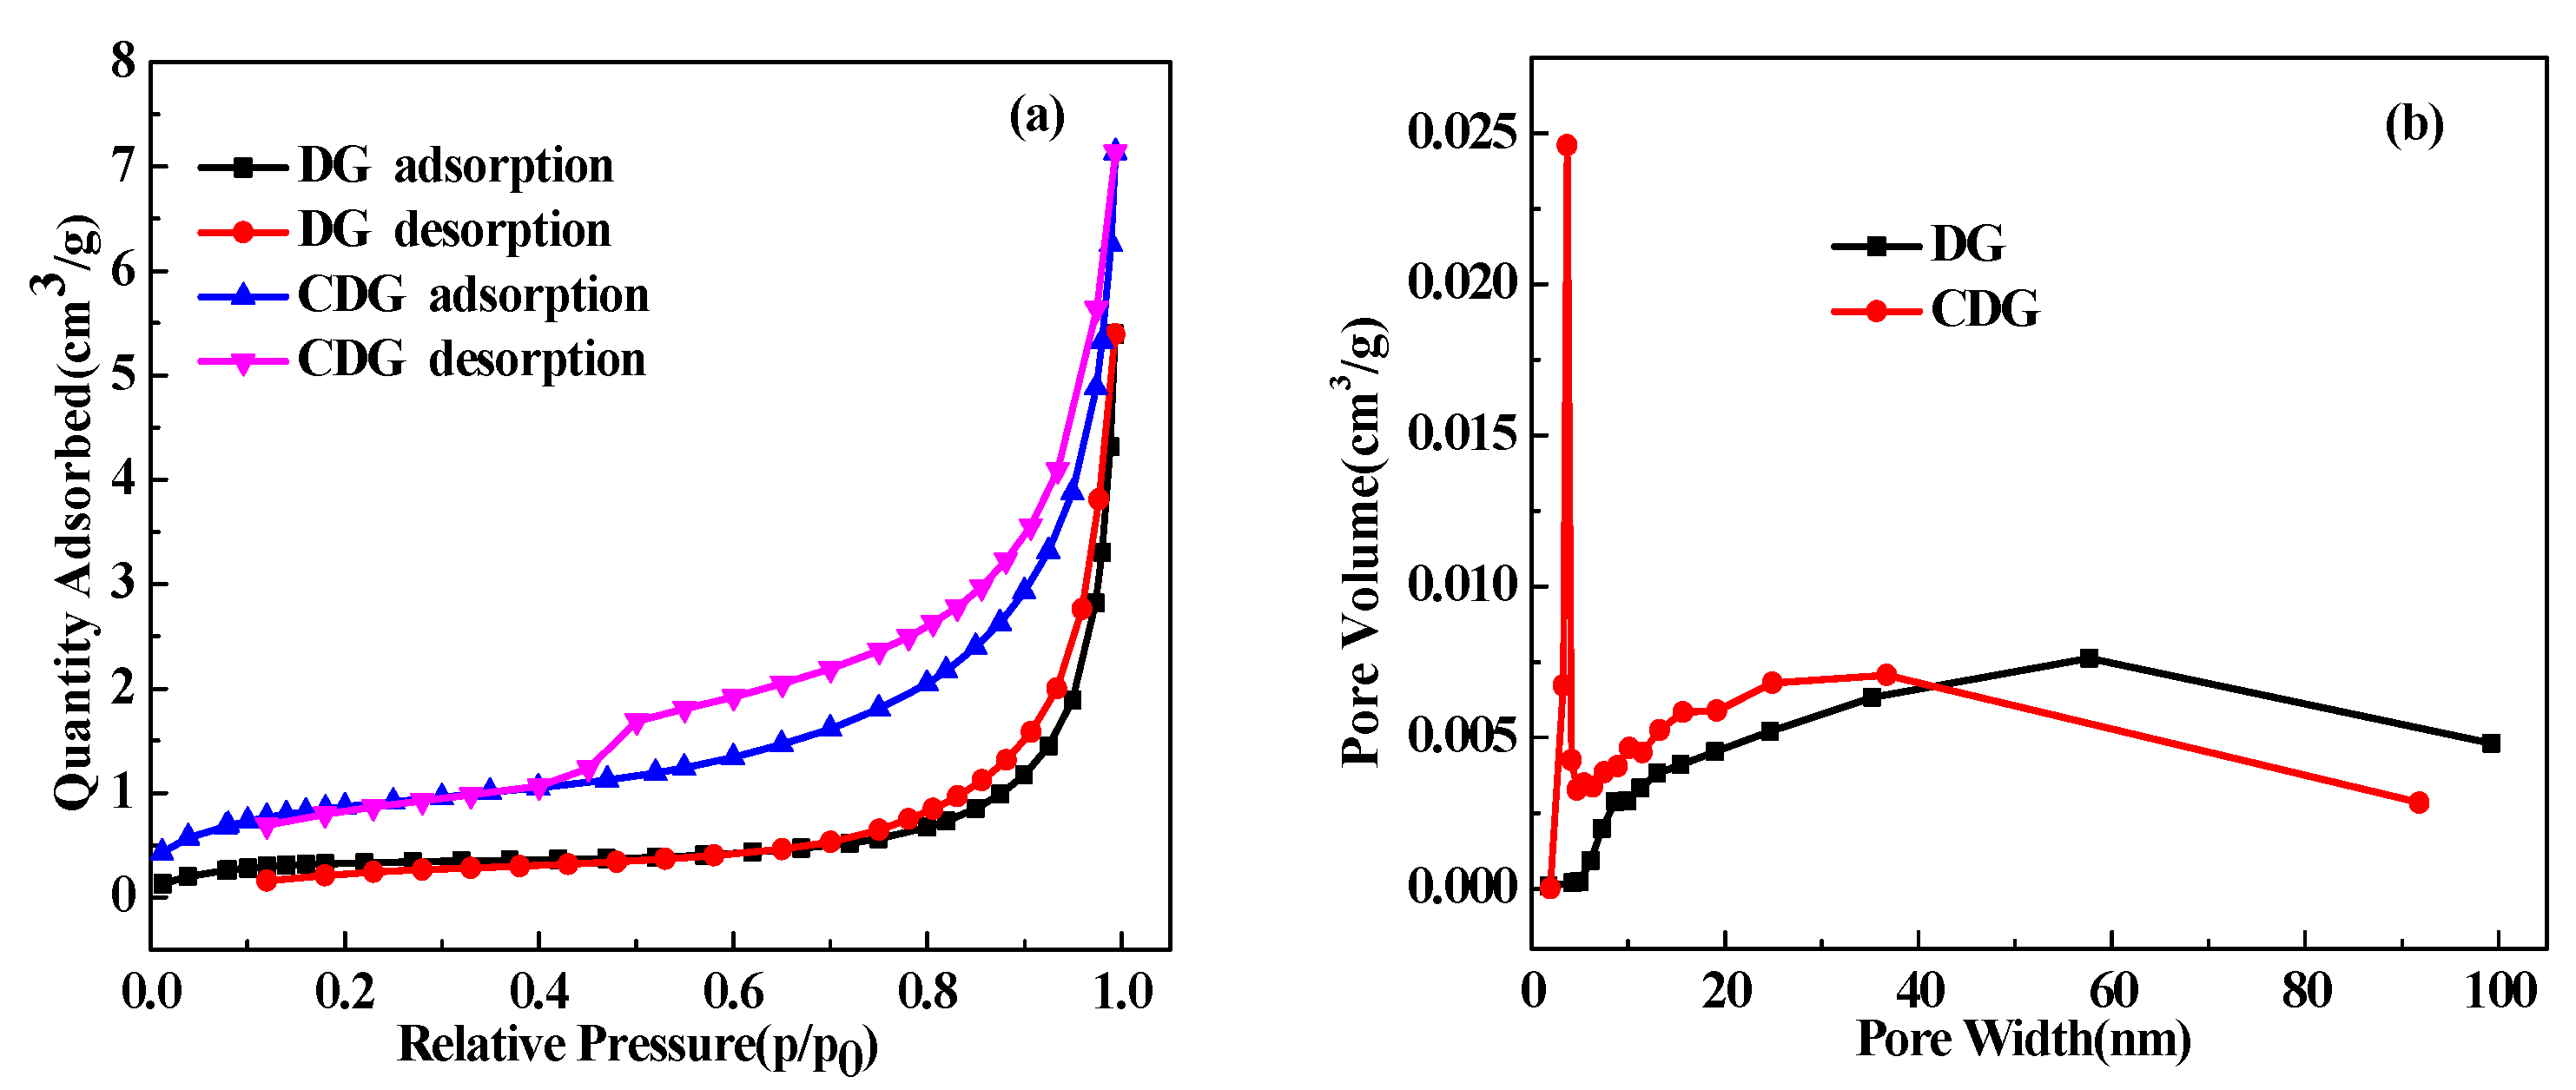
Figure 6 shows the N2 adsorption–desorption curves of DG and CDG (a) and the pore size distribution (b). The N2 adsorption–desorption curves of DG and CDG are both typical Type IV [53]. As can be seen from Figure 6a, when P/P0 is less than or equal at 0.4, the adsorption and desorption curves of DG overlap, indicating the presence of microporous and monolayer adsorption. When P/P0 is greater than 0.4, the adsorption of CDG to N2 increases rapidly, indicating that the pores in the adsorbent are slit pores [54]. As can be seen from Figure 6b, the pore size distribution of DG is 5–100 nm, while the CDG distribution is 10–40 nm. After modification, the specific surface area and pore volume of DG become larger, which is consistent with the results in Table 2. The specific surface area of CDG is 3.51 m2/g. Compared with DG, the specific surface area is increased by 242%, indicating that the increase in the specific surface area of CDG is beneficial to the adsorption of dyes.

3.5. Zeta Potential Analysis of DG and CDG

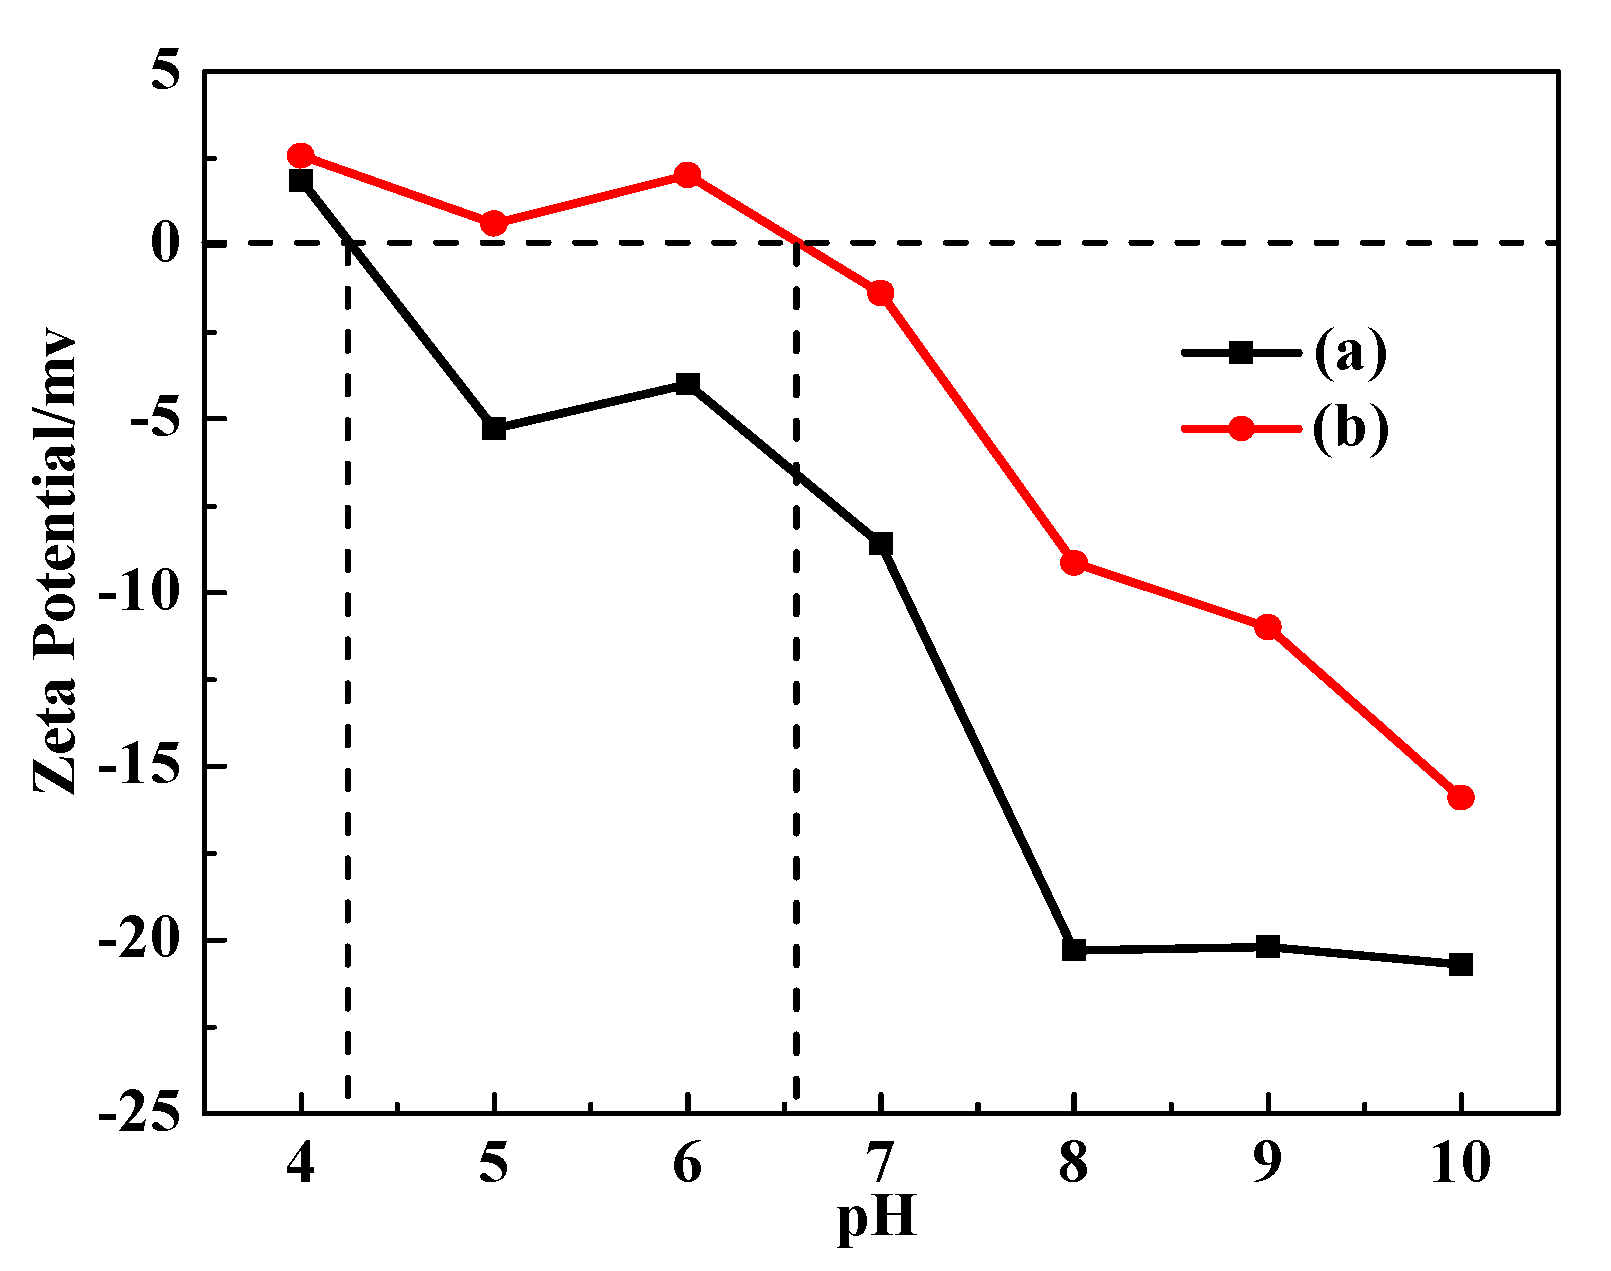
Figure 7 shows the difference in zeta potential between DG and CDG at different pH values. It can be observed that in the same pH range, the Zeta potential of the CDG was increased. This is because the DG fiber before modification had a large amount of electronegative -OH. The CDG fiber modified by the CTA introduced a large number of positively charged -N(CH3)3 groups, which consumed part of -OH on the DG fiber and reduced the total amount of -OH, resulting in electrical transformation, making the Zeta potential of CDG positive [55]. AY11 is an anionic dye with good affinity for cationic substances under the action of electrostatic adsorption. Therefore, CDG could adsorb AY11 by electrostatic force.

3.6. Adsorption of AY11 on CDG

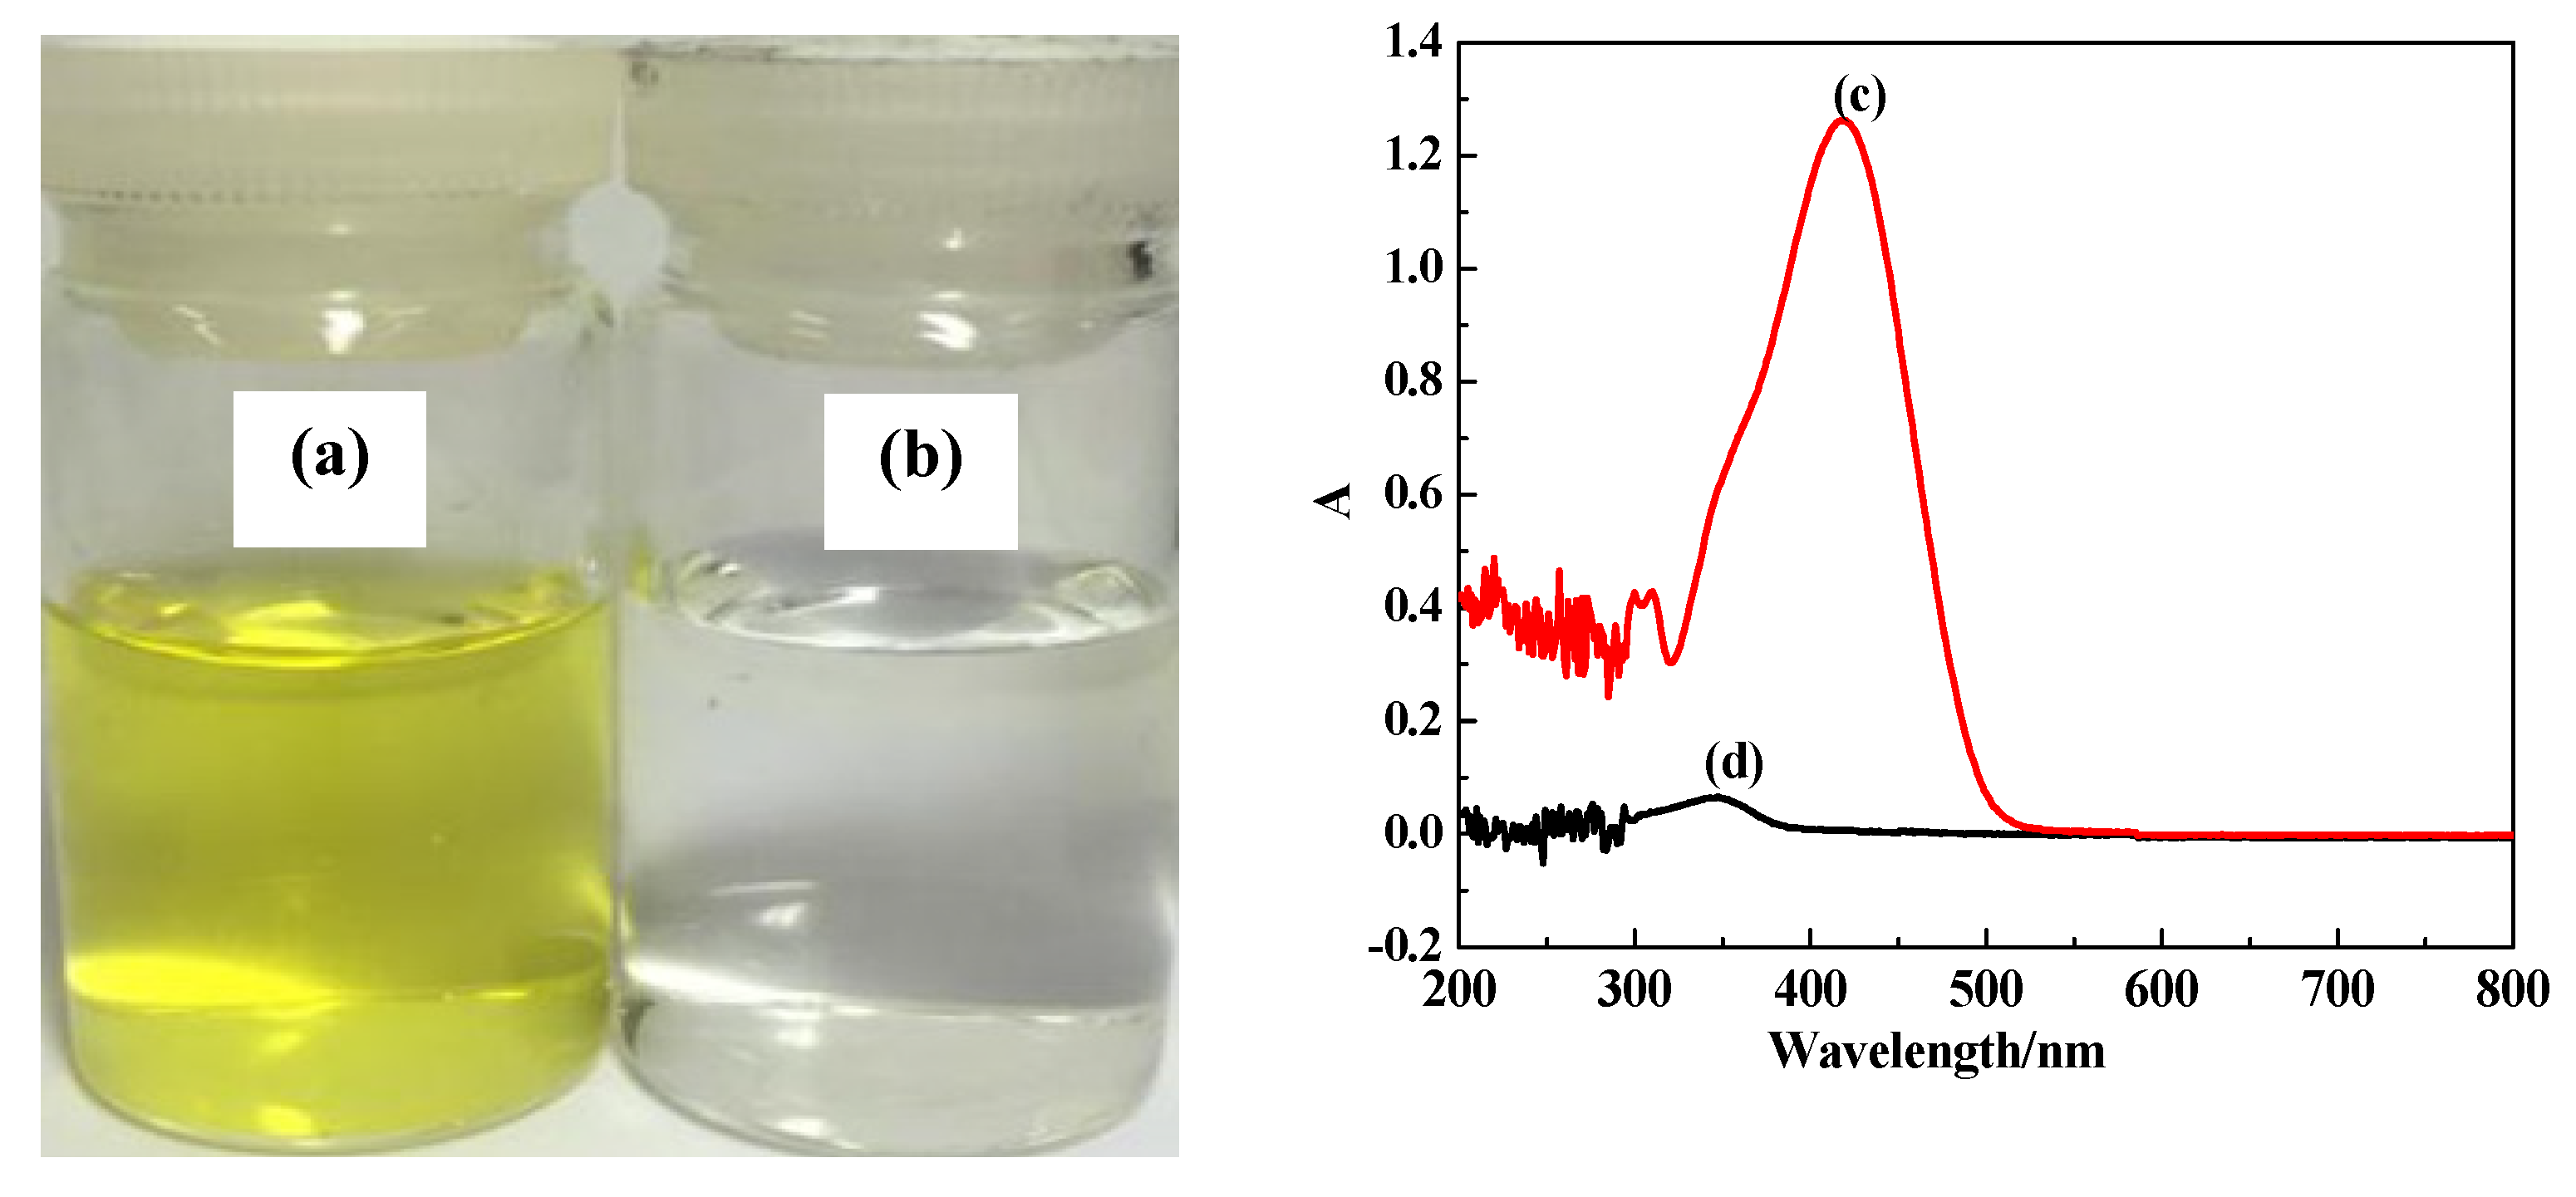
AY11 was used for adsorption tests at 30 °C. CDG adsorbed 100 mg/L of AY11 solution in 120 min, and the UV–Vis light scanned the solution before and after the adsorption process. The results and the UV–Vis spectrum analysis are shown in Figure 8.
From Figure 8a,b, it can be found that the solution after adsorption is almost colorless, and the adsorption rate of the dye was 98.76%; as the UV–Vis before adsorption and after adsorption was measured and the absorption peak of the AY11 solution at 417 nm disappeared after adsorption. This result indicates that the AY11 dye in the solution was almost entirely adsorbed, causing the characteristic absorption peak at 417 nm to disappear.

3.7. The Effect of Adsorption Conditions on Adsorption Performance

3.7.1. Adsorption Temperature

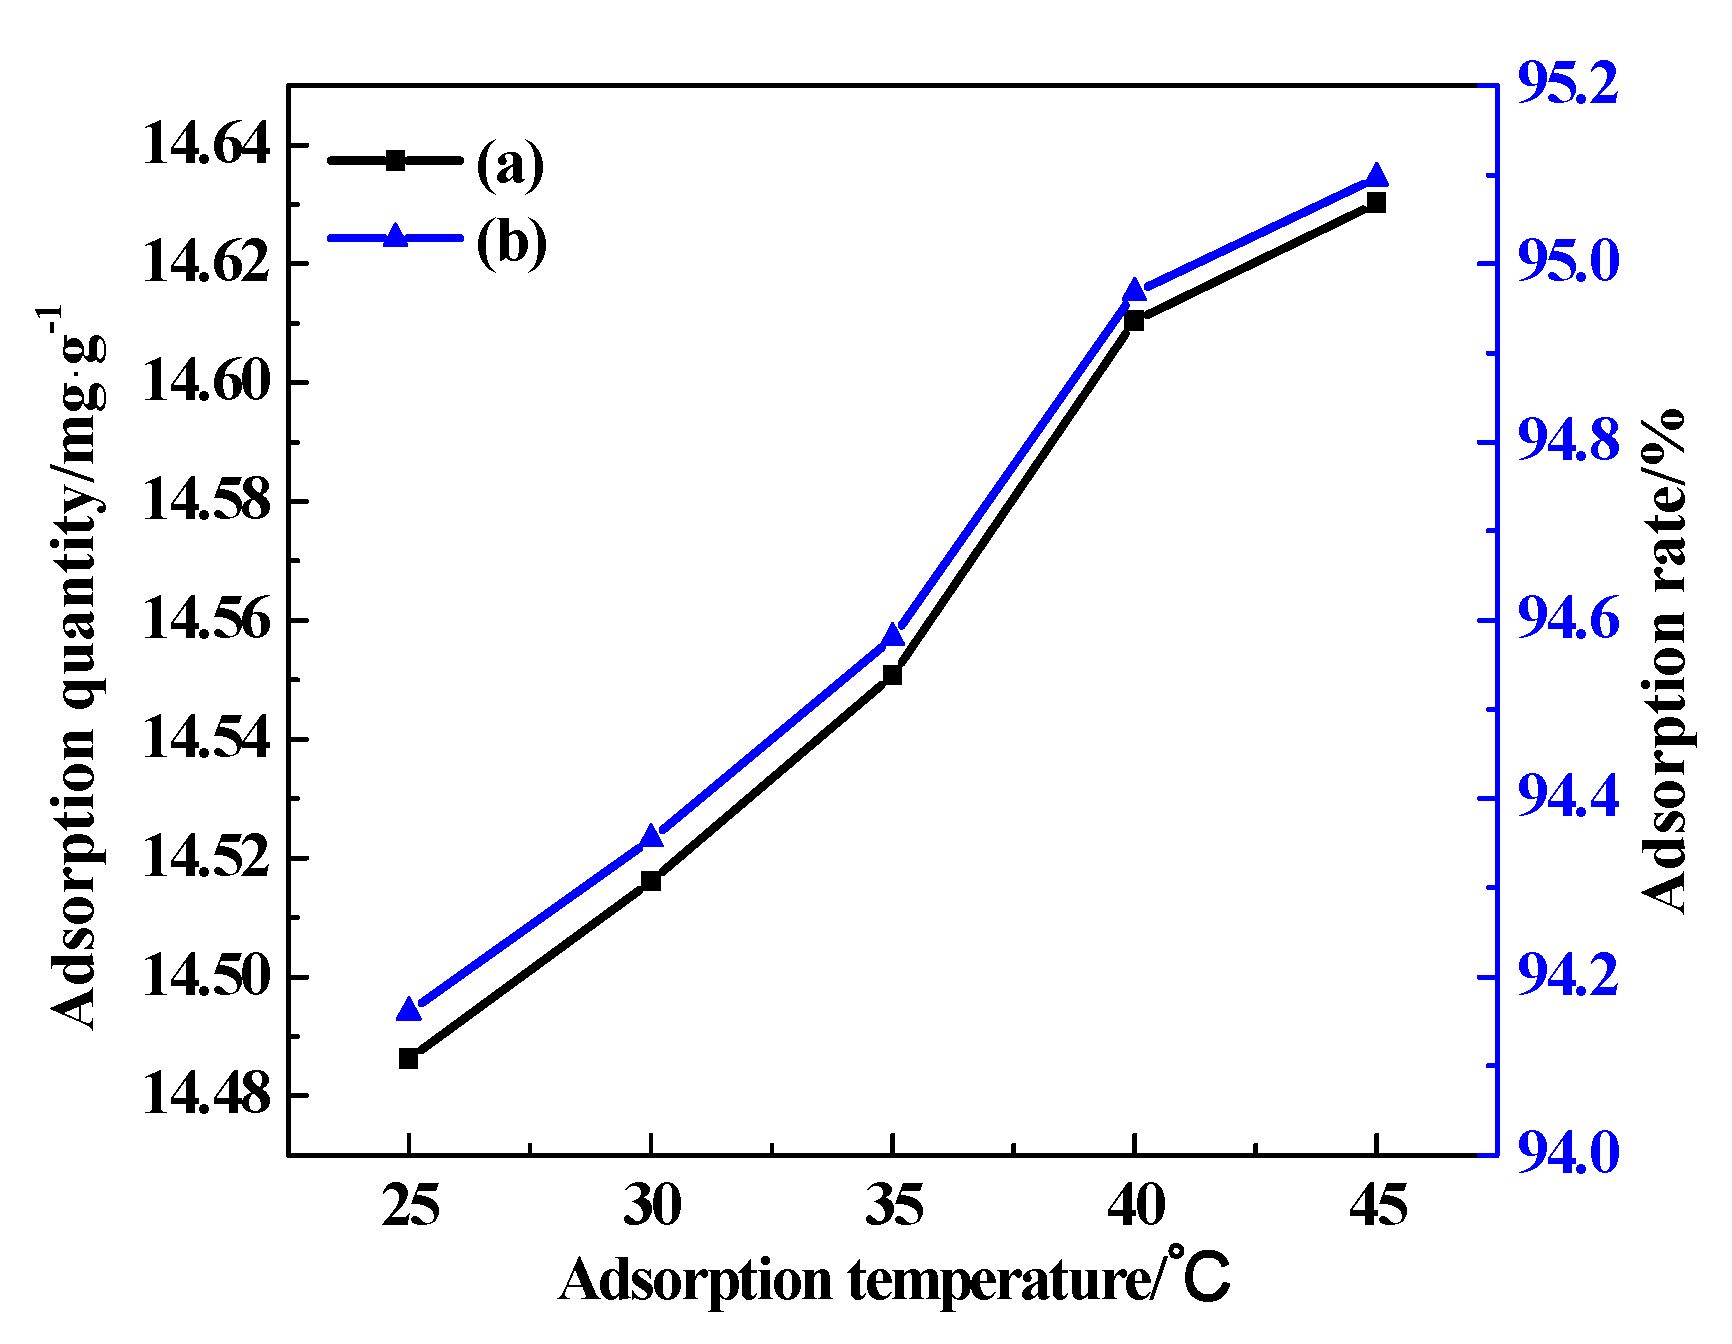
When the adsorption temperature was set at 25–45 °C, the adsorption time was 180 min, the mass of CDG was 6.5 g/L, the initial concentration of AY11 was 200 mg/L, and the pH of the solution was 7. The effect of the temperature on the adsorption performance of AY11 could be observed in Figure 9.
It can be seen from Figure 9 that with the increase in temperature, the adsorption removal rate and adsorption amount of AY11 on CDG increased, which proves that the adsorption process could be endothermic, and the increase in temperature is conducive to the adsorption process. However, as the temperature rises, the adsorption removal rate and adsorption amount of AY11 changes only moderately. Therefore, when using CDG to remove the dye from wastewater, the change in temperature of the wastewater will not have a significant effect on the removal rate. According to the actual sewage treatment applications, 25 °C was selected as the optimal adsorption temperature.

3.7.2. Adsorption Time

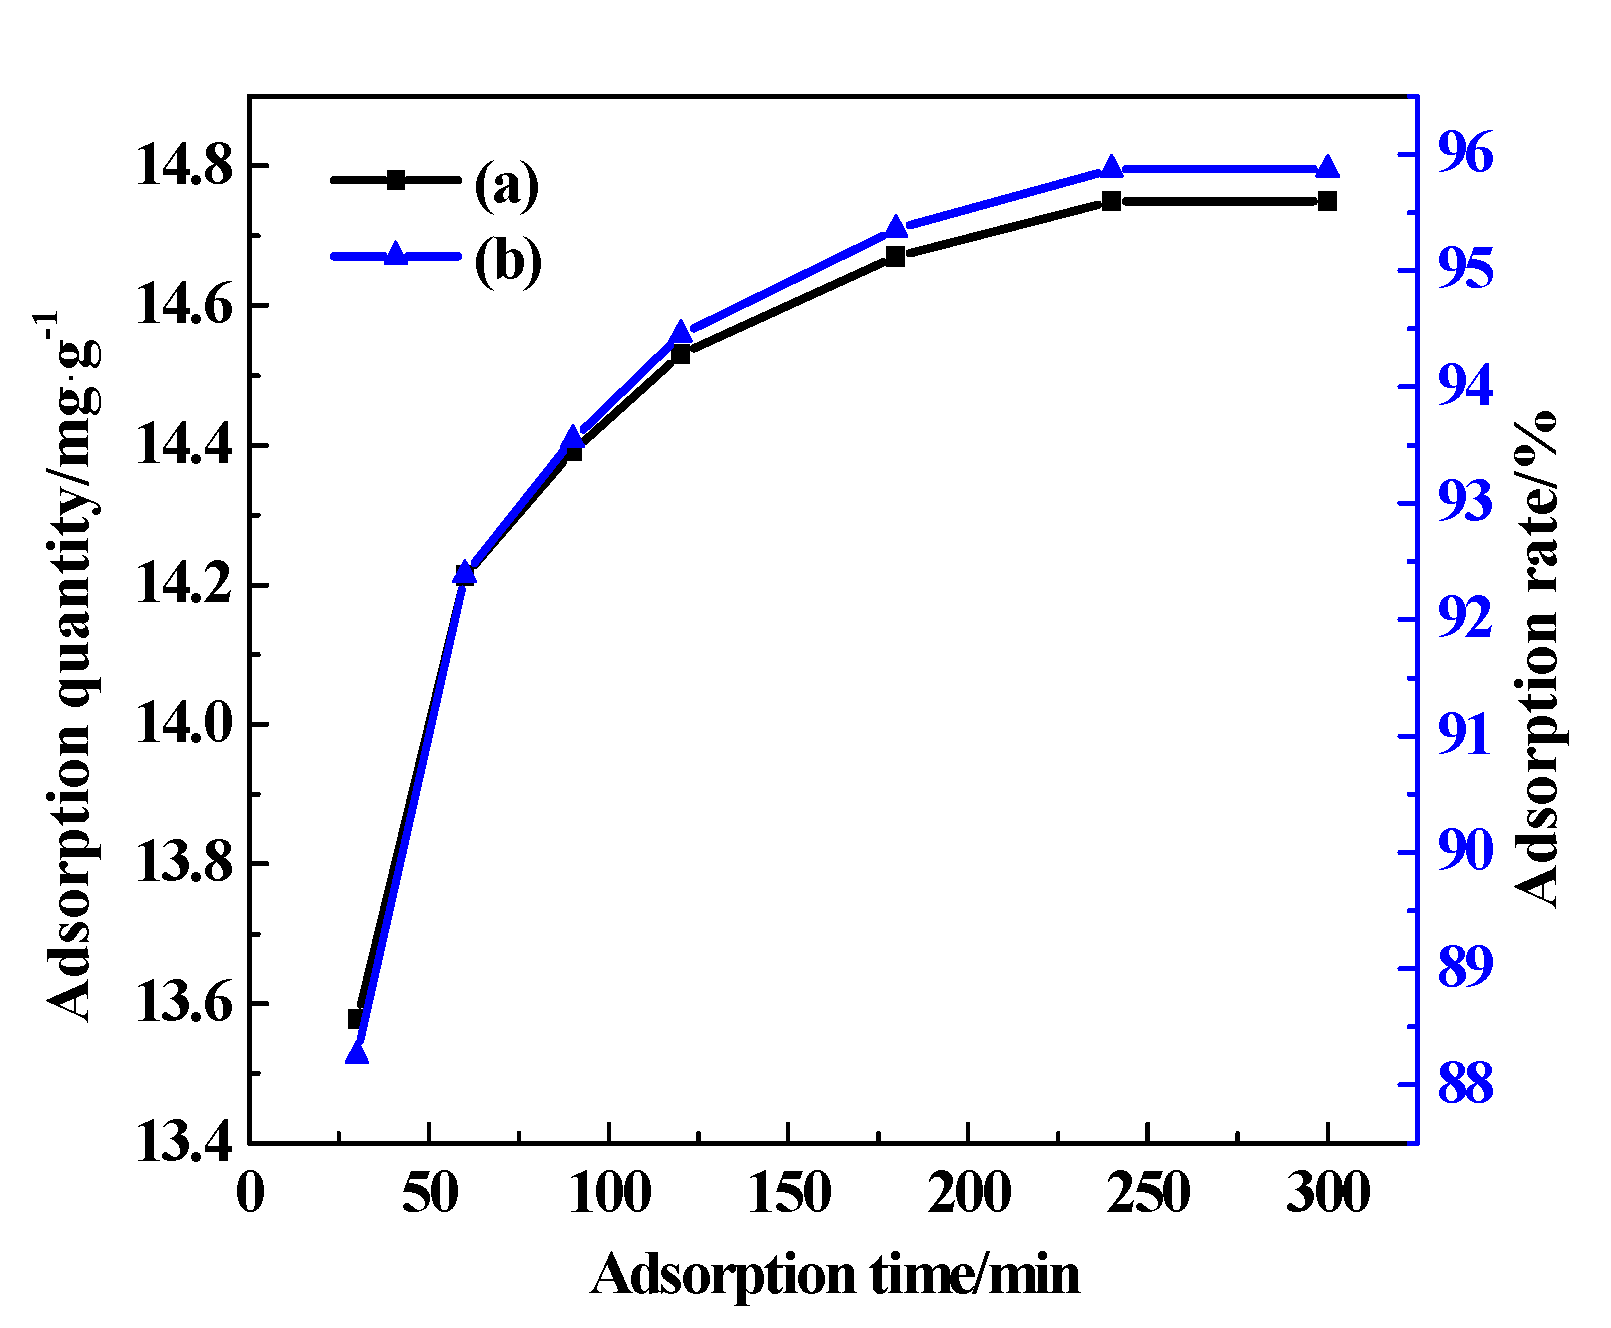
The effect of adsorption time on the adsorption performance of AY11 (adsorption temperature was set to 25 °C, the mass of CDG was 6.5 g/L, the initial concentration of AY11 was 200 mg/L, and the pH value of the was 7) are shown in Figure 10.
It can be seen that the removal rate increases rapidly in the initial stage. With the increase in adsorption time, the adsorption of AY11 gradually reached saturation. This is because, at the beginning of adsorption, a large number of free active sites on the surface of the adsorbent are available, but as the adsorption process progresses, the adsorption sites are gradually occupied, and the adsorption rate decreases [56]. On the other hand, as the adsorption time increases, AY11 needs to overcome a higher mass transfer resistance to enter into the interior of the CDG, which leads to a slower absorption rate in the later period. When the amount of adsorbed AY11 and the amount of desorption from the surface of CDG reach a dynamic balance, the adsorption time used in the state is called the equilibrium time [52]. Equilibrium time is often used to evaluate the affinity of the adsorbent toward the adsorbate.
It can be seen that the adsorption removal rate of AY11 by CDG increased with time, and the adsorption equilibrium was reached at 180 min when the removal rate was 94.44%. According to these results, 180 min was selected as the best adsorption time for further investigations.

3.7.3. Mass of CDG

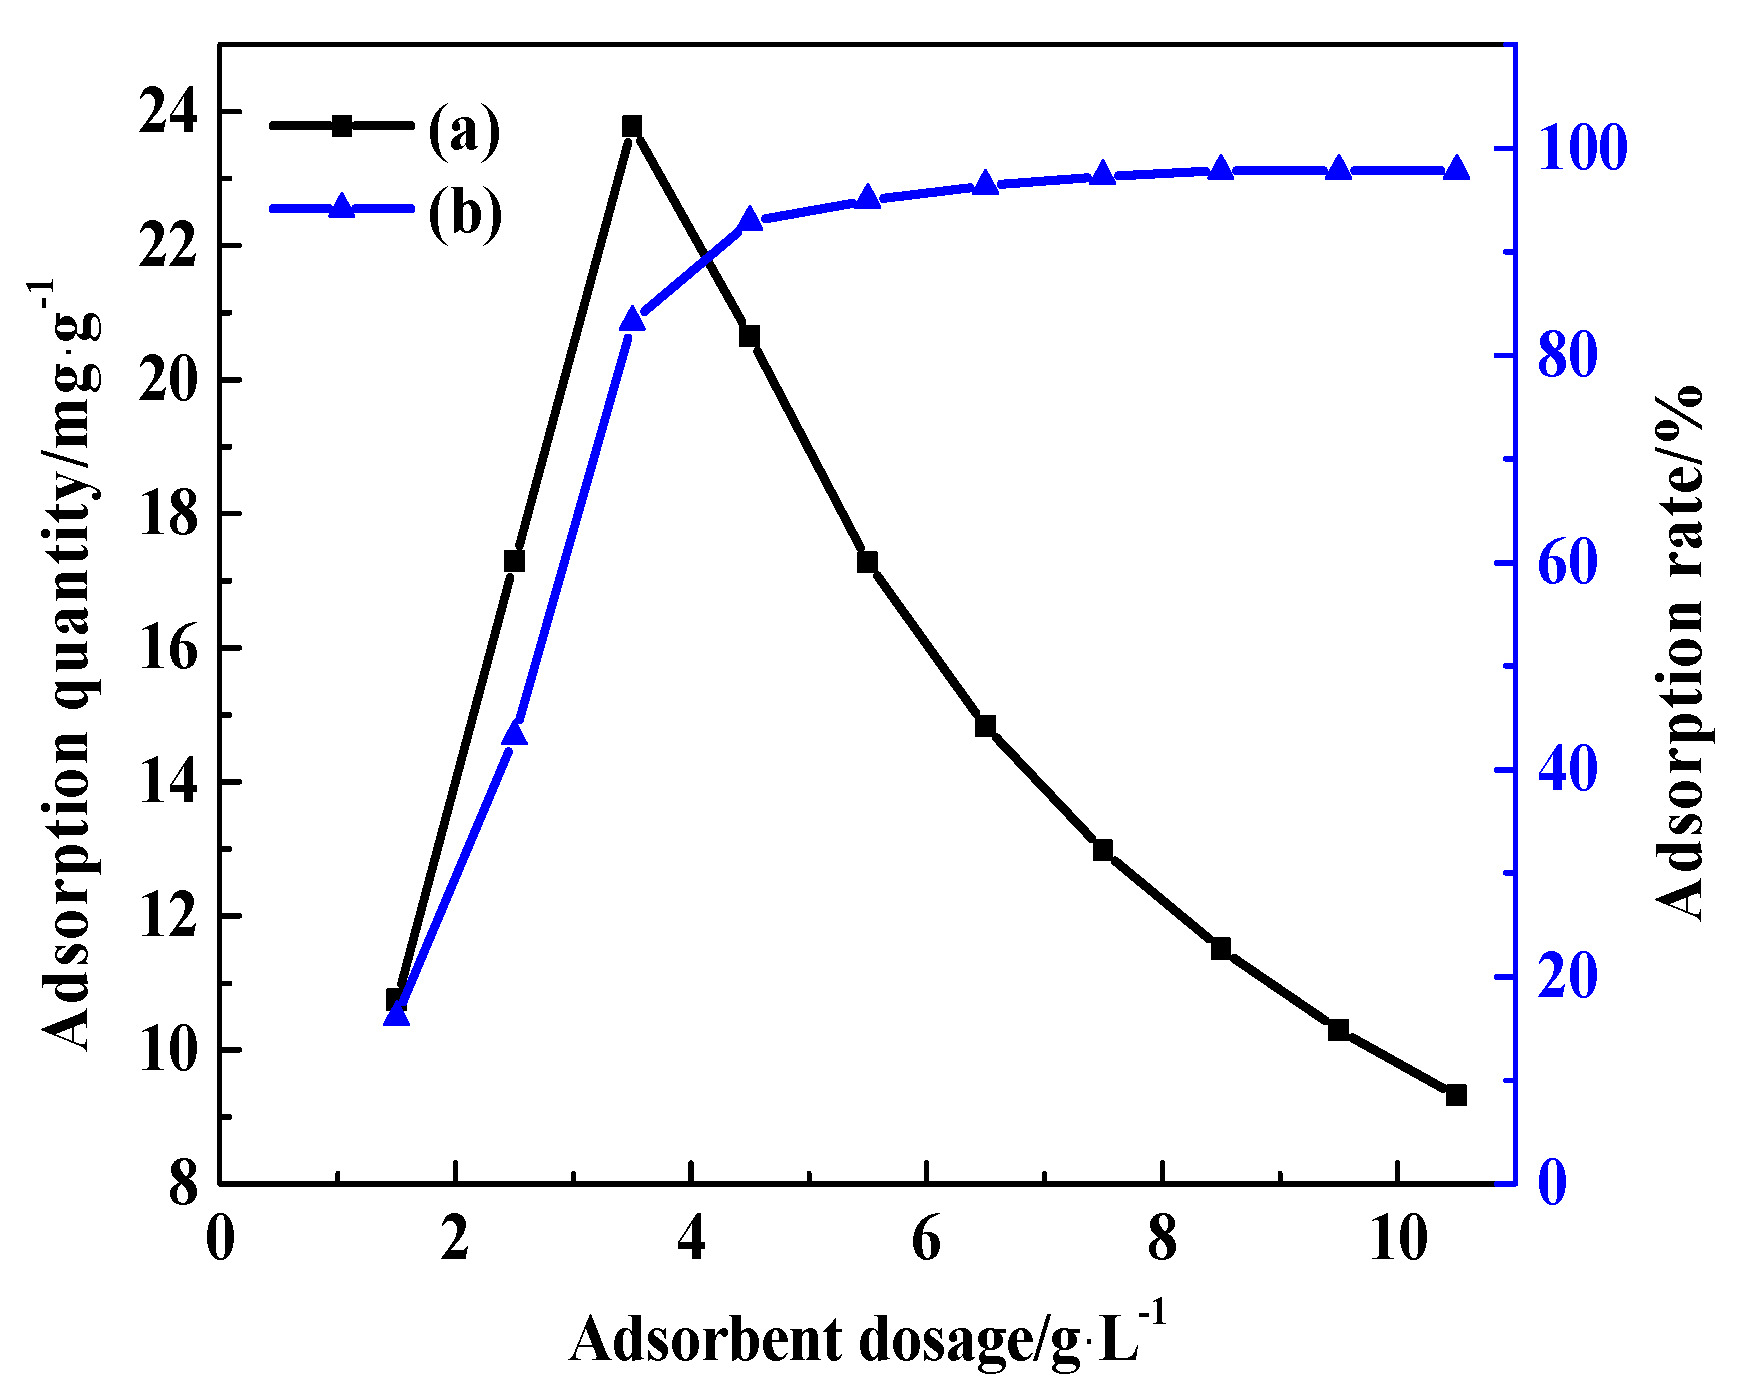
During the investigations of the mass of CDG (in the range of 1.5 g/L–10.5 g/L), the adsorption temperature was set to 25 °C, the adsorption time was 180 min, the initial concentration of AY11 was 200 mg/L, and the pH of the solution was 7. The effect of the mass of CDG on the adsorption performance of AY11 can be observed in Figure 11.
It can be seen from Figure 11 that with the increase in the mass of CDG, the adsorption rate of AY11 gradually increases. When the mass of CDG was 8.5 g/L, the adsorption reached equilibrium, while the adsorption amount first increased, and then gradually decreased. This could be attributed to the amount of added CDG, where the number of adsorption sites provided to AY11 increases, thereby increasing the adsorption/removal rate of AY11. At the same time, as the amount of added CDG increases, the CDG sheet agglomeration effect increases, the number of active adsorption sites decreases, and the amount of AY11 adsorbed per unit mass of CDG decreases, resulting in a decrease in total adsorption [57]. When the dosage was 8.5 g/L, the adsorption removal rate of AY11 reached 96.66%, but increasing the dosage to 10.5 g/L and the removal rate of AY11 did not change significantly. Therefore, the optimal amount of adsorbent for CDG to adsorb AY11 was found to be at 8.5 g/L.

3.7.4. Initial Concentration of AY11

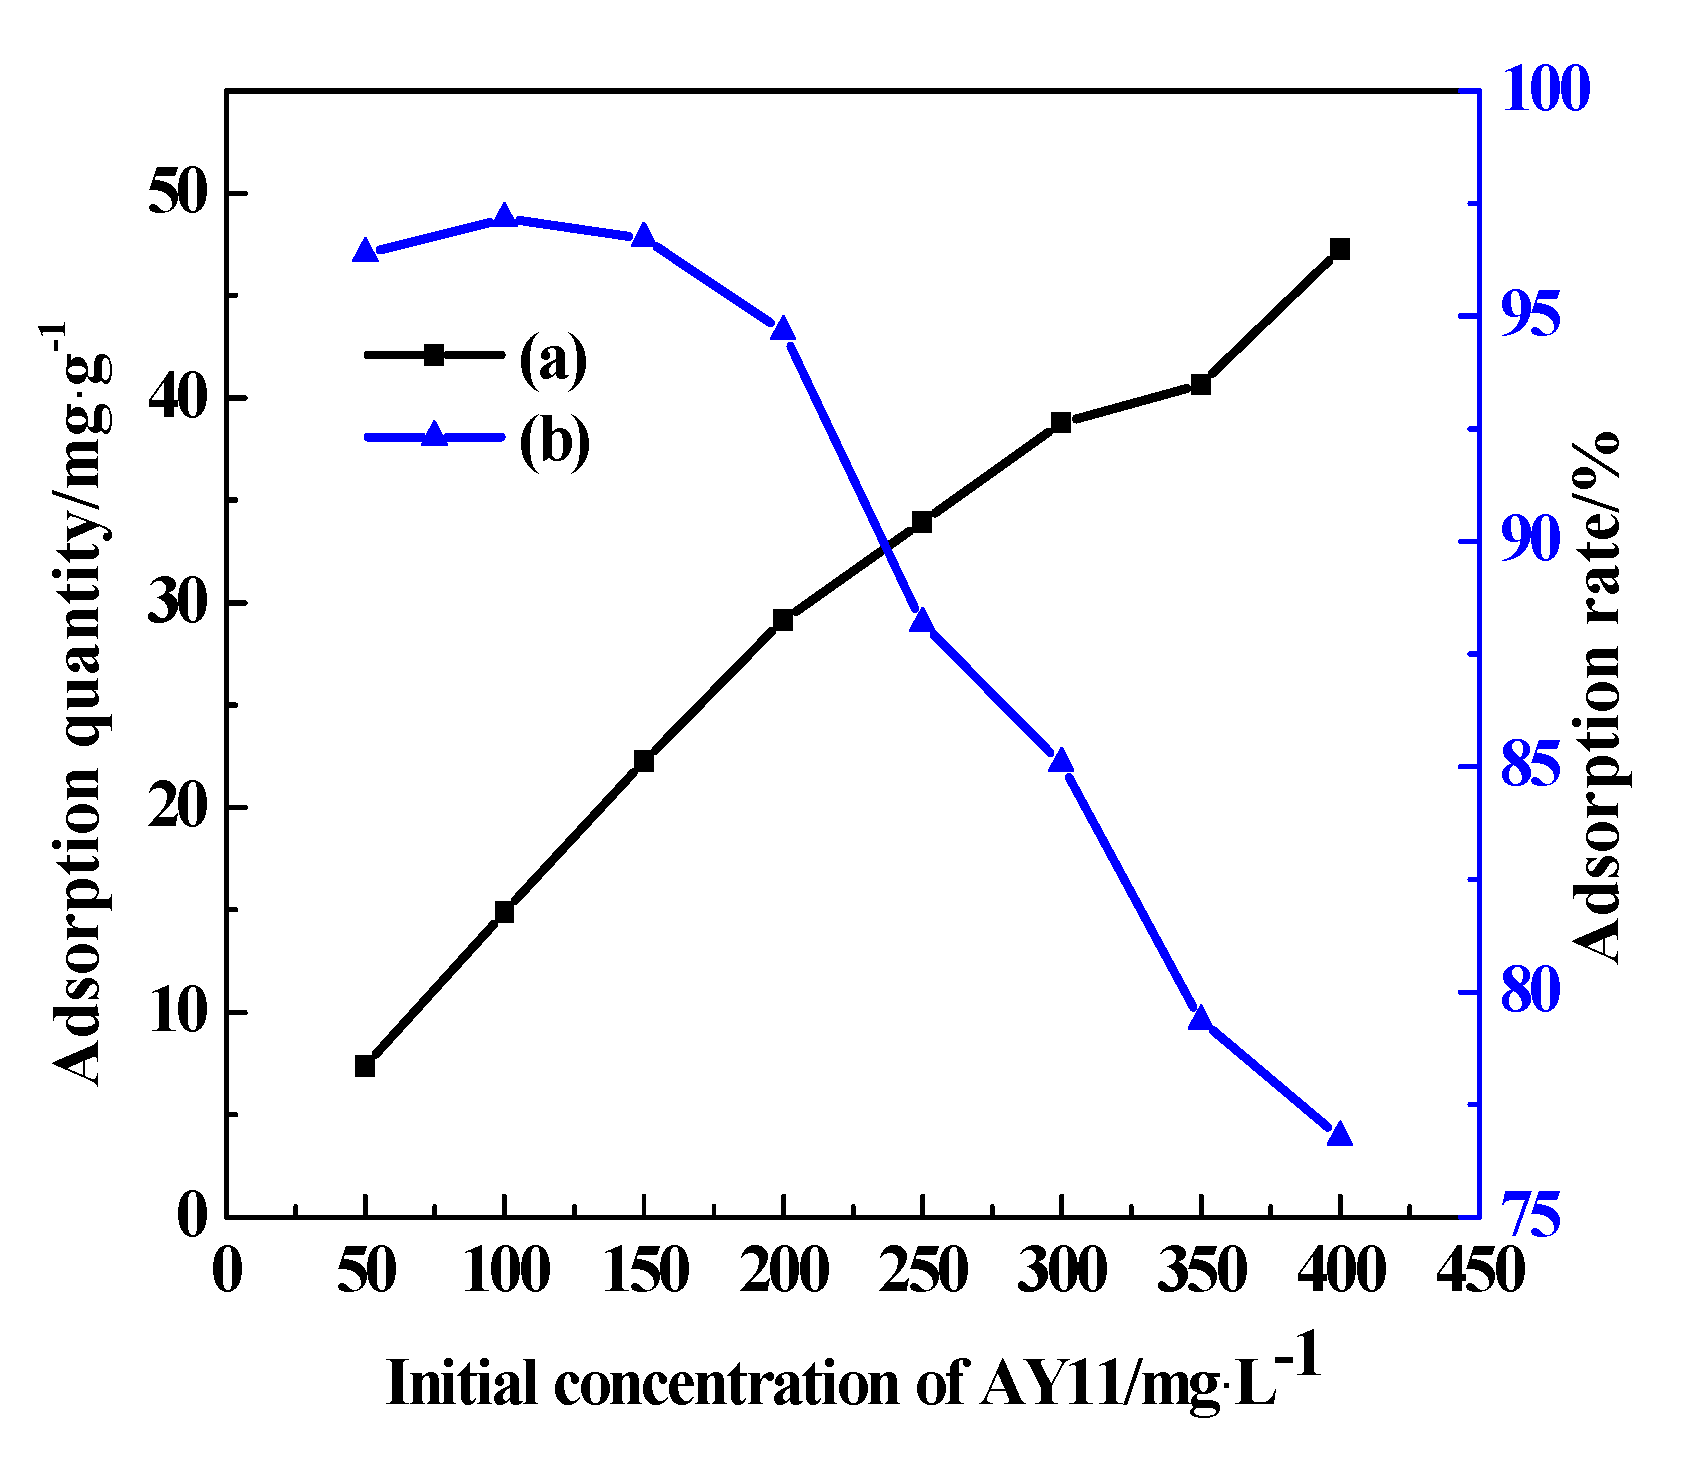
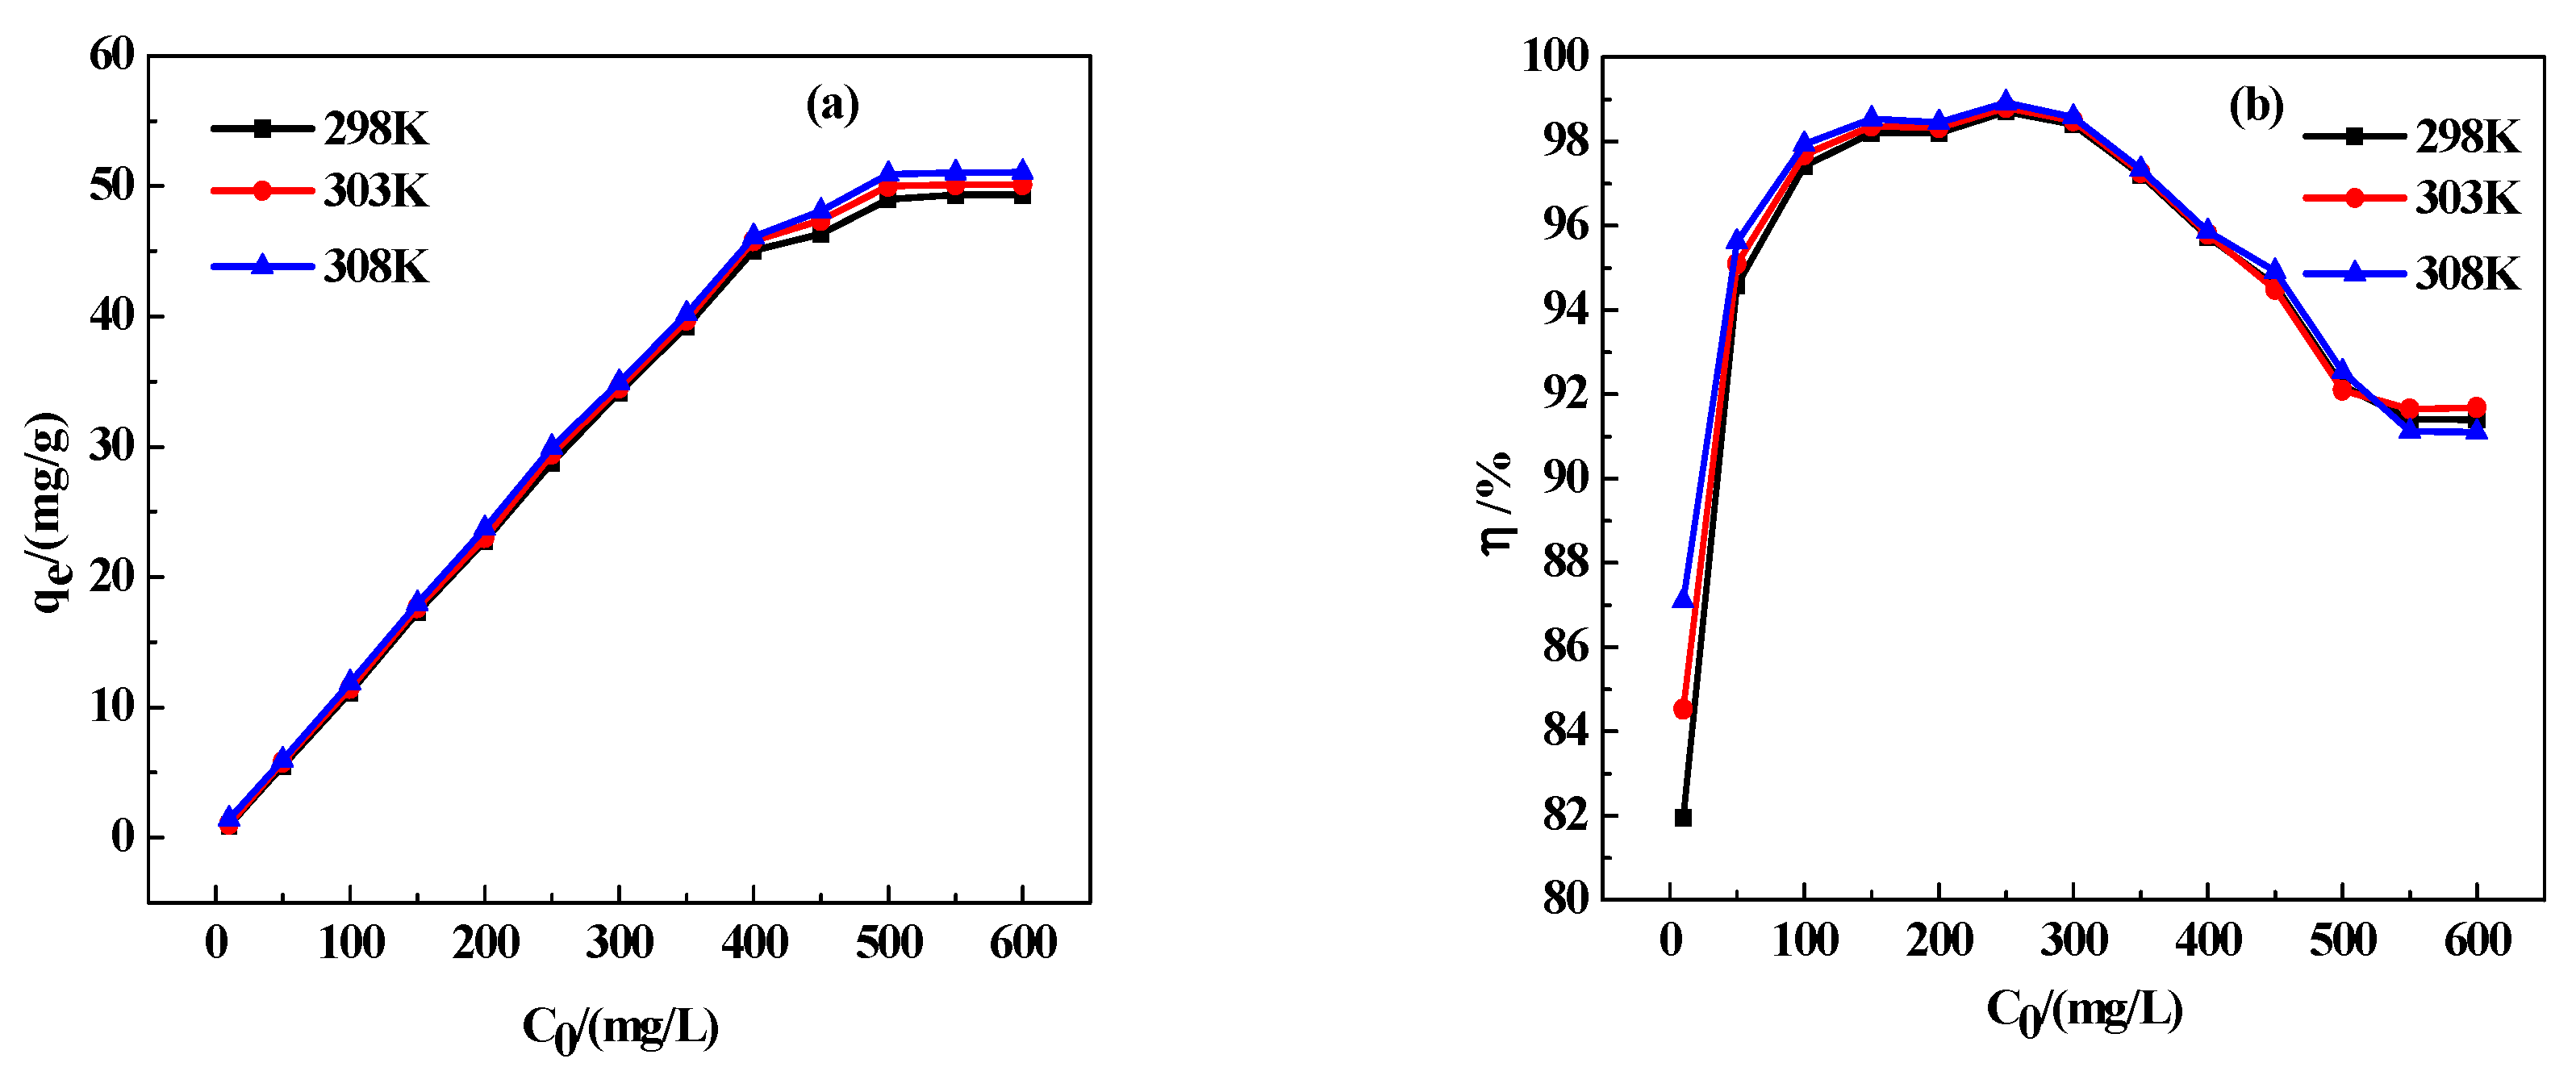
The effect of the initial concentration of AY11 was investigated in the range of 50–400 mg/L, when the adsorption temperature was set to 25 °C, the adsorption time was 180 min, and the pH of the solution was 7 (Figure 12).
At 298 K, 303 K, and 308 K, the effect of the initial concentration of AY11 on (Figure 13a) adsorption amount and (Figure 13b) adsorption removal rate is shown in Figure 14. As the concentration of the AY11 solution increased, the adsorption amount increased first and then tended to be stable, while the adsorption removal rate increased first and then decreased. As the initial concentration of AY11 increased, the mass transfer power between the adsorbent and the adsorbate increased, and the adsorption rate increased as more AY11 molecules occupied the adsorption sites on the surface of CDG. When the amount of adsorbent is fixed, the number of active adsorption sites is also fixed. With the increase in the initial concentration of the AY11 solution, the adsorption sites gradually reach a saturation level, and the adsorption removal rate gradually decreases.
As can be seen from Figure 12, with the increase in the initial concentration of AY11, the adsorption amount of CDG gradually increases, but the adsorption removal rate of AY11 gradually decreases. This could be attributed to the fact that when the initial concentration of AY11 is high, the concentration gradient (ΔC = C0 − Ce) increases [58], promoting the diffusion of AY11 to the surface and inside of CDG. This increases the probability of AY11 to bind to an adsorption site of CDG, leading to increasing adsorption capacity and resulting in limited adsorption sites in CDG. When the adsorption reaches its saturation, the excess AY11 restricts the spontaneous progress of the adsorption process [59], resulting in a decrease in adsorption removal rate.
Therefore, when the concentration range of AY11 is 50–100 mg/L, the treatment efficiency is the highest with the best applicability.

3.7.5. The Effect of pH

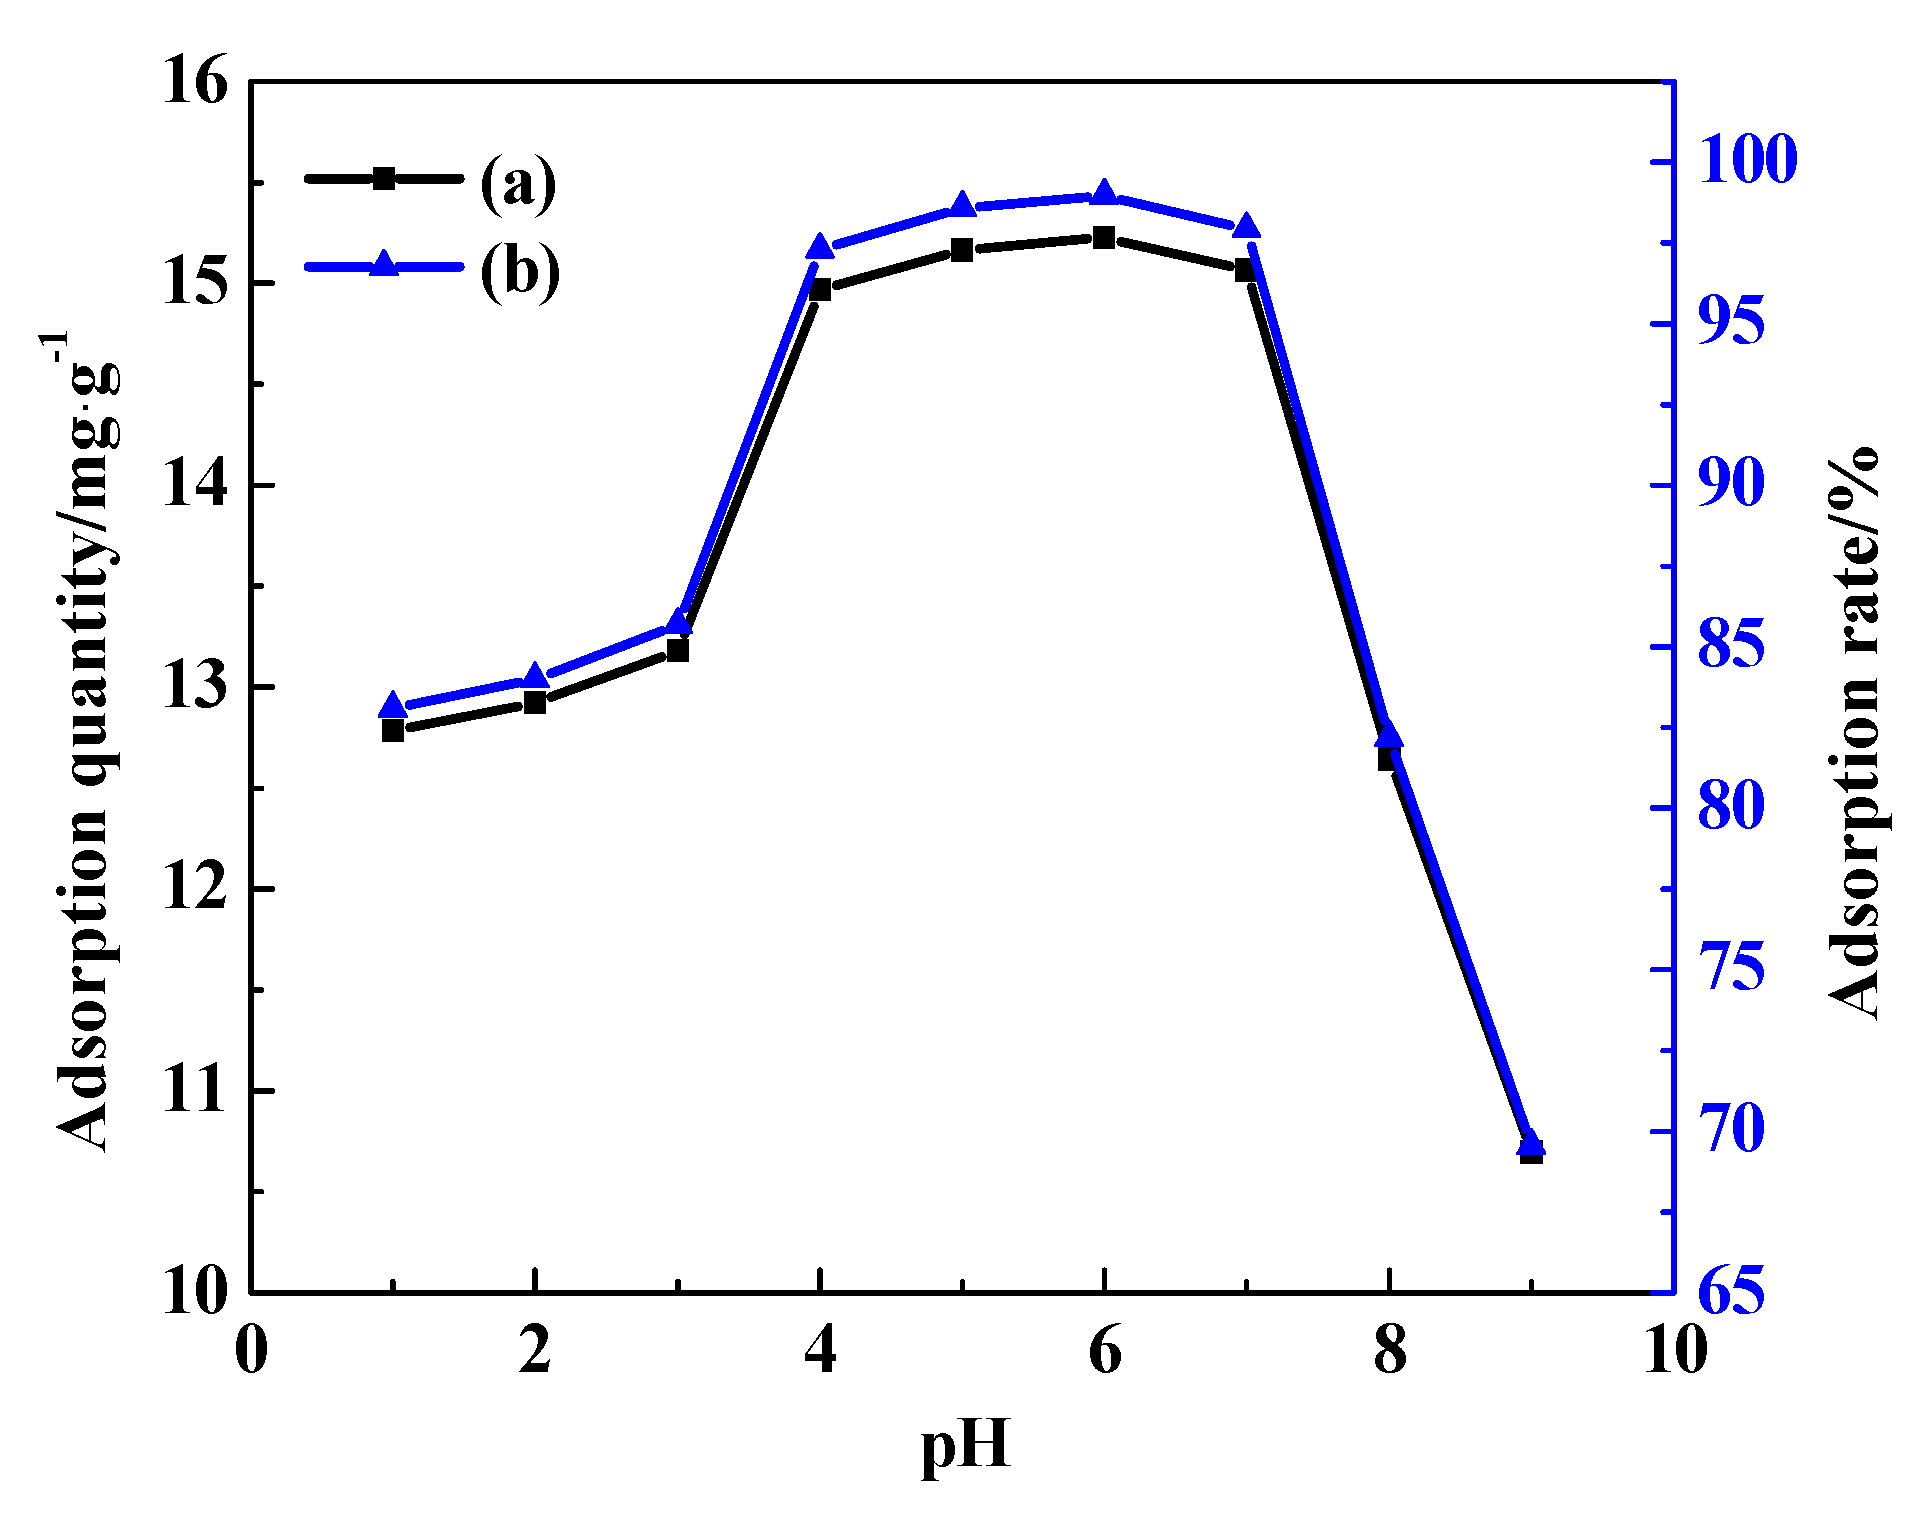
In order to verify the effect of pH toward the removal rate of AY11, the pH of the solution was varied between 1.0–9.0, with an adsorption temperature set to 25 °C, an adsorption time set to 180 min, and an initial concentration of AY11 being 200 mg/L. The effect of pH of AY11 solution on the adsorption performance of AY11 are shown in Figure 15.
As can be seen from Figure 15, when the pH of the AY11 solution is between 4.0 and 7.0, the adsorption removal rate of AY11 is basically above 95%, indicating that the adsorbent has a wide applicability range for the pH of the dye wastewater. When the initial pH of the solution decreased from 4.0 to 3.0, or increased from 7.0 to 9.0, the removal rate and adsorption amount both decreased rapidly. This is because under strong acid conditions, the higher the H+ concentration, the higher the corresponding concentration of Cl-, and a large amount of Cl− adheres to the surface of CDG to make it negatively charged, increasing the electrostatic repulsion between the adsorbent and the anionic dye AY11 [60], which prevents AY11 from being adsorbed. Similarly, at higher pH, due to the existence of OH- and the anionic dye, AY11 form a competitive relationship (the presence of OH- and anionic dye AY11 competing for the adsorption sites on CDG) [61], resulting in a rapid reduction in AY11. Therefore, considering the actual pH of the real wastewaters, the optimal initial pH for CDG adsorption of AY11 under these experimental conditions was set to 7.

3.8. Regeneration Performance

In the applicability of wastewater treatment, the low-cost, excellent adsorption efficiency, and renewable adsorbent materials could have significant advantages. Therefore, conducting regeneration experiments is of great significance. Treatment with NaOH solution could reduce the electrostatic interaction between CDG and the anionic dye and could desorb the dye.
The adsorption–desorption cycle of CDG with AY11 was repeated eight times (Figure 16). The adsorption and removal rate of AY11 dye decreased with the increase in cycle time. However, after the 8th adsorption–desorption experiment, the adsorption and removal rate of AY11 by the regenerated CDG still reached 81.80% of the initial results. This shows that CDG has a good regeneration ability, which has excellent application prospects in the treatment of actual dye wastewater.

3.9. Investigations of the Adsorption Mechanisms

The adsorption behavior is usually described by the adsorption model, which has important guiding significance for exploring the interaction mechanisms between the adsorbate and the adsorbent. According to the different ways and forces of interactions between the adsorbent and the adsorbate, the process could be roughly divided into two categories, namely physical adsorption [62] and chemical adsorption [63]. Physical adsorption mainly refers to the van der Waals forces between the adsorbent and the adsorbate, while chemical adsorption mainly plays a role in the chemical bonding force between the adsorbent and the adsorbate. The kinetic model and thermodynamic adsorption model are used to nonlinearly fit the experimental data and analyze the fitting parameters to explore the adsorption mechanism [64].

3.9.1. Adsorption Kinetics

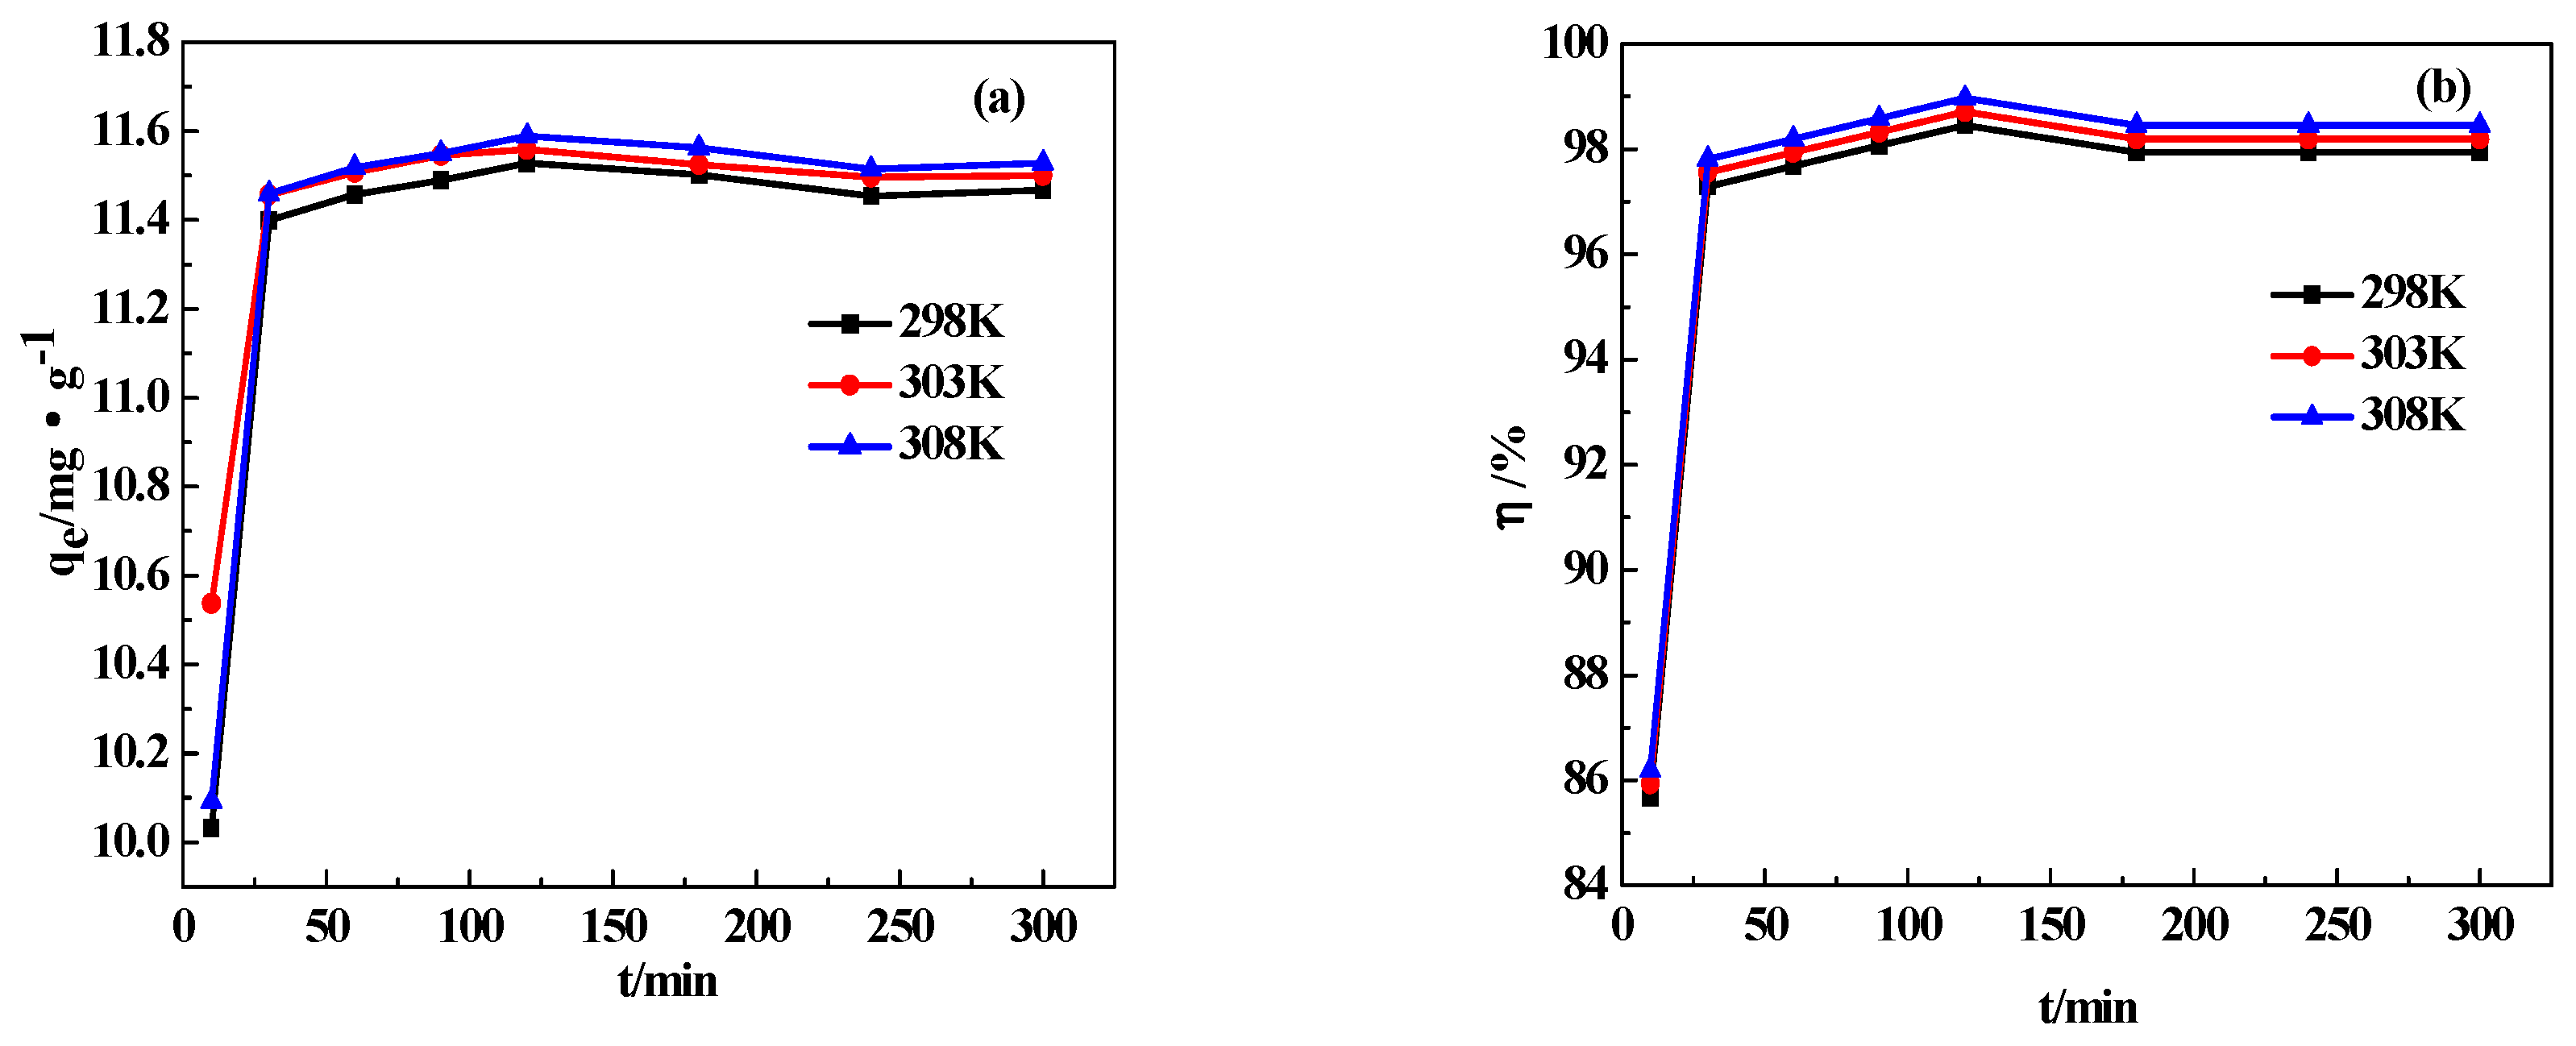
In order to determine the optimal adsorption time, adsorption experiments were carried out at 298, 303 and 308 K, at 10, 30, 60, 90, 120, 180, 240 and 300 min, respectively. The concentration of CDG and AY11 was 8.5 g/L and 100 mg/L, the pH of the AY11 solution was 6.0. The relationship between time and adsorption performance during the adsorption of AY11 on the CDG substrate is shown in Figure 17.
As can be observed, in different adsorption periods, the adsorption amount and adsorption removal rate of AY11 by CDG increased with the increase in adsorption time, and the adsorption amount slowly increased and tended to balance when the adsorption time ≥ 240 min The adsorption capacity was 38.19 mg/g1, and the maximum adsorption removal rate was 96.51%. In the initial stage, the concentration gradient of AY11 and the surface of CDG is significant, and there are many adsorption sites on the surface of CDG, and the adsorbate molecules could easily bind with the adsorbent. With the increase in adsorption time, AY11 needs to overcome the mass transfer resistance to enter into the interior of CDG, which reduces the removal rate. With the increase in adsorption time, the adsorption of AY11 gradually reaches its saturation.
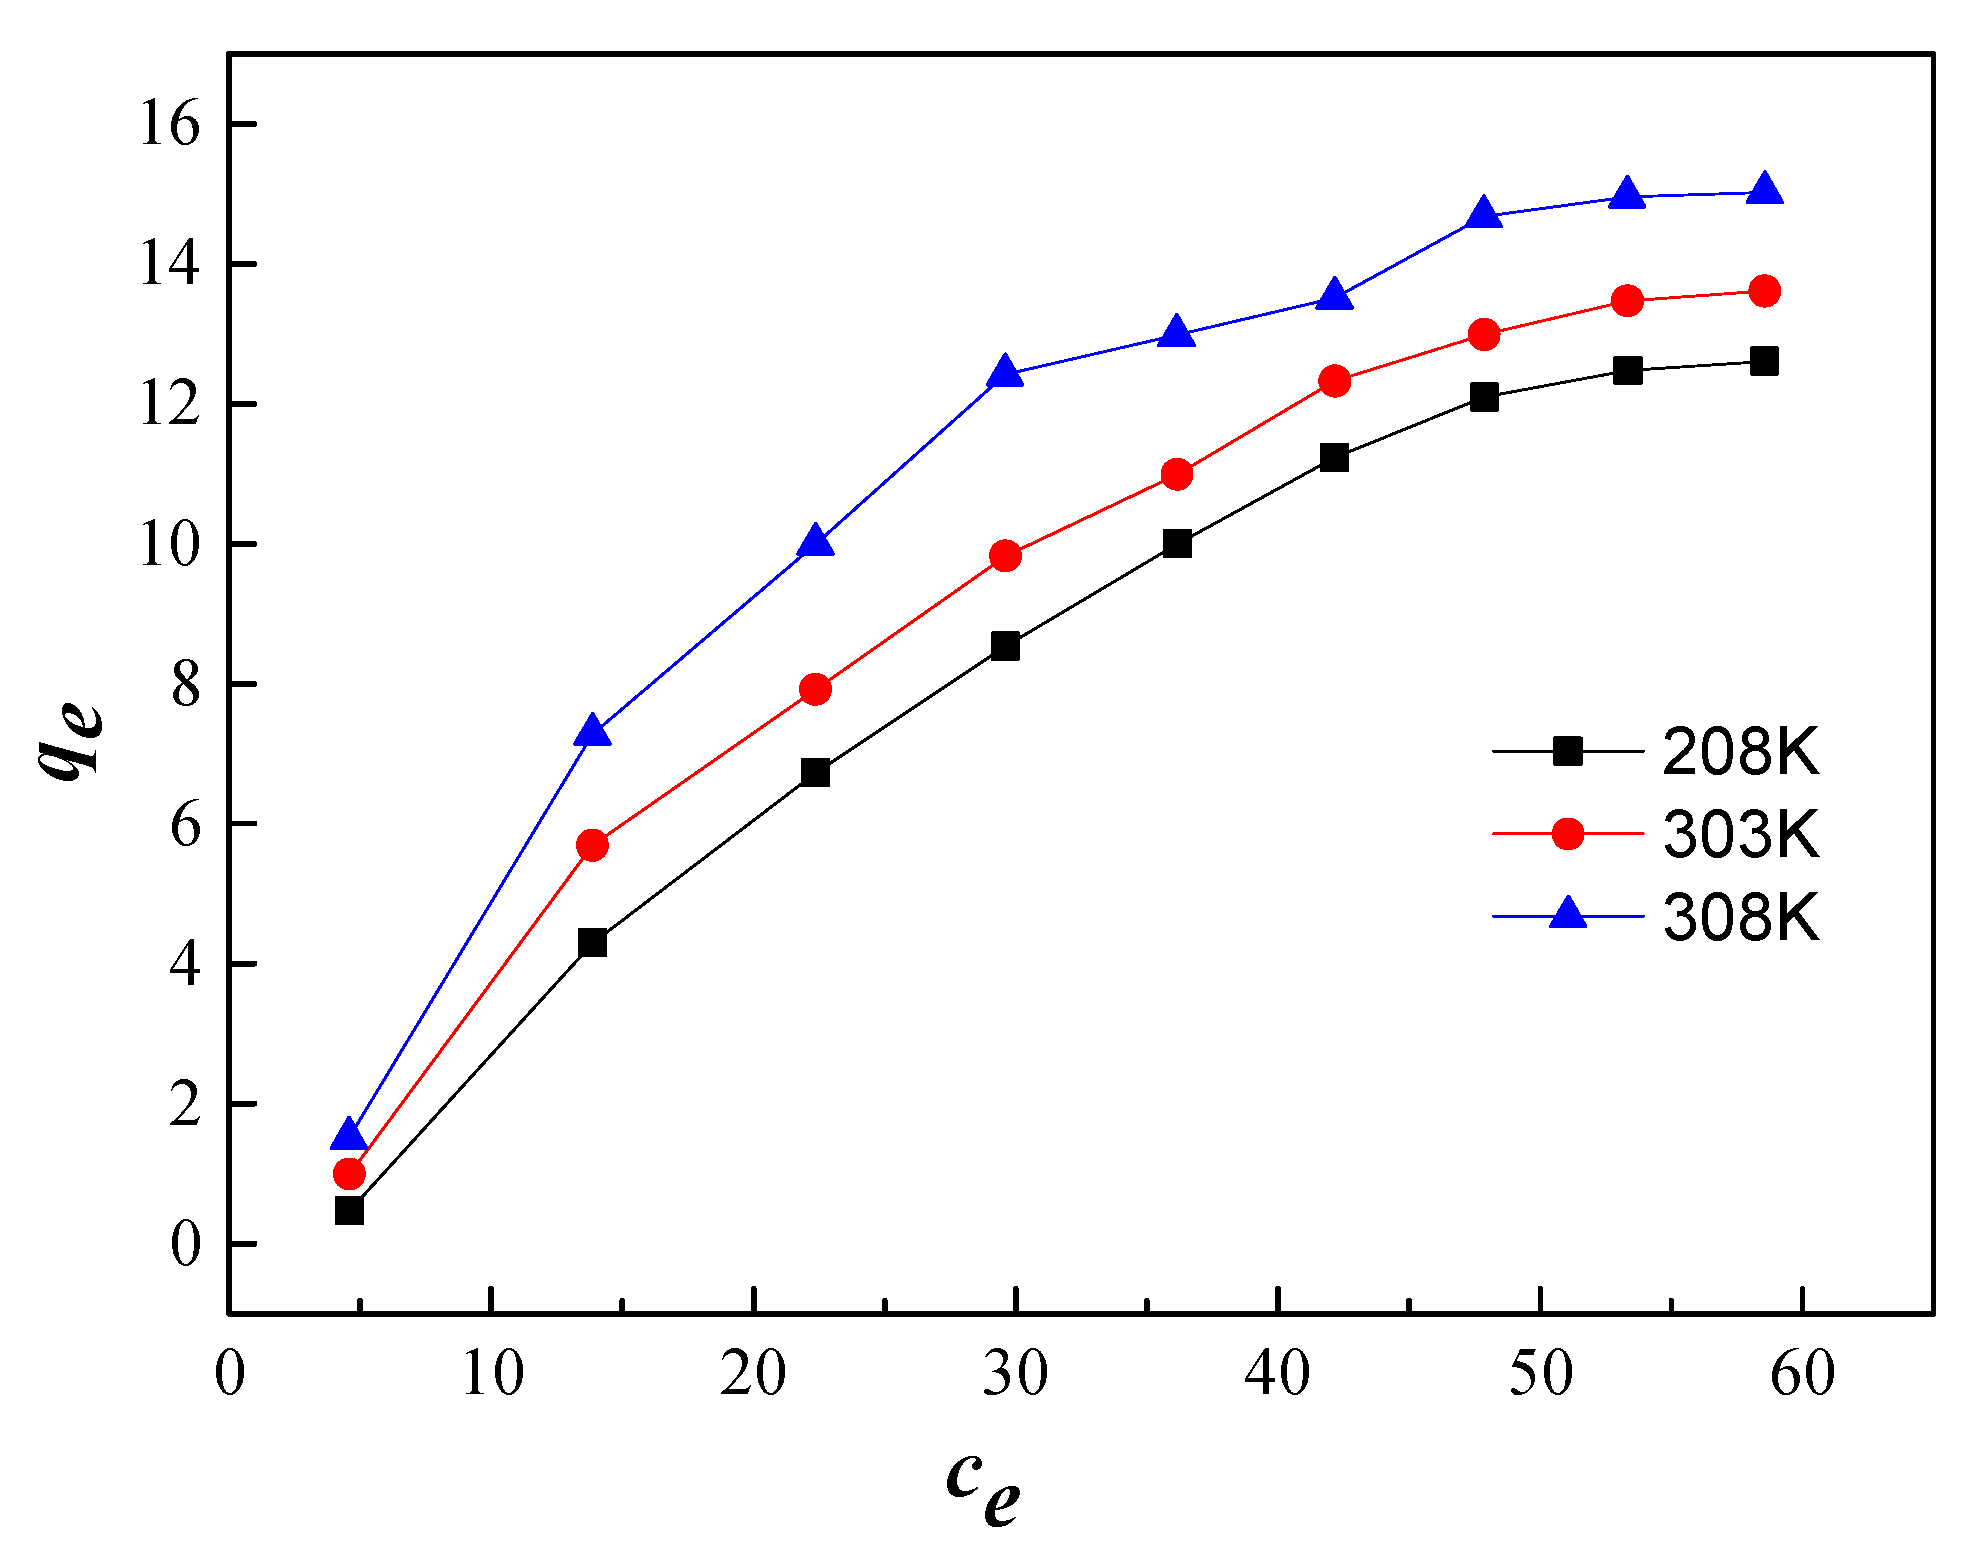
The adsorption isotherm reflects the distribution of the solid-phase and liquid-phase when the solute molecules adsorbed at a certain temperature when reaching equilibrium on the two phases interface. The adsorption isotherm of CDG for AY11 at different temperatures is shown in Figure 14. The figure shows that when the initial concentration of AY11 increases within a certain range, the equilibrium concentration of AY11 molecules in CDG and solution shows an increasing trend after attaining the adsorption equilibrium. When the amount of Ay11 molecules in the solid phase CDG reaches a certain value, the adsorbate was no longer distributed into the adsorbent, but distributed into the liquid phase, indicating that the adsorbent reached adsorption saturation. The distribution of adsorbate into the adsorbent increases while elevating the temperature, and the equilibrium adsorption of Ay11 by CDG increased continuously because the diffusion rate of AY11 molecules into the CDG increased continuously with the increase in temperature, indicating that the adsorption of AY11 was an endothermic process.
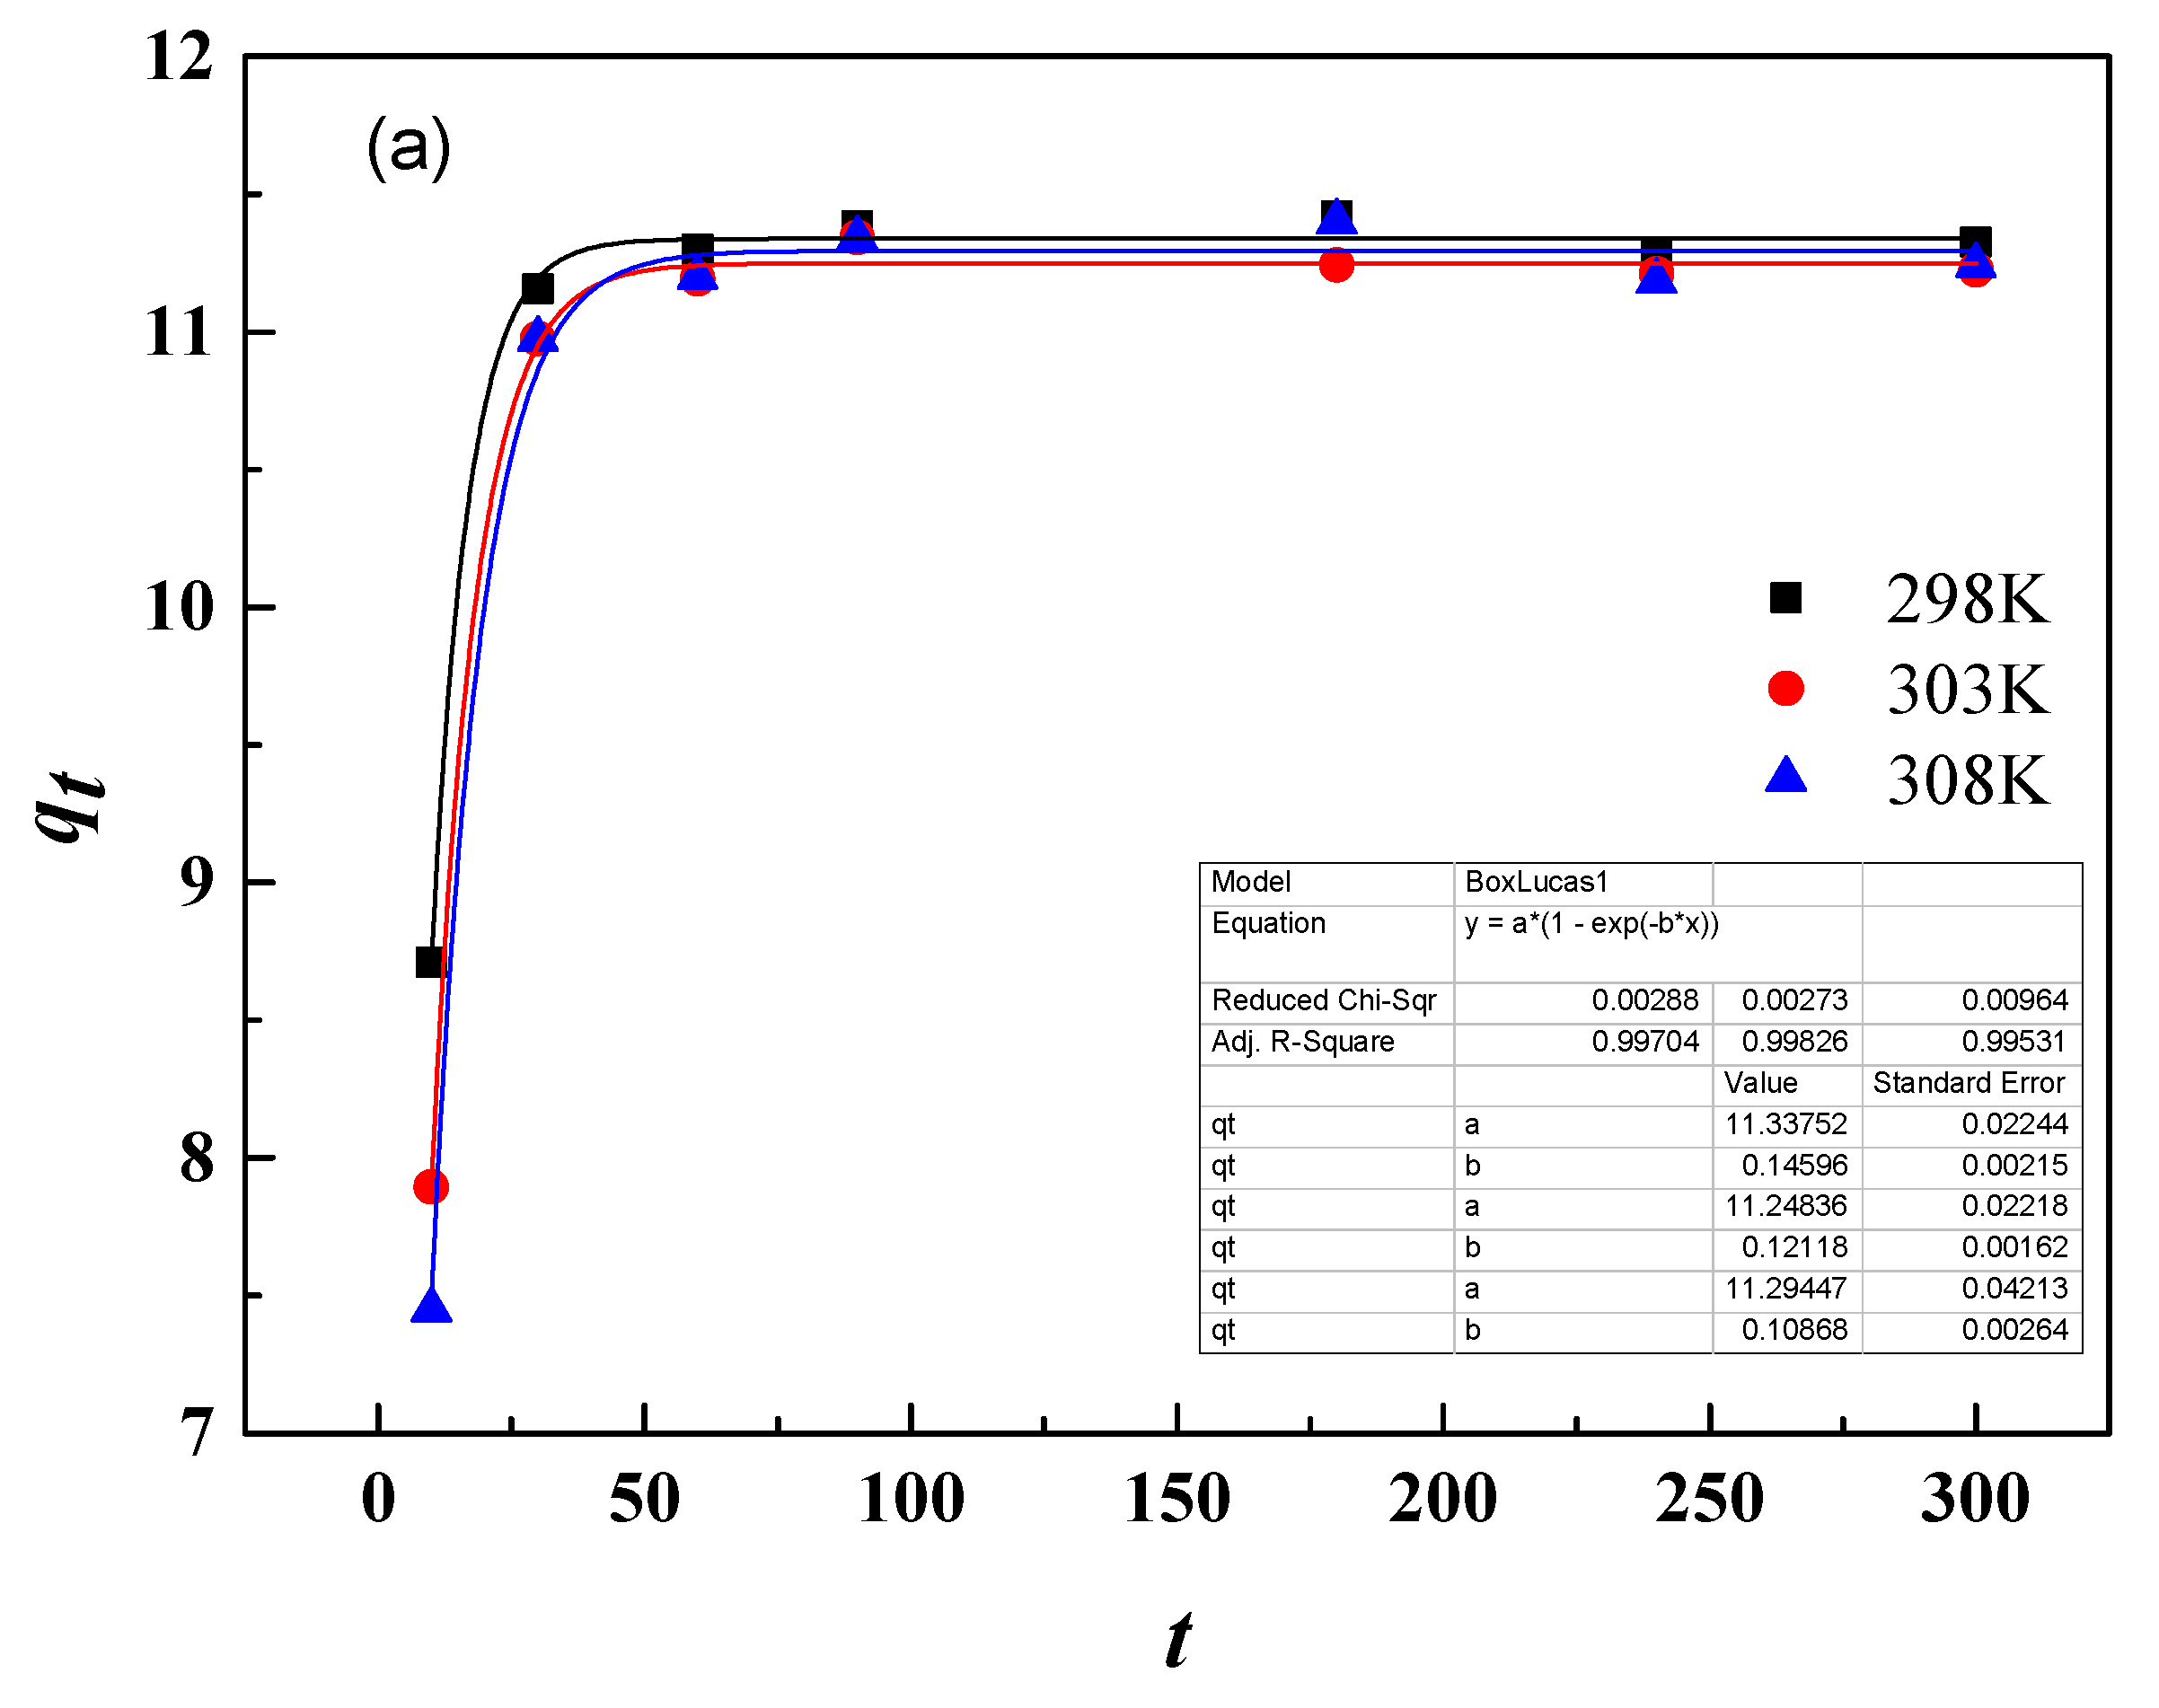
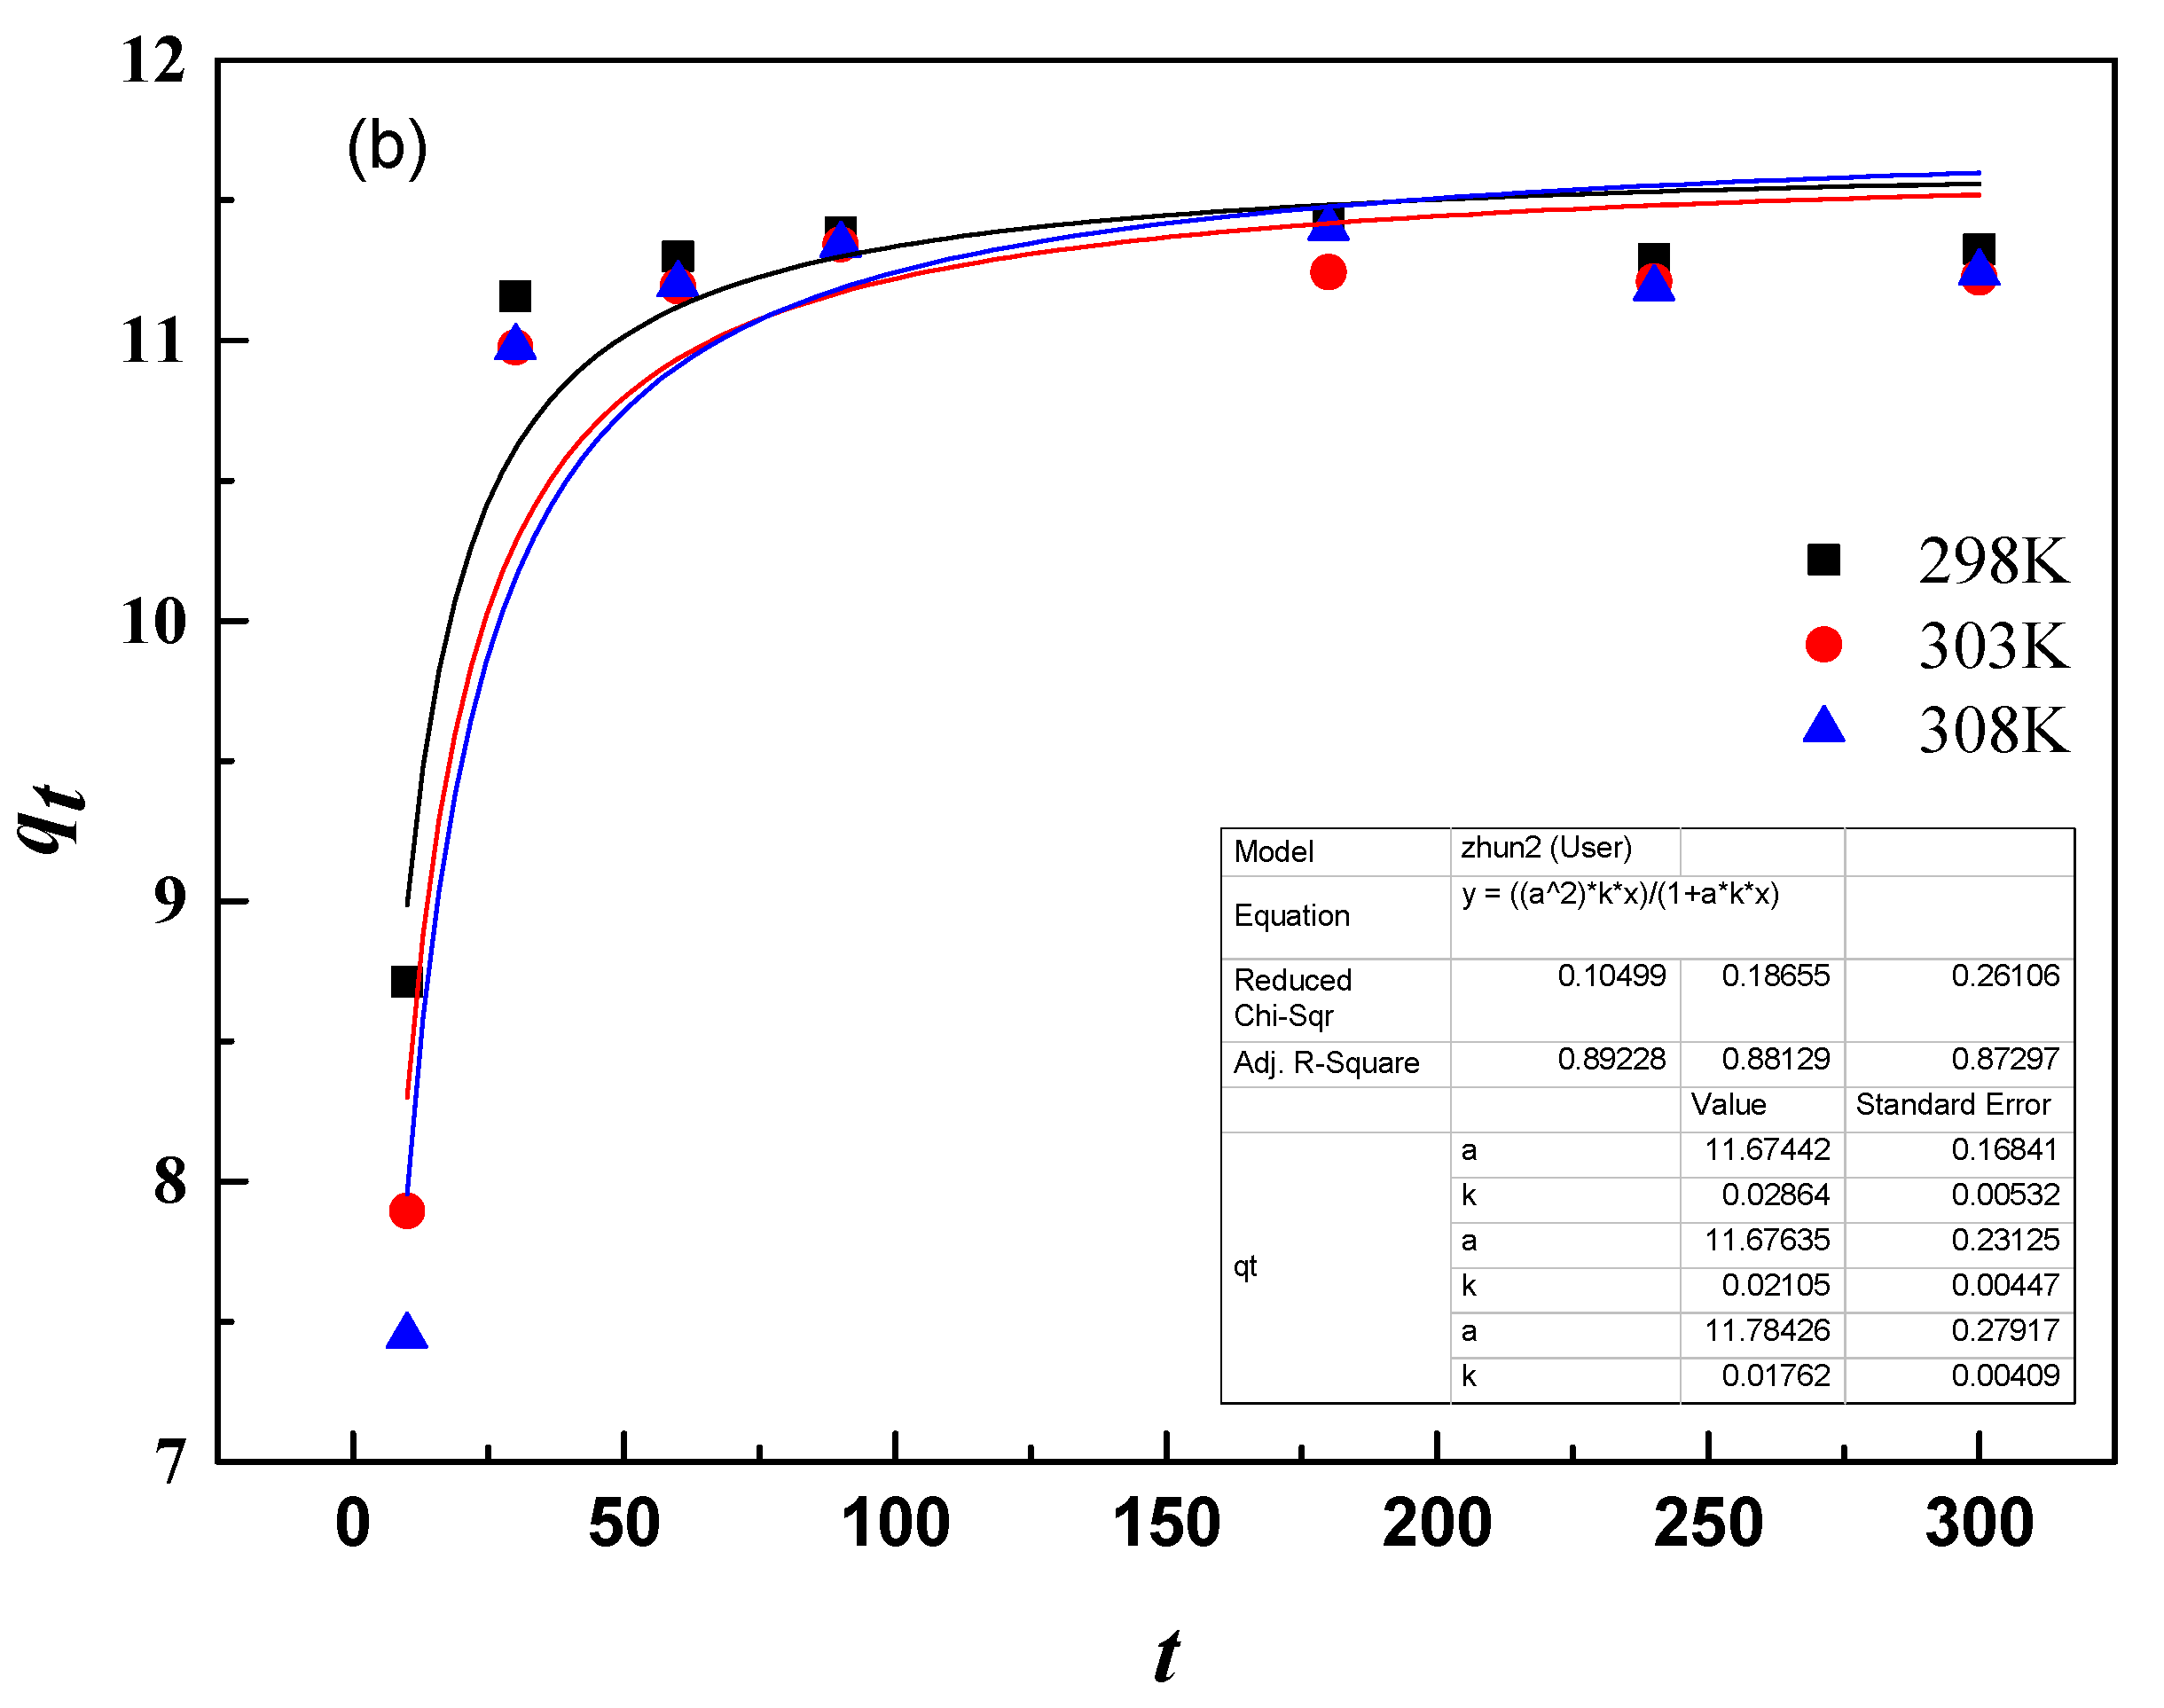
It can be seen from Figure 18 that the adsorption of AY11 dye onto CDG conforms to the quasi-first-order kinetic model, and from Table 3, the correlation coefficient of the quasi-first-order kinetic model, namely R2 > 0.99, and the adsorption rate constant k1 with temperature can be observed, which shows that there is a chemical bond between the adsorbent and the adsorbate [65].

3.9.2. Adsorption Isotherm

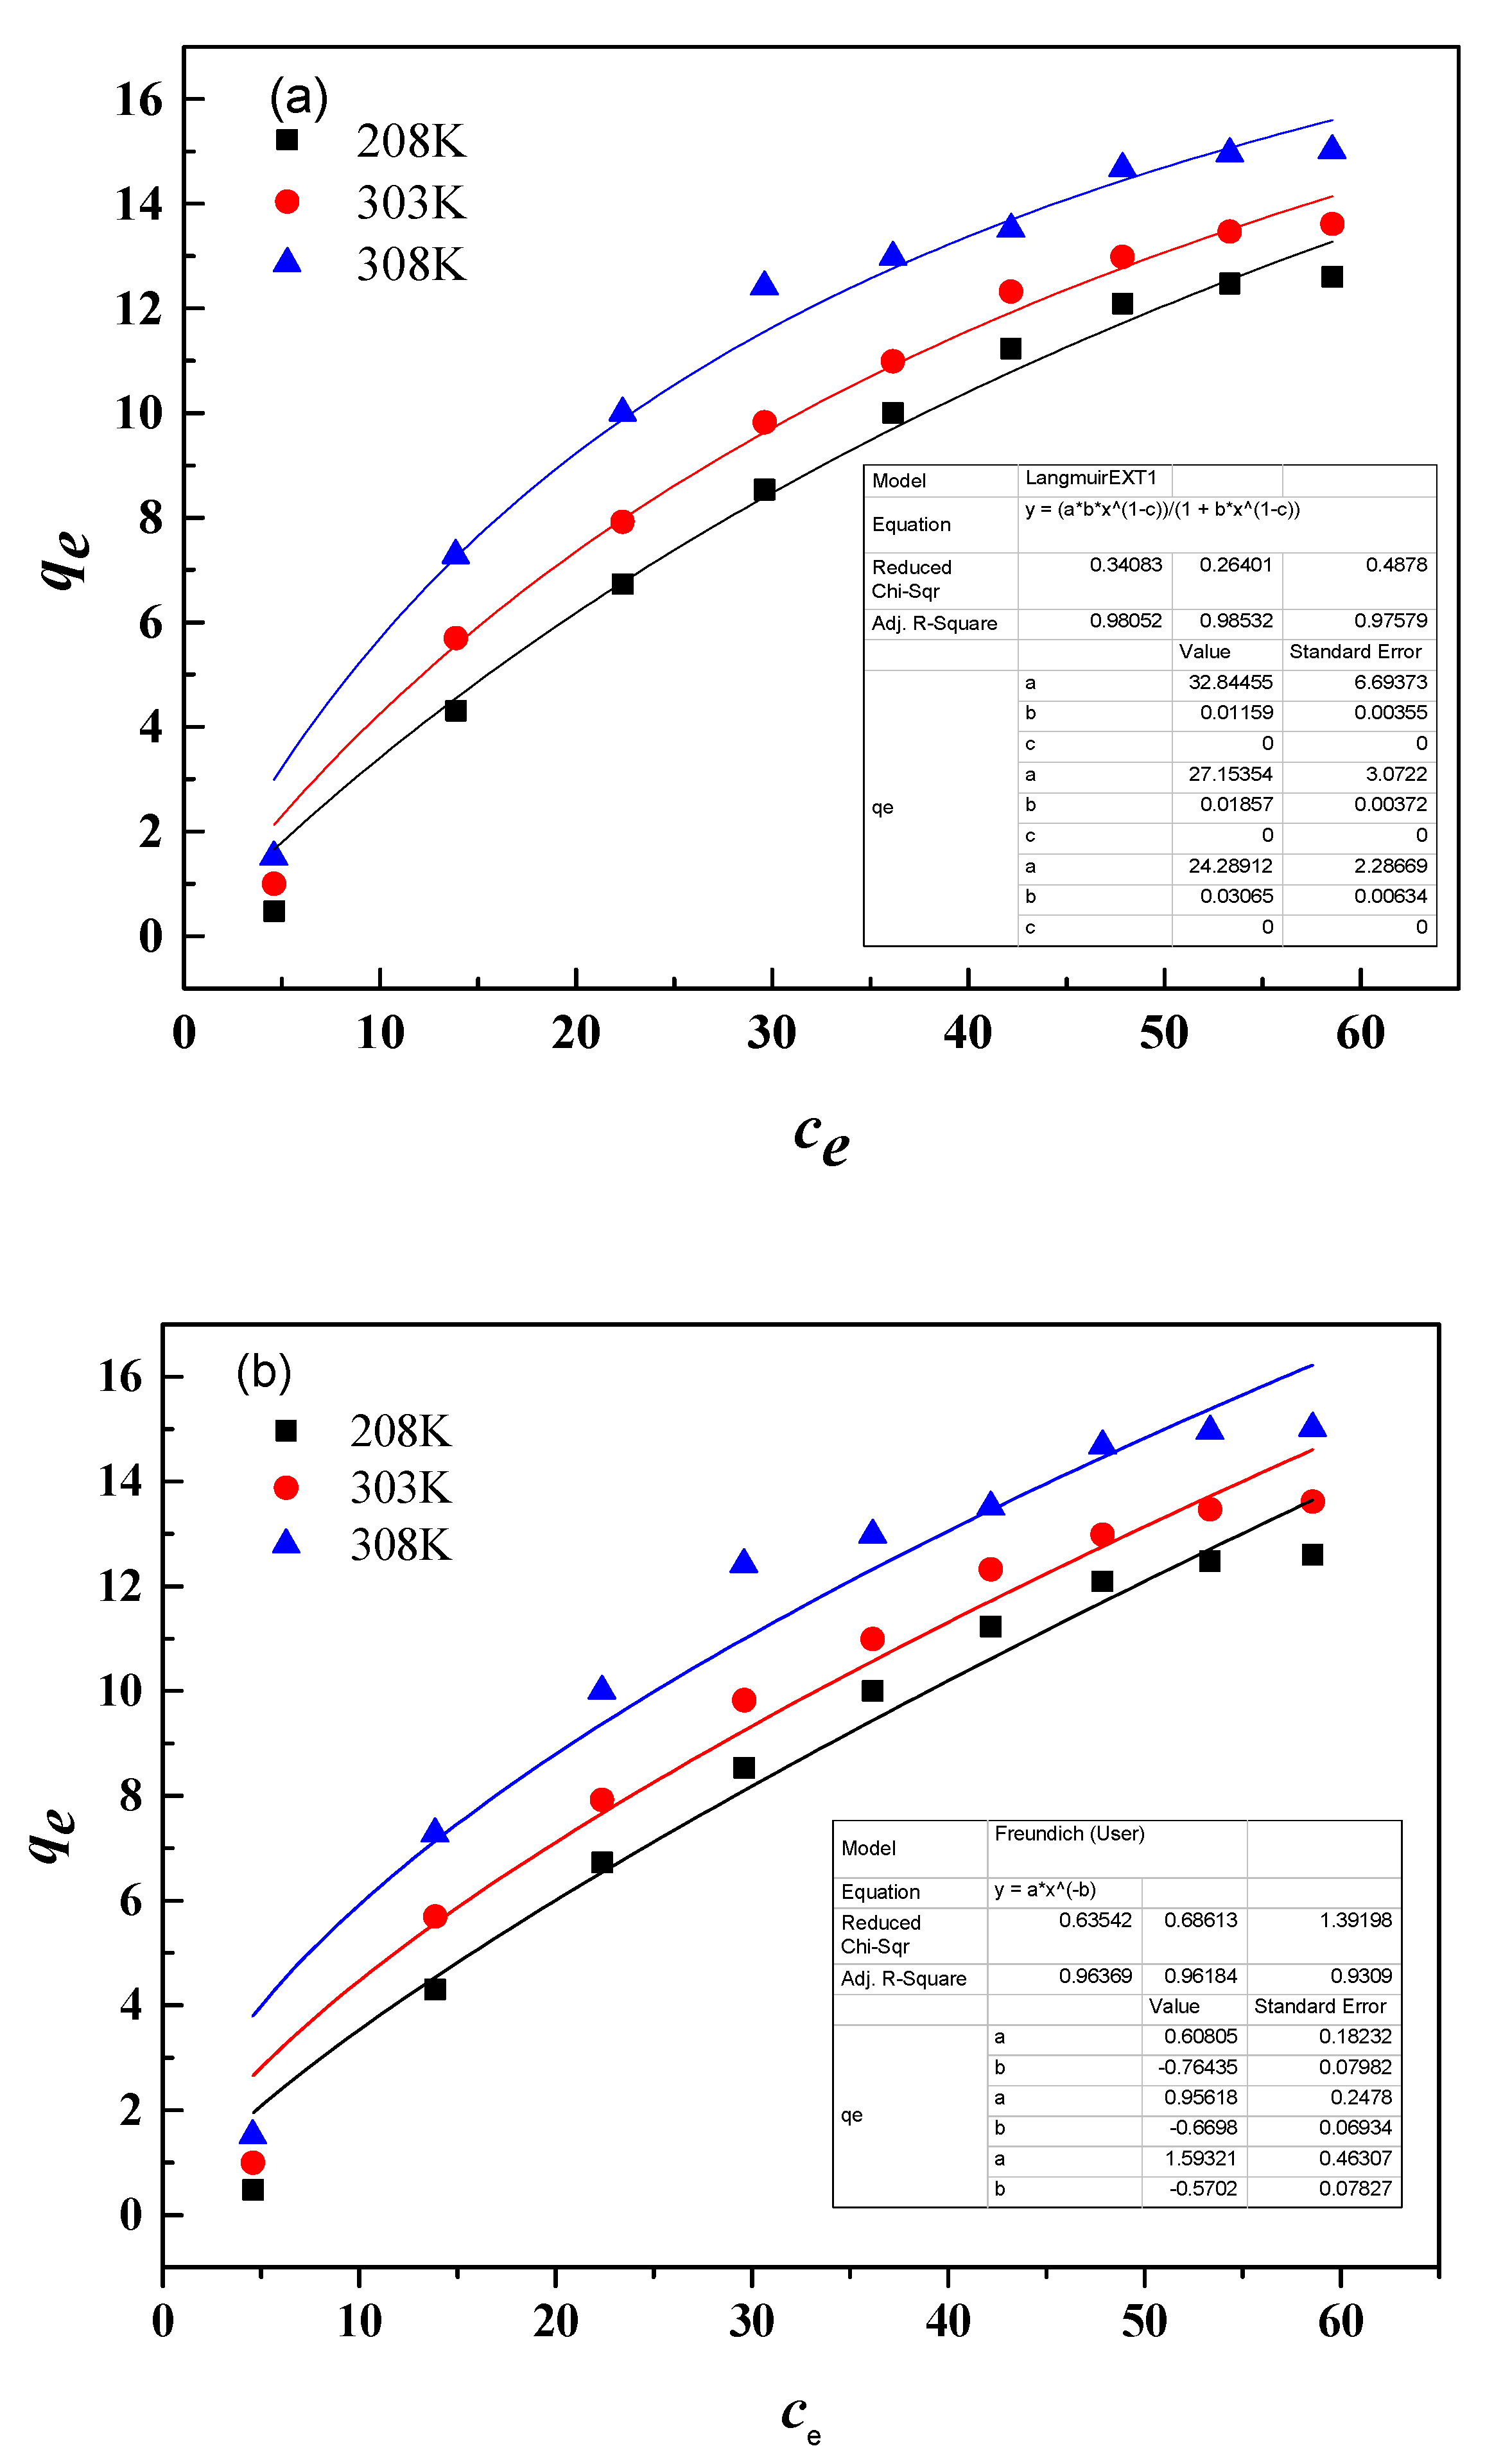
Based on the fitting curve and regression parameters of the Langmuir equation and the linear Freundlich diffusion model (Figure 19a,b and Table 4), the regression coefficient (R2) of the nonlinear Langmuir and Freundlich equation was higher than 0.93 at the temperature range from 298 K to 308 K. Compared to the Freundlich adsorption equation, Langmuir R2 was always above 0.97, indicating that the adsorption equilibria relationship between CDG and AY11 molecules can be more accurately described by the Langmuir equation. The Langmuir adsorption model assumed that the molecular adsorption was a monolayer surface adsorption, and the adsorption surface was uniform, containing a few identical sites. The adsorbed particles were completely independent without interaction.

3.9.3. Adsorption Thermodynamics

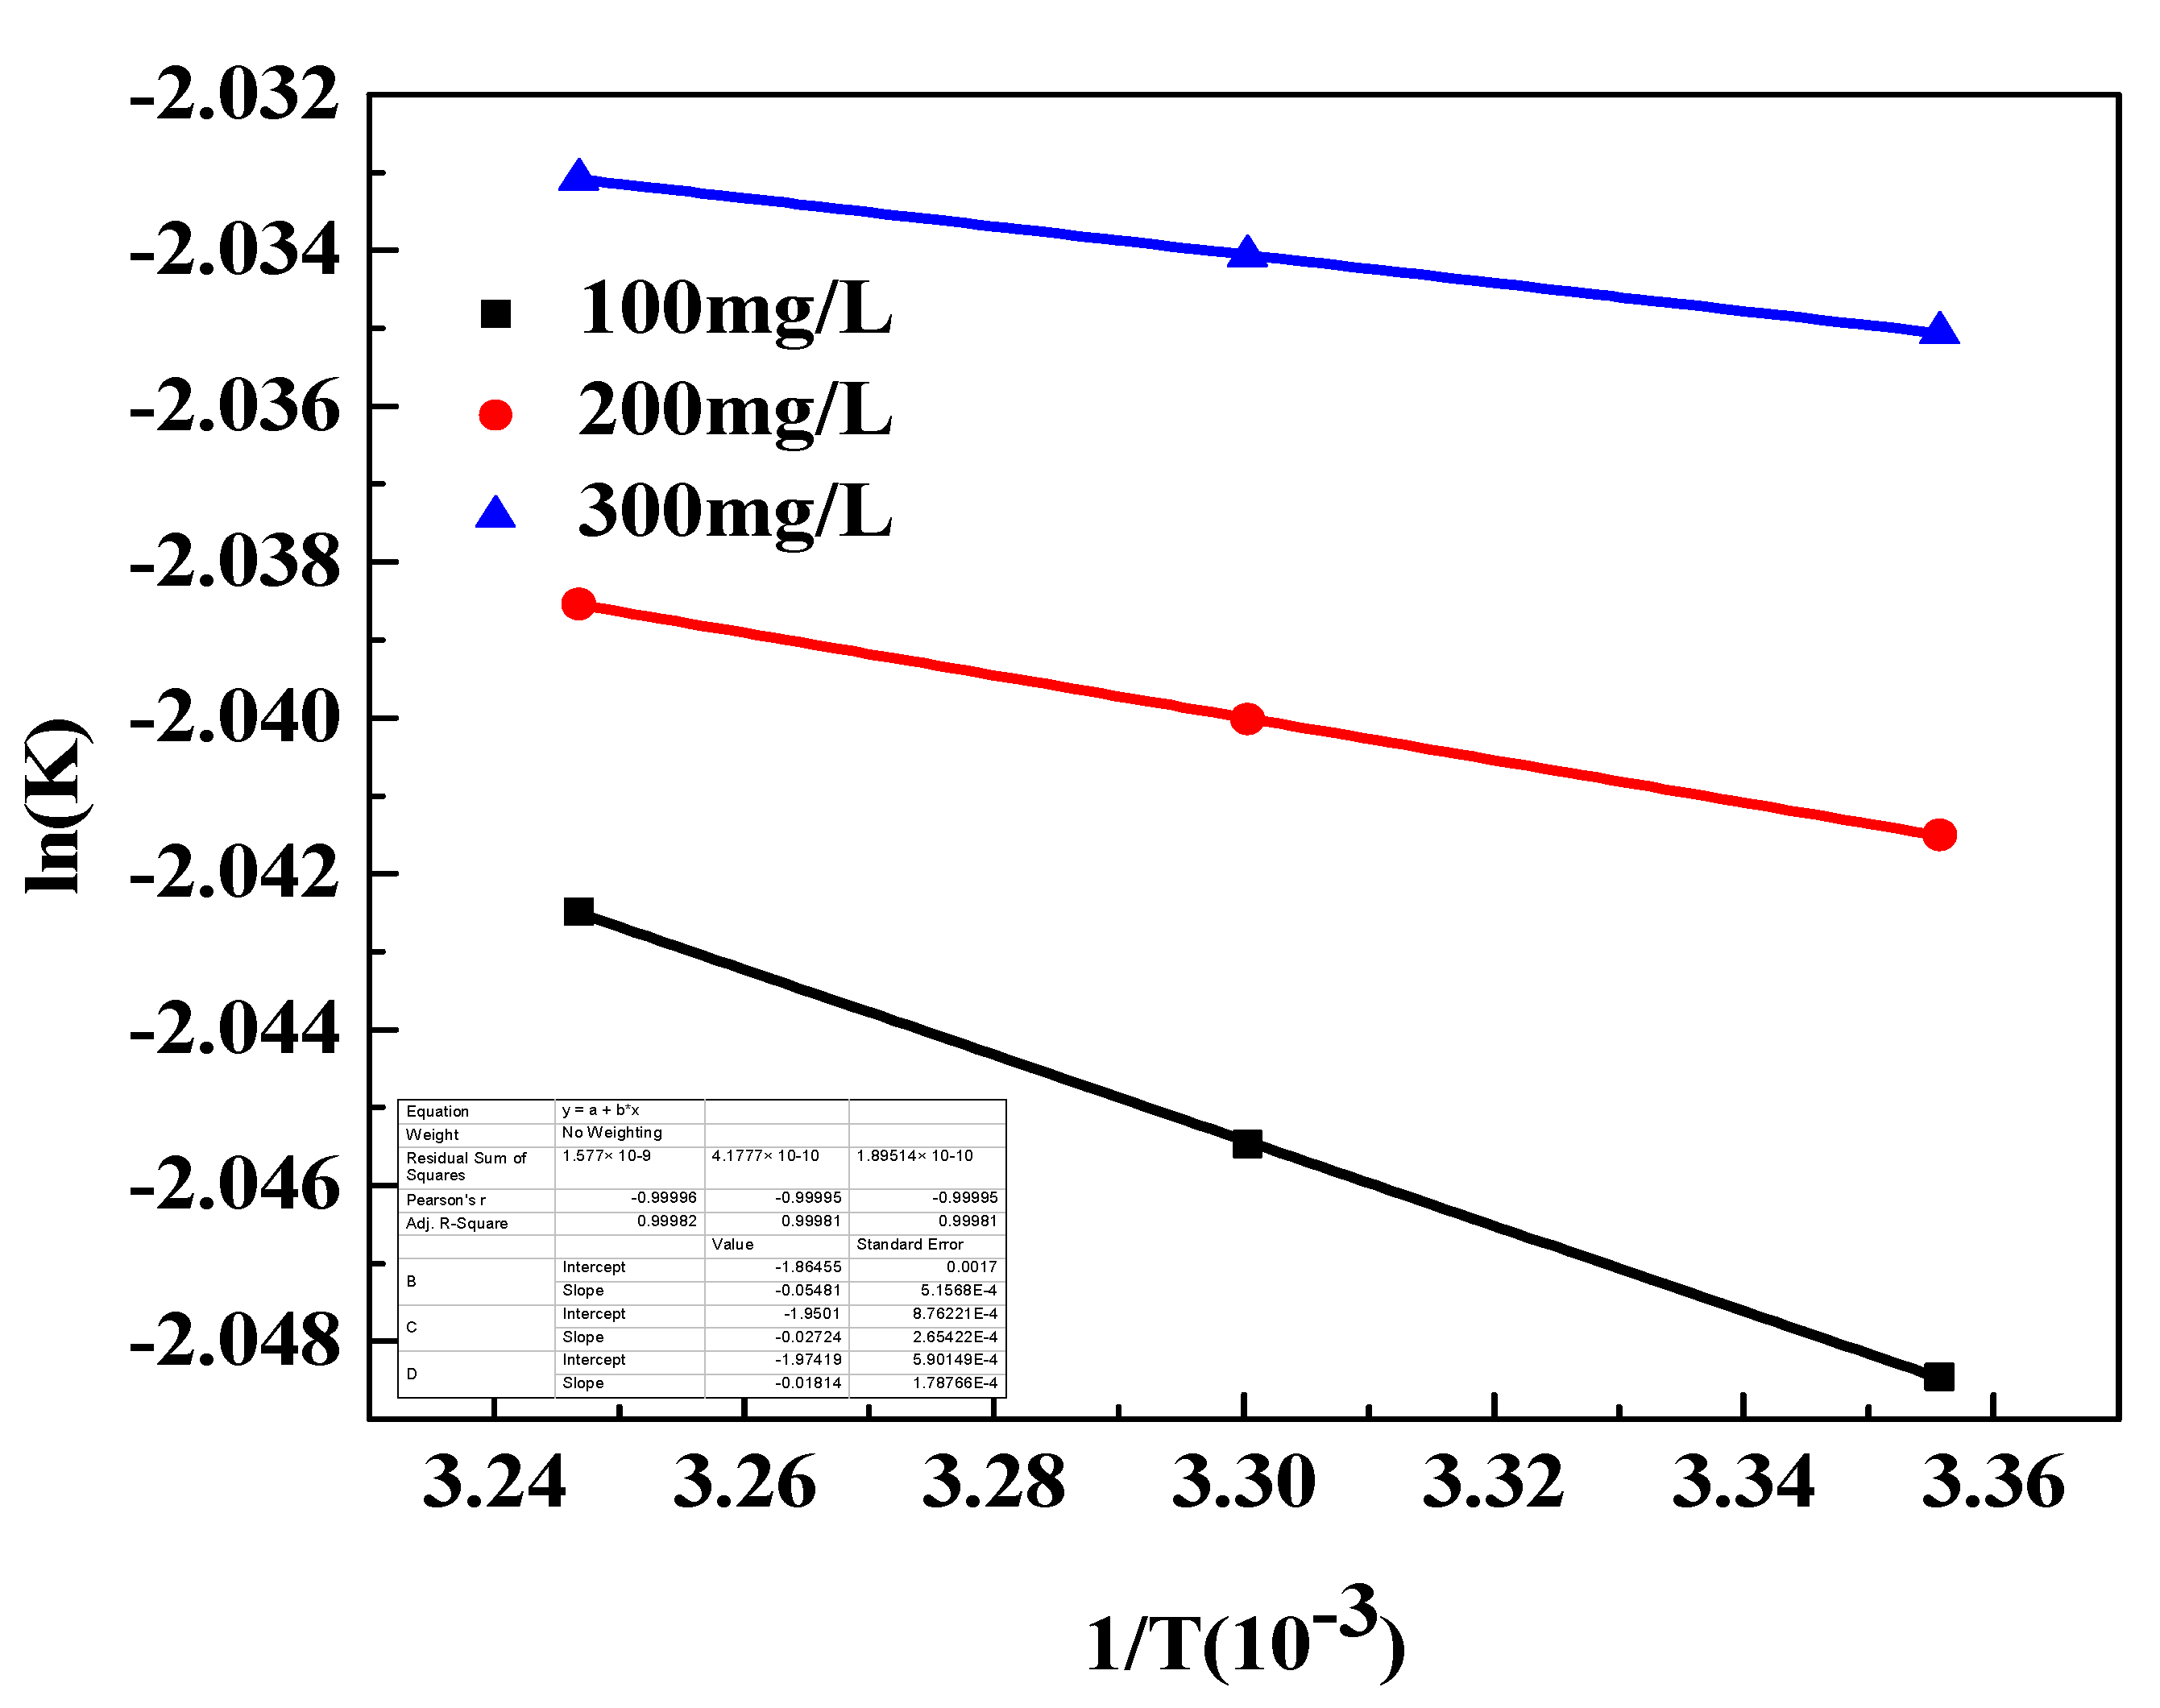
It can be observed from Figure 20 and Table 5 that ΔG0 < 0, and the value is between −20 kJ/mol and 0, which indicates that the adsorption behavior of CDG on AY11 is spontaneous and is physical adsorption [66]. The change in the standard entropy (ΔS0 < 0), indicated that the degree of order at the solid–liquid interface increases during the adsorption process. The values of ΔH0 > 0 indicate that the adsorption process is endothermic, and increasing the temperature is conducive to the adsorption behavior. This can also be verified from the adsorption data of CDG on AY11 at different temperatures (Figure 9). Therefore, it can be concluded that the process of CDG adsorption of AY11 has not only chemical adsorption but also physical adsorption.

3.9.4. Adsorption Model

Dye adsorption and removal are usually characterized as four consecutive steps [67,68]: (1) dye molecules from an aqueous solution are close to the outer surface of the adsorbent; (2) mass transfer across the boundary layer (membrane diffusion); (3) dye molecules diffusion within the particles in the pores of the adsorbent (pore diffusion); and (4) adsorption of dye molecules on the surface of the adsorbent through molecular interaction (reaction).
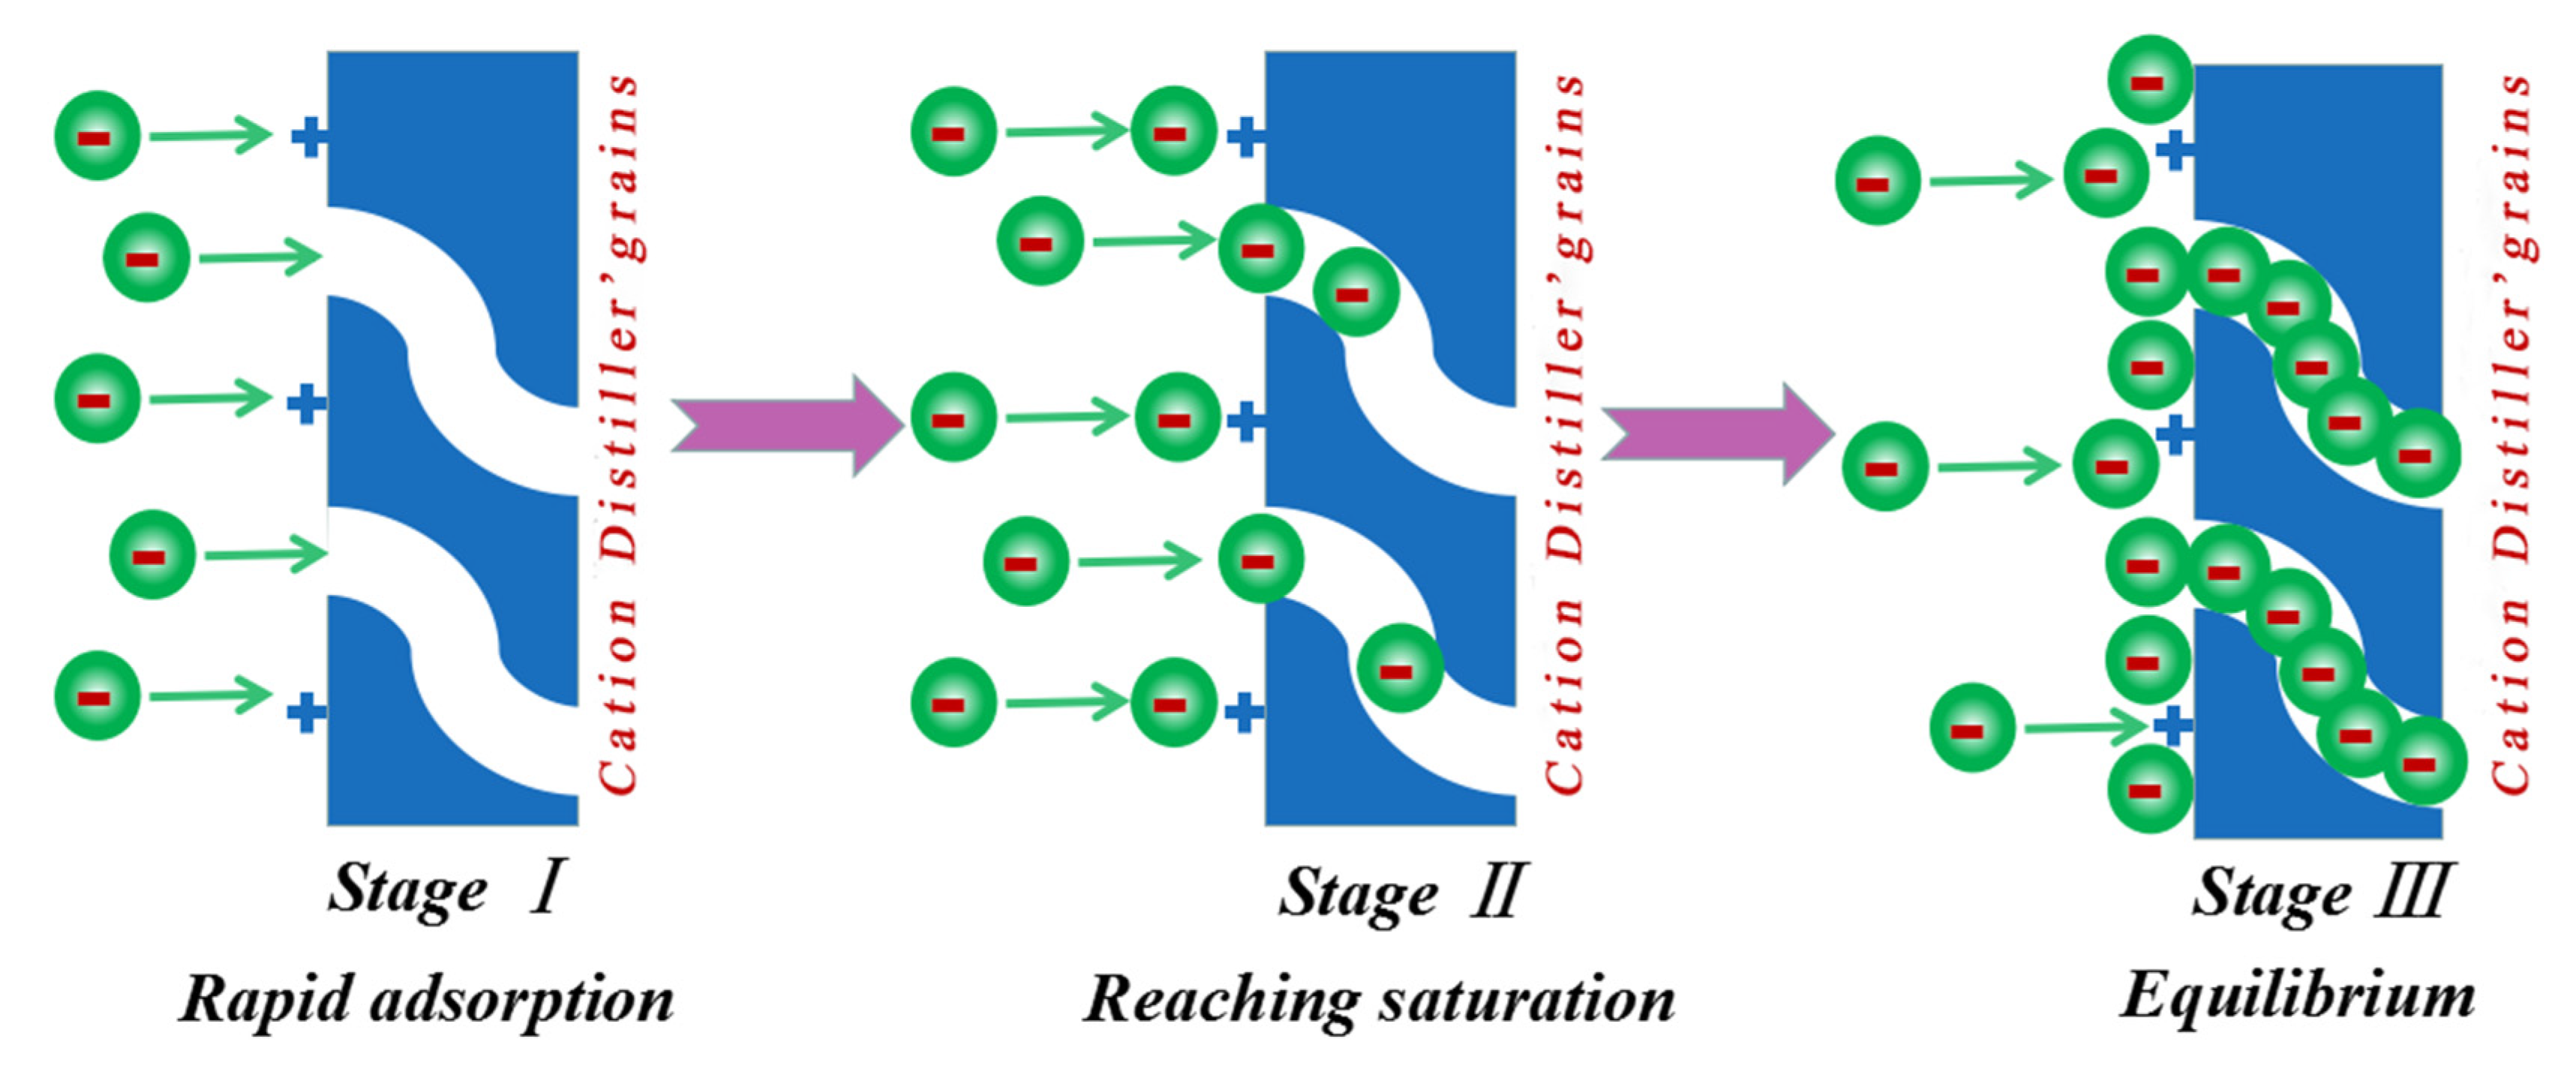
Figure 21 presents a schematic representation of the adsorption process of CDG and AY11, in which the first stage is rapid adsorption; the second stage is slow adsorption until reaching saturation; and the third stage is adsorption equilibrium. Among them, the concentration of the dye and the stirring speed may affect the first step, so in the thoroughly mixed batch adsorption, step 1 is very fast, and is therefore called the rapid adsorption stage. In most of the cases, steps 2 and 3 could mainly control the adsorption rate, while external and internal diffusion is usually regarded as an essential step to determine the adsorption rate.
Figure 22 shows the adsorption mechanism of AY11 dye by CDG. It can be seen that the dye diffuses into the adsorbent through pores. During the next step, AY11 ionizes out -SO3 in water and electrostatically interacts with the -N + (CH3) 3 group on the surface of CDG. Therefore, AY11 molecules can reach the surface of CDG and could enter the pores of CDG, as an establishment of a stronger chemical bond with AY11 is more conducive to the adsorption process. This process is mainly affected by the mass transfer resistance of the CDG surface, which slows down the adsorption process. The second stage, is the gradual adsorption stage, but this is not the only rate control step, as external mass transfer or ion exchange may also be involved in the adsorption process [69,70]. With the increase in time, more and more -SO3 of AY11 molecules could participate in the competition, resulting in the reduction of the adsorption sites on the surface of CDG, which slows down the absorption rate and eventually reaches adsorption equilibrium.

3.10. Comparison of Various Adsorbents

Table 6 shows the comparison of the maximum adsorption capacity of anionic azo dyes on various adsorbents. It can be seen from Table 6 that the maximum adsorption capacity of anionic azo dyes on CDG is 636.94 mg g−1, which is much higher than other clay and polymer materials under optimal adsorption conditions. Therefore, CDG is a promising material for treating anionic azo dyes from dye wastewater.

4. Conclusions

Using the alkali pre-treatment and CHPTAC etherification modification method, the waste of distillers grains were successfully transformed into quaternary ammonium cation distillers grain adsorbent (CDG). FTIR spectrum analysis and EDS elements analysis showed that CHPTAC successfully modified the DGs. BET analysis of CDG showed that a large number of pore structures appeared on the surface of CDG, which provided a large number of adsorption sites for the attachment of Acid yellow 11 (AY11). UV–Vis spectrometry showed that CDG had an excellent removal rate of AY11. Batch adsorption experiments showed that the optimal adsorption conditions for CDG to adsorb AY11 dye in aqueous solution are an adsorption temperature of 25 °C, an adsorption time of 180 min, amount of adsorbent at 8.5 g/L, initial concentration of AY11 100 mg/L, and the pH of the AY11 solution has to be set at 7.0. Under optimal conditions, the maximum adsorption removal rate of CDG for AY11 is 98.76%, and after eight adsorption–desorption experiments, the adsorption removal rate was still higher than 81%. Moreover, it is more likely to be used in the actual treatment of azo dye wastewater to realize the sustainable environmental protection concept of energy-saving and emission reduction. Zeta potential, adsorption kinetics, and adsorption thermodynamics results showed that the adsorption process of CDG to AY11 was mainly chemical adsorption. To summarise, CDG could be used as a potential adsorbent for azo dye wastewater treatment.

Author Contributions

Conceptualization, C.L. and C.W.; methodology, D.K. and X.M.; resources, H.W.; writing—original draft preparation, D.K. and X.M.; writing—review and editing, D.K.; funding acquisition, X.Y., C.W. and H.W. All authors have read and agreed to the published version of the manuscript.

Funding

This research was funded by the Open Research Fund Program of Key Laboratory of Cleaner Production and Integrated Resource Utilization of China National Light Industry (CP-2018-YB2), Liquor making Biological Technology and Application of key laboratory of Sichuan Province (NJ2019-01), Key Laboratory ofWuliangye-flavor Liquor Solid-state Fermentation, China National Light Industry (2018JJ005).

Institutional Review Board Statement

Not applicable.

Informed Consent Statement

Not applicable.

Data Availability Statement

Not applicable.

Acknowledgments

Financial support for this work was provided by the Open Research Fund Program of Key Laboratory of Cleaner Production and Integrated Resource Utilization of China National Light Industry (CP-2018-YB2), Liquor making Biological Technology and Application of key laboratory of Sichuan Province (NJ2019-01), Key Laboratory of Wuliangye-flavor Liquor Solid-state Fermentation, China National Light Industry (2018zd010), Key Science and Technology Project of Zigong City (2019YYJC28).

Conflicts of Interest

The authors declare no conflict of interest.

References

  1. Iqbal, M.; Abbas, M.; Nisar, J.; Nazir, A. Bioassays based on higher plants as excellent dosimeters for ecotoxicity monitoring: A review. Chem. Int. 2019, 5, 1–80. [Google Scholar]
  2. Abbas, M.; Adil, M.; Ehtisham-Ul-Haque, S.; Munir, B.; Yameen, M.; Ghaffar, A.; Shar, G.A.; Tahir, M.A.; Iqbal, M. Vibrio fischeri bioluminescence inhibition assay for ecotoxicity assessment: A review. Sci. Total Environ. 2018, 626, 1295–1309. [Google Scholar] [CrossRef]
  3. Iqbal, M. Vicia faba bioassay for environmental toxicity monitoring: A review. Chemosphere 2016, 144, 785–802. [Google Scholar] [CrossRef]
  4. Siddiqua, U.H.; Ali, S.; Iqbal, M.; Hussain, T. Relationship between structure and dyeing properties of reactive dyes for cotton dyeing. J. Mol. Liq. 2017, 241, 839–844. [Google Scholar] [CrossRef]
  5. Shah, N.S.; Khan, J.A.; Sayed, M.; Khan, Z.U.H.; Iqbal, J.; Arshad, S.; Junaid, M.; Khan, H.M. Synergistic effects of H2O2 and S2O82− in the gamma radiation induced degradation of congo-red dye: Kinetics and toxicities evaluation. Sep. Purif. Technol. 2020, 233, 115966. [Google Scholar] [CrossRef]
  6. Dai, H.; Huang, Y.; Huang, H. Eco-friendly polyvinyl alcohol/carboxymethyl cellulose hydrogels reinforced with graphene oxide and bentonite for enhanced adsorption of methylene blue. Carbohydr. Polym. 2018, 185, 1–11. [Google Scholar]
  7. Liu, H.; Guo, W.; Li, Y.; He, S.; He, C. Photocatalytic degradation of sixteen organic dyes by TiO2/WO3-coated magnetic nanoparticles under simulated visible light and solar light. J. Chem. Environ. Eng. 2018, 6, 59–67. [Google Scholar] [CrossRef]
  8. Sinha, A.; Lulu, S.; Vino, S.; Banerjee, S.; Acharjee, S.; Osborne, W.J. Degradation of reactive green dye and textile effluent by Candida sp. VITJASS isolated from wetland paddy rhizosphere soil. J. Environ. Chem. Eng. 2018, 6, 5150–5159. [Google Scholar] [CrossRef]
  9. Liu, S.; Wang, Z.; Li, J.; Zhao, C.; He, X.; Yang, G. Fabrication of slag particle three-dimensional electrode system for methylene blue degradation: Characterization, performance and mechanism study. Chemosphere 2018, 213, 377–383. [Google Scholar] [CrossRef]
  10. Obiora-Okafo, I.A.; Onukwuli, O.D. Characterization and optimization of spectrophotometric colour removal from dye containing wastewater by Coagulation-Flocculation. Pol. J. Chem. Technol. 2018, 20, 49–59. [Google Scholar] [CrossRef] [Green Version]
  11. Wolski, L.; Walkowiak, A.; Ziolek, M. Formation of reactive oxygen species upon interaction of Au/ZnO with H2O2 and their activity in methylene blue degradation. Catal. Today 2019, 333, 54–62. [Google Scholar] [CrossRef]
  12. Criscuoli, A.; Zhong, J.; Figoli, A.; Carnevale, M.; Huang, R.; Drioli, E. Treatment of dye solutions by vacuum membrane distillation. Water Res. 2008, 42, 5031–5037. [Google Scholar] [CrossRef]
  13. Zhang, B.; Dong, Z.; Sun, D.; Wu, T.; Li, Y. Enhanced adsorption capacity of dyes by surfactant-modified layered double hydroxides from aqueous solution. J. Ind. Eng. Chem. 2017, 49, 208–218. [Google Scholar] [CrossRef]
  14. Tian, S.; Xu, S.; Liu, J.; He, C.; Xiong, Y.; Feng, P. Highly efficient removal of both cationic and anionic dyes from wastewater with a water-stable and eco-friendly Fe-MOF via host-guest encapsulation. J. Clean. Prod. 2019, 239, 117767. [Google Scholar] [CrossRef]
  15. Shanmugam, M.; Alsalme, A.; Alghamdi, A.; Jayavel, R. Enhanced Photocatalytic Performance of the Graphene-V2O5 Nanocomposite in the Degradation of Methylene Blue Dye under Direct Sunlight. ACS Appl. Mater. Interfaces 2015, 7, 14905–14911. [Google Scholar] [CrossRef]
  16. Kabdaşlı, I.; Bilgin, A.; Tünay, O.; Kabdasli, I. Sulphate control by ettringite precipitation in textile industry wastewaters. Environ. Technol. 2015, 37, 446–451. [Google Scholar] [CrossRef]
  17. Wawrzkiewicz, M.; Wiśniewska, M.; Wołowicz, A.; Gun’Ko, V.M.; Zarko, V.I. Mixed silica-alumina oxide as sorbent for dyes and metal ions removal from aqueous solutions and wastewaters. Microporous Mesoporous Mater. 2017, 250, 128–147. [Google Scholar] [CrossRef]
  18. Xu, Y.; Li, Z.; Su, K.; Fan, T.; Cao, L. Mussel-inspired modification of PPS membrane to separate and remove the dyes from the wastewater. Chem. Eng. J. 2018, 341, 371–382. [Google Scholar] [CrossRef]
  19. Mohammed, N.; Grishkewich, N.; Waeijen, H.A.; Berry, R.M.; Tam, K.C. Continuous flow adsorption of methylene blue by cellulose nanocrystal-alginate hydrogel beads in fixed bed columns. Carbohydr. Polym. 2016, 136, 1194–1202. [Google Scholar] [CrossRef]
  20. Wawrzkiewicz, M.; Wiśniewska, M.; Gun’ko, V.M.; Zarko, V.I. Adsorptive removal of acid, reactive and direct dyes from aqueous solutions and wastewater using mixed silicaealumina oxide. Powder Technol. 2015, 278, 306–315. [Google Scholar] [CrossRef]
  21. Gładysz-Płaska, A.; Skwarek, E.; Budnyak, T.M.; Kołodyńska, D. Metal Ions Removal Using Nano Oxide Pyrolox™ Material. Nanoscale Res. Lett. 2017, 12, 95. [Google Scholar] [CrossRef] [Green Version]
  22. Du, H.; Cheng, J.; Wang, M.; Tian, M.; Yang, X.; Wang, Q. Red dye extracted sappan wood waste derived activated carbons characterization and dye adsorption properties. Diam. Relat. Mater. 2020, 102, 107646. [Google Scholar] [CrossRef]
  23. Panda, J.; Sahoo, J.K.; Panda, P.K.; Sahu, S.N.; Samal, M.; Pattanayak, S.K.; Sahu, R. Adsorptive behavior of zeolitic imidazolate framework-8 towards anionic dye in aqueous media: Combined experimental and molecular docking study. J. Mol. Liq. 2019, 278, 536–545. [Google Scholar] [CrossRef]
  24. Pisareva, A.S.; Tikhomirova, T.I. Sorption of Synthetic Anionic Amaranth Dye from an Aqueous Solution on Hydrophobized Silica and Alumina. Russ. J. Phys. Chem. A 2019, 93, 534–537. [Google Scholar] [CrossRef]
  25. Baliś, A.; Id, S.Z. Tailored synthesis of core-shell mesoporous silica particles—Optimization of dye sorption properties. Nanomaterials 2018, 8, 230. [Google Scholar] [CrossRef] [Green Version]
  26. Luensmann, D.; Jones, L. Impact of fluorescent probes on albumin sorption profiles to ophthalmic biomaterials. J. Biomed. Mater. Res. Part B Appl. Biomater. 2010, 94, 327–336. [Google Scholar] [CrossRef]
  27. Wu, B.; Zhang, W.-H.; Ren, Z.-G.; Lang, J.-P. A 1D anionic coordination polymer showing superior Congo Red sorption and its dye composite exhibiting remarkably enhanced photocurrent response. Chem. Commun. 2015, 51, 14893–14896. [Google Scholar] [CrossRef]
  28. Malik, P.K. Use of activated carbons prepared from sawdust and rice-husk for adsorption of acid dyes: A case study of Acid Yellow 36. Dye. Pigment. 2003, 56, 239–249. [Google Scholar] [CrossRef]
  29. Ahmad, A.A.; Hameed, B.H. Fixed-bed adsorption of reactive azo dye onto granular activated carbon prepared from waste. J. Hazard. Mater. 2010, 175, 298–303. [Google Scholar] [CrossRef]
  30. Gupta, V.K.; Gupta, B.; Rastogi, A.; Agarwal, S.; Nayak, A. A comparative investigation on adsorption performances of mesoporous activated carbon prepared from waste rubber tire and activated carbon for a hazardous azo dye—Acid Blue 113. J. Hazard. Mater. 2011, 186, 891–901. [Google Scholar] [CrossRef]
  31. Ríos-Gómez, J.; Ferrer-Monteagudo, B.; López-Lorente, Á.I.; Lucena, R.; Luque, R.; Cárdenas, S. Efficient combined sorption/photobleaching of dyes promoted by cellulose/titania-based nanocomposite films. J. Clean. Prod. 2018, 194, 167–173. [Google Scholar] [CrossRef]
  32. Sun, X.; Yang, L.; Li, Q.; Zhao, J.; Li, X.; Wang, X.; Liu, H. Amino-functionalized magnetic cellulose nanocomposite as adsorbent for removal of Cr(VI): Synthesis and adsorption studies. Chem. Eng. J. 2014, 241, 175–183. [Google Scholar] [CrossRef]
  33. Sarsenov, A.; Bishimbaev, V.; Kapsalamov, B.; Lepesov, K.; Gapparova, K.; Grzesiak, P. Chemical modification of cellulose for boron sorption from water solutions. Pol. J. Chem. Technol. 2018, 20, 123–128. [Google Scholar] [CrossRef] [Green Version]
  34. Villegas-Torres, M.F.; Ward, J.M.; Lye, G.J. The protein fraction from wheat-based dried distiller’s grain with solubles (DDGS): Extraction and valorization. New Biotechnol. 2015, 32, 606–611. [Google Scholar] [CrossRef] [Green Version]
  35. Zhang, X.Y.; Tan, J.; Wei, X.H.; Wang, L.J. Removal of Remazol turquoise Blue G-133 from aqueous solution using modified waste newspaper fiber. Carbohydr. Polym. 2013, 92, 1497–1502. [Google Scholar] [CrossRef]
  36. Hashem, A.M.A.; El-Shishtawy, R.M. Preparation and Characterization of Cationized Cellulose for the Removal of Anionic Dyes. Adsorpt. Sci. Technol. 2001, 19, 197–210. [Google Scholar] [CrossRef]
  37. Qi, Y.; Li, J.; Wang, L.J. Removal of Remazol Turquoise Blue G-133 from aqueous medium using functionalized cellulose from recycled newspaper fiber. Ind. Crop. Prod. 2013, 50, 15–22. [Google Scholar] [CrossRef]
  38. Idan, I.J.; Abdullah, L.C.; Mahdi, D.S.; Obaid, M.K.; Jamil, S.N.A.B.M. Adsorption of Anionic Dye Using Cationic Surfactant-Modified Kenaf Core Fibers. Open Access Libr. J. 2017, 4, 1. [Google Scholar] [CrossRef]
  39. Khy, A.; Pj, A.; Kbr, B.; Sumant, A.V.; Skoog, S.A.; Narayan, R.J. Correlation of zeta potential and contact angle of oxygen and fluorine terminated nitrogen incorporated ultrananocrystalline diamond (N-UNCD) thin films. Mater. Lett. 2021, 295, 129823. [Google Scholar]
  40. Cheng, F.; Zhou, X.; Zhang, J.; Lu, L.; Ma, J. Effects of cations on the adsorption kinetics of bt protein on mineral surfaces. J. Agro-Environ. Sci. 2017, 9, 1844–1849. [Google Scholar]
  41. Lei, S.; Li, X. Adsorption and degradation of 1,2,4-trichlorobenzene by activated carbon-microorganisms in soil. J. Agro-Environ. Sci. 2015, 8, 1535–1541. [Google Scholar]
  42. Zou, W.; Zhao, L.; Han, R. Adsorption characteristics of uranyl ions by manganese oxide coated sand in batch mode. J. Radioanal. Nucl. Chem. 2011, 288, 239–249. [Google Scholar] [CrossRef]
  43. Aksu, Z.; Tezer, S. Biosorption of reactive dyes on the green alga Chlorella vulgaris. Process Biochem. 2005, 40, 1347–1361. [Google Scholar] [CrossRef]
  44. Bergaoui, M.; Nakhli, A.; Benguerba, Y.; Khalfaoui, M.; Erto, A.; Soetaredjo, F.E.; Ismadji, S.; Ernst, B. Novel insights into the adsorption mechanism of methylene blue onto organo-bentonite: Adsorption isotherms modeling and molecular simulation. J. Mol. Liq. 2018, 272, 697–707. [Google Scholar] [CrossRef]
  45. Ayawei, N.; Ebelegi, A.N.; Wankasi, D. Modelling and interpretation of adsorption isotherms. J. Chem. 2017, 2017, 3039817. [Google Scholar] [CrossRef]
  46. Elwakeel, K.Z.; Guibal, E. Arsenic(V) sorption using chitosan/Cu(OH)2 and chitosan/CuO composite sorbents. Carbohydr. Polym. 2015, 134, 190–204. [Google Scholar] [CrossRef]
  47. Bao, S.Y.; Tang, L.H.; Li, K.; Ning, P.; Peng, J.H.; Guo, H.B.; Zhu, T.T.; Liu, Y. Highly selective removal of Zn(II) ion from hot-dip galvanizing pickling waste with amino-functionalized Fe3O4@SiO2, magnetic nano-adsorbent. J. Colloid Interface Sci. 2016, 462, 235–242. [Google Scholar] [CrossRef]
  48. Ren, Y.; Abbood, H.A.; He, F.; Peng, H.; Huang, K. Magnetic EDTA-modified chitosan/SiO2/Fe3O4, adsorbent: Preparation, characterization, and application in heavy metal adsorption. Chem. Eng. J. 2013, 226, 300–311. [Google Scholar] [CrossRef]
  49. Bajaj, K.; Sakhuja, R. Benzotriazole: Much More than Just Synthetic Heterocyclic Chemistry; The Chemistry of Benzotriazole Derivatives; Springer International Publishing: Berlin/Heidelberg, Germany, 2015. [Google Scholar]
  50. Lonappan, L.; Rouissi, T.; Brar, S.K.; Verma, M.; Surampalli, R.Y. An insight into the adsorption of diclofenac on different biochars: Mechanisms, surface chemistry, and thermodynamics. Bioresour. Technol. 2018, 249, 386–394. [Google Scholar] [CrossRef] [Green Version]
  51. Hokkanen, S.; Bhatnagar, A.; Sillanpaa, M. A review on modification methods to cellulose-based adsorbents to improve adsorption capacity. Water Res. 2016, 91, 156–173. [Google Scholar] [CrossRef]
  52. Park, K.-H.; Yu, S.-H.; Kim, H.-S.; Park, H.-D. Inhibition of biofouling by modification of forward osmosis membrane using quaternary ammonium cation. Water Sci. Technol. 2015, 72, 738–745. [Google Scholar] [CrossRef] [PubMed]
  53. Wang, C.; Jin, J.; Sun, Y.; Yao, J.; Zhao, G.; Liu, Y. In-situ synthesis and ultrasound enhanced adsorption properties of MoS2/graphene quantum dot nanocomposite. Chem. Eng. J. 2017, 327, 774–782. [Google Scholar] [CrossRef]
  54. Zhang, T.; Zhang, K.; Li, J.; Yue, X. Simultaneously enhancing hydrophilicity, chlorine resistance and anti-biofouling of APA-TFC membrane surface by densely grafting quaternary ammonium cations and salicylaldimines. J. Membr. Sci. 2017, 528, 296–302. [Google Scholar] [CrossRef]
  55. Choi, A.E.S.; Roces, S.; Dugos, N.; Arcega, A.; Wan, M.W. Adsorptive removal of dibenzothiophene sulfone from fuel oil using clay material adsorbents. J. Clean. Prod. 2017, 161, 267–276. [Google Scholar] [CrossRef]
  56. Değermenci, G.D.; Değermenci, N.; Ayvaoğlu, V.; Durmaz, E.; Çakır, D.; Akan, E. Adsorption of reactive dyes on lignocellulosic waste; characterization, equilibrium, kinetic and thermodynamic studies. J. Clean. Prod. 2019, 225, 1220–1229. [Google Scholar] [CrossRef]
  57. Li, C.; Wu, N.; Zhang, M.; Wei, C.; Yan, F.; Wang, Z. Effects of E44 and KH560 modifiers on properties of distillers grains poly(butylene succinate) composites. Polym. Compos. 2018, 40, 1499–1509. [Google Scholar] [CrossRef]
  58. Wang, B.; Lian, G.; Lee, X.; Gao, B.; Li, L.; Liu, T.; Zhang, X.; Zheng, Y. Phosphogypsum as a novel modifier for distillers grains biochar removal of phosphate from water. Chemosphere 2020, 238, 124684. [Google Scholar] [CrossRef]
  59. Oliveira, K.R.; Segura, J.G.; Oliveira, B.A.; Medeiros, A.C.L.; Zimba, R.D.; Viegas, E.M. Distillers’ dried grains with soluble in diets for Pacu, Piaractus mesopotamicus juveniles:Growth performance, feed utilization, economic viability, and phosphorus release. Anim. Feed. Sci. Technol. 2020, 262, 114393. [Google Scholar] [CrossRef]
  60. Lee, C.; Morris, D.L.; Lefever, K.M.; Dieter, P.A. Feeding a diet with corn distillers grain with solubles to dairy cows alters manure characteristics and ammonia and hydrogen sulfide emissions from manure. J. Dairy Sci. 2020, 103, 2363–2372. [Google Scholar] [CrossRef]
  61. Zhang, Z.; Wang, Q.; Li, L.; Xu, G. Pyrolysis characteristics, kinetics and evolved volatiles determination of rice-husk-based distiller’s grains. Biomass Bioenergy 2020, 135, 105525. [Google Scholar] [CrossRef]
  62. Thommes, M.; Guillet-Nicolas, R.; Cychosz, K.A. Physical Adsorption Characterization of Mesoporous Zeolites. Mesoporous Zeolites; John Wiley & Sons, Ltd.: Hoboken, NJ, USA, 2015; pp. 349–384. [Google Scholar]
  63. Sadeek, S.A.; Negm, N.; Hefni, H.; Wahab, M.M.A. Metal adsorption by agricultural biosorbents: Adsorption isotherm, kinetic and biosorbents chemical structures. Int. J. Biol. Macromol. 2015, 81, 400–409. [Google Scholar] [CrossRef] [PubMed]
  64. Chakraborty, R.; Verma, R.; Asthana, A.; Vidya, S.S.; Singh, A.K. Adsorption of hazardous chromium (VI) ions from aqueous solutions using modified sawdust: Kinetics, isotherm and thermodynamic modelling. Int. J. Environ. Anal. Chem. 2019, 101, 911–928. [Google Scholar] [CrossRef]
  65. Wang, Y.; Zhang, C.; Zhao, L.; Meng, G.; Wu, J.; Liu, Z. Cellulose-based porous adsorbents with high capacity for methylene blue adsorption from aqueous solutions. Fibers Polym. 2017, 8, 891–899. [Google Scholar] [CrossRef]
  66. Battirola, L.C.; Zanata, D.M.; Gon Alves, M.C. Improvement of cellulose acetate dimensional stability by chemical crosslinking with cellulose nanocrystals. Compos. Part A Appl. Sci. Manuf. 2018, 113, 105–113. [Google Scholar] [CrossRef]
  67. Crittenden, J.C.; Trussell, R.R.; Hand, D.W.; Howe, K.J.; Tchobanoglous, G. MWH’s Water Treatment: Principles and Design, 3rd ed.; John Wiley & Sons Inc.: Hoboken, NJ, USA, 2012. [Google Scholar]
  68. Firdaous, L.; Fertin, B.; Khelissa, O.; Dhainaut, M.; Nedjar, N.; Chataigné, G.; Ouhoud, L.; Lutin, F.; Dhulster, P. Adsorptive removal of polyphenols from an alfalfa white proteins concentrate: Adsorbent screening, adsorption kinetics and equilibrium study. Sep. Purif. Technol. 2017, 178, 29–39. [Google Scholar] [CrossRef]
  69. Albadarin, A.B.; Mangwandi, C.; Al-Muhtaseb, A.H.; Walker, G.M.; Allen, S.J.; Ahmad, M.N. Kinetic and thermodynamics of chromium ions adsorption onto low-cost dolomite adsorbent. Chem. Eng. J. 2012, 179, 193–202. [Google Scholar] [CrossRef]
  70. Wu, Z.; Zhong, H.; Yuan, X.; Wang, H.; Wang, L.; Chen, X.; Zeng, G.; Wu, Y. Adsorptive removal of methylene blue by rhamnolipid-functionalized graphene oxide from wastewater. Water Res. 2014, 67, 330–344. [Google Scholar] [CrossRef]
  71. Heibati, B.; Rodriguez-Couto, S.; Turan, N.G.; Ozgonenel, O.; Albadarin, A.B.; Asif, M.; Tyagi, I.; Agarwal, S.; Gupta, V.K. Removal of noxious dye—Acid Orange 7 from aqueous solution using natural pumice and Fe-coated pumice stone. J. Ind. Eng. Chem. 2015, 31, 124–131. [Google Scholar] [CrossRef]
  72. Jin, X.; Yu, B.; Chen, Z.; Arocena, J.M.; Thring, R.W. Adsorption of Orange II dye in aqueous solution onto surfactant-coated zeolite: Characterization, kinetic and thermodynamic studies. J. Colloid Interface Sci. 2014, 435, 15–20. [Google Scholar] [CrossRef]
  73. Patra, B.N.; Majhi, D. Removal of Anionic Dyes from Water by Potash Alum Doped Polyaniline: Investigation of Kinetics and Thermodynamic Parameters of Adsorption. J. Phys. Chem. B 2015, 119, 8154–8164. [Google Scholar] [CrossRef]
  74. Guo, X.; Wei, Q.; Du, B.; Zhang, Y.; Xin, X.; Yan, L.; Yu, H. Removal of Metanil Yellow from water environment by amino functionalized graphenes (NH2-G)—Influence of surface chemistry of NH2-G. Appl. Surf. Sci. 2013, 284, 862–869. [Google Scholar] [CrossRef]
  75. Meng, F.; Wang, L.; Pei, M.; Guo, W.; Liu, G. Adsorption of metanil yellow from aqueous solution using polyaniline-bentonite composite. Colloid Polym. Sci. 2017, 295, 1165–1175. [Google Scholar] [CrossRef]
  76. El-Bindary, A.A.; Hussien, M.A.; Diab, M.A.; Eessa, A.M. Adsorption of Acid Yellow 99 by polyacrylonitrile/activated carbon composite: Kinetics, thermodynamics and isotherm studies. J. Mol. Liq. 2014, 197, 236–242. [Google Scholar] [CrossRef]
  77. Amooey, A.A.; Alinejad-Mir, A.; Ghasemi, S.; Marzbali, M.H. The removal of Direct Yellow 12 from synthetic aqueous solution by a novel magnetic nanobioadsorbent. Int. J. Environ. Sci. Technol. 2019, 16, 8343–8354. [Google Scholar] [CrossRef]
  78. El-Sharkawy, R.; El-Ghamry, H.A. Multi-walled carbon nanotubes decorated with Cu(II) triazole Schiff base complex for adsorptive removal of synthetic dyes. J. Mol. Liq. 2019, 282, 515–526. [Google Scholar] [CrossRef]
Figure 1. Structural formula of AY11.
Sustainability 14 02469 g001
Figure 2. Schematic diagram of CDG synthesis (* the terminal group).
Sustainability 14 02469 g002
Figure 3. FTIR spectra of (a) DG and (b) CDG.
Sustainability 14 02469 g003
Figure 4. EDS spectra of (a) DG and (b) CDG.
Sustainability 14 02469 g004
Figure 5. SEM micrographs of (a) DG and (b) CDG.
Sustainability 14 02469 g005
Figure 6. N2 adsorption–desorption curves of DG and CDG (a) and pore size distribution (b).
Sustainability 14 02469 g006
Figure 7. Zeta potential analysis of (a) DG and (b) CDG.
Sustainability 14 02469 g007
Figure 8. Comparison and UV analysis spectrum of L AY11 solution before and after adsorption by CDG: (a) 100 mg/L AY11 solution, pH = 5.96; (b) 100 mg/L AY11 solution after CDG adsorption, pH = 6.64; (c) UV–Vis spectrum of 100 mg/L AY11 solution; (d) UV–Vis spectrum of 100 mg/L AY11 solution after CDG adsorption.
Sustainability 14 02469 g008
Figure 9. Effect of adsorption temperature on CDG adsorption performance (a) adsorption capacity (b) adsorption removal rate.
Sustainability 14 02469 g009
Figure 10. Effect of adsorption time on CDG adsorption AY11 (a) adsorption amount (b) adsorption removal rate.
Sustainability 14 02469 g010
Figure 11. Effect of the mass of CDG on the adsorption of AY11 (a) adsorption amount and (b) adsorption rate.
Sustainability 14 02469 g011
Figure 12. Effect of initial concentration of AY11 on CDG adsorption performance (a) adsorption amount (b) adsorption removal rate.
Sustainability 14 02469 g012
Figure 13. Effect of initial concentration of AY11 on (a) adsorption amount and (b) adsorption removal rate.
Sustainability 14 02469 g013
Figure 14. Adsorption isotherms of AY11 onto CDG.
Sustainability 14 02469 g014
Figure 15. Effect of pH on CDG adsorption performance (a) adsorption capacity and (b) removal rate.
Sustainability 14 02469 g015
Figure 16. Regeneration performance of CDG.
Sustainability 14 02469 g016
Figure 17. Effect of adsorption time on adsorption amount (a) and adsorption removal rate (b).
Sustainability 14 02469 g017
Figure 18. (a) Quasi-first-order nonlinear and (b) quasi-second-order nonlinear dynamics model.
Sustainability 14 02469 g018aSustainability 14 02469 g018b
Figure 19. (a) Langmuir and (b) Freundlich adsorption isotherm models.
Sustainability 14 02469 g019
Figure 20. Thermodynamic model of CDG adsorption on AY11 at different initial concentrations of AY11.
Sustainability 14 02469 g020
Figure 21. Schematic representation of the adsorption process of CDG and AY11.
Sustainability 14 02469 g021
Figure 22. The adsorption mechanism of AY11 on CDG (* the terminal group).
Sustainability 14 02469 g022
Table 1. The effect of factors on the adsorption effect of AY11 on CDG.
The Effect of TemperatureThe Effect of TimeThe Effect of Mass of CDGThe Effect of Initial Concentration of AY11The Effect of pH
temperature/°C25, 30, 35, 40, 4525252525
time/min18030, 60, 90, 120, 180, 240, 300180180180
the mass of CDG/ g/L 6.56.51.5, 2.5, 3.5, 4.5, 5.5, 6.5, 7.5, 8.5, 9.5, 10.56.56.5
the initial concentration of AY11/mg/L20020020050, 100, 150, 200, 250, 300, 350, 400200
pH77771, 2, 3, 4, 5, 6, 7, 8, 9
Table 2. Specific surface area parameters of DG and CDG.
SampleBET Surface Area (m2/g)Pore Volume (cm3/g)Average Pore Size (nm)
DG1.096.3 × 10−529.42
CDG3.511.19 × 10−420.93
Table 3. Dynamic characteristic parameters of pseudo-first-order and pseudo-second-order models at different temperatures.
T/Kqe,exp/(mg/g)First-Order Kinetic ModelSecond-Order Kinetic Model
k1/min−1qe,cal/(mg/g)R2k2/[g·(mg·min)−1]qe,cal/(mg/g)R2
298 K11.330.14611.340.9970.02911.670.892
303 K11.560.12111.250.9980.02111.680.881
308 K11.590.10911.290.9950.01811.780.873
Table 4. Adsorption isotherm model parameters of Langmuir and Freundlich model at different temperatures.
T(K)Langmuir EquationFreundlich Equation
qm/(mg/g)KL/(mL/g)R2KF/(mg/g)1/nR2
29832.840.01160.98050.60810.760.9637
30327.150.01860.98530.95620.670.9618
30824.300.03070.97581.59320.570.9309
Table 5. Thermodynamic parameters at different initial concentrations of AY11.
C0/(mg/L)ΔH0/(kJ·mol−1)ΔS0/(J·mol·K)ΔG0/(kJ·mol−1)
298 K303 K308 K
1000.46−15.50−5.08−5.06−5.04
2000.23−16.21−5.15−5.14−5.12
3000.15−16.41−5.23−5.22−5.21
Table 6. Comparison of maximum adsorption capacity of adsorbents.
AdsorbentDyeOptimum Adsorption
Conditions
MG Adsorption qmax (mg/g)Reference
Fe-coated pumice stoneAcid orange 73.2 g/L; 120 min;
pH = 7; 24 °C
27.68[71]
Surfactant-coated zeoliteAcid orange 74.0 g/L; 60 min;
pH = 1; 30 °C
38.96[72]
Potash alum doped polyanilineAcid orange 71.6 g/L; 100 min;
pH = 7; 25 °C
99[73]
Metanil
yellow
1.6 g/L; 100 min;
pH = 7; 25 °C
142
Amino functionalized graphenesMetanil
yellow
0.4 g/L; 120 min;
pH = 7; 25 °C
71.62[74]
Polyaniline-bentonite compositeMetanil
yellow
1.0 g/L; 240 min;
pH = 7; 25 °C
444.4[75]
Polyacrylonitrile/activated carbon
composite
Acid yellow 990.4 g/L; 60 min;
pH = 1; 50 °C
217.39[76]
Magnetic gelatin-biocompositeDirect Yellow 120.1 g/L; 240 min; pH = 3; 30 °C476.2[77]
[Cu2-L]@MWCNTSunset yellow0.01 g/L; 120 min; pH = 7; 30 °C26.63[78]
Cationic distiller’s grains (CDG)Acid yellow 118.5 g/L; 180 min; pH = 7; 25 °C636.94This study
Publisher’s Note: MDPI stays neutral with regard to jurisdictional claims in published maps and institutional affiliations.