1. Introduction
Chemicals are the transformation of natural substances into multifunctional new substances through various processing techniques to meet the needs of human life and production. Due to the special physical and chemical properties of chemicals, dangerous events that cause casualties, equipment damage, and property losses often occur in various links of their production and use. In China, more than 80% of chemicals are called hazardous chemicals [
1]. Hazardous chemicals generally refer to highly toxic chemicals and other chemicals that are toxic, corrosive, explosive, flammable, combustion-supporting, etc., which are harmful to humans, facilities, and environment. As China is the world’s second-largest producer and user of hazardous chemicals, it is of great significance to carry out statistical analysis of hazardous chemical accidents.
Hazardous chemical accidents are from chemicals that may be risky for safe production. Serious accidents can cause mass deaths and injuries. Such accidents are often sudden, diverse, and hugely destructive. For example, the hazardous chemical explosion accident in Yancheng City, Jiangsu Province in March 2019 directly caused 78 deaths [
2]. In foreign countries, the impact of casualties caused by hazardous chemical accidents is also very large. There are also many typical casualties, for example: The explosion accident in Tianjin Binhai New Area in August 2015 directly caused 165 deaths [
3,
4,
5]; On 17 April 2013, an ammonium nitrate (AN) explosion occurred in chemical storage and distribution facility in West, Texas, leading to 15 fatalities, and more than 200 injuries [
6,
7]; At around 06.00 on Sunday, 11 December 2005, a vapor cloud explosion occurred at Buncefield Oil Storage Depot, Hemel Hempstead, Hertfordshire, UK, generating significant blast pressures [
8]. The explosion is believed to be the largest in Europe since World War II. A total of 43 people were injured in the accident, and the remaining fuel burned for more than 36 h after the explosion [
9]; On 3 December 1984, a methyl isocyanate (MIC) gas leak occurred at the Union Carbide Plant in Bhopal, India, the worst chemical disaster in modern industrial history. The release was originated by a runaway reaction triggered by water entering the storage tank and leading to boiling and over pressurization [
10]. The spill resulted in the release of 30–40 tons of MIC, affecting an area of nearly 30 square miles [
11]. The incident caused 25,000 direct deaths and 550,000 indirect deaths; On Saturday, 10 July 1976, the alkaline hydrolysis reactor of the Icmesa plant in Seveso, Italy, released a huge amount of 2,4,7,8-TCDD (tetrachloro dibenzodioxin) at an estimated concentration of 3500 ppm, due to the rupture of the bursting disc, following a runaway reaction [
12]. Eskenazi [
13] analyzed the health of local residents and pointed out that the accident caused long-term ecological, economic, and health disasters.
The casualties and property losses caused by hazardous chemical accidents are immeasurable. As the second-largest producer of hazardous chemical accidents and the second largest user of hazardous chemicals in the world, it is of great significance to carry out statistical analysis of hazardous chemical accidents. China is a major chemical producer and consumer [
14], and as such, chemical casualties occur more frequently [
15,
16]. As stated before, there were several particularly serious accidents in recent years. The social impact caused by the accident is extremely bad, causing serious harm to people’s life and property safety, environmental health, and sustainable social development [
17,
18]. Therefore, it is of great significance to carry out a statistical analysis of the death time of hazardous chemicals to understand the law of incident development and reduce the risk of accidents.
Learning from previous accidents is of great significance to preventing and controlling future accidents [
19]. A large number of scholars at home and abroad have carried out research on the laws of hazardous chemical accidents [
20]. Zhao [
21] et al. analyzed 3974 accidents, including casualties and non- casualties, that occurred in China from 2006 to 2017 from the perspective of accident characteristics, probability prediction, and safety management evaluation, as well as put forward measures to improve the safety management of hazardous chemicals through predictive evaluation. Duan et al. [
22] analyzed the hazardous chemical accidents of China from 2000 to 2006 from the aspects of accident number, geographical characteristics, enterprise scale, environmental pollution accidents, etc., and provided valuable insights for reducing the measures that should be taken. Zhang et al. [
23] conducted a statistical survey of 1632 hazardous chemical accidents (HCAs) that occurred in China from 2006 to 2010, as well as analyzed the characteristics of time, geographical distribution, and transportation types. Other scholars [
24,
25,
26,
27] also conducted statistical investigations on hazardous chemical incidents from multiple accident characteristics and proposed corresponding preventive measures. In addition, some scholars emphatically analyzed the accident from other aspects.
Li et al. [
28] believe that human factors and organizational factors are the main causes of various accidents. To further investigate the influencing factors that lead to injuries and deaths of hazardous chemicals, a Bayesian network is constructed for analysis based on the Human Factors Analysis and Classification System (BN-HFACs) method. Wang et al. [
29] pointed out that high temperature is one of the main causes of hazardous chemical accidents. Therefore, they conducted a statistical analysis on the characteristics of hazardous chemical accidents that occurred during the high-temperature season in China and put forward some scientific countermeasures. Hou et al. [
30] analyzed the characteristics and development trends of 5207 hazardous chemical leakage accidents through mathematical-statistical analysis. Huang et al. [
31] collected and sorted out 982 hazardous chemical road transportation accidents from 2013 to June 2018. They pointed out that rollover, tracking, and collision were the main traffic accidents and drew a probability accident chain diagram for the disaster evolution process of the transportation process. They also revealed the weak points of the probability distribution of various accidents and accident evolution in dangerous road transportation. Li et al. [
32] selected 1400 hazardous chemical leakage incidents from 2006 to 2011 and used the principal component analysis method to extract the five factors of pollution degree, casualties, regional distribution, step, and month. Then they analyzed the sudden leakage to investigate and demonstrate the characteristics, causes, and hazards of the accident. Ma et al. [
33] used the ordered Logit regression model to quantitatively analyze the causes of road transport accidents of dangerous goods. Jeon et al. [
34] put forward accident prevention and improvement measures through statistical analysis of hazardous chemical transportation vehicle accidents. Tsai et al. [
35] used disaster simulation analysis software to simulate and quantify the consequences of chain fires in chemical plants and analyzed the follow-up accident rescue procedures. Rafaqat et al. [
36] assessed the hazards of the diffusion of hazardous chemicals and chlorine and used regional statistical tools and geographic information tools to determine the follow-up evacuation situation. Yoo et al. [
37] developed an emergency evacuation plan for hazardous chemical leakage accidents based on GIS risk analysis technology.
The above-mentioned accident statistics mostly selected several accident characteristics (accident time, location, physical appearance) for analyzing, and lack the comprehensive and cross-analysis among the accident characteristics, especially the analysis of multiple characteristic factors is not deep enough. To study the characteristics of casualties of hazardous chemicals in China, this paper analyzes the casualties of hazardous chemicals from 2015 to 2021. A cross-comprehensive analysis of hazardous chemical accidents was carried out from the aspects of time characteristics, geographical characteristics, accident type characteristics, types of hazardous chemicals, production links of hazardous chemicals, characteristics of accident causes, and accident classification. In addition, related preventive measures have also been proposed, and then provide a reference for the realization of safe production of hazardous chemicals. With reference to GB4661-85 “Classification of Casualties of Enterprise Employees”, the casualties counted in this article mainly include vehicle injury incidents, burning incidents, fire incidents, various explosion incidents, and some other injury incidents during the transportation of hazardous chemicals. Due to the sudden nature of hazardous chemical casualties that occurred in restaurants, rural areas, and homes, this article will not study them. In addition, in the case of non-chemical incidents, this article will not analyze this.
3. Characteristics of Hazardous Chemical Accidents
3.1. Time-Volatility Characteristics
3.1.1. Yearly Occurrence
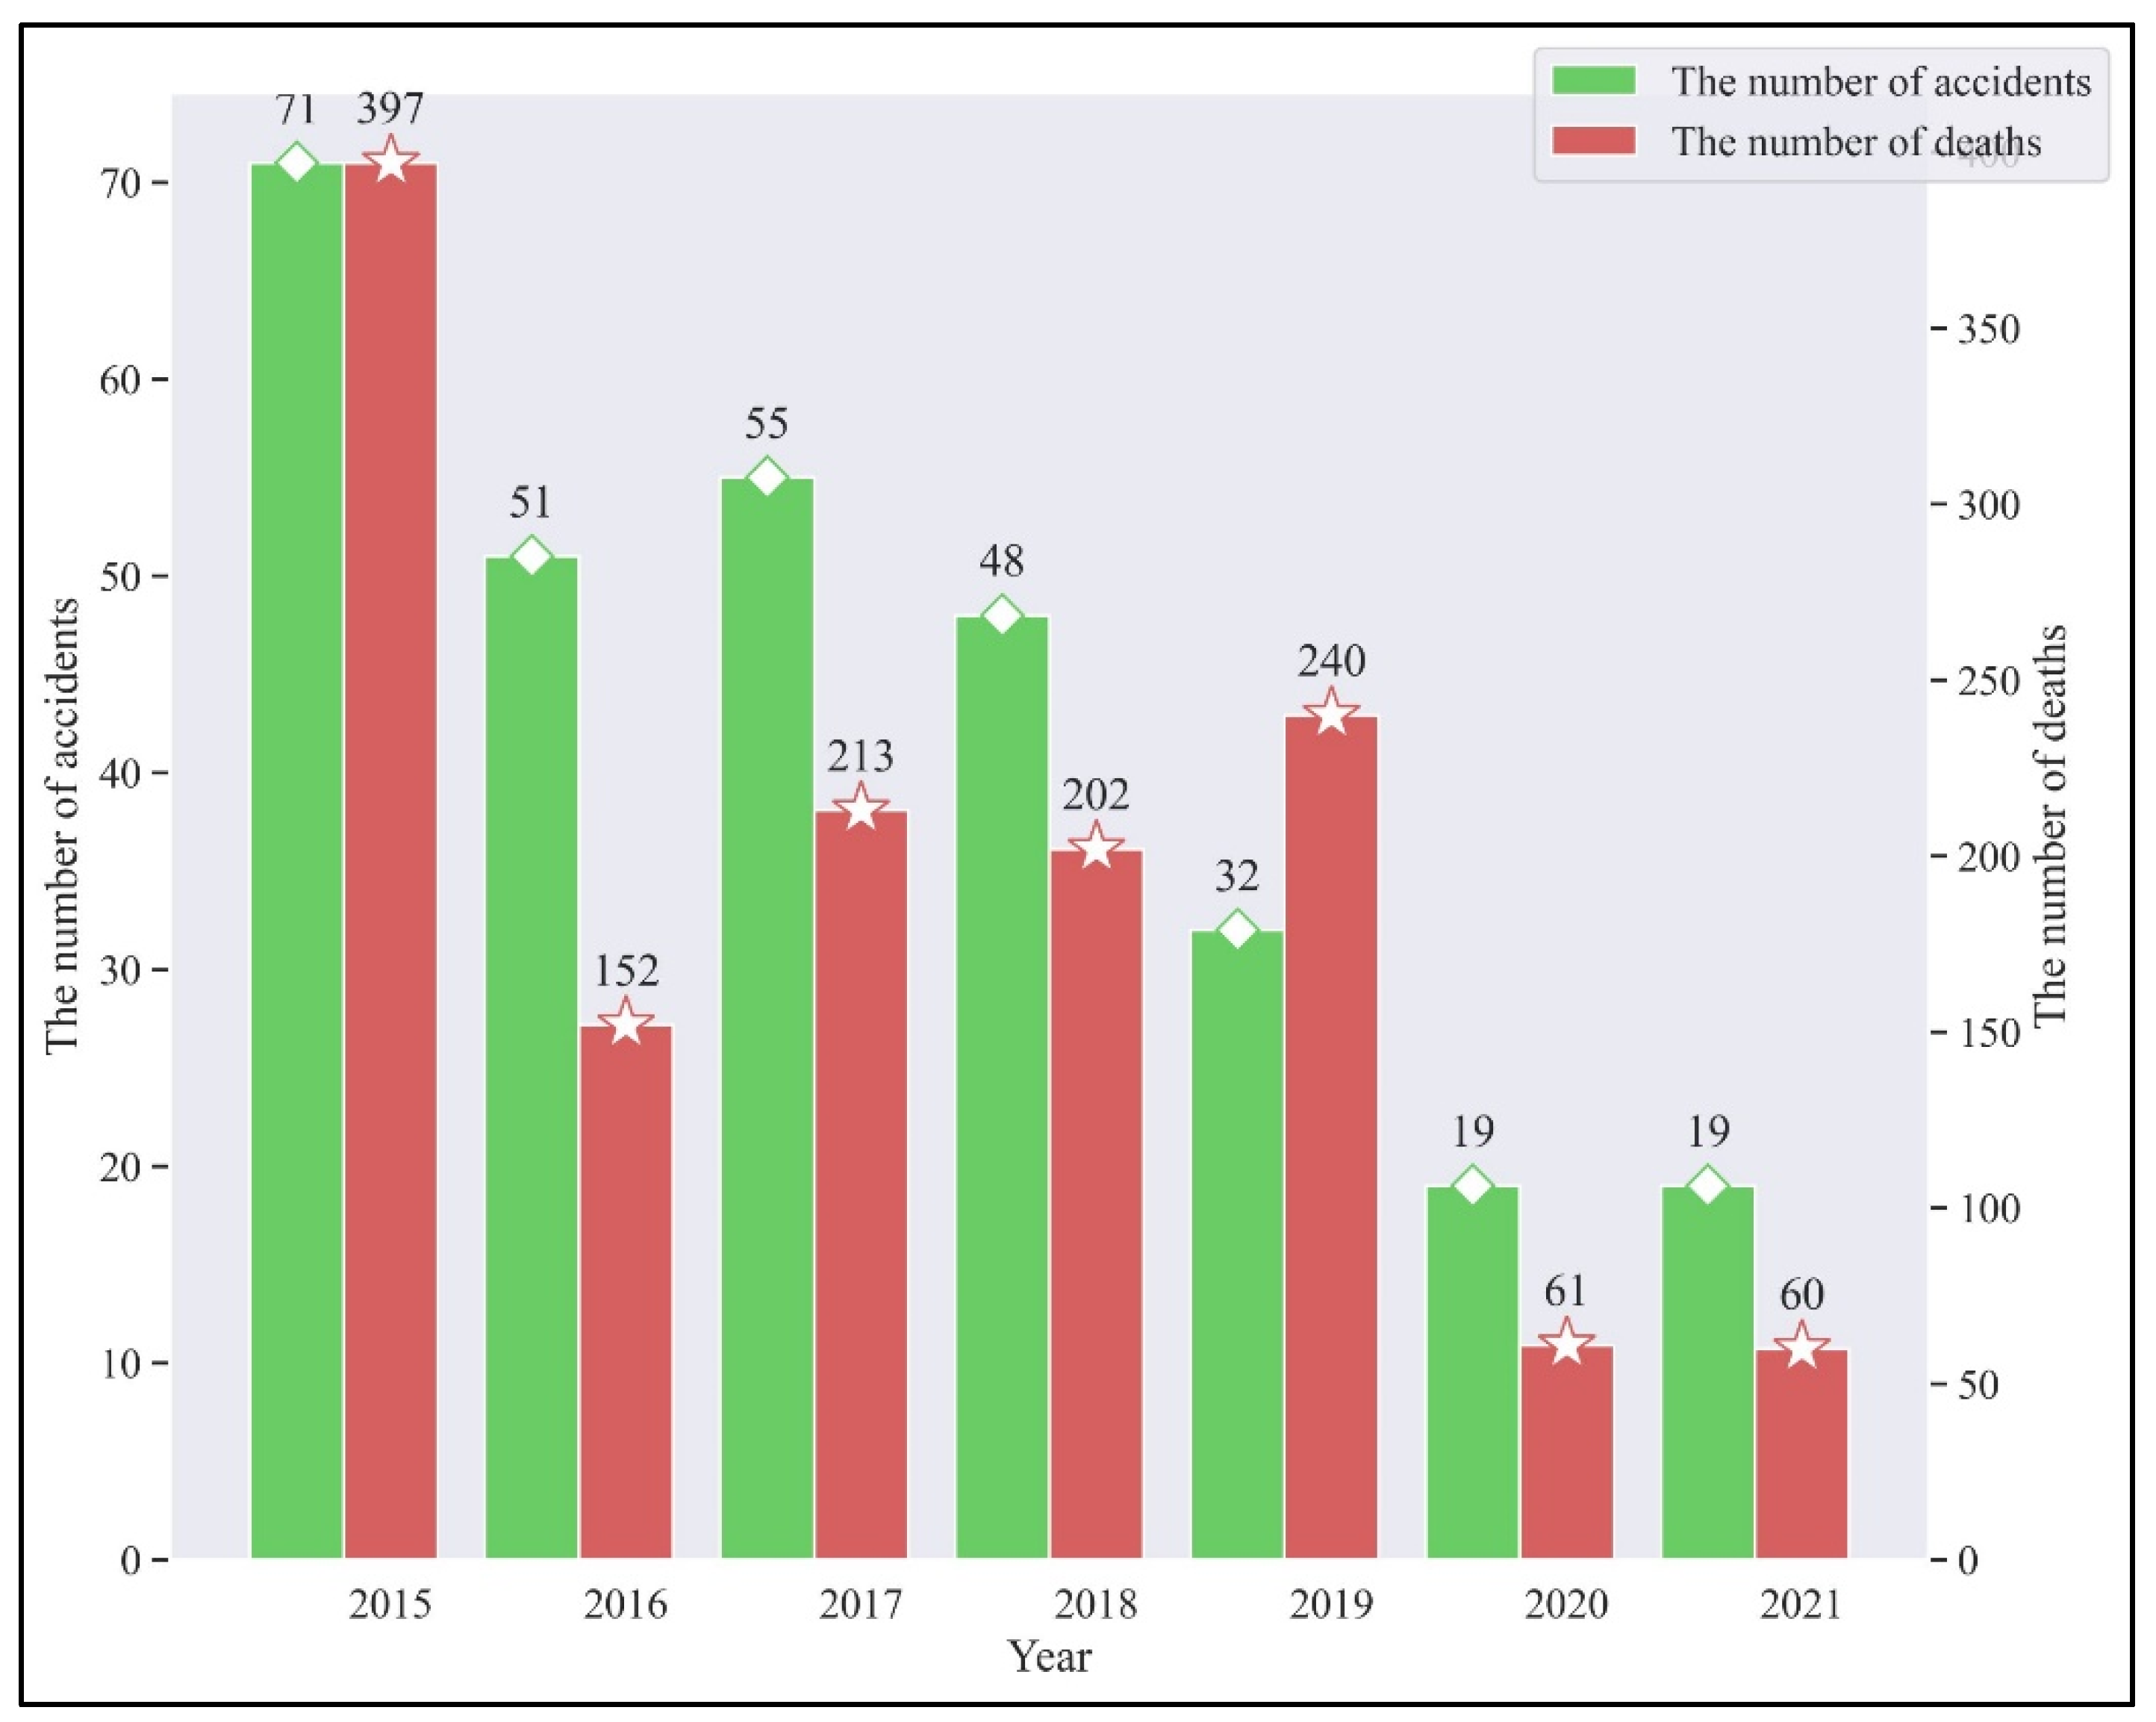
Figure 2 reflects the trend of hazardous chemical accidents over the years. It can be seen from
Figure 1 that there were 295 hazardous chemical accidents in our country from 2015 to 2021, with 1325 deaths. The ◇ and ☆ in the figure are easy to distinguish the meaning of the vertical axis of the bar graph, where ◇ corresponds to the number of accidents, ☆ corresponds to the number of deaths, it is the same meaning in the text. From the perspective of overall trend changes, the number of accidents involving hazardous chemicals has been declining year by year, except for slight fluctuations in 2017. However, since the statistics of accidents in 2021 are in the first half of the year, the number of accidents involving hazardous chemicals from 2020 to 2021 is still an upward trend. What we need to be aware of is that the global production capacity has dropped significantly due to the impact of COVID-19 in early 2020, which has also caused the chemical production industry to be affected. This is found from the timing and number of deaths in 2020 (compared to the number of accidents and fatalities in previous years, the number of accidents and fatalities in 2020 will be significantly lower). Simultaneously, we can find the number of casualties fluctuates greatly and the overall trend is in an “M” shape. In particular, the number of casualties in 2019 has increased by nearly 18.8% compared with 2018, but it has declined relative to the number of accidents. Generally speaking, the trend of the death toll with casualties is basically similar.
3.1.2. Monthly Occurrence
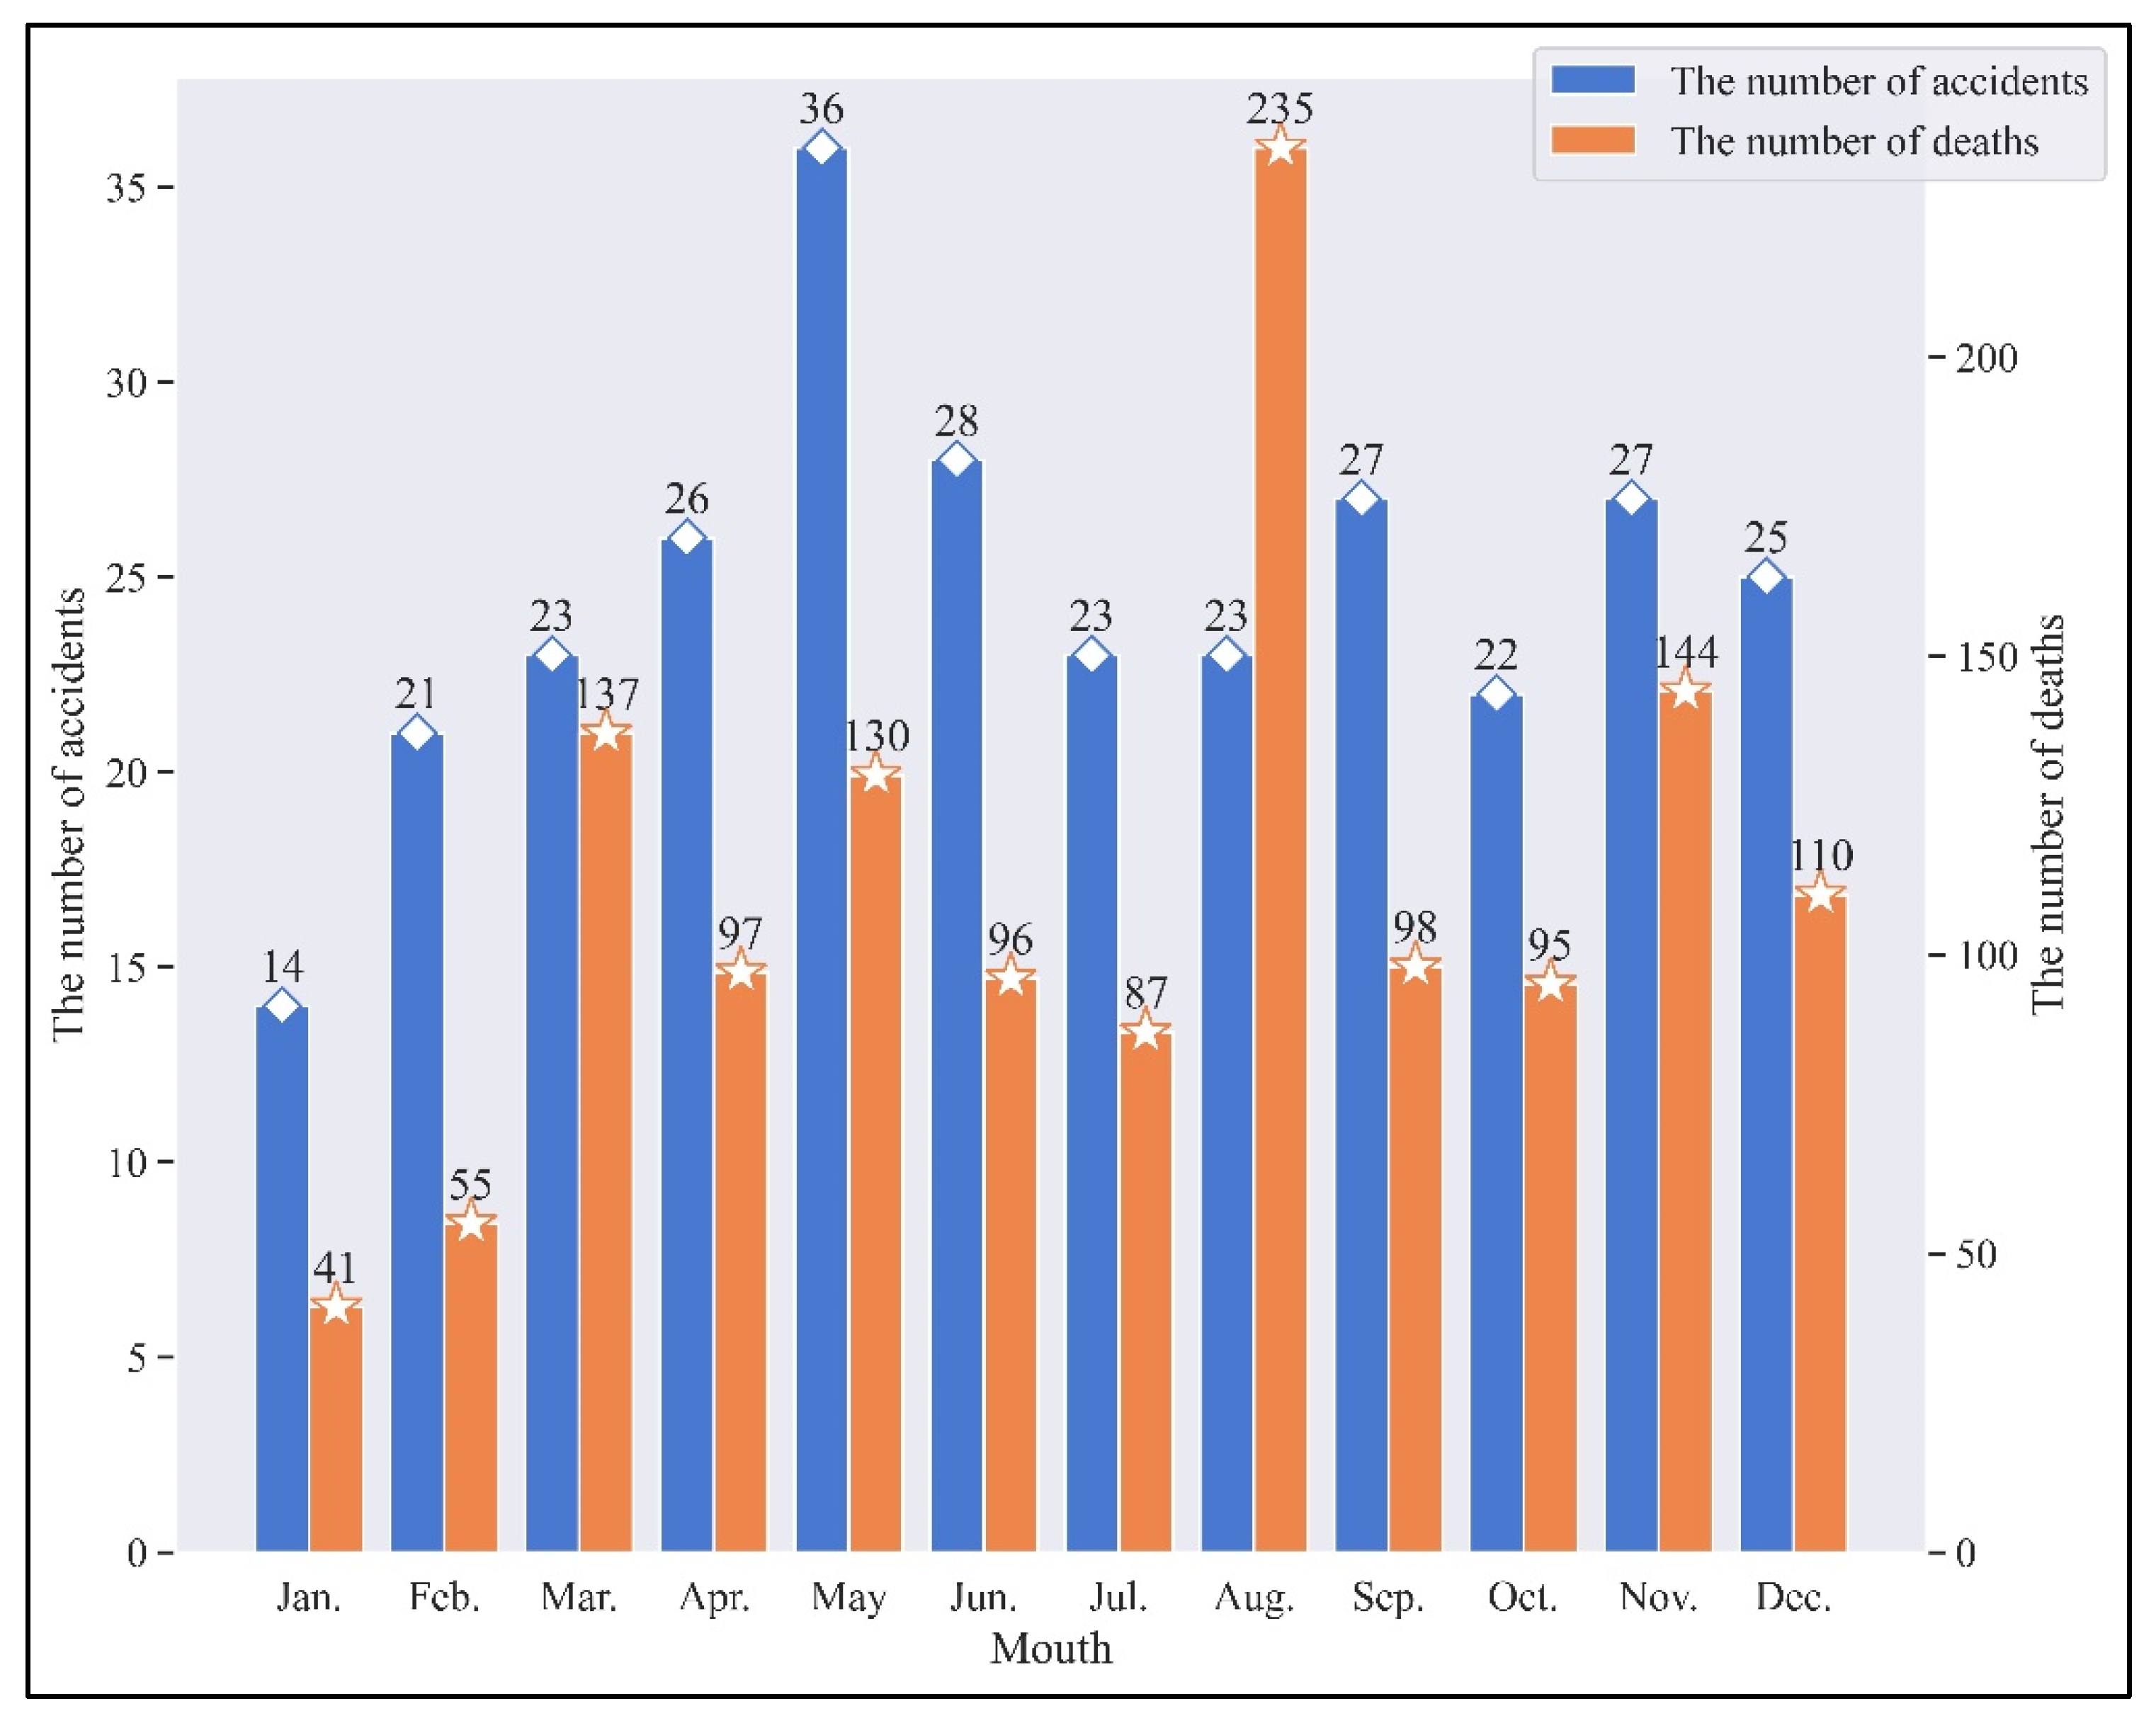
The monthly trend chart of the number of hazardous chemical casualties and the number of deaths is shown in
Figure 3. The abscissa represents the monthly distribution of hazardous chemical accidents in my country from 2015 to 2021, and the ordinate represents the number of hazardous chemical deaths in different months (blue (Color) and the number of deaths caused by hazardous chemical deaths (orange). The main purpose here is to count the events obtained from statistics according to the month of occurrence.
From the analysis of the trend change graph, it can be seen that the death toll is in a wave shape and the overall trend is “M”. That is, there are fewer deaths in January and February at the beginning of the year, while the death toll increased sharply in March. After the decline in April compared with the previous period, the death toll followed in May. However, the number of deaths in the next June and July showed a downward trend compared with the previous period. August also increased and is the month with the highest number of deaths in recent years. Since September, the number of casualties has also decreased. The next few months showed a similar volatility trend. The number of casualties of hazardous chemicals increased month by month from January to May, the number of casualties decreased month by month from May to August, and the number of casualties from August to December showed an “M” trend.
Judging from the overall trend, the period from March to August each year is a high incidence of accidents involving hazardous chemicals. The death toll was the highest in August, the number of casualties was the highest in May, and the number of casualties and deaths was the lowest in January. From March to August, most areas of China are in high-temperature weather. These natural factors tend to increase the possibility of hazardous chemical accidents. On the one hand, there will be continuous rain and high-temperature weather in these few months, which will cause changes in the physical and chemical properties of hazardous chemicals. On the other hand, the existence of high-temperature weather will cause changes in the physical and psychological conditions of the operators. In the normal operation process, there will be paralysis, negligence, inattention, etc., and it will also lead to casualties. In addition, high-temperature weather can also cause leakage of storage tanks and excessive internal pressure of pressure vessels, which can induce fire and explosion accidents. For example, the number of hazardous chemical accidents was not the highest in August, but the death toll was the highest in August, which is also due to the explosion of hazardous chemical products and many fire accidents at this stage, causing more deaths and injuries. Therefore, chemical companies should increase the supervision of high-temperature weather to prevent accidents.
From the accident statistics chart, we find that the number of casualties and deaths in January and February is the least. On the one hand, due to the impact of the Spring Festival, the production scale of some chemical industries has decreased. The casualties were significantly higher in March than that in January and February, which was also due to the start of construction in the spring. On the other hand, the low-temperature weather has hindered the production of some chemicals, so some companies will stop production. Additionally, the fatalities of accidents in November and December are also relatively high. The rupture of the product production pipeline can also lead to leakage incidents, as well as frequent accidents such as fires, explosions, and poisonings.
3.1.3. Daily Occurrence
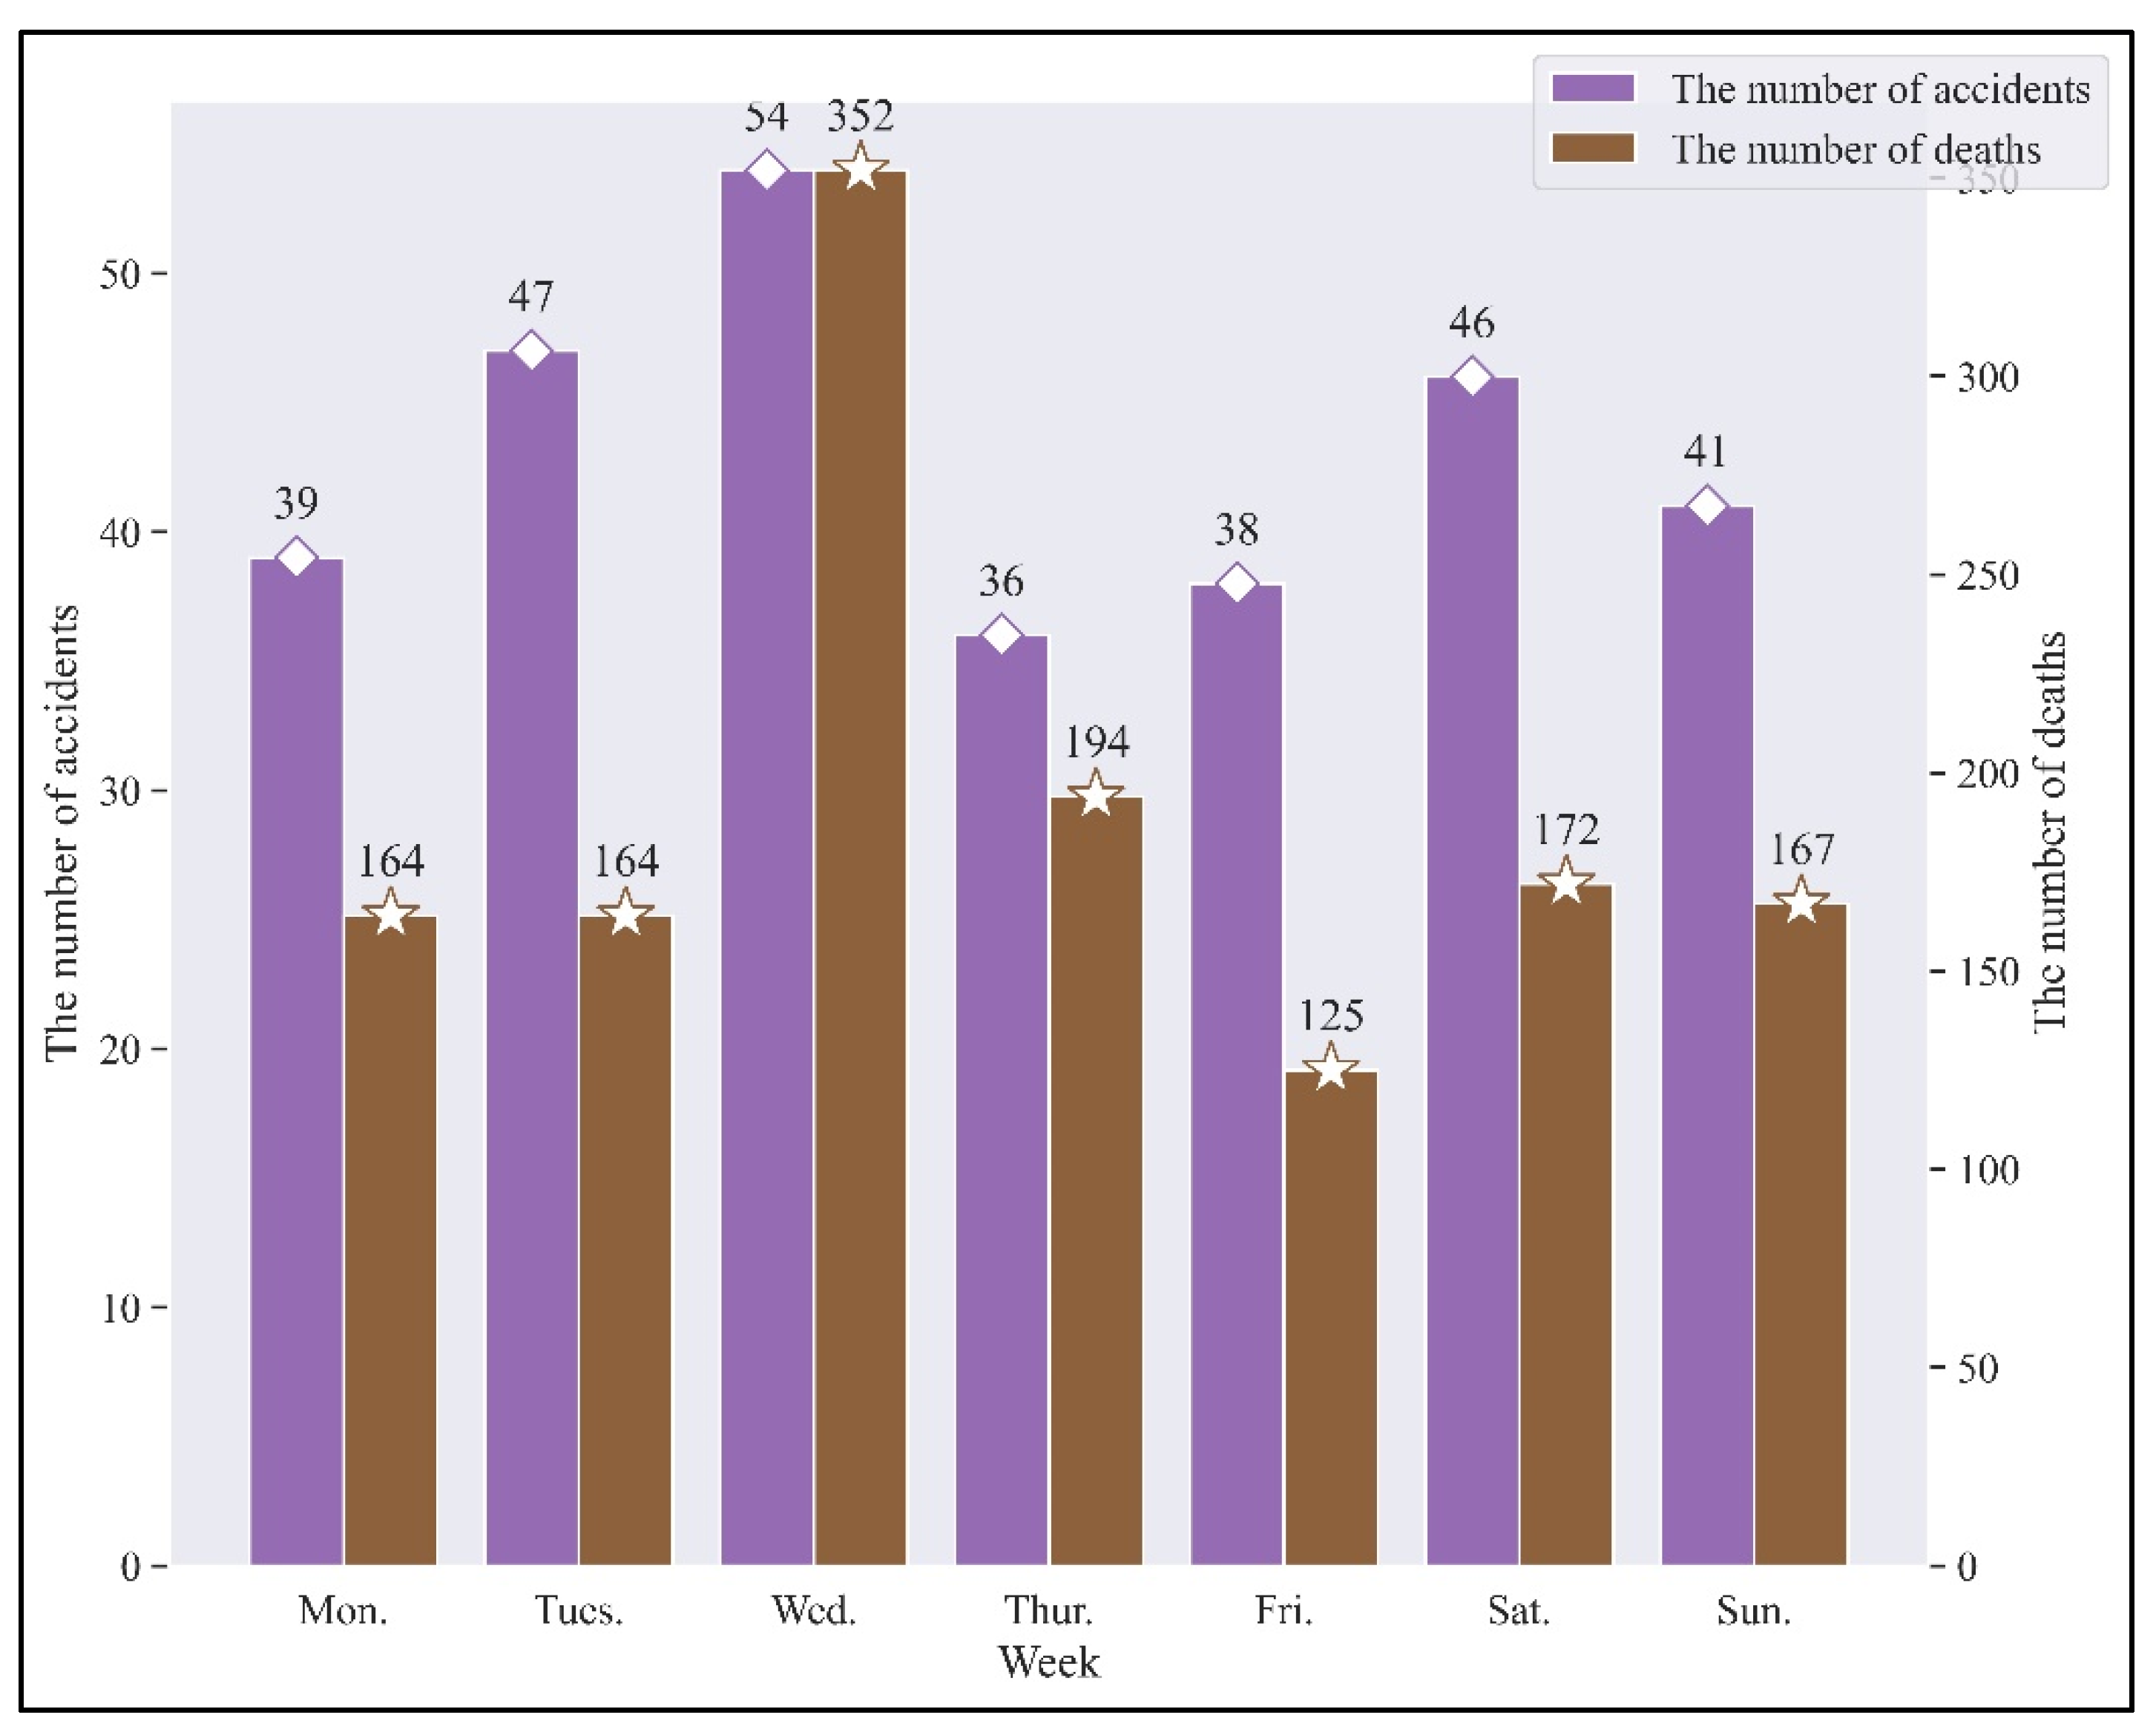
The “week” trend chart of the number of hazardous chemical casualties and the number of deaths is shown in
Figure 4. The abscissa represents the date distribution from Monday to Sunday (Monday to Sunday). The ordinate represents the number of deaths from hazardous chemicals (purple) and the number of deaths from hazardous chemicals (brown) on different days.
The main purpose here is to count the events obtained by statistics according to the time of occurrence of seven days a week, and the purpose is to explore the influence of different working days on the regularity of accidents. An analysis of accident change characteristics by “week” is shown in
Figure 3. As can be seen from the figure, among the hazardous chemical accidents, the death toll on Friday was the least, while the death toll was the most on Wednesday, accounting for approximately 26.57% of the total death toll. Corresponding to the number of casualties, Thursday and Friday were close, with Wednesday having the most casualties. It is not difficult to analyze from the daily change characteristic trend chart. Wednesday is in the middle of the weekly production date. The activities of workers, mental state, and attention have all declined. After Thursday, the mental state of workers has slightly improved, and the working state on Friday is better. Due to the critical weekend, some chemical companies cut production and rest, so the number of accidents has decreased. Some workers took it lightly on weekends, resulting in a high accident rate and death rate.
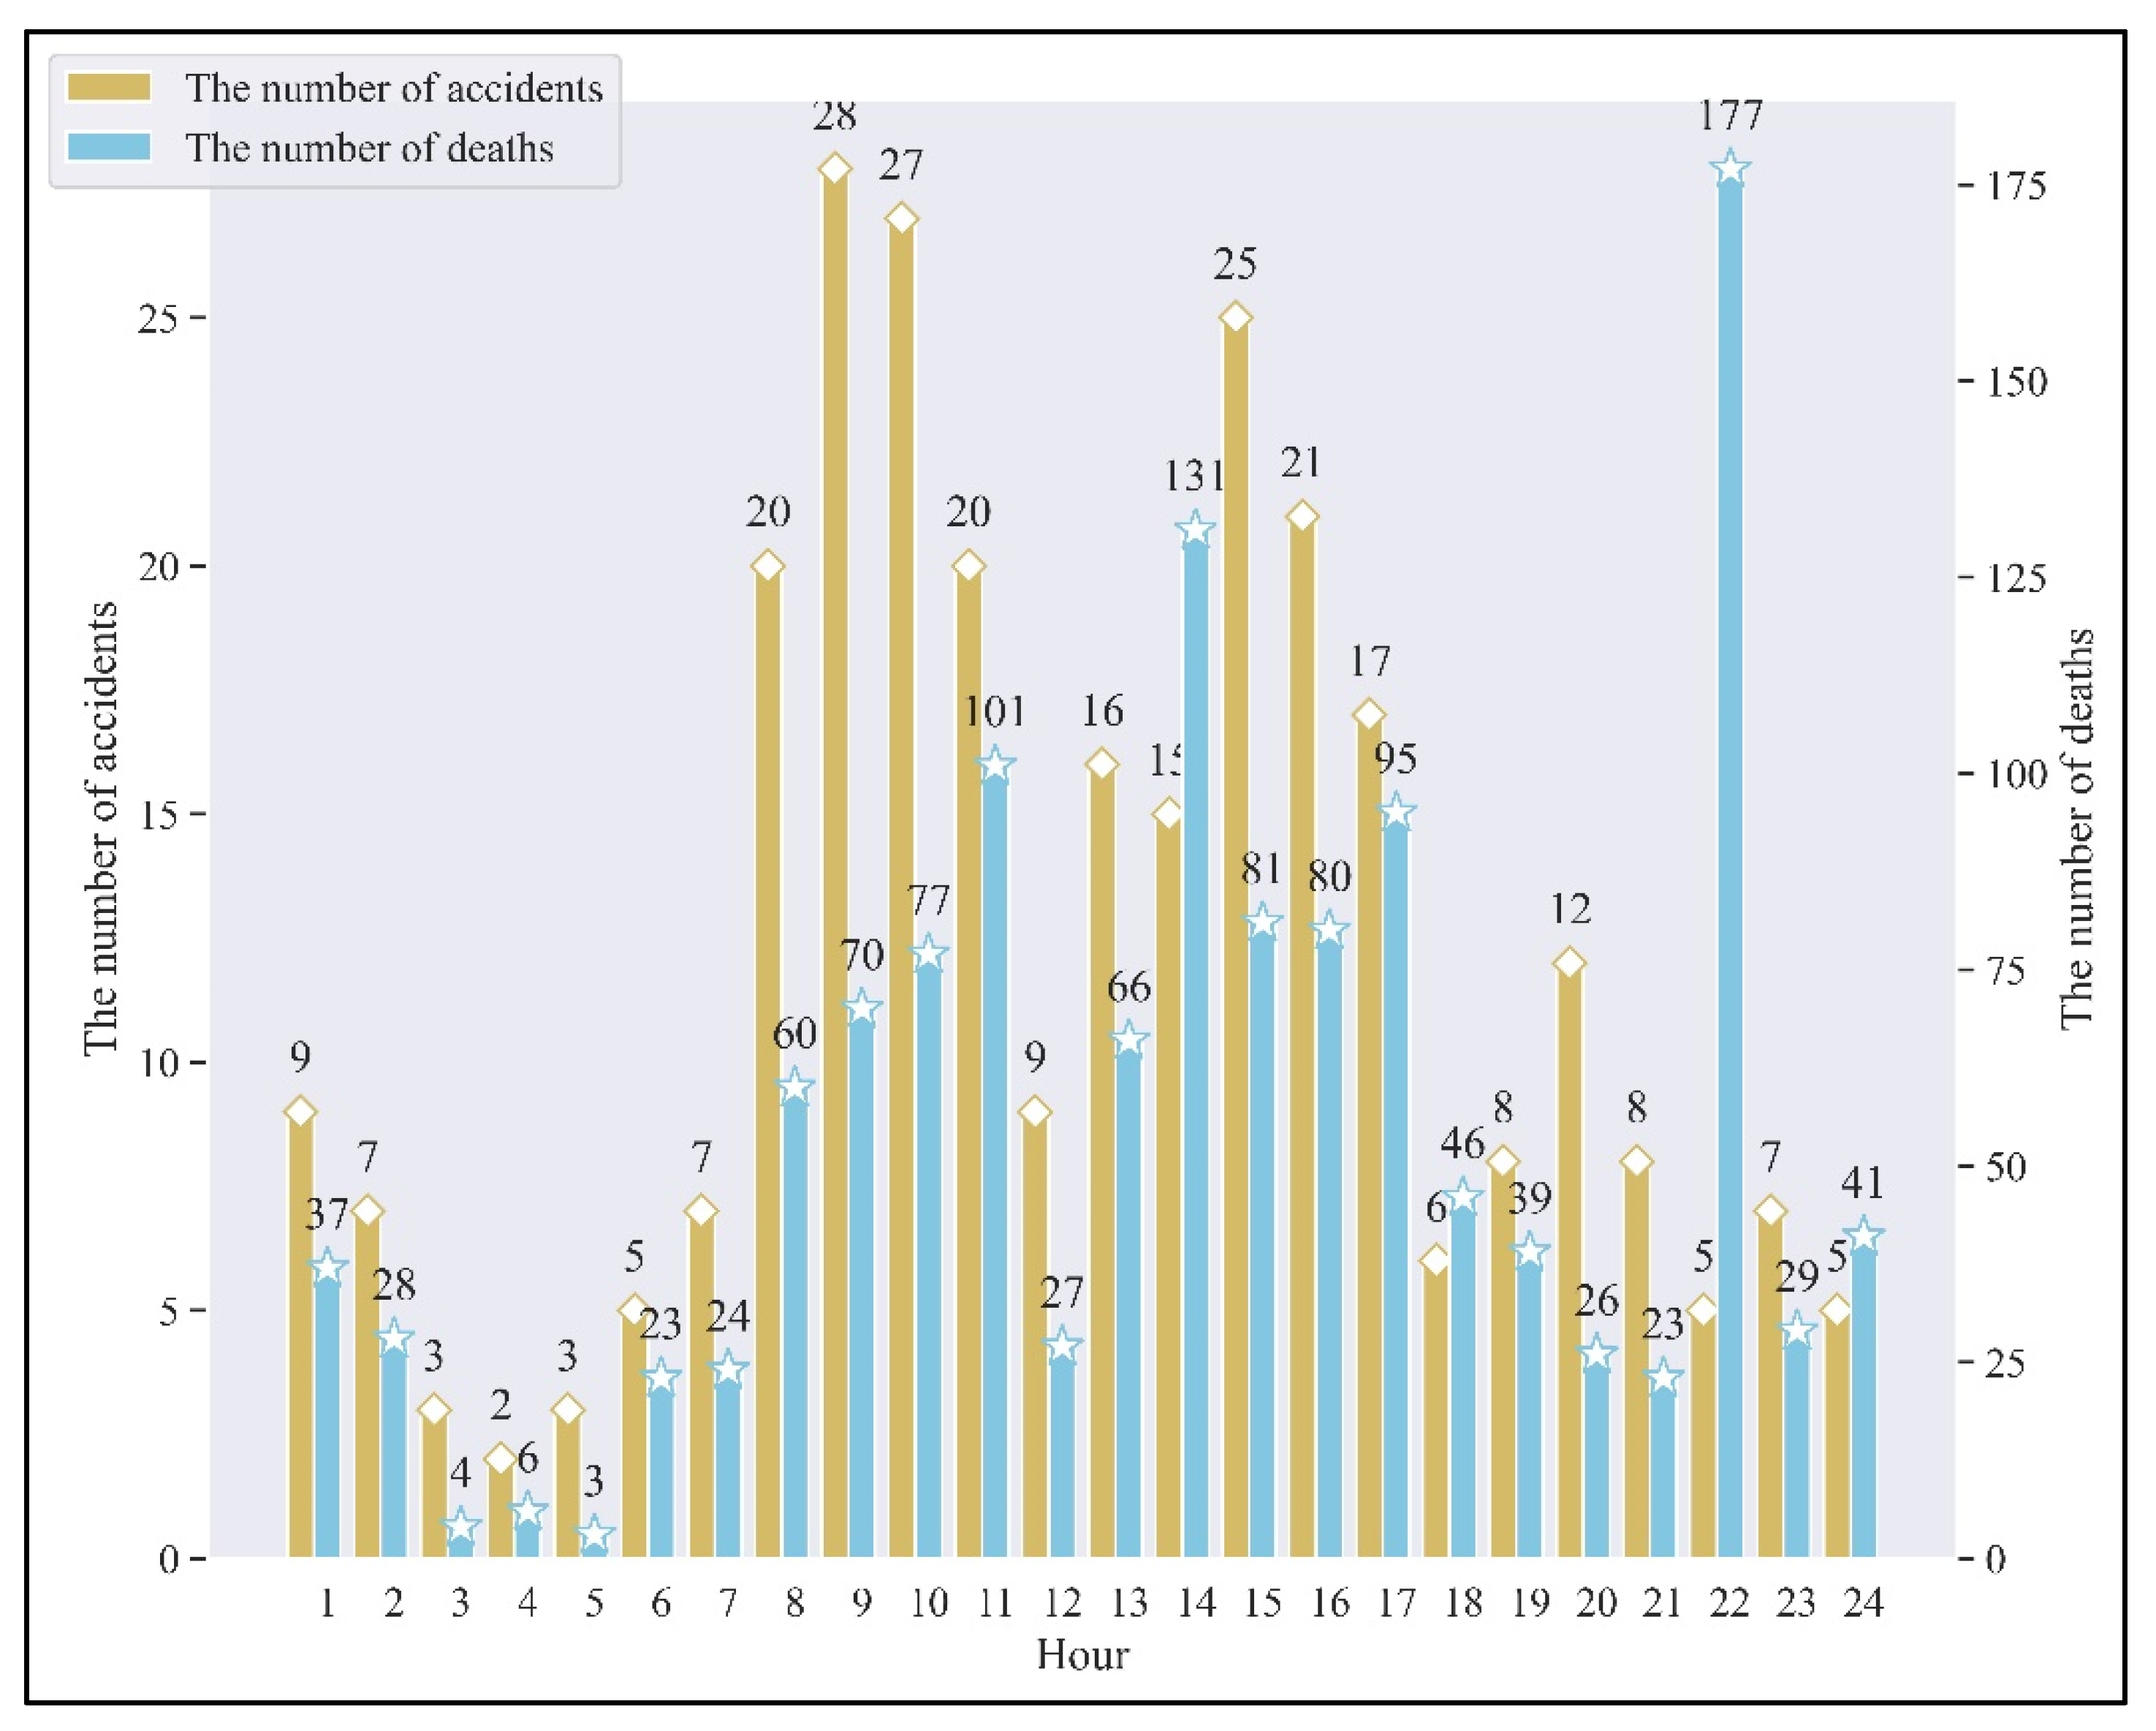
3.1.4. Hourly Occurrence
The number of hazardous chemical casualties and the number of deaths in specific time periods are shown in
Figure 5. The abscissa represents the distribution of different time periods of the day (24 h). The ordinate represents the number of deaths of hazardous chemicals (dark yellow) and the number of deaths caused by hazardous chemical deaths (light blue) that occur in different time periods of each day.
According to the statistical results, the number of casualties and the distribution of deaths in different time periods are different, as shown in
Figure 4. Analyzing from 1–24 points, the number of casualties will gradually increase from five points. It will reach a peak after 9:00 in the morning and will drop to the lowest point at 12:00. From 13:00 onwards, the number of casualties will gradually increase and will reach its peak again at 15:00. The number of accidents will remain relatively stable after 17:00, except at 20:00. After a slight increase, the number of accidents remained stable. For the number of fatalities caused by accidents, the overall trend is similar to the number of accidents: from 6 to 11 in the morning, the number of fatalities increased, and then dropped to a trough at 12:00. From 13:00 to 21:00, there will be fluctuations in the middle, peaks will appear at 14:00 and 16:00. There will be a peak at 22:00, the death toll is the highest at 22:00, and the number of deaths in the statistical interval is 177, accounting for approximately 13.36% of the total death toll.
It can be seen from the above trend change graph that 9:00–11:00 (inclusive) and 15:00–16:00 (inclusive) are the two time periods with the largest number of incidents in a day. On the one hand, during this time period, the workers have been on duty for a period of time, as well as physical and psychological fatigue have already occurred. On the other hand, the time period is close to leaving to get off work, as well as employees are relatively distracted and prone to negligence and misoperation. Therefore, chemical companies should pay attention to the safety supervision of the current stage, in which they can relax their vigilance by carrying out relevant activities.
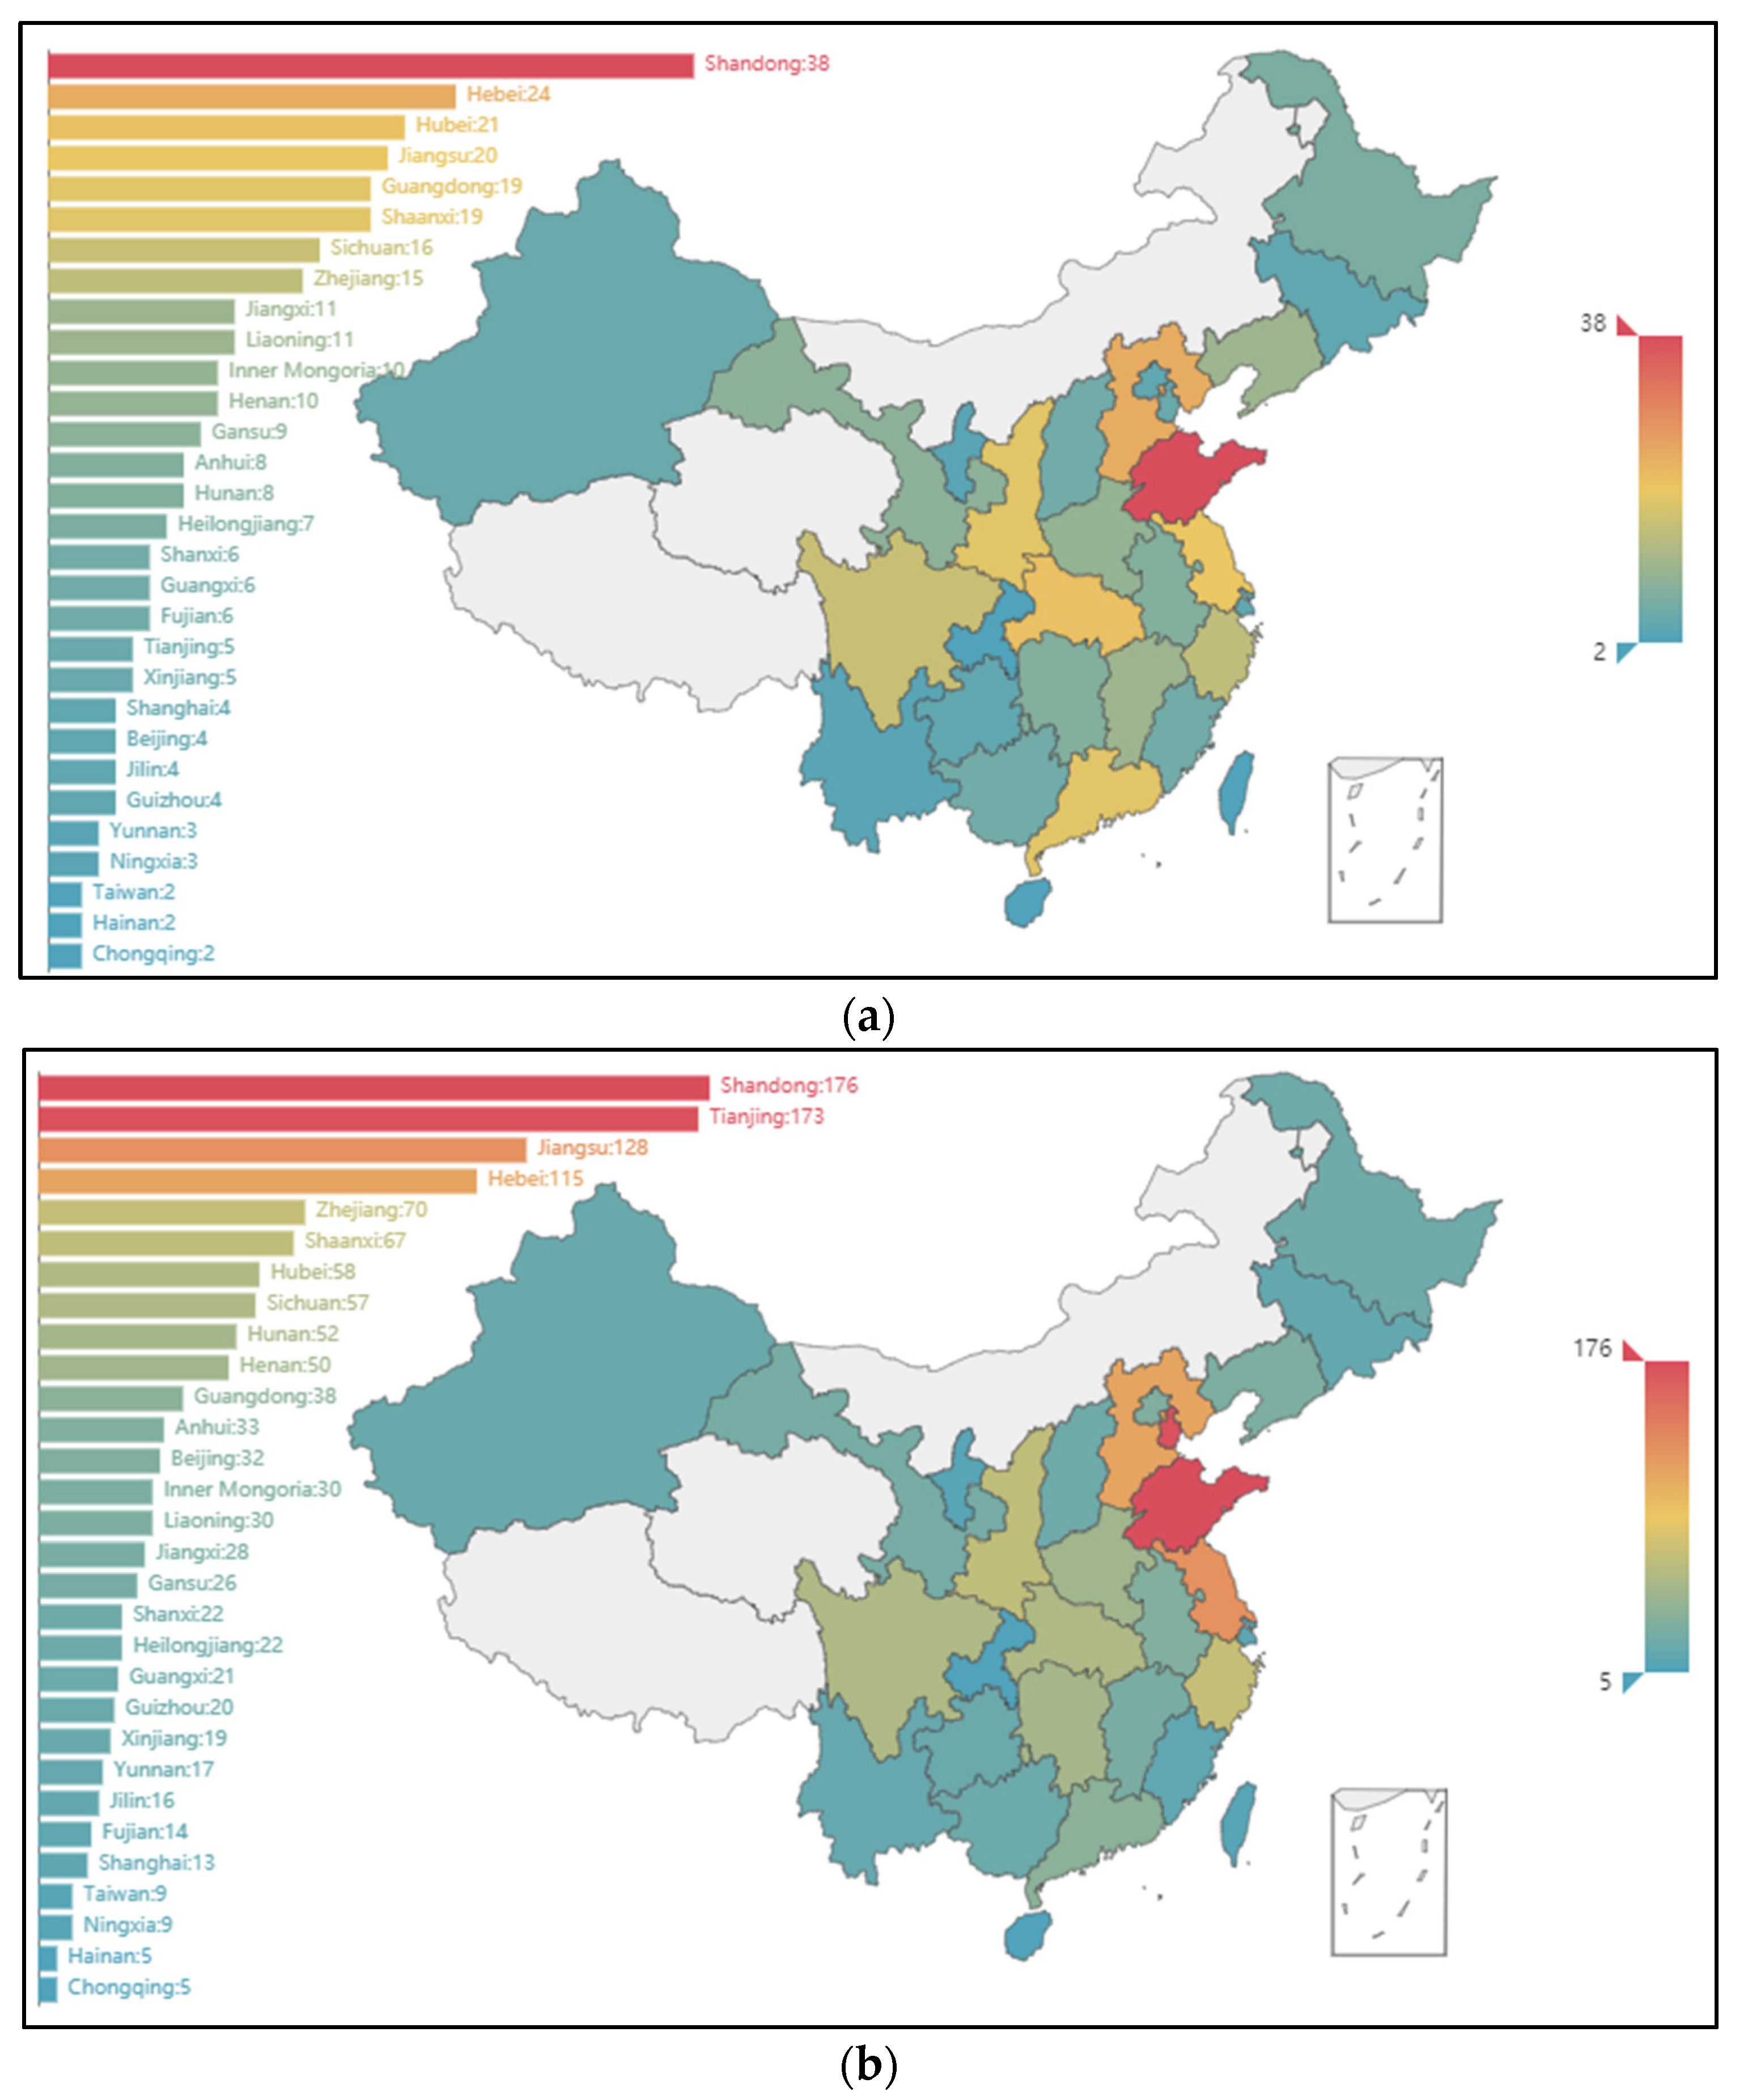
3.2. Location Distribution
Figure 6 shows the number of occurrences and deaths of hazardous chemicals nationwide from 2016 to 2021. Among them, Shandong, Hebei, Hubei, and Jiangsu provinces suffered the most casualties, 38, 24, 21, and 20, respectively. According to the number of fatalities in the accident, Shandong, Tianjin, Jiangsu, and Hebei provinces had the most fatalities, with 176,173, 128, and 115 people, respectively. There were no fatal accidents in Inner Mongolia, Tibet, and Qinghai.
Analyzed by coastal and non-coastal areas, coastal areas in China, including Liaoning, Tianjin, Hebei, Shandong, Zhejiang, Jiangsu, and other provinces, had 113 casualties, accounting for 38.3% of the total number of accidents, as well as a total of 692 deaths, accounting for deaths. A total of 52.23% of the total number of people.
By geographical area, there were 39 casualties in North China (Beijing, Tianjin, Shanxi Province, Hebei Province, and Inner Mongolia Autonomous Region), accounting for 13.22% of the total number of accidents, and a total of 342 deaths, which accounted for 25.81% of the total deaths. There were 104 casualties in Eastern China (Shanghai, Jiangsu, Zhejiang, Anhui, Fujian, Jiangxi, Shandong, and Taiwan), accounting for 35.25% of the total number of accidents, and a total of 471 deaths, accounting for 35.55%. According to the three major economic divisions, there were 154 casualties in the eastern regions (Beijing, Tianjin, Hebei, Liaoning, Shanghai, Jiangsu, Zhejiang, Fujian, Shandong, Guangdong, Guangxi, and Hainan) and other provinces, accounting for 52.2% of the total number of accidents. There were 815 deaths, accounting for 61.51% of the total deaths.
From the above statistical analysis, it can be seen that the occurrence of hazardous chemical casualties is related to the province’s GDP. In the past five years, Shandong (73,129), Hebei (36,206.9), Jiangsu (102,700), and Hubei Province (43,443) have experienced more accidents. It accounts for 25.15% of the national GDP (according to the 2020 data). It showed that the relevant government departments must strengthen the supervision of hazardous chemicals on the southeast coast to prevent casualties.
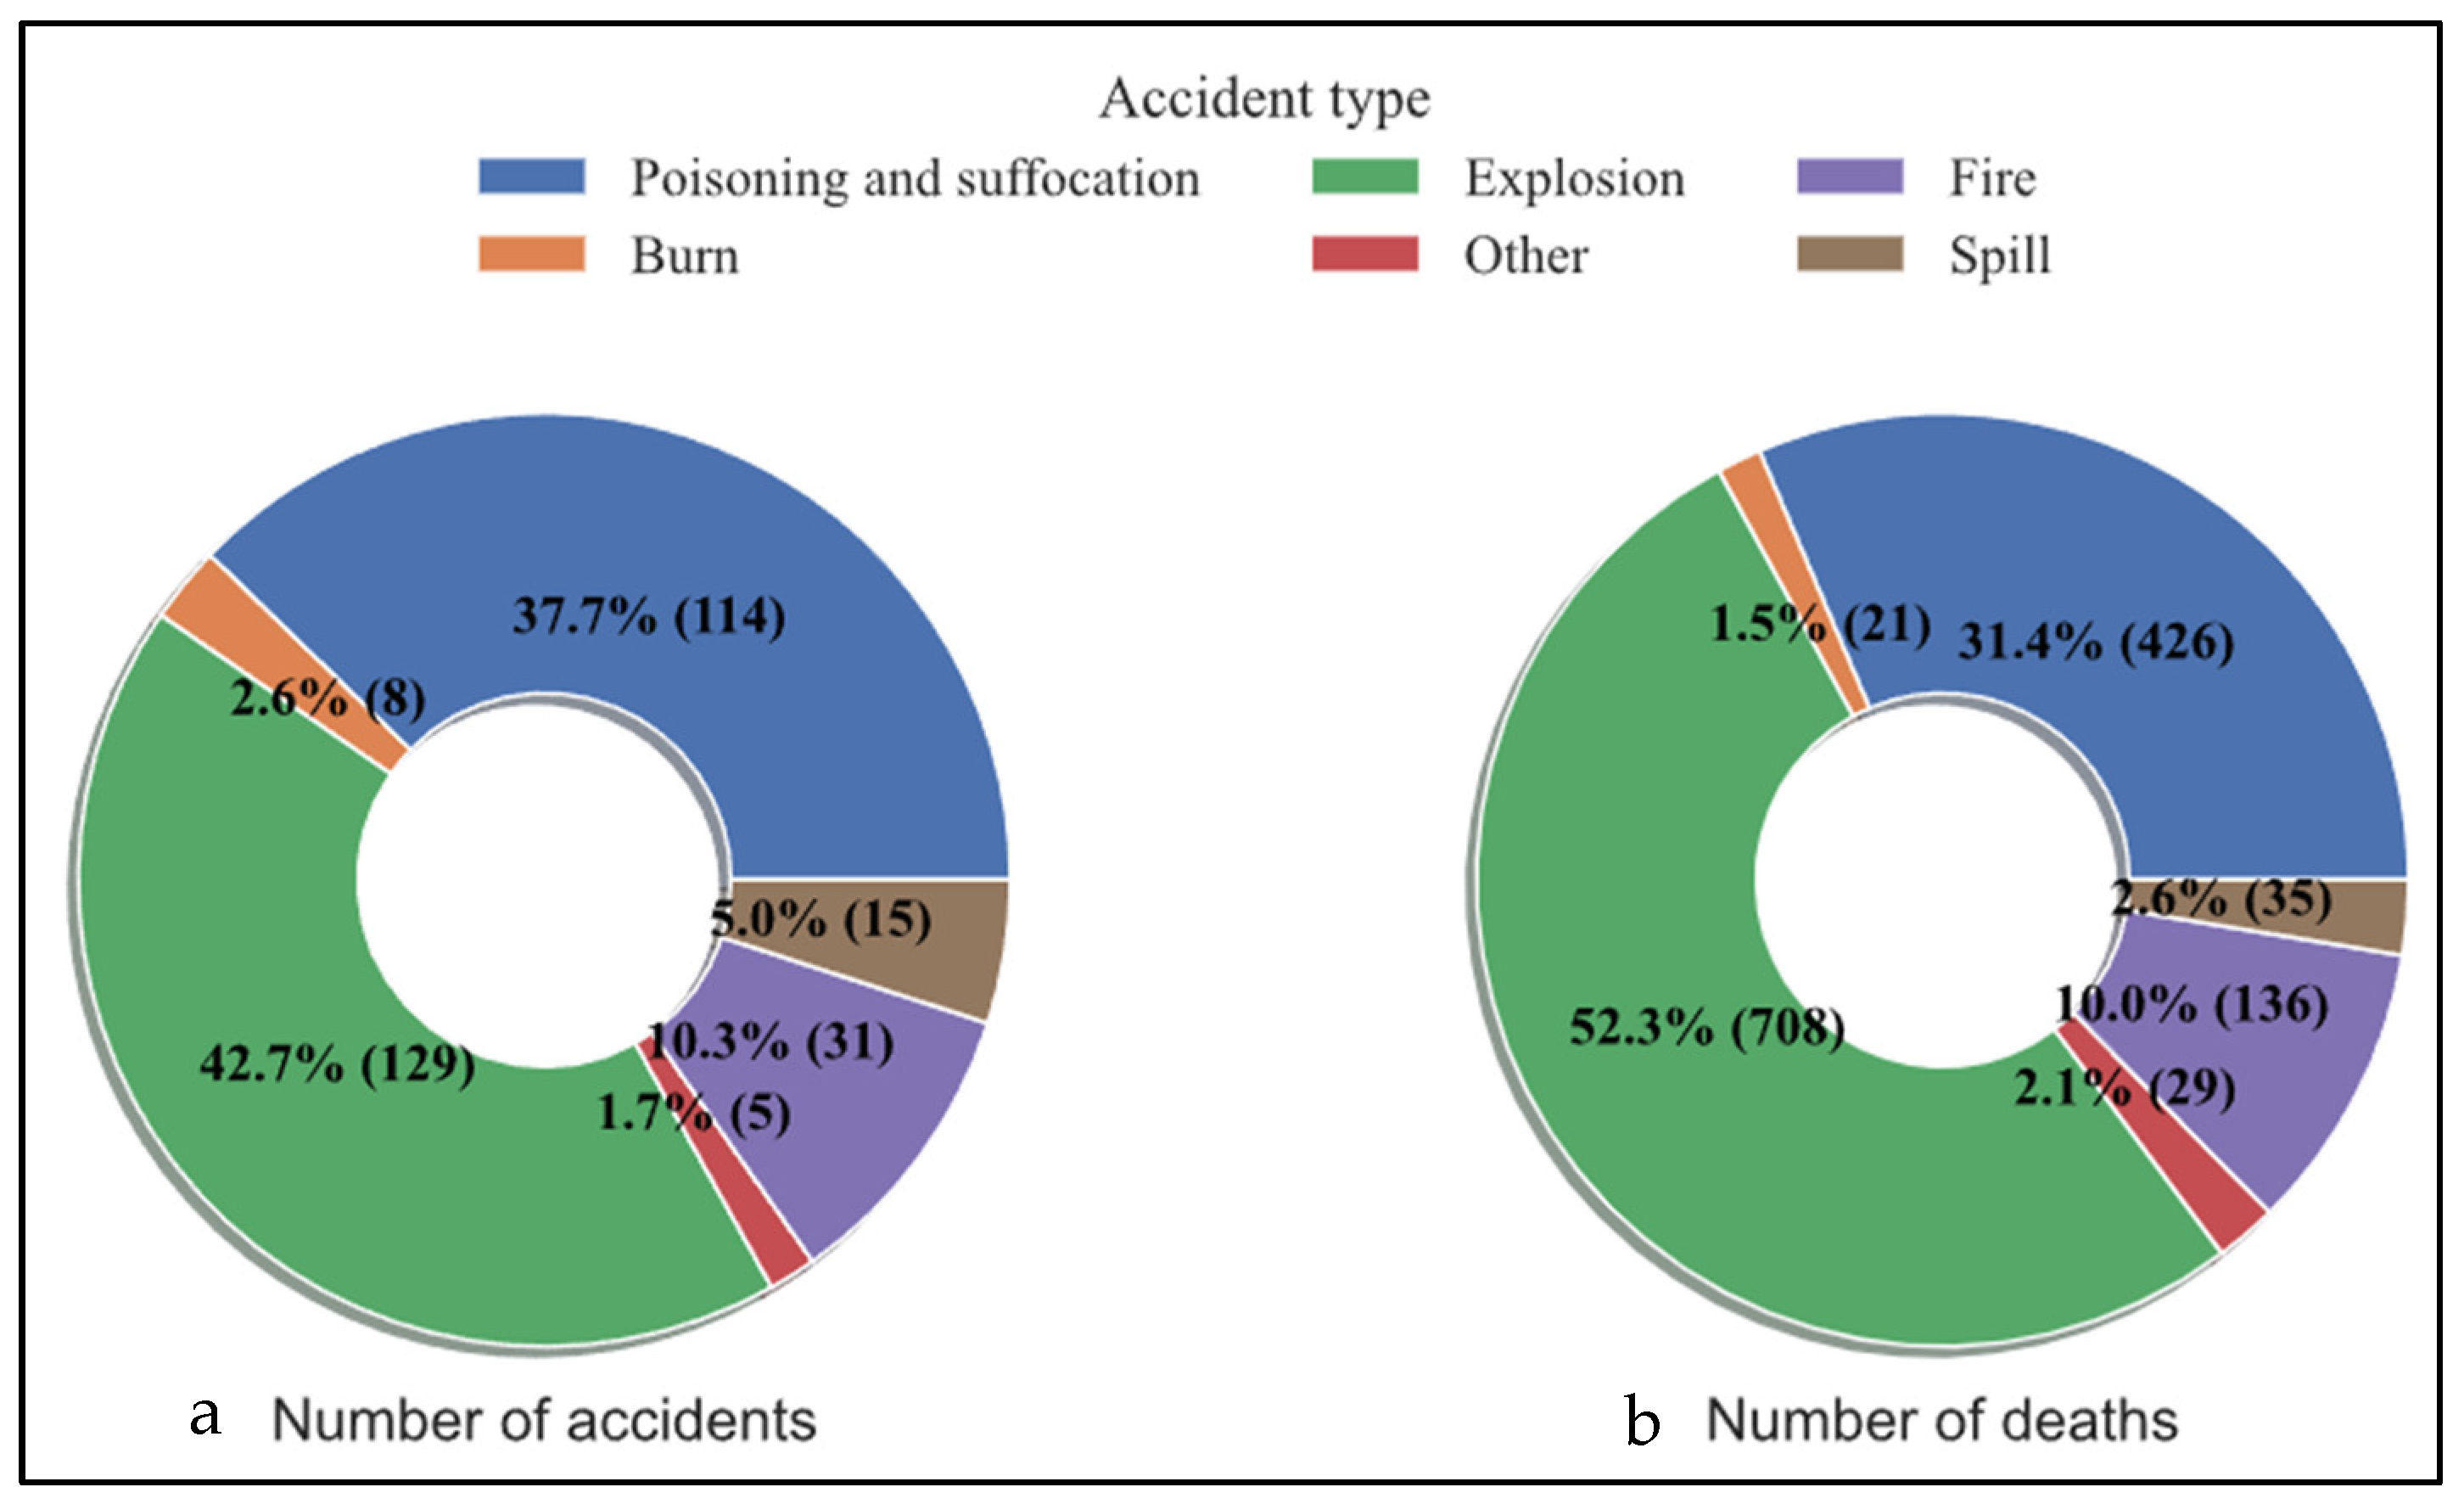
3.3. The Accident Types of HCAs
The types of hazardous chemical accidents are divided into six categories, including explosion accidents, fire accidents, leakage accidents, poisoning suffocation accidents, scorching accidents, and other accidents. The statistics of casualties and deaths corresponding to accident types were shown in
Figure 7. It can be seen from the figure that the number of explosion accidents, poisoning, and suffocation accidents is the largest, 129 and 114, respectively, accounting for 42.7 and 37.7% of the total casualties. Other types of casualties and burning accidents have the least number of incidents. From the death toll chart, it can be found that the explosion accident type has the largest number of deaths, causing a total of 708 deaths, accounting for about 52.3%, and an average of six deaths per accident. Poisoning and suffocation accidents are the second most likely to cause deaths, causing 426 deaths, accounting for about 31.4%, and an average of 3.74 deaths per accident.
As mentioned above, once an explosion occurs, it will cause a large number of deaths and injuries. The energy is released quickly and the response to the workers is short, resulting in no time to escape, which will cause huge casualties. Poisoning suffocation incidents are often caused by blind rescue. Other workers will go to rescue blindly when individual workers are poisoned, which will also cause casualties. To avoid explosions, chemical companies need to increase inspections and key equipment management, strictly control chemical production process indicators, and do a good job of early warning. For poisoning incidents, it is necessary to ensure that employees are certified to work and training in special operations must be strengthened so that workers have knowledge of chemical safety.
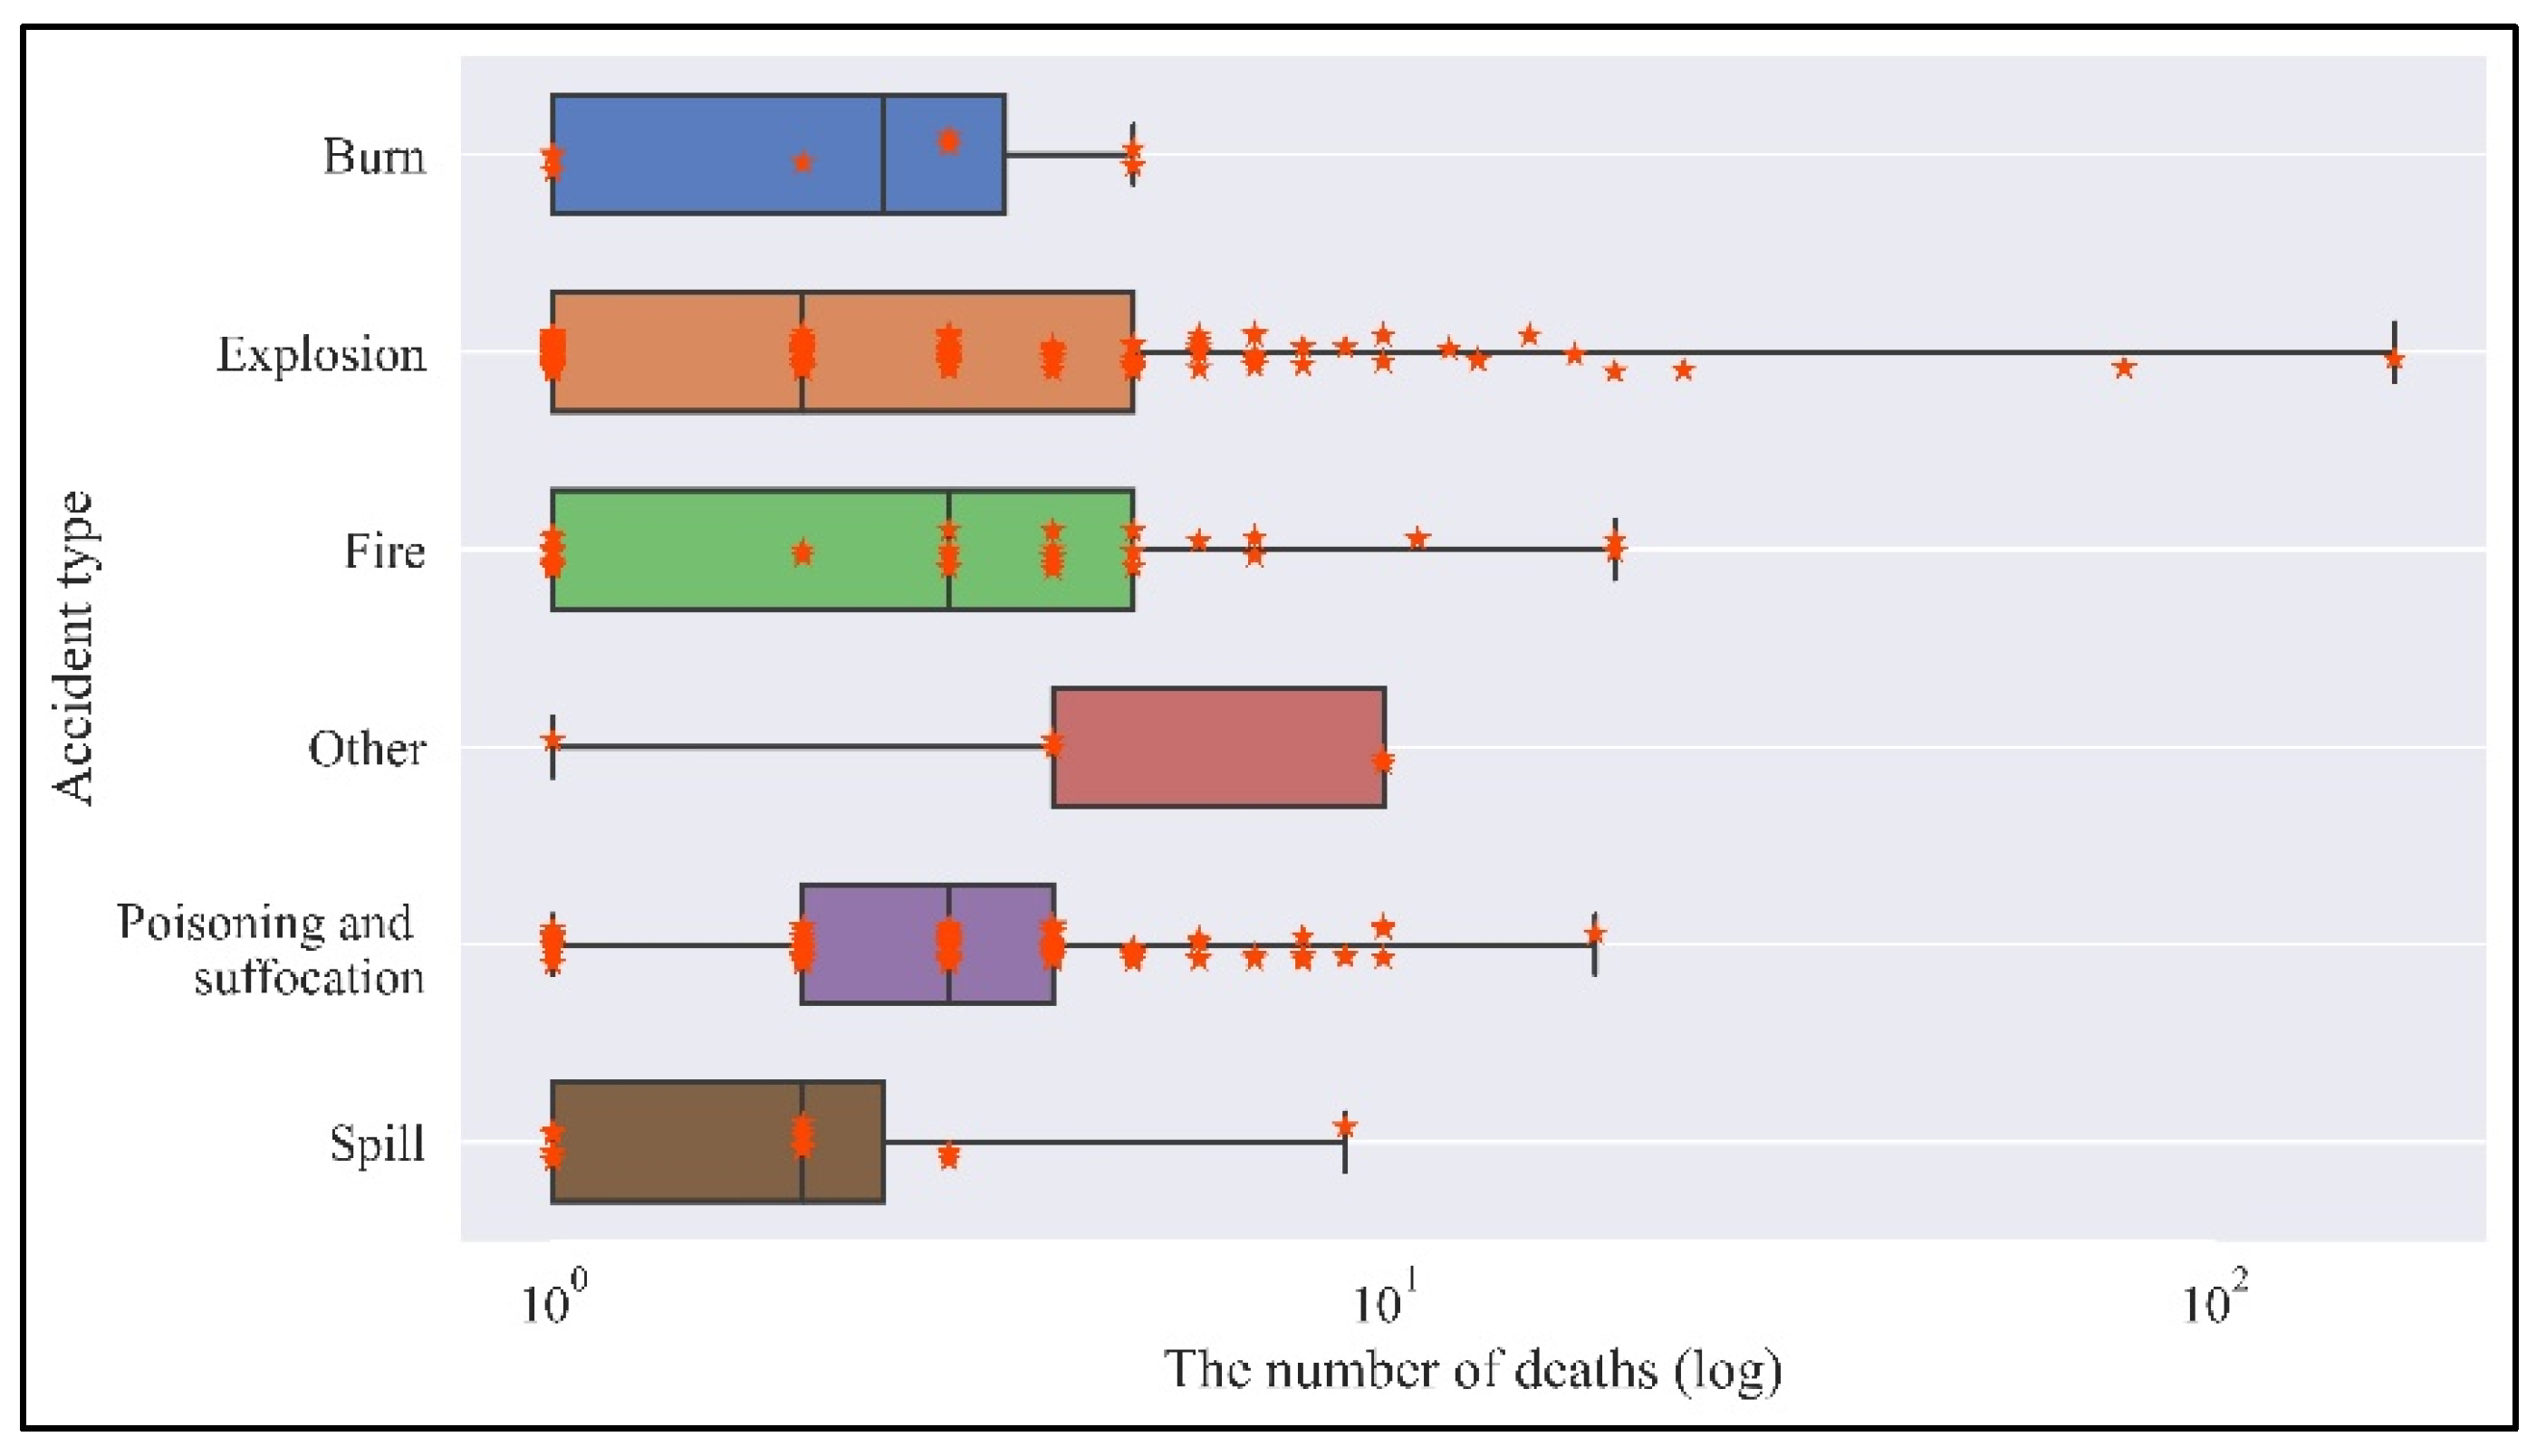
Figure 8 showed the characteristics of the number of deaths from different accident types. Each point represents a hazardous chemical death event, its ordinate corresponds to the type of accident, and the abscissa corresponds to the number of deaths. The explosion has the largest number of deaths of more than ten people, about ten; both the fire accident type and the poisoning suffocation accident type have more than ten deaths. The death toll due to burns and burns incidents was less than ten people. From the analysis of the maximum number of deaths, the maximum number of deaths from the explosion was about 165, the number of deaths from the fire was about 19, and the maximum number of deaths from poisoning and asphyxiation was about 18. From the numerical analysis of the median number of fatalities, other types of fatalities account for the largest number of people. The main reason is that the number of accidents is small, random, and variable; the type of fire accidents and the median number of deaths from poisoning and suffocation are the second.
3.4. The Types of Hazardous Chemicals
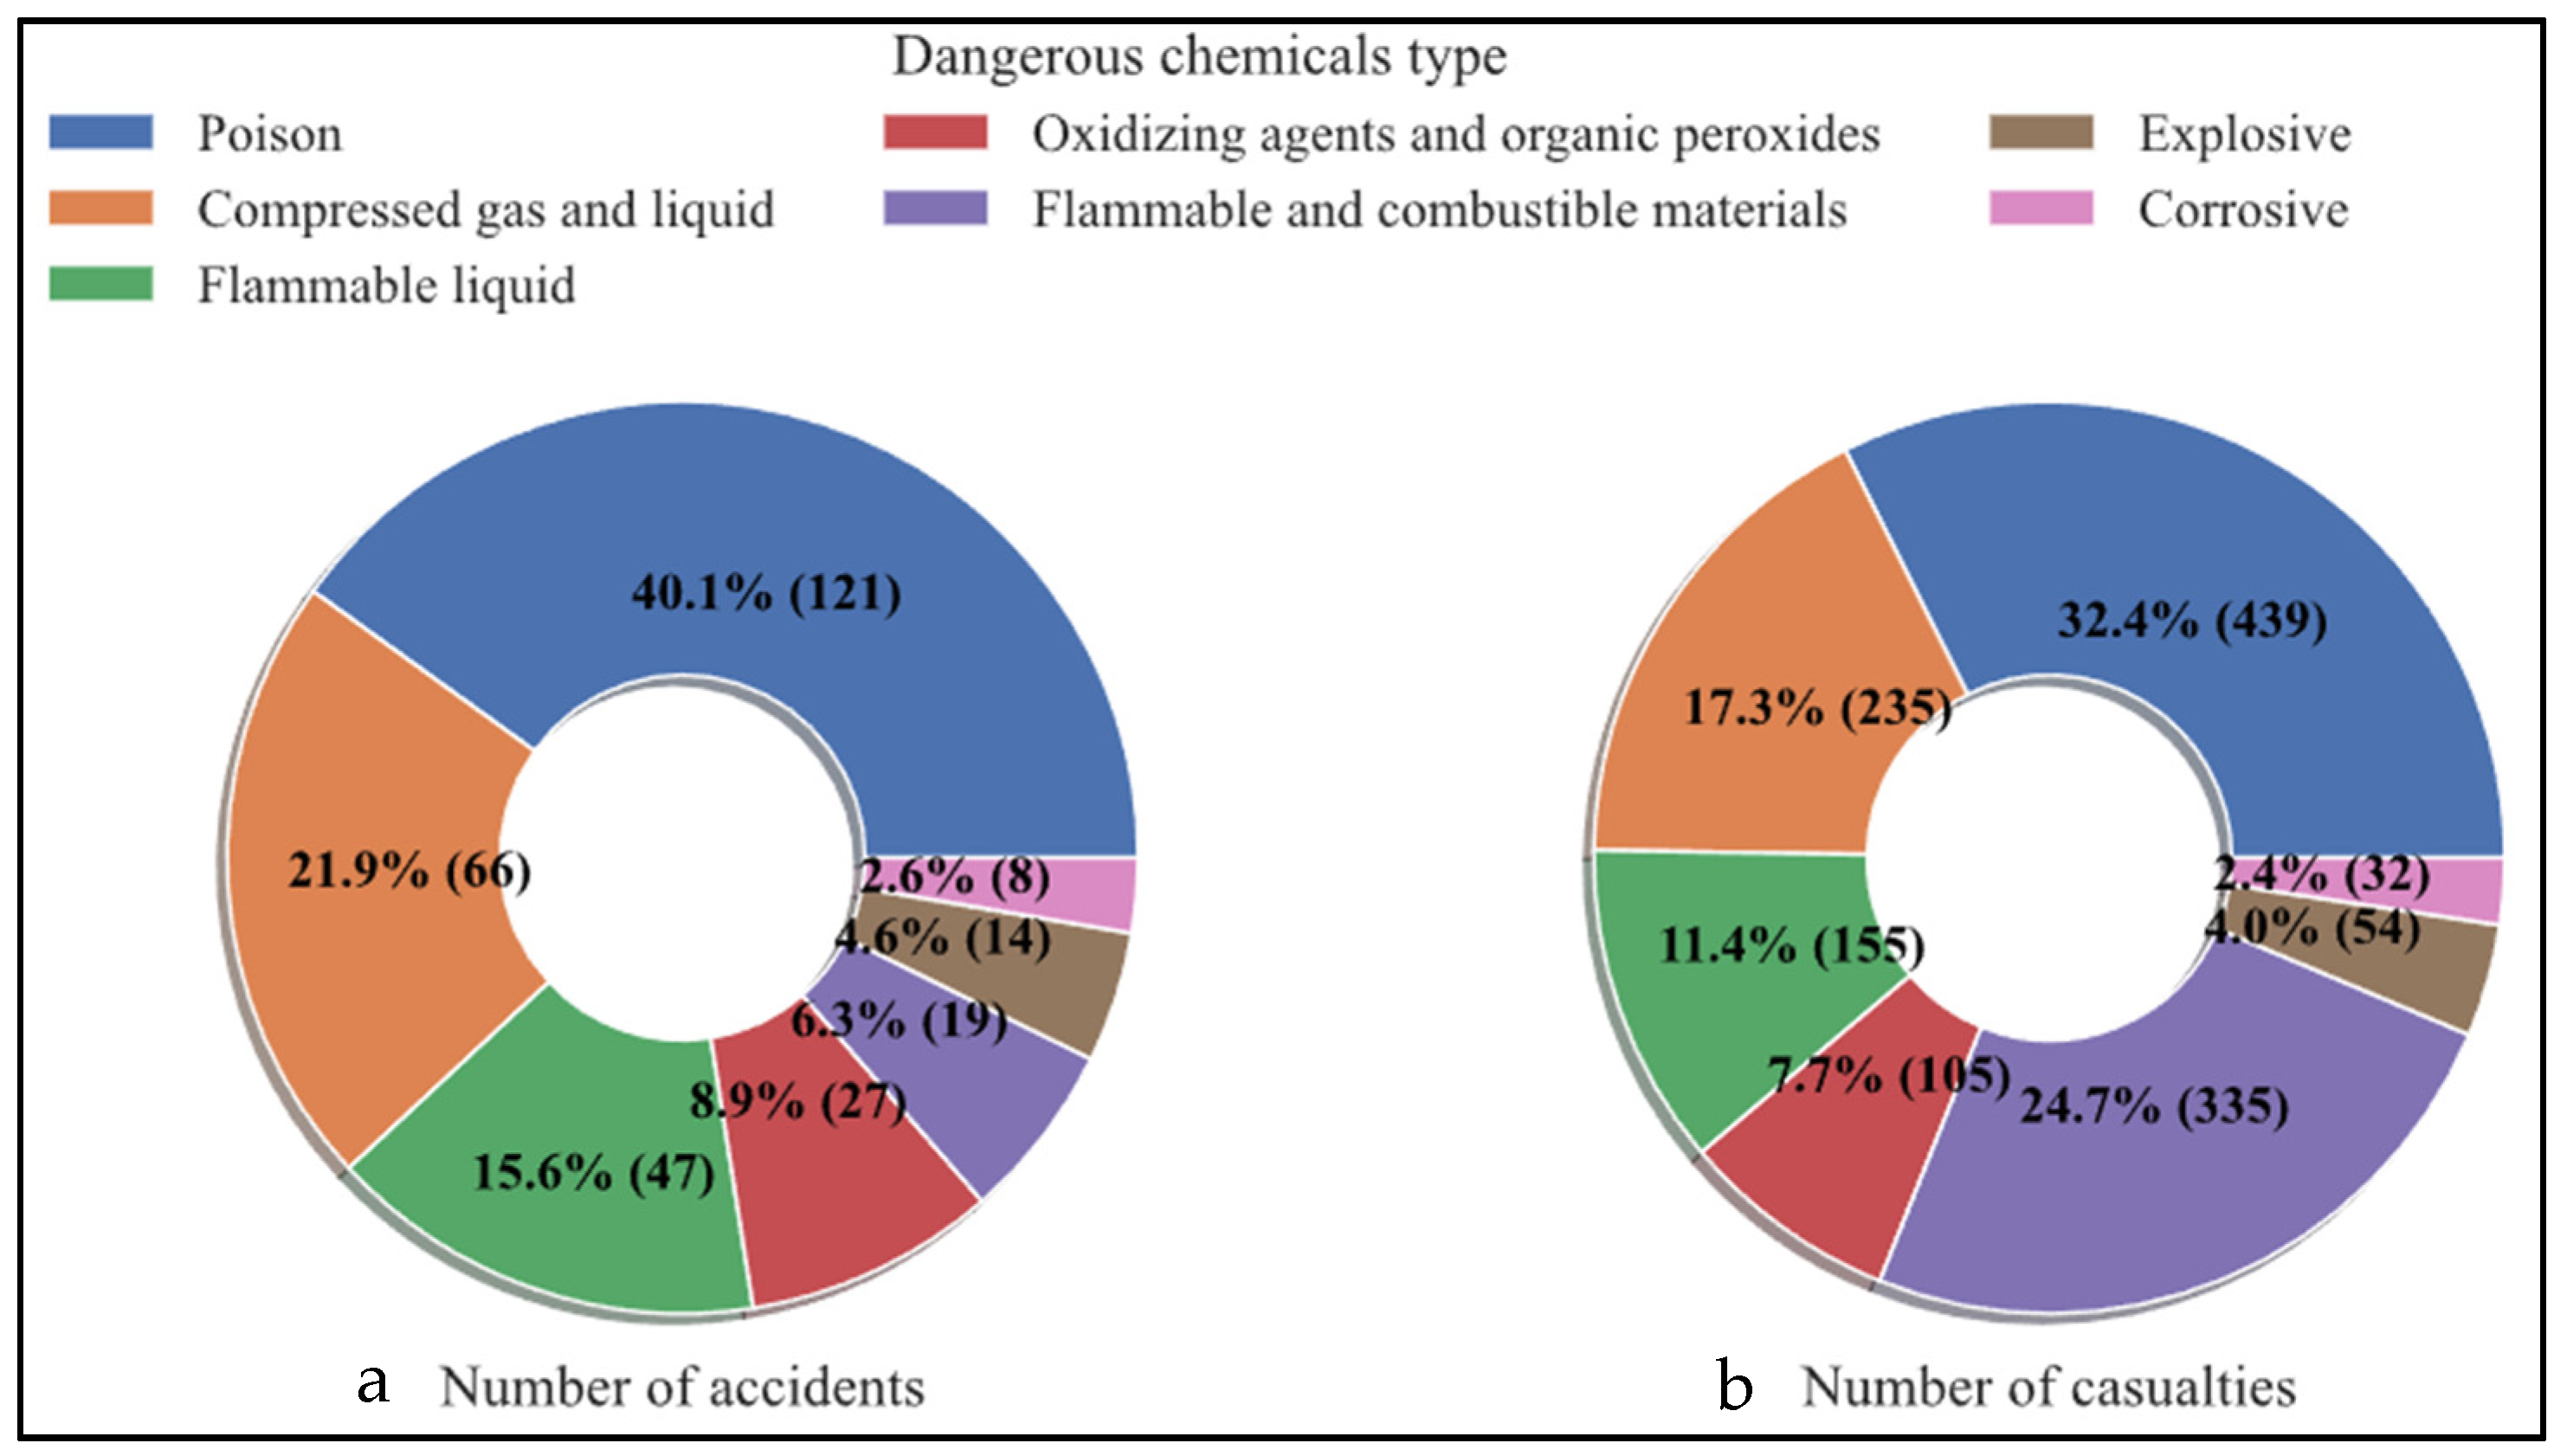
According to the national standard “Dangerous Goods Packaging Marks” (GB190-2009), hazardous chemicals can be divided into eight categories, including (a) explosives; (b) compressed gases and liquefied gases; (c) flammable liquids; (d) flammable solids, spontaneous combustion, and wet combustibles; (e) oxidizers and organic peroxides; (f) drugs; (g) radioactive substances; (h) corrosives, eight hazardous chemicals. Combining the casualties of hazardous chemicals from 2015 to 2021, the classification is shown in
Figure 9. Regarding the number of casualties, it can be seen that the number of casualties caused by drugs is about 121 at most, accounting for 40.1%; the number of deaths caused by corrosives is at least about eight, accounting for 2.6%, and the casualties caused by radioactive materials did not occur. According to the analysis of the death toll statistics chart, the number of deaths caused by toxic substances is the largest, causing about 439 deaths, and the death toll accounts for 32.4%. It should be noted that although the number of casualties caused by flammable solids, spontaneously combustible materials, and flammable materials when wet is small, the number of deaths reached 335, accounting for 24.7% of the total deaths. Therefore, chemical companies need to pay attention to flammables, as well as store and transport solid and spontaneously combustible materials well to avoid large-scale casualties.
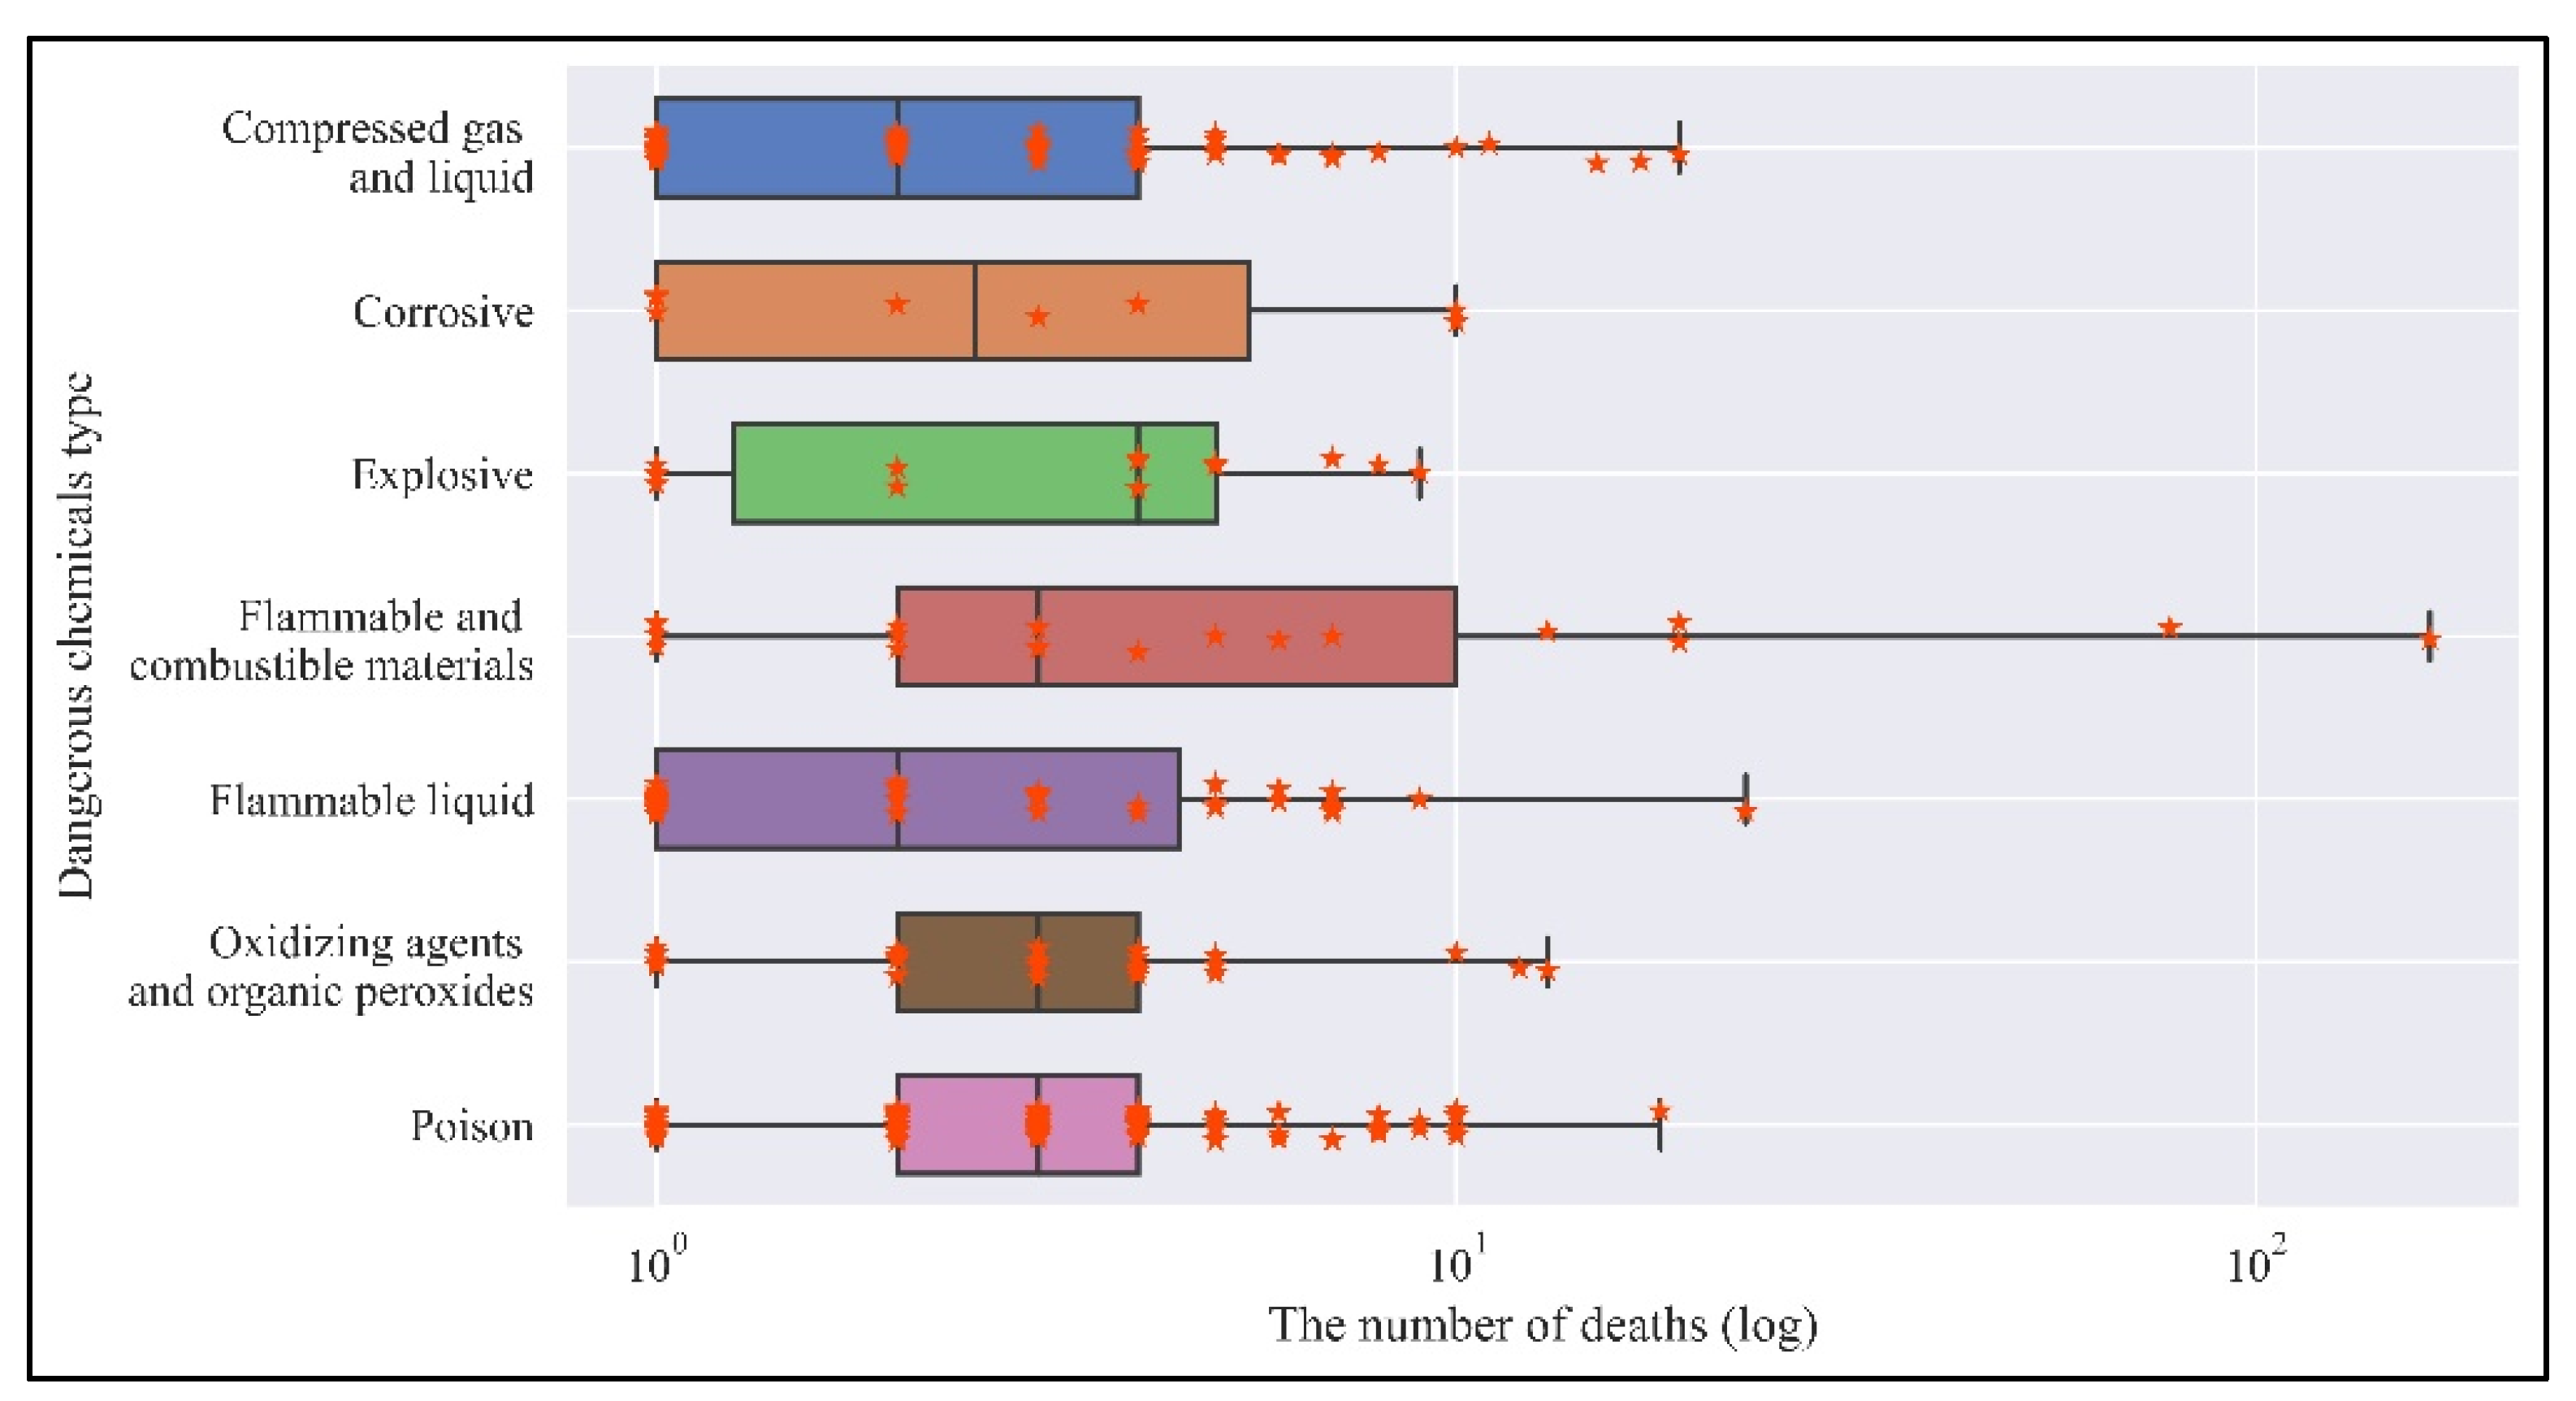
Comparing the box chart of the number of deaths caused by the types of hazardous chemicals (As shown in
Figure 10), it will be found that most of the case distributions in this chart are similar to the characteristic maps of the number of deaths caused by different accident types. Each point represents a hazardous chemical death event, its ordinate corresponds to the type of accident, and the abscissa corresponds to the number of deaths. For example, it corresponds to an explosion event, which mainly corresponds to flammable solids, spontaneously combustible items, and flammable items when wet. This can also explain the low event rate and high fatality rate in the above figure, which is related to the characteristics of the dangerous chemical. There is a great correlation between drugs and poisoning incidents. However, it should be noted that the cause of casualties caused by some toxic substances is not only caused by poisoning, but also related to the nature of the poison. It can be seen from the figure that although drugs cannot cause numerous deaths in a single incident, the probability of accidents is still relatively large. Therefore, the prevention should be strengthened in the production process of the schedule.
3.5. Production Processes
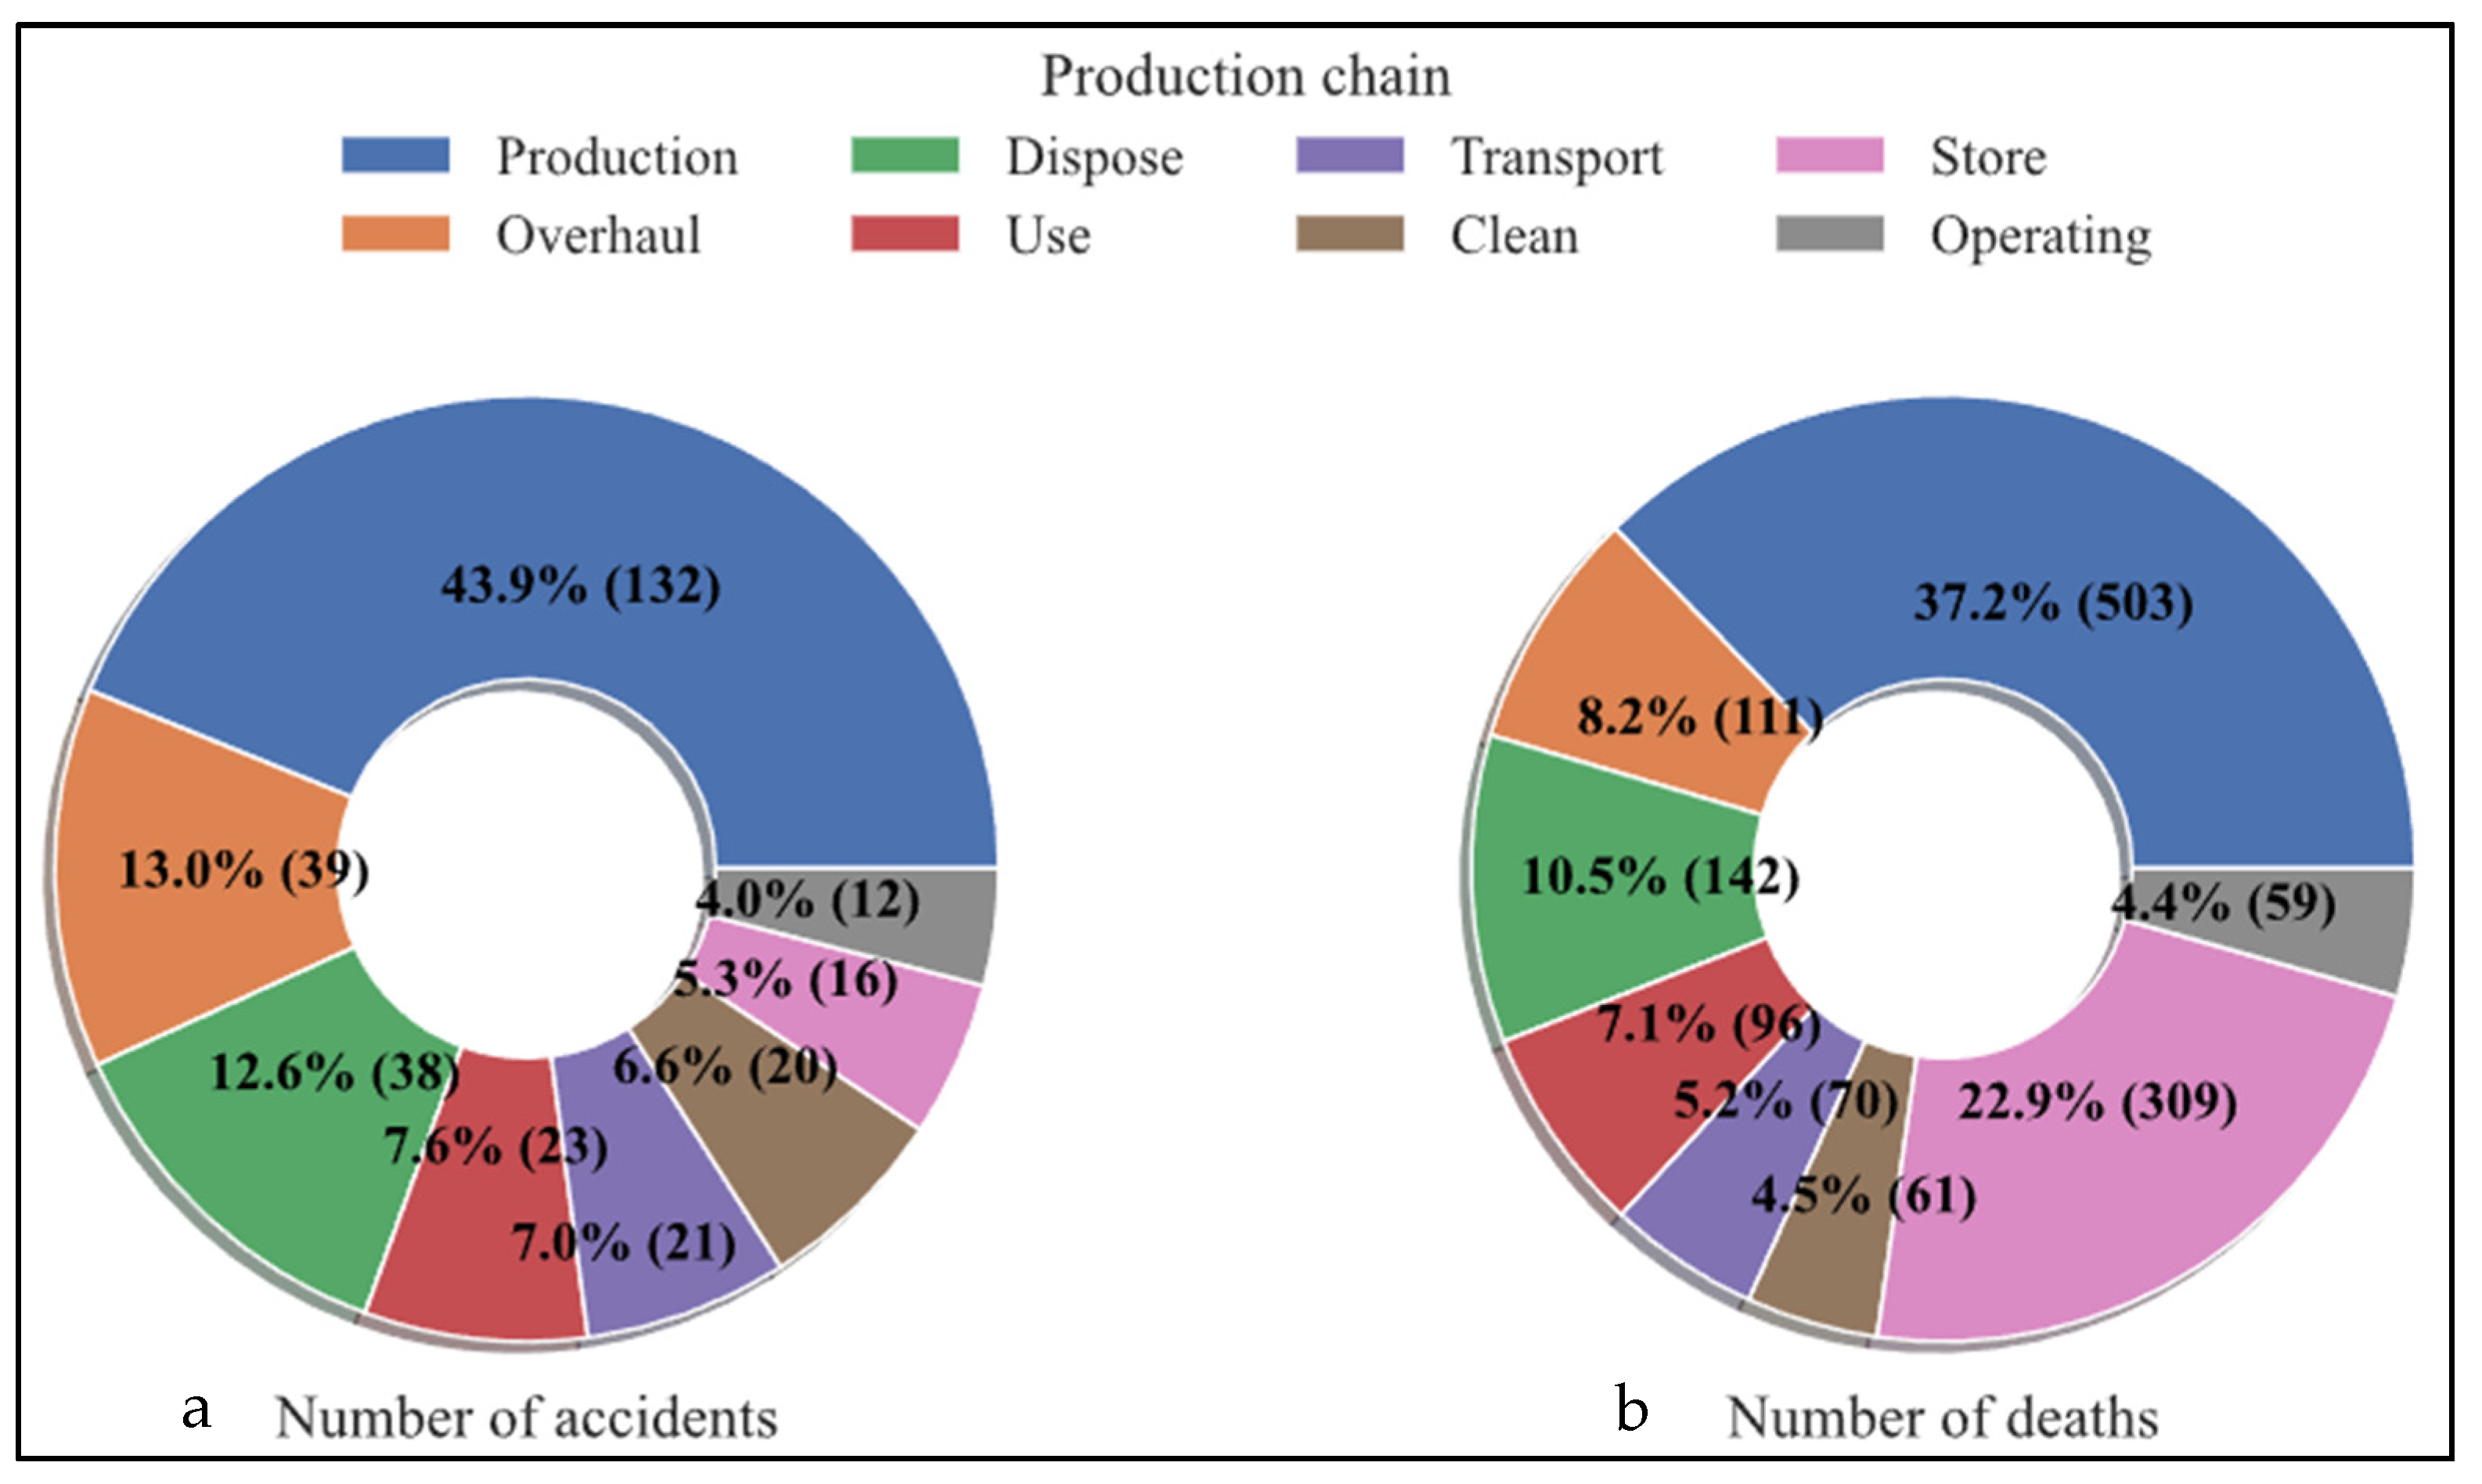
The 2015–2021 hazardous chemical accidents in our country are statistically analyzed according to the seven occurrences of production, storage, use, operation, transportation, treatment, and cleanup. The number of casualties and deaths are shown in
Figure 11. It can be seen from the figure that the number of accidents and deaths caused by the production link is the largest, the number of fatal accidents in the production link is about 132, accounting for 43.9%, and the death toll is 503, accounting for 37.2%. The main reason is that the production process and equipment operation of hazardous chemicals in the production link are relatively complicated, and the physical and chemical characteristics of various raw materials, semi-finished products, and byproducts are relatively special. In addition, the operating conditions and procedures of equipment, reactors, distillation towers, and other devices in the production link are relatively cumbersome, so the possibility of death in this link is extremely high. It should be noted that among the casualties, the proportion of casualties caused by the storage link is not too high (16 casualties, accounting for about 5.3%), but the number of deaths caused by about 309 people, accounting for 22.9%.
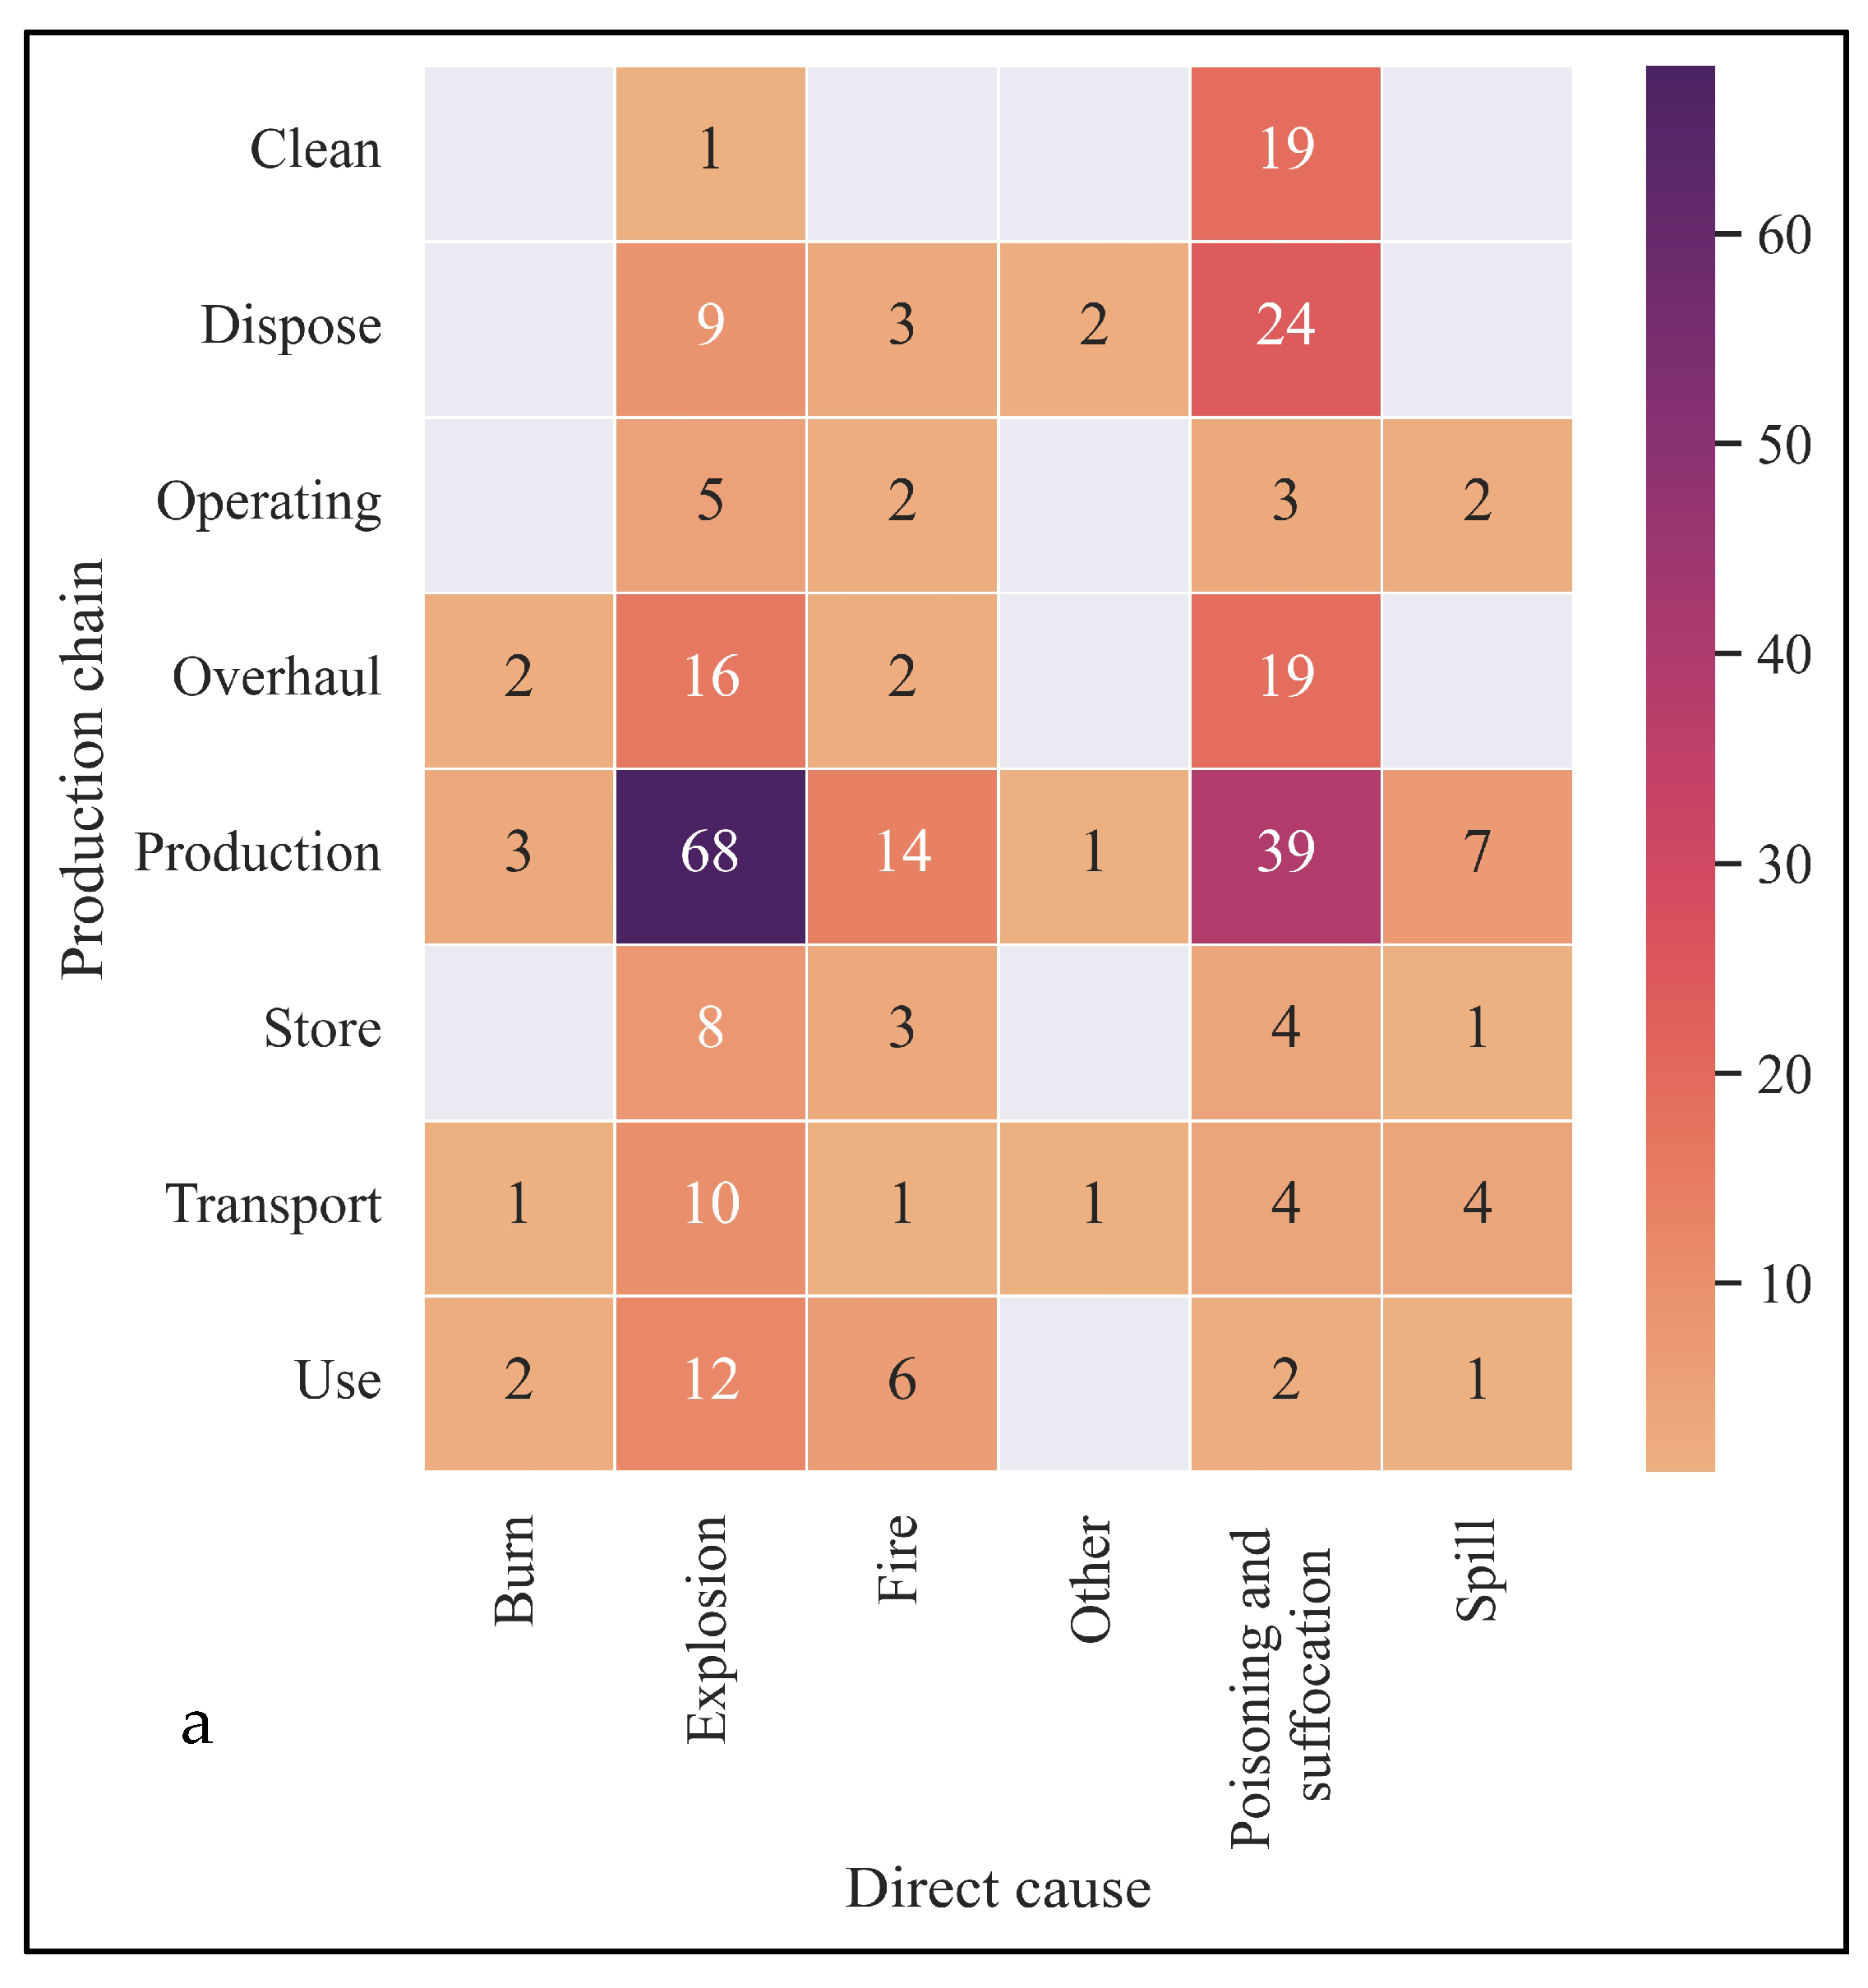
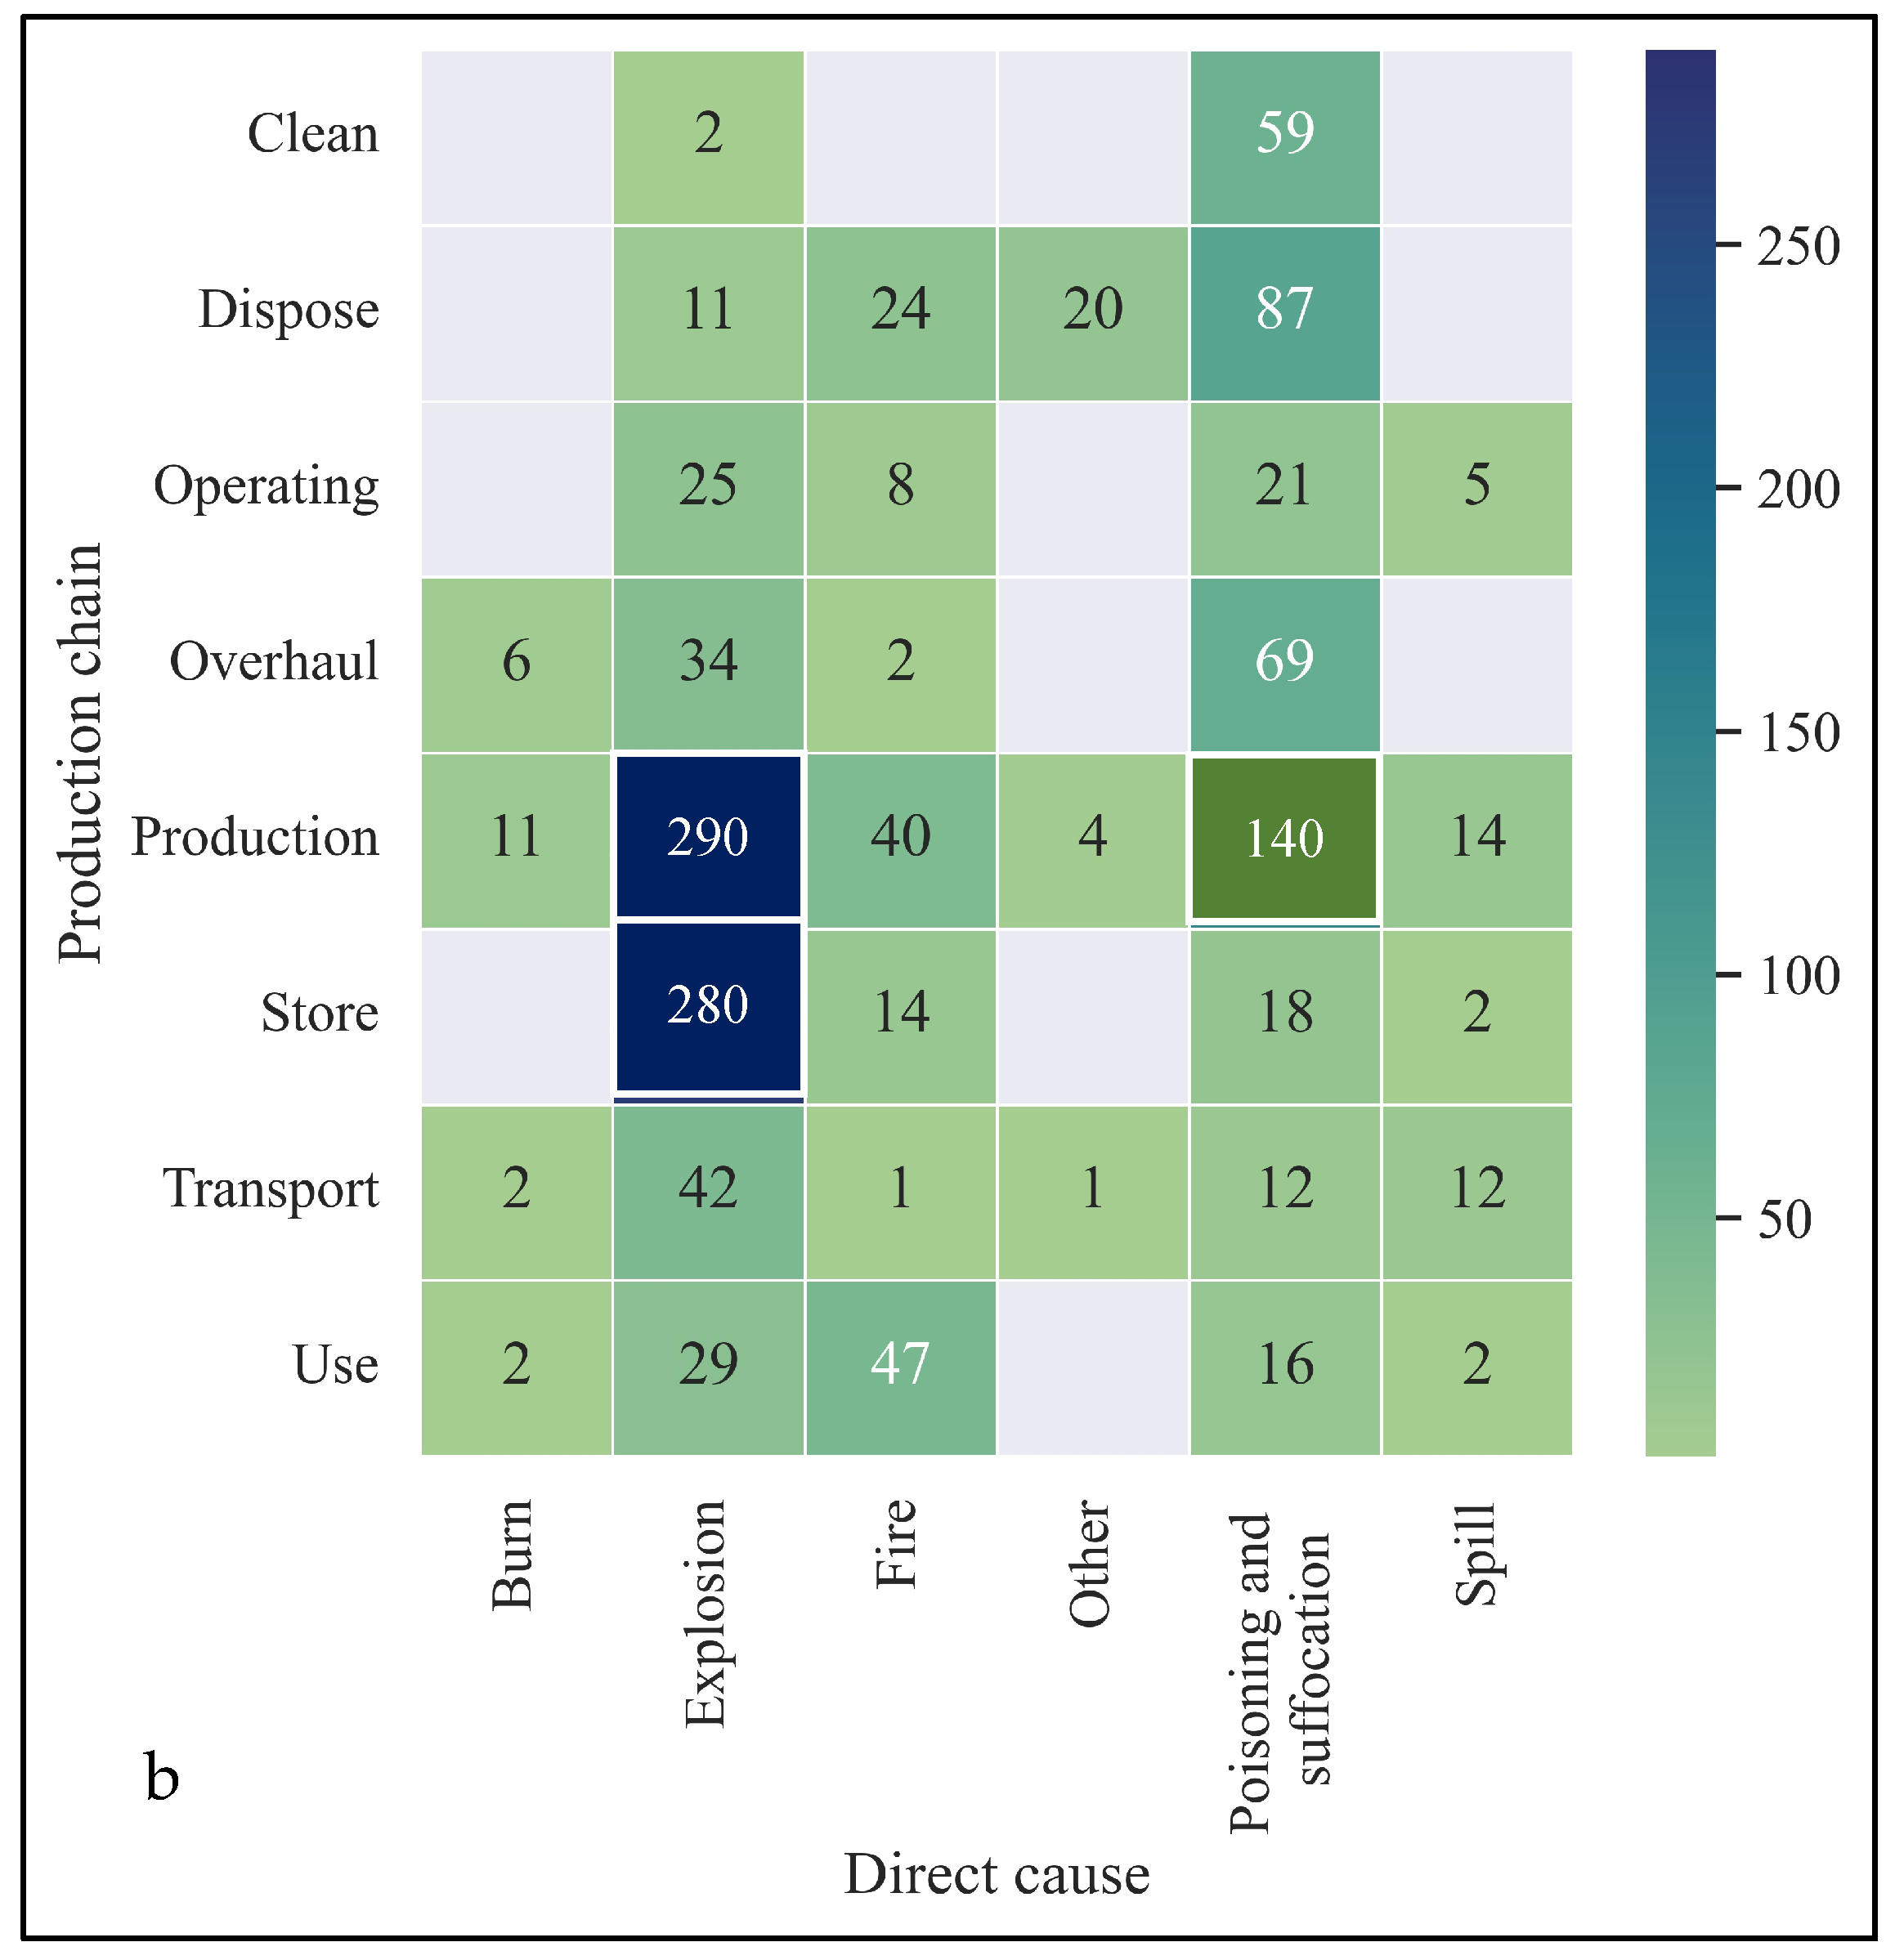
From the analysis of the relationship between the accidents and the types of accidents (as shown in
Figure 12), it can be seen that the accident type with the most accidents in the production process is explosions, about 68 cases, accounting for 23.05% of the total casualties; the death toll is about 290, accounting for 21.87% of the total death toll. We will find that the most fatal event in the accident is the explosion in the cargo storage link, which caused about 280 people, accounting for 21.13% of the total fatalities. However, we need to be alert that only eight such incidents occurred. On average, each incident caused about 35 deaths. During the handling of hazardous chemicals and equipment, there were 20 casualties and 19 incidents were poisoning suffocation incidents. Among the maintenance incidents, 19 incidents were caused by poisoning suffocation incidents, and 69 people died. Hazardous chemicals can also cause casualties during transportation, and even multiple types of casualties may occur.
3.6. Accident Causes
According to the accident cause theory, this study attributed the direct cause of hazardous chemical accidents to human unsafe behavior [
30]. According to the national standard GB6441-1986 “Statistics of Accidents of Casualties of Enterprise Employees”, unsafe behaviors of people are classified into 13 categories, which are (a) operation error, ignorance of safety, and ignorance of warning (OII); (b) caused safety device failure (CSDF); (c) use unsafe equipment (UUE); (d) use hands instead of tools to operate; (e) improper storage of objects (ISO); (f) venture into dangerous places (VDP); (g) climb and sit in unsafe positions (CSUP); (h) work under a lifting object and stay; (i) illegal operations when the machine is running (MRLO); (j) distracting behavior (DB); (k) ignore the use of personal protective equipment and appliances in operations or occasions ( NUPE); (l) unsafe attire; (m) mishandling of flammable and explosive dangerous goods (MFEDG). According to the unsafe behavior of the above-mentioned people, the number of accidents and the death toll are shown in
Figure 13.
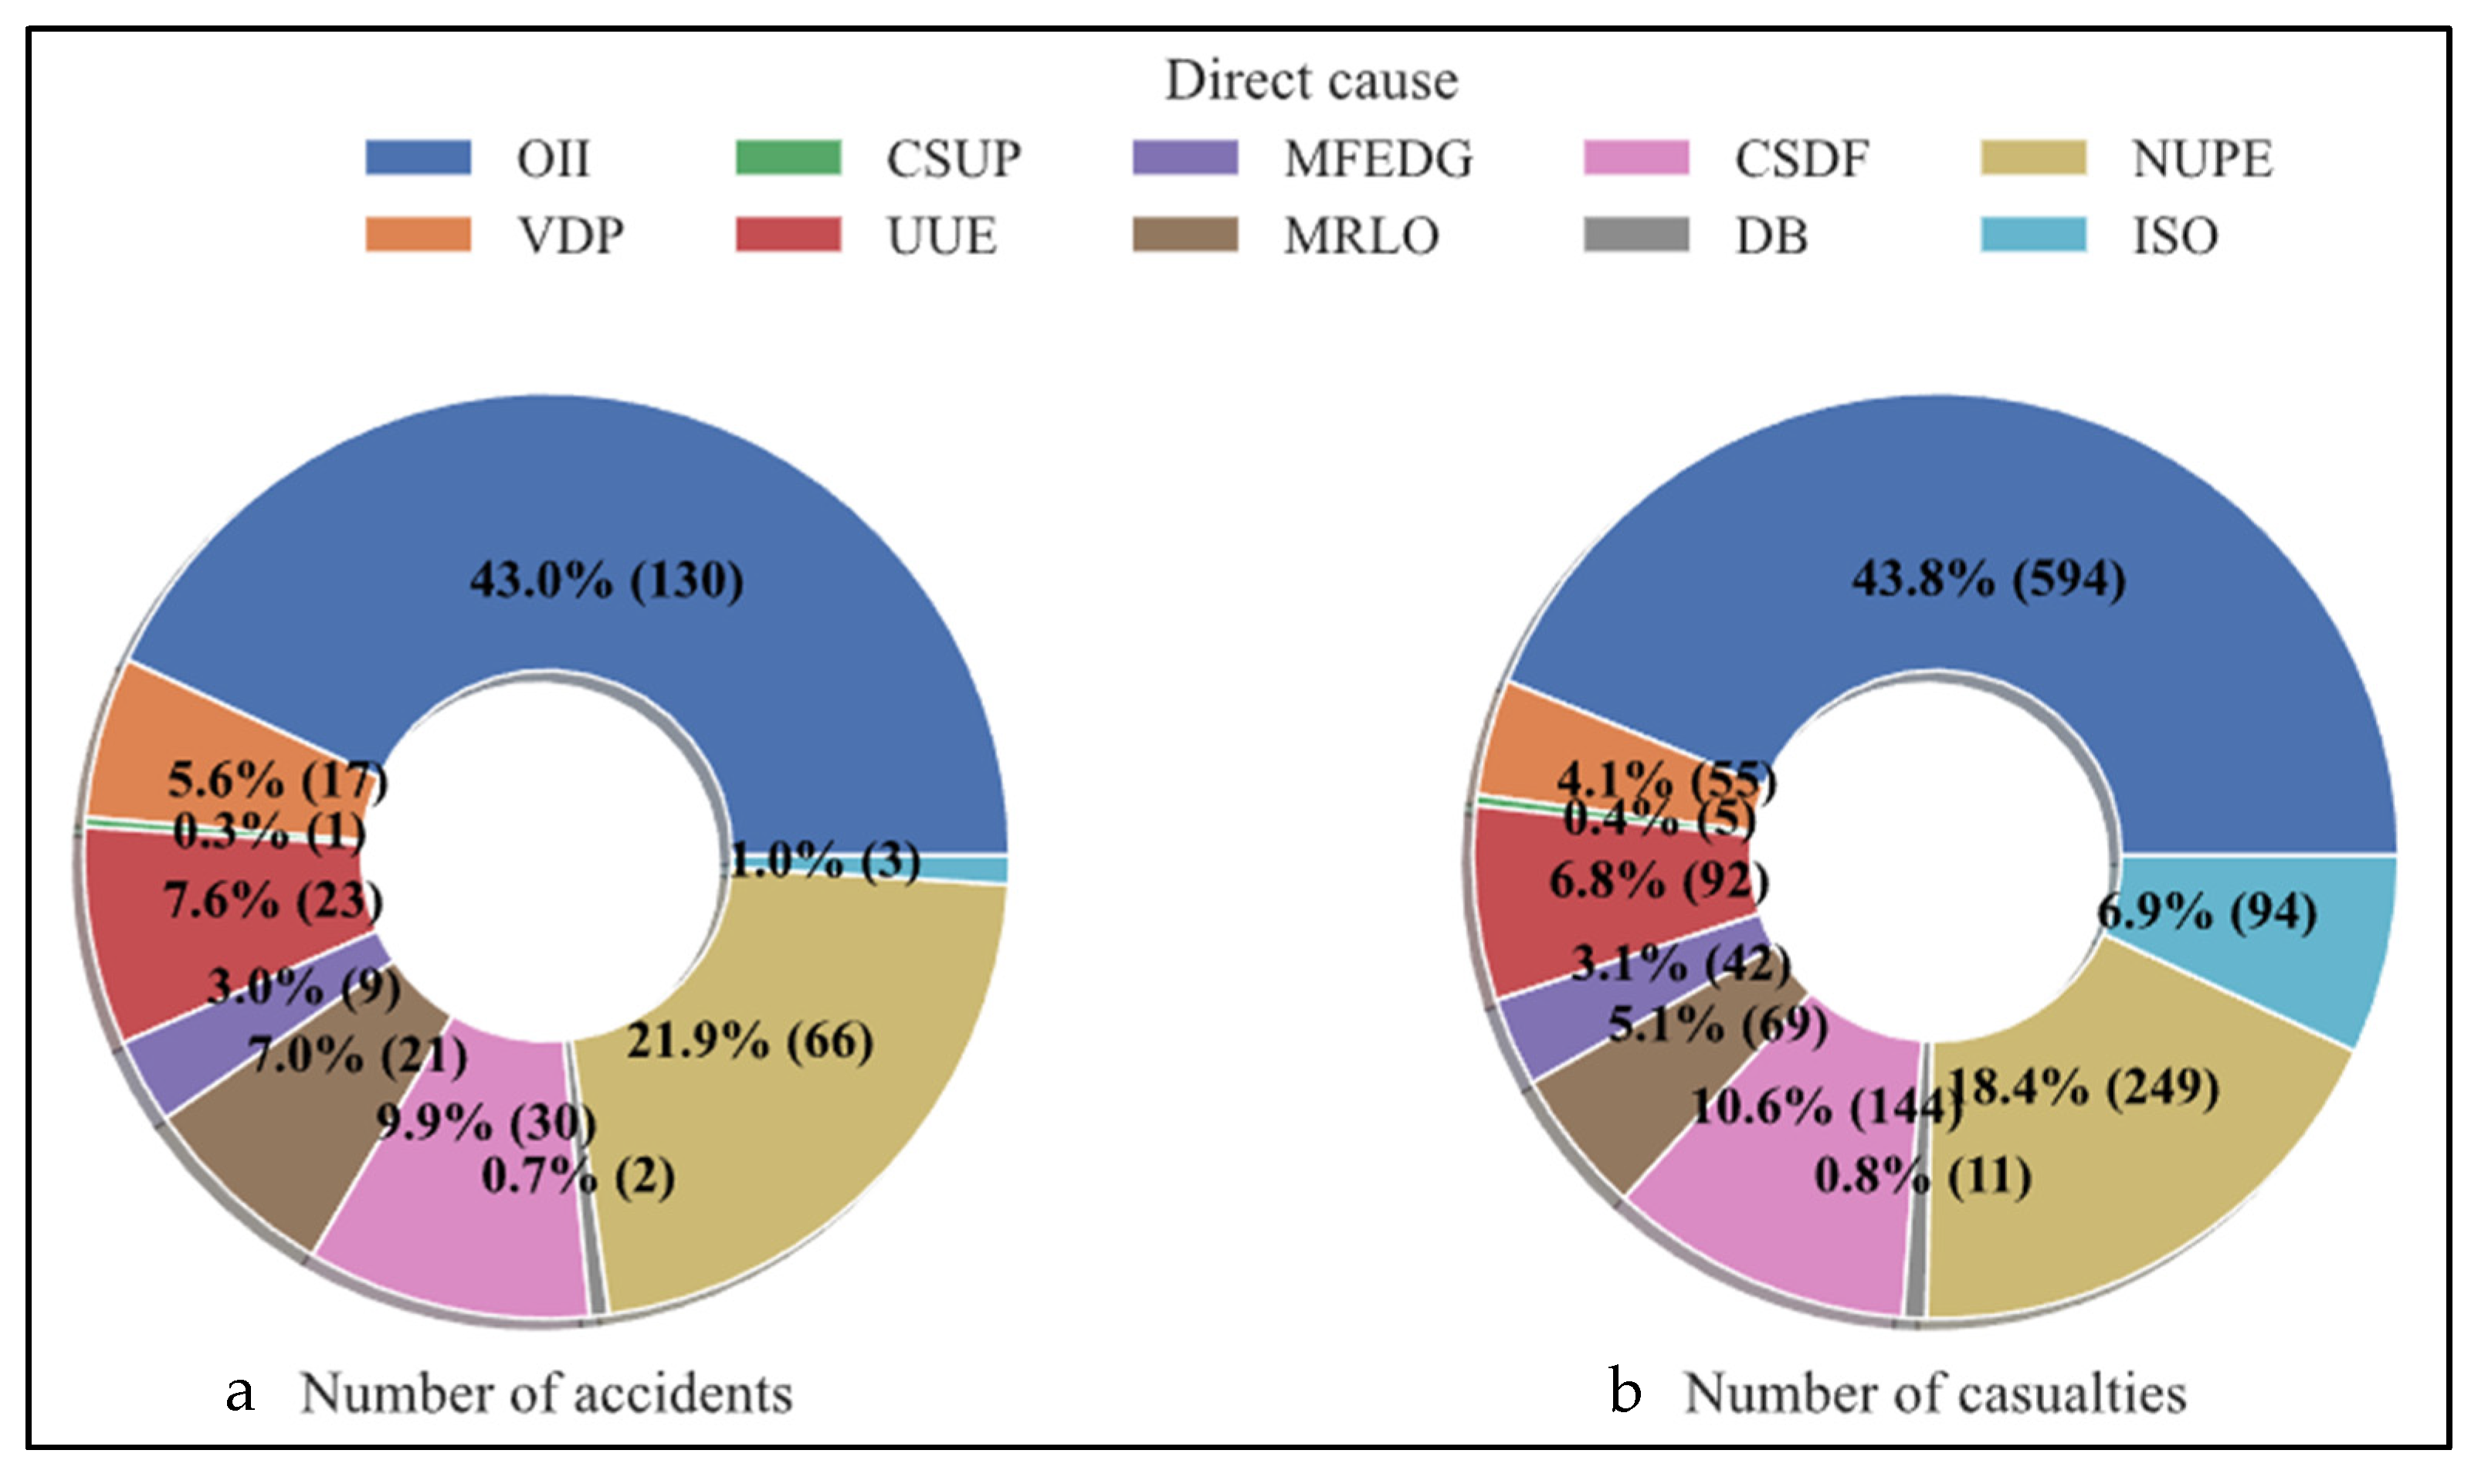
Judging from the direct causes reflected in
Figure 13, the number of casualties and deaths caused by operating errors, ignoring safety, and ignoring warnings is the largest. The number of casualties caused by 130 accidents accounted for about 43.0%, and the number of deaths was 594. It accounts for about 44.8%. Due to the relatively poor safety awareness of workers in the field of small- and medium-sized chemical enterprises in our country, problems such as misoperation may occur in the operation of the equipment and cause accidents. In addition, many people lacked precautions in operations or occasions where protective equipment and appliances should be worn in unsafe behavior. This also caused 66 casualties and 249 deaths.
As shown in
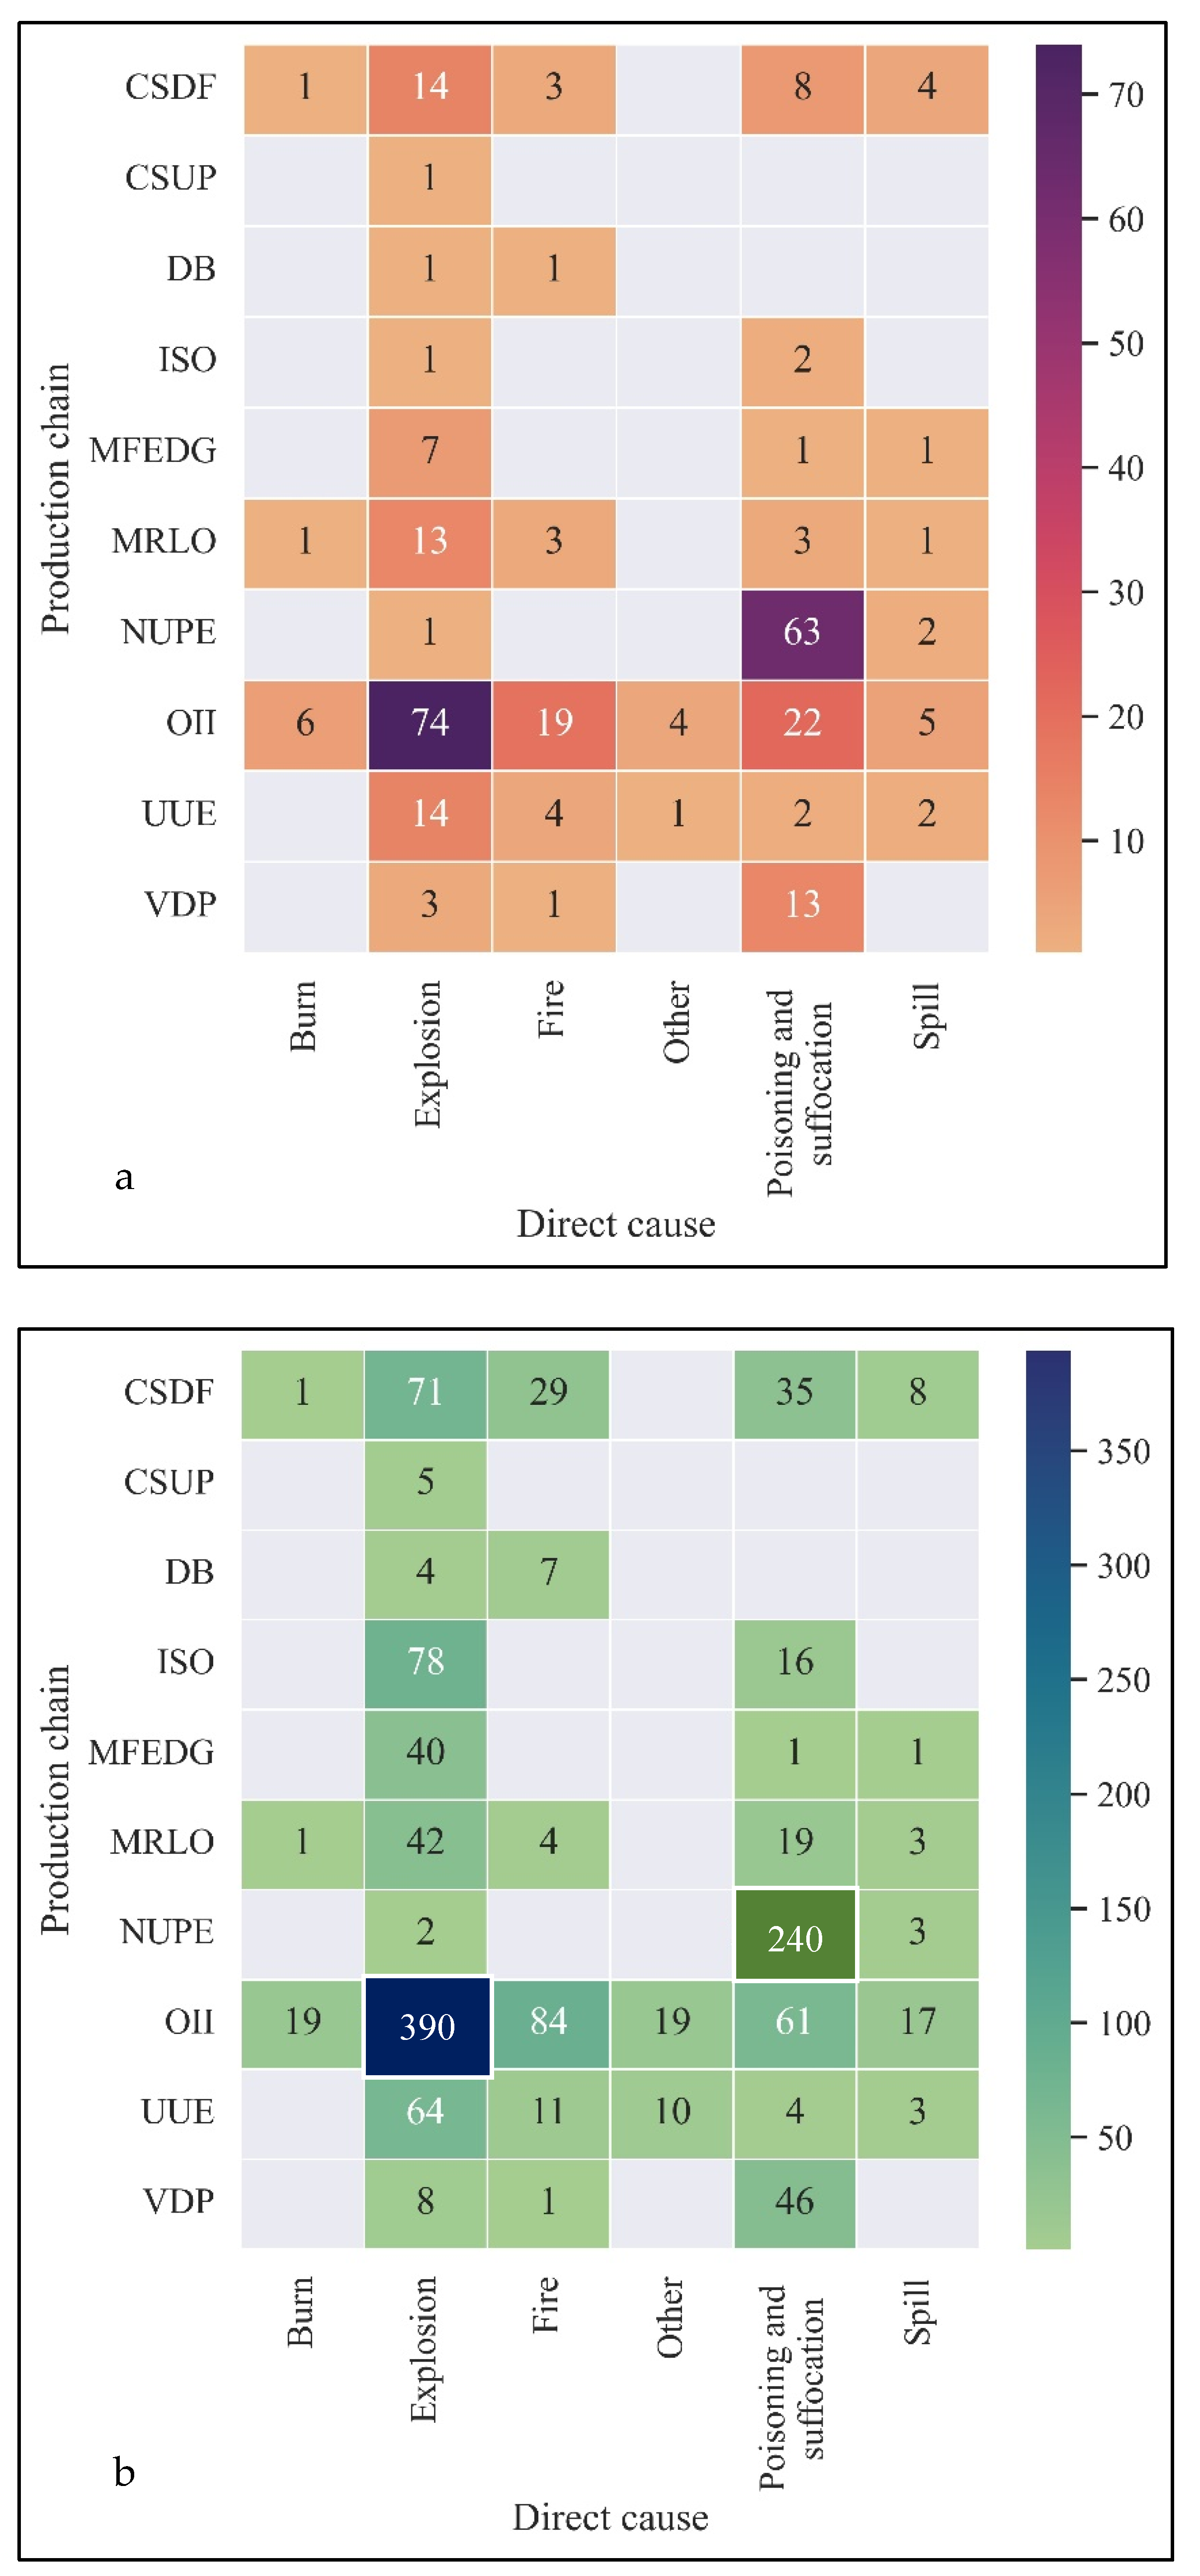
Figure 14, From the analysis of the causes and types of accidents, it can be seen that there were 74 hazardous chemical explosions caused by workers’ operating errors, ignoring safety, and ignoring warnings (
Figure 14a), and nearly 390 people died (
Figure 14b). There were 22 poisoning and suffocation incidents (
Figure 14a) and 61 deaths (
Figure 14b); 19 fire incidents (
Figure 14a) and 84 deaths (
Figure 14b) were caused. It can be seen that fire and explosion incidents caused obvious mass deaths and injuries due to their disaster characteristics. Moreover, among the incidents caused by individuals not wearing protective equipment, 63 (about 95.5%) caused poisoning and suffocation incidents (
Figure 14a) and caused about 240 deaths (
Figure 14b). In addition, it can be seen from the
Figure 14a that the listed unsafe behaviors that lead to accidents are likely to lead to explosions. Therefore, chemical companies should strengthen explosion prevention measures, especially to prevent open flames and fires during production, and restrain various ignition sources such as high-temperature appearance, impact, friction, to prevent accidents.
4. Discussion
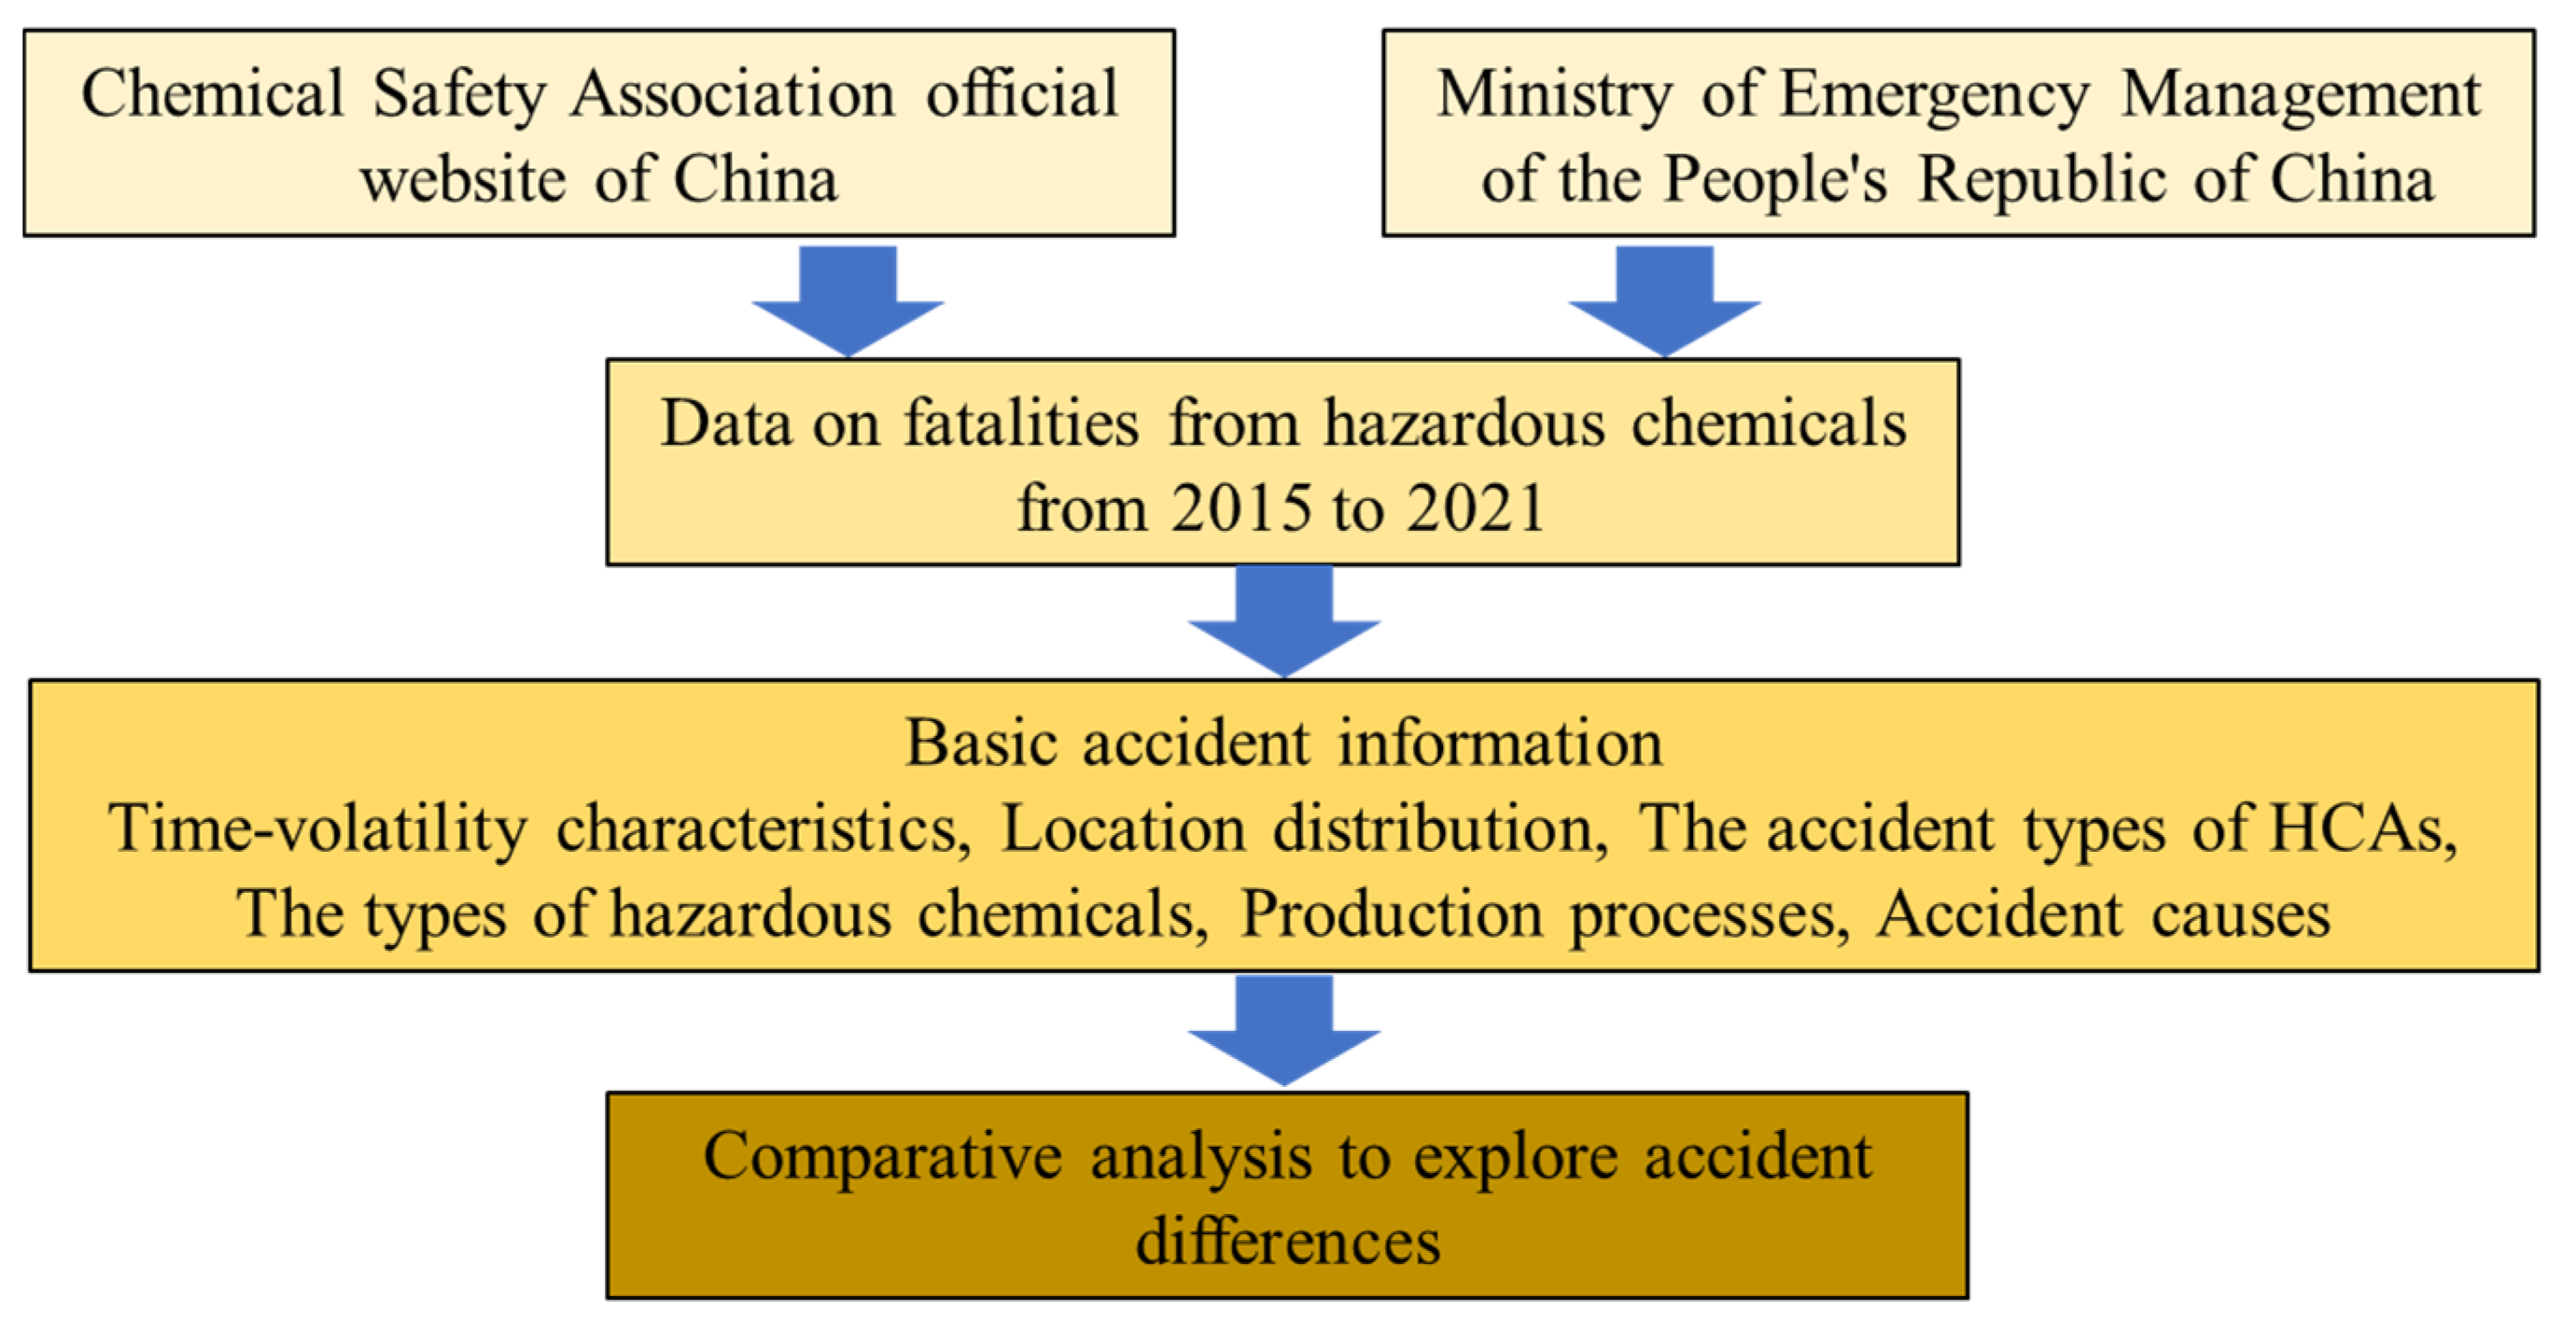
This paper refers to the official website of the China Chemical Safety Association and the Ministry of Emergency Management of the People’s Republic of China on the casualties of hazardous chemicals for selection and analysis. The data sources are reliable and official. Due to space reasons, all events are not listed. The accident characteristics selected in this article are relatively straightforward, and the relevance of accident characteristics is discussed appropriately in the discussion section. It is true that external factors such as industry, culture, and governance background may also have an impact on the occurrence of accidents. However, there is no actual data support for the characteristics of these external accidents. Therefore, it is discussed in the process of statistical analysis, but the influence of these factors on different chemical production enterprises does exist.
There is a clear time difference in hazardous chemical fatalities of China. As the year progresses, the overall number of accidents (the number of fatalities and the number of fatalities) shows a downward trend in volatility. From the perspective of monthly characteristics, seasonal factors also affect the occurrence of accidents: the number of accidents involving hazardous chemicals is the largest in May each year; flammable, explosive, and poisoning incidents occur in summer; accidents in winter (December to February). The number of deaths is generally small, but it is necessary to strengthen the antifreeze and overhaul of production equipment, as well as to strengthen the supervision and prevention work in months with a higher frequency of accidents. From the perspective of “week” characteristics, Wednesday’s hazardous chemical accidents and deaths are the highest. On the one hand, the workers’ work activity and mental state are in a half-exhausted period and their psychological state is obviously poor because they are in the middle of the working day. It is easy to cause one’s own unsafe behavior and disregard safety issues at work, resulting in a high accident rate and death rate. From the analysis of period characteristics, 9:00–11:00 (inclusive) and 15:00–16:00 (inclusive) in a day are the two time periods with the largest number of events, which are similar to the “week” feature. In the middle of the working hours each day, the working frequency and work intensity of personnel have increased significantly. Judging from the time domain characteristics of accidents, high accidents are relatively concentrated. The organization and production of enterprises and the monitoring of hazard sources should be focused on reducing or eliminating accidents.
The characteristics of hazardous chemical accidents in China also show obvious regional differences. The number of hazardous chemical accidents and deaths in the economically developed coastal provinces is relatively high. The number of hazardous chemical accidents that occurred accounted for 38.3% of the total number of accidents in the country. The total number of deaths was 692 people, accounting for 52.23% of the total number of deaths in the country. With the continuous increase in reform and opening up, China has gradually become a “world-class factory”, as well as the demand and level of productivity have gradually increased, especially for coastal cities with a large degree of openness, storage, production, supply, and demand of dangerous chemicals. There are many types. In addition, due to the geographical location and traffic conditions, accidents in the transportation of hazardous chemicals often occur along the coast. The unbalanced development also makes the occurrence of hazardous chemical accidents have obvious regional differences. The economically underdeveloped western provinces have fewer chemical production enterprises. Therefore, the number of casualties and deaths is not as great as that of coastal provinces. The governments of coastal provinces and regions should strengthen the supervision of chemical companies in the region, and strengthen periodic inspections to further ensure that the rectification of hidden dangers is in place and closed-loop management.
Regarding the characteristics of the types of accidents, explosion accidents, poisoning, suffocation, and fires caused the largest number of accidents and the number of deaths. Explosions are the primary factors causing frequent accidents in hazardous chemical companies, which are related to the physical and chemical characteristics of hazardous chemicals. In addition, affected by the external temperature and storage conditions, explosive mass deaths and injuries occur frequently and have serious consequences. Therefore, chemical companies should focus on strengthening the safety supervision of explosions, poisoning, suffocation, and fire incidents, especially the key links and corresponding chemicals that can easily cause these types of accidents. Moreover, chemical companies should continue to improve their intrinsic safety management level, improve process monitoring, and strengthen safety diagnosis.
Drugs, compressed gas and liquefied gas, flammable solids and spontaneous combustion materials, and flammable materials when wet are the types of hazardous chemicals that have caused the most casualties of hazardous chemicals. Especially for flammable solids, spontaneous combustibles, and flammables when wet, the number of casualties is not the largest. However, the death toll accounted for 24.7% of the total death toll, and the average fatality rate was the highest. Therefore, strict control should be taken during the disposal and storage of this type of hazardous chemicals to prevent accidents of this type of hazardous chemicals.
From the analysis of the characteristics of the accident occurrence link, the number of accidents and deaths caused by the production link is the largest, followed by the number of accidents caused by overhaul events. Although the number of accidents caused by the storage link is only 5.6%, the death toll caused by it accounts for about 27.1%. This is because the storage of materials is often taken lightly in the production process. The possible reactions of materials during chemical storage are often ignored or neglected.
Human unsafe behaviors are the main cause of accidents. This study refers to national standards and summarizes human unsafe behaviors into 13 categories. Through the statistical analysis, it can be known that personnel operating errors, ignoring safety, and ignoring warnings are the main causes of accidents involving hazardous chemicals. Therefore, enterprises should continue to strengthen the construction of safety culture and pay attention to strengthening the safety education of personnel operations. Due to the nature of hazardous chemicals, scenario mode and intelligent safety methods can be used for teaching when conducting safety education. In addition, safety practitioners should also strengthen professional skills training to cultivate their own safety awareness. Since human unsafe behavior is the direct cause of the accident, we have analyzed the characteristics of the accident from this aspect. Of course, it needs to be clear that different industries, cultures, and safety management methods are the indirect causes of accidents. However, it is difficult to support this because there are no relevant enterprise and national documents in these areas. At the same time, in the accident statistics, these qualitative indicators do not give more information, so this paper selects human reasons that are obvious from the accident.


