Article

Modeling and Optimization of Biochar Injection into Blast Furnace to Mitigate the Fossil CO2 Emission

1
Swerim AB, Aronstorpsvägen 1, 97437 Luleå, Sweden
2
Central Metallurgical Research and Development Institute (CMRDI), Cairo 12422, Egypt
3
Envigas AB, Industrivägen 53, 93252 Bureå, Sweden
*
Author to whom correspondence should be addressed.
This article is dedicated to the spirit of the co-author Mr. Kurt Sjöblom, who passed away while preparing this article.
Sustainability 2022, 14(4), 2393; https://doi.org/10.3390/su14042393
Submission received: 2 January 2022 / Revised: 11 February 2022 / Accepted: 17 February 2022 / Published: 19 February 2022

Abstract

:
Most modern blast furnaces (BFs) operate with Pulverized Coal Injection (PCI), but renewable and carbon neutral biochar could be applied to reduce the fossil CO2 emission in the short term. In the present study, heat and mass balance-based model (MASMOD) is applied to evaluate the potential of biochar in partial and full replacement of injected pulverized coal (PC) in the ironmaking BF. The impact of biochar injection on the raceway adiabatic flame temperature (RAFT) and top gas temperature (TGT) is evaluated. Three grades of biochar, produced from the pyrolysis of sawdust, were evaluated in this study. The total carbon content was 79.2%, 93.4% and 89.2% in biochar 1, 2 and 3, respectively, while it was 81.6% in the reference PC. For each type of biochar, 6 cases were designed at different injection levels from 30 kg/tHM up to 143 kg/tHM, which represent 100% replacement of PC in the applied case, while the top charged coke is fixed in all cases as reference. The oxygen enrichment, RAFT, and TGT are fixed for certain cases, and have been calculated by MASMOD in other cases to identify the optimum level of biochar injection. The MASMOD calculation showed that as the injection rate of biochar 1 and biochar 2 increased, the RAFT increased by ~190 °C, while TGT decreased by ~45 °C at 100% replacement of PC with biochar. By optimizing the moisture content of biochar and the oxygen enrichment in the blast, it is possible to reach 100% replacement of PC without much affecting the RAFT and TGT. Biochar 3 was able to replace 100% of PC without deteriorating the RAFT or TGT.

1. Introduction

Steel is the most used metal and most recycled material, with 1.95 billion metric tons produced in 2021, according to the World Steel Association [1]. Lately, steel production accounts for 8% of total global CO2 emissions [2] and is anticipated to reach 3.0 billion tons in 2050 [3]. On the other hand, there are strict targets set for the forthcoming years and decades to decrease the energy consumption and fossil CO2 emission in European countries. According to the 2050 roadmap, Europe must decrease its greenhouse gas emissions by 80–95% by 2050 compared to the 1990 base level [4]. The reduction of specific energy consumption and gas emissions are among the top priorities in iron and steelmaking due to the commitment of governments to decrease fossil CO2 emissions according to the Paris agreement [5].
Intensive work and several options are being executed nowadays, aiming for decarbonization of steel from which increasing the efficiency of the current production methods, recycling of steel, implementation of carbon capture and storage (CCS) and hydrogen (H2) utilization [6]. Among these options, H2 utilization received more attention for steel decarbonization either by using H2 as auxiliary reducing agent in the blast furnace-basic oxygen furnace (BF-BOF) route or to develop direct reduction technology (DRI-EAF) based on H2 for iron and steel making [7,8]. Currently, the BF-BOF route, based on coal and coke as fuel and reducing agent, is still the dominating technology for steel production and might continue for some decades until H2, as auxiliary reducing agent, is implemented in the BF (H2-BF) and/or H2-DRI technology is developed and reaches implementation on an industrial scale. Therefore, it is noteworthy to mention that the research should focus on developing the traditional BF technology beside developing new H2-based ironmaking technologies to mitigate the fossil CO2 emission, tackle climate change and secure sustainability of this vital sector.
Replacing fossil coal with renewable and neutral carbon biomass is one of the potential measures to significantly decrease the fossil CO2 emission from the ironmaking BF in the short term [9,10]. Biochar injection in the large modern blast furnace provides a flexible option for replacing fossil coal without affecting the top charging burden. In this case, mechanical strength is not a prerequisite, unlike the case of top charged burden. The devolatilization, gasification, and combustion characteristics of biochar have a major influence on the Raceway Adiabatic Flame Temperature (RAFT) in the BF [11]. The replacement rate of coal by biomass materials such as charcoal, torrefied and raw biomass, was theoretically investigated by a static model [12,13]. It was reported that 155 kg/tHM of pulverized coal (PC) could be replaced by 166.7 kg/tHM charcoal. The replacement ratio of high volatile biomass such as torrefied and raw wood pellets is much less. Torrefied biomass can replace 22.8%, while raw wood pellets can replace only 20% of the injected PC. A further increase in the injection rate of high volatile bio-based materials requires oxygen enrichment, otherwise the RAFT temperature decreases, and top gas temperature increases [12,13].
The effect of injection rate, O2 concentration and particle diameter on combustion characteristics of biochar in the raceway of BF has been investigated [14]. Increasing the O2 concentration in the blast from 23 wt.% to 27 wt.% resulted in higher combustion rate for biochar; however, the combustion rate was also affected by the injection rate, particle size and the volatile matter content in the biochar. It was reported that the porous structure of charcoal improves the combustion process in a raceway to become comparable to that of coal [15]. Injection of charcoal into the BF results in a lower amount of slag and higher production rate due to the low sulfur, ash content and higher content of CaO compared to pulverized coal injection (PCI) [16,17]. The results of mathematical modelling indicated an increase in the blast furnace productivity by about 25% when 100 kg/tHM of charcoal is injected with 150 kg/tHM pulverized coal with an optimization of the oxygen enrichment [18]. Further, according to [19], injection of 200–220 kg/tHM charcoal will reduce the net CO2 emissions by ~40%. Due to the high H2 content of biomass compared to coal, replacement of coal by biomass will contribute directly to lowering CO2 emission from a blast furnace. Increasing H2 content in the shaft will also improve the reduction kinetics of descending iron oxide [20].
Several mathematical models have been developed over the past few decades for comprehensive understanding, predicting and analysis of some complicated internal physical and chemical phenomena in the BF. The BF models can be generally classified into 5 main categories: (i) thermodynamic models, (ii) models based on operational diagram, (iii) kinetic models, (iv) control models based on the state of the thermal and chemical reserve zones in the ideal BF, and (v) models based on observed data [21]. Since the 1970s, intensive work has been done to develop static and dynamic BF models based on mass and heat balances in the BF from 1-dimensional (1-D) model proposed by Yagi et al. [22] to 2-D model, 3-D model, and 3-D unsteady state models [23,24]. Recently, multi-dimensional (2D and 3D) and multi-phase (4, 5 and 6 phases) mathematical models based on chemical kinetics and transport phenomena have been greatly developed to evaluate the effect of injections (e.g., pulverized coal, natural gas, coke oven gas and waste plastics) and innovative burden materials (e.g., carbon composite agglomerate) on the BF performance [25,26,27,28,29]. The growing size of the BFs and the urgent need to follow the burden distribution and analysing the complicated heterogeneous interactions in the furnace, advanced models based on Discrete Element Method (DEM) [30], Computational Fluid Dynamics (CFD) [31] and DEM-CFD [32] are being developed and validated with experimental data.
Although some investigations and industrial campaigns demonstrated several benefits on replacing PC with pre-treated biomass in the BF [7,33], further studies are still needed to evaluate the effect of the physico-chemical characteristics of biomass on the BF efficiency and stability. The biochar has higher reactivity, lower density, higher moisture affinity and requires careful control of grindability and sieving to get the proper particle size for efficient injection into BF compared to the fossil coal [34]. As the biochar could come from diverse sources of biomass and it can be produced by various technologies at different pyrolysis conditions, it is important to investigate the influence of physical and chemical characteristics of biochar on the efficiency of PC replacement in BF. The present study aimed at investigating the effect of different grades of biochar on replacing PC at different levels (0–100%) while evaluating the BF operational parameters. PC is used as a reference case to evaluate the efficiency of biochar injection into BF. The effect of biochar injection on the raceway adiabatic flame temperature (RAFT) and top gas temperature (TGT) was investigated. The oxygen enrichment in the blast and moisture content of biochar were optimized to reach the highest injection rate of biochar.

2. Heat and Mass Balance Model (MASMOD)

2.1. Brief Description of MASMOD

In the present study, a 1-D static BF model with comprehensive heat and mass balances is used to evaluate the potential of PC replacement by biochar injection. The MASMOD was developed in a Microsoft Excel environment and its schematic description is shown in Figure 1. As can be seen, the model is divided into three sub-models, i.e., the burden model, the BF model, and the hot stove model. The three sub-models are connected and balanced via iterative calculations. Reference case operations are used to set specific calibration constants required to calculate the system. The burden model balances the required basicity and reduction degree in the BF model by charging enough materials, including coke, pellets, sinter, and additives (limestone and quartz). The BF model (including the lower, upper, and thermal reserve zone) calculates a number of reactions given in Figure 1. The calculations are based or converted to units on a per ton hot metal (tHM) basis. The thermodynamic data required in the calculations is from HSC [35] and Factsage [36]. However, furnace dimensioning is not included, nor are various factors such as ferrous burden reducibility, coke reactivity, and permeability. Thus, to apply the model appropriately, the model must be calibrated by the reference data from the BF operation.
The basis for the BF model calibration is the estimated thermal reserve zone temperature and shaft efficiency whereby the furnace is divided into the upper and lower heat and mass balance sections. The reserve zone temperature fixes the CO/CO2 and H2/H2O equilibrium points to balance the heat and mass from direct and indirect reduction of iron oxides. The addition of shaft efficiency, defined as the extent to which the CO/CO2 and H2/H2O equilibrium with wüstite, are reached at a given thermal reserve zone temperature, adding a degree of freedom in the calibration that allows for deviation from the ideal case. The shaft efficiency calculation (Equation (1)) uses data from Factsage [36]. H2/H2O composition in the thermal reserve zone is calculated likewise.
CO2/(CO + CO2)reserve zone = Shaft efficiency × (CO2/CO + CO2)equilibrium
where equilibrium refers to equilibrium with wüstite/Fe0 boundary at reserve zone temperature.
The flame temperature calculation is made iteratively according to Equation (2)
FT = (ΣHi,tuyere injectants + ΔHcombustion + ΔHcracking + Hcoke, T=0.75*FT) / ΣCp,j T = FT
where
  • FT = Flame temperature, (°C)
  • ΣHi,tuyere injection = sensible enthalpy of all tuyere injectants
  • ΔHcombustion = enthalpy of combustions for ½ O2 + C → CO
  • sub>∙ ΔHcracking = enthalpy of thermal dissociation of H2O → H2 + ½ O2
  • Hcoke, T=0,75*FT = enthalpy of coke calculated at 75% of flame temperature (°C)
  • ΣCp,j T=FT = Heat capacity of all raceway gas at flame temperature
The model calculates the required coke rate and blast volume iteratively for heat and mass balance convergence. The blast volume is adjusted iteratively, which alters the coke consumed at the tuyeres, altering bosh gas composition and enthalpy and so on. The total ascending gas and enthalpies of calcination, reduction and drying are balanced to give the top gas composition and temperature. The burden and hot stove models are included in the iterations such that they are balanced with the blast furnace operation.
The model has the flexibility to simulate various scenarios—for instance: changes of burden materials, varying injectants via tuyeres and shaft, or changes in hot blast conditions. In addition, this model has been used to simulate some new BF techniques, such as TGR-BF, hydrogen/coke oven gas injection, etc. [37]. Recently, the MASMOD has been used to evaluate an industrial BF campaign during charging briquettes containing torrefied sawdust [38]. The interpreted values of thermal reserve zone temperature (TRZT) using MASMOD were in a good agreement with the measured values of gas utilization in the BF. The model has been recently applied to evaluate the effect of different types of biomass on the BF performance and the overall impact has been visualised in Rist- and carbon direct reduction rate (CDRR) diagrams [39]. A full description of the model, calibration and thermodynamic calculations are thoroughly discussed elsewhere [37].

2.2. Set-Up of MASMOD

The MASMOD is calibrated for a standard Swedish BFs operation operates on almost 100% iron ore pellets and the reference data is published elsewhere [40]. The model is calibrated for a standard BF operation and based on the reference data published elsewhere [39]. The following assumptions were made:
  • The production rate of hot metal (tHM/h) kept constant;
  • RAFT (Raceway adiabatic flame temperature) kept constant or varied;
  • TRZT (thermal reserve zone temperature) kept constant;
  • TGT (top gas temperature) was varied;
  • Shaft efficiency was assumed to be constant as the reference;
  • Slag basicity kept the same by adjusting the amount of limestone to BF, meanwhile the slag rate varied;
  • PCI was varied, meanwhile, coke rate was kept constant;
  • Pellets and briquettes rate kept constant;
  • The generated dust and sludge kept constant at 15 kg/tHM of dust and 5.0 kg/tHM for sludge.
Based on the above assumption and modelling approach, the key BF operation parameters are given in Table 1.

2.3. Scenarios and Designed Cases of Biochar Injection

One reference case and 6 cases for each type of biochar were designed and evaluated using MASMOD, as given in Table 2. In the reference case, the PCI was 143 kg/tHM and O2 enrichment was 4.2%, top gas temperature was 124 °C and RAFT was 2162 °C. For each of the biochar, 6 cases were considered as follows: (i) 30 kg/tHM injection, (ii) 60 kg/tHM, (iii) 90 kg/tHM, (iv) 100% replacement of PCI while O2 enrichment is constant, (v) 100% replacement of PCI while RAFT is constant and (vi) 100% replacement of PCI while top gas temperature is constant. Moreover, case (iv) for each type of biochar is re-calculated at fixed moisture content of 0.5%, which is equal to that in PC.

2.4. Production and Analysis of Biochars

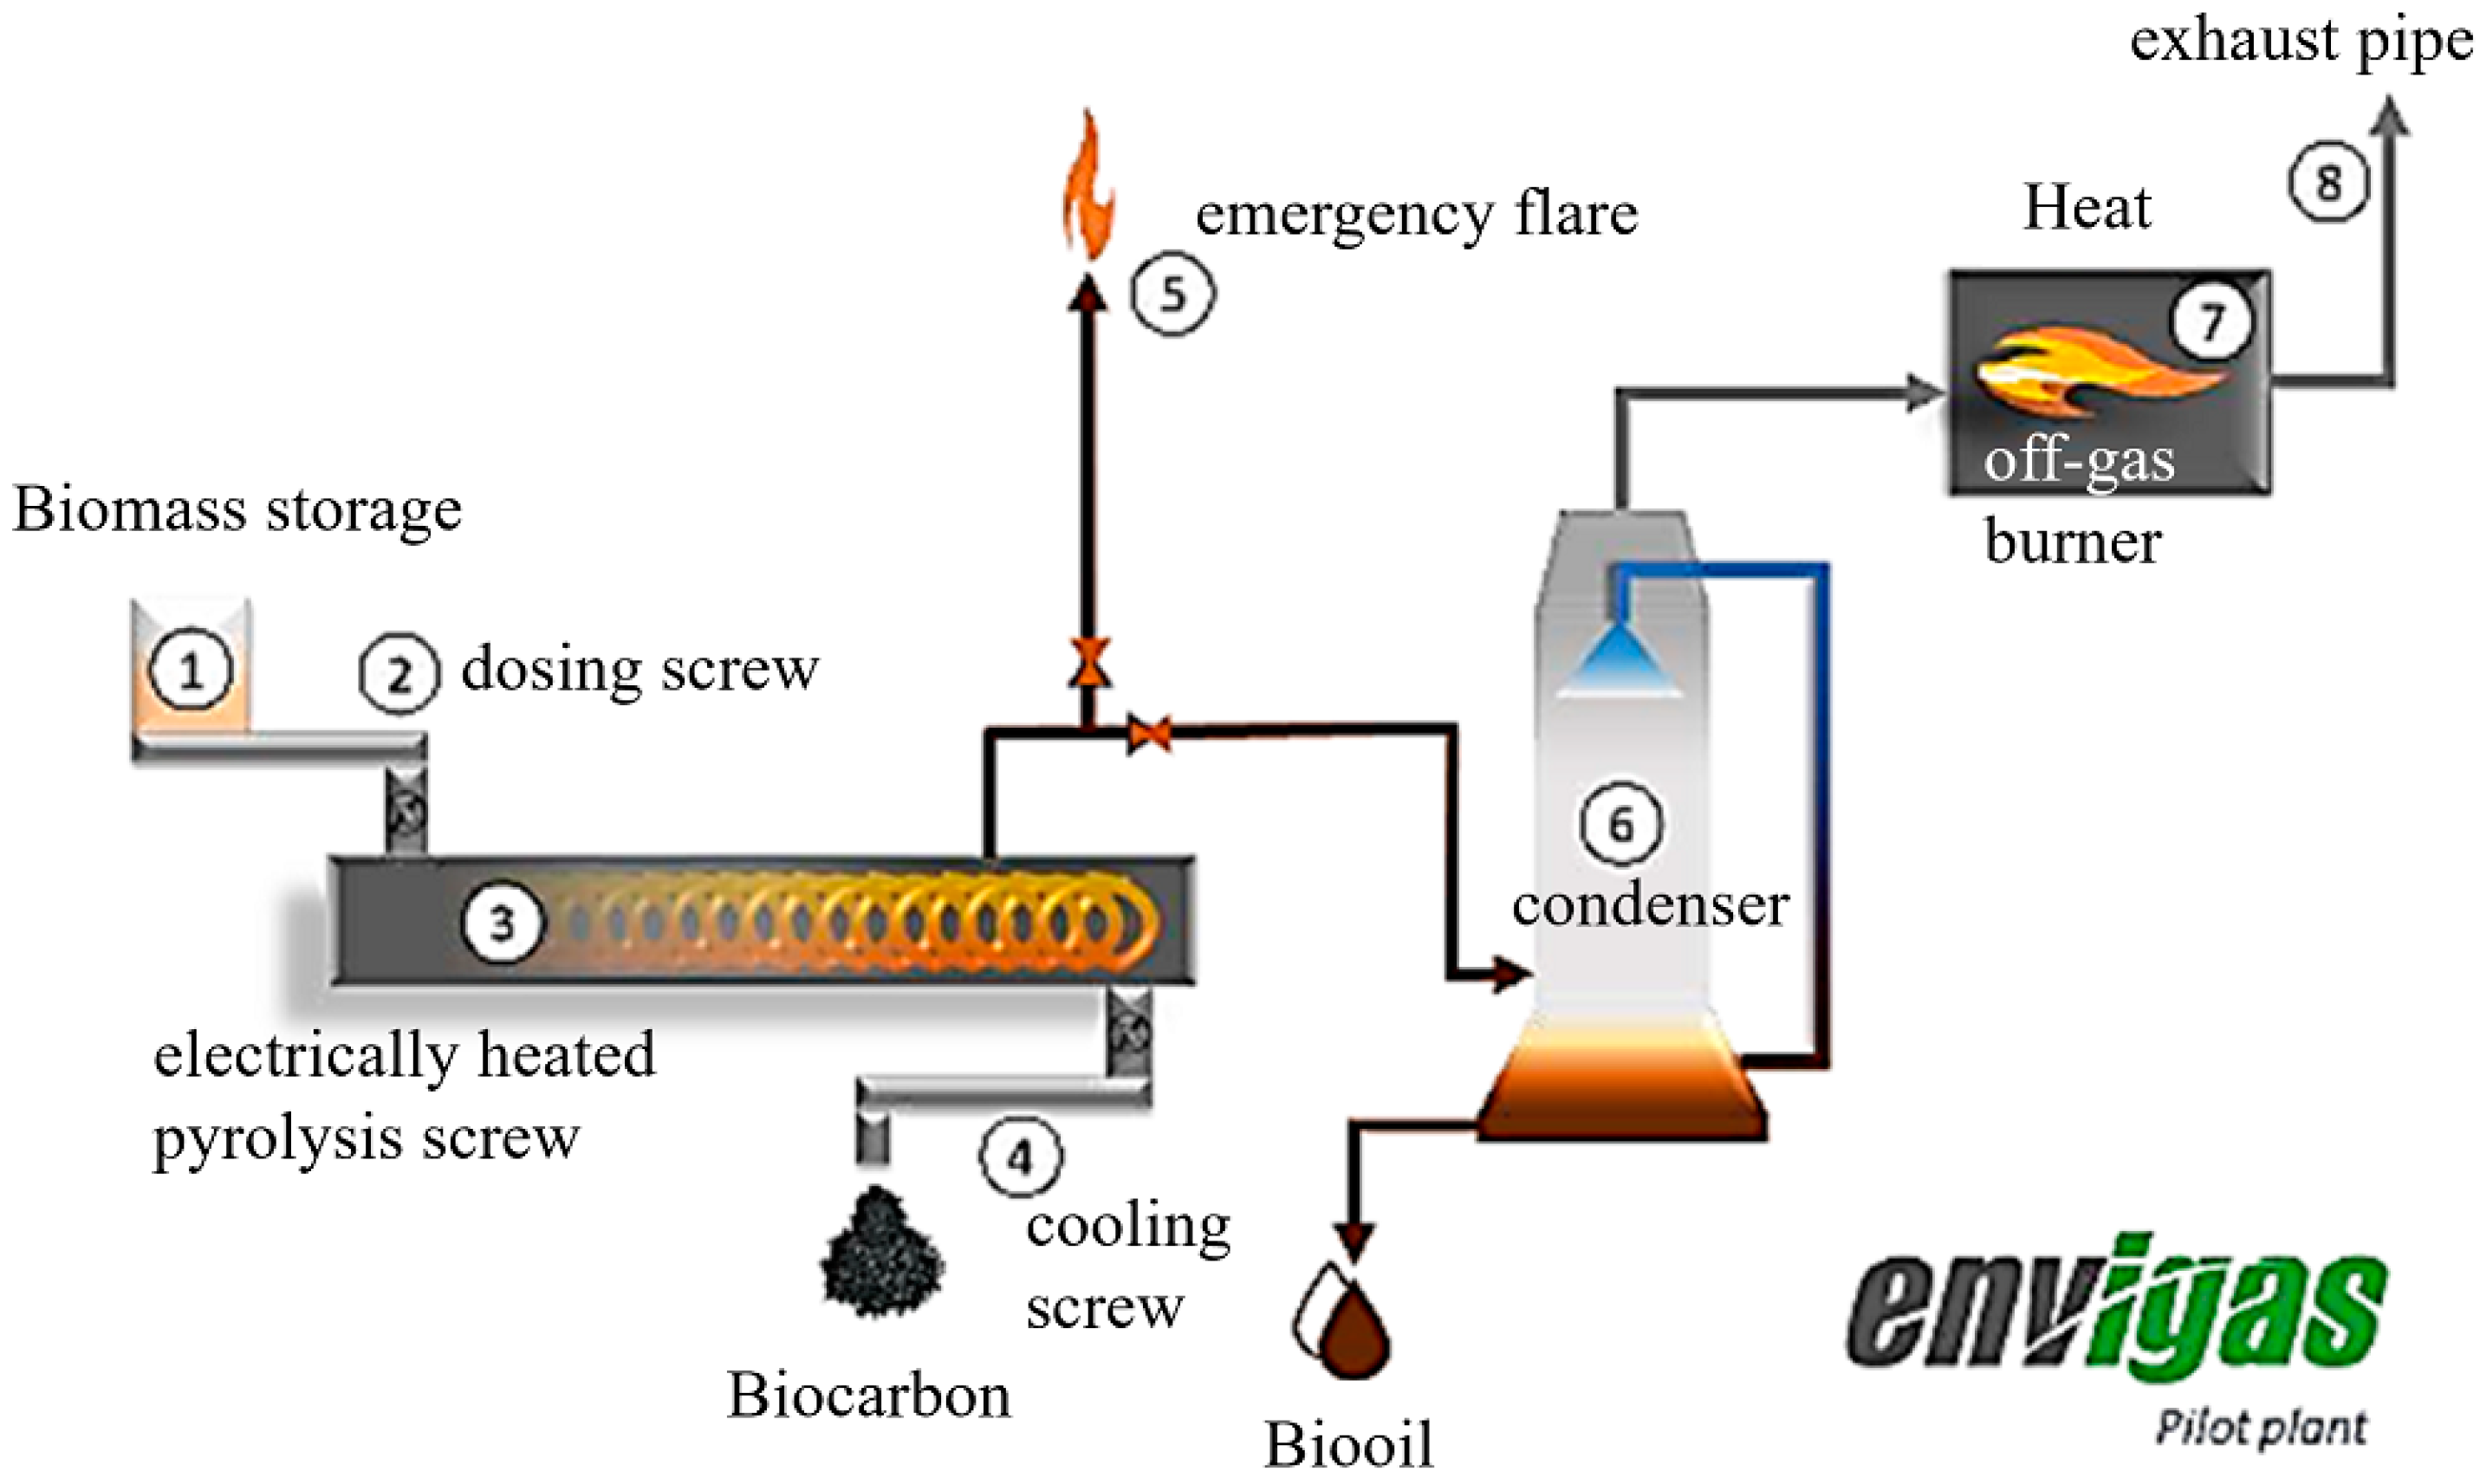
Envigas has conducted pyrolysis for small batches of sawdust biomass in several campaigns at the pilot plant located in Bureå to produce biochar with different qualities to be evaluated for BF injection. The biomass pyrolysis process was performed in an electrically heated screw reactor with the pyrolysis temperature of 550–650 °C, as schematically shown in Figure 2 [41]. The biochar yield is obtained directly from the process by recording weights of the input feedstock and the produced biochar. More description of the process and products are discussed elsewhere [41,42].
The chemical composition of PC and 3 different grades of biochar is given in Table 3. Biochar 2 and 3 have higher carbon content compared to PC, while biochar 1 has lower carbon content. The ash content was lower in biochars compared to that in PC. The moisture content was varied between different grades of biochar. Biochar 3 has the highest moisture content (13.10%), while the PC has the lowest moisture content (0.5%).

3. Results and Discussion

3.1. Effect of Biochar Injection on Reducing Agent and CO2 Emissions

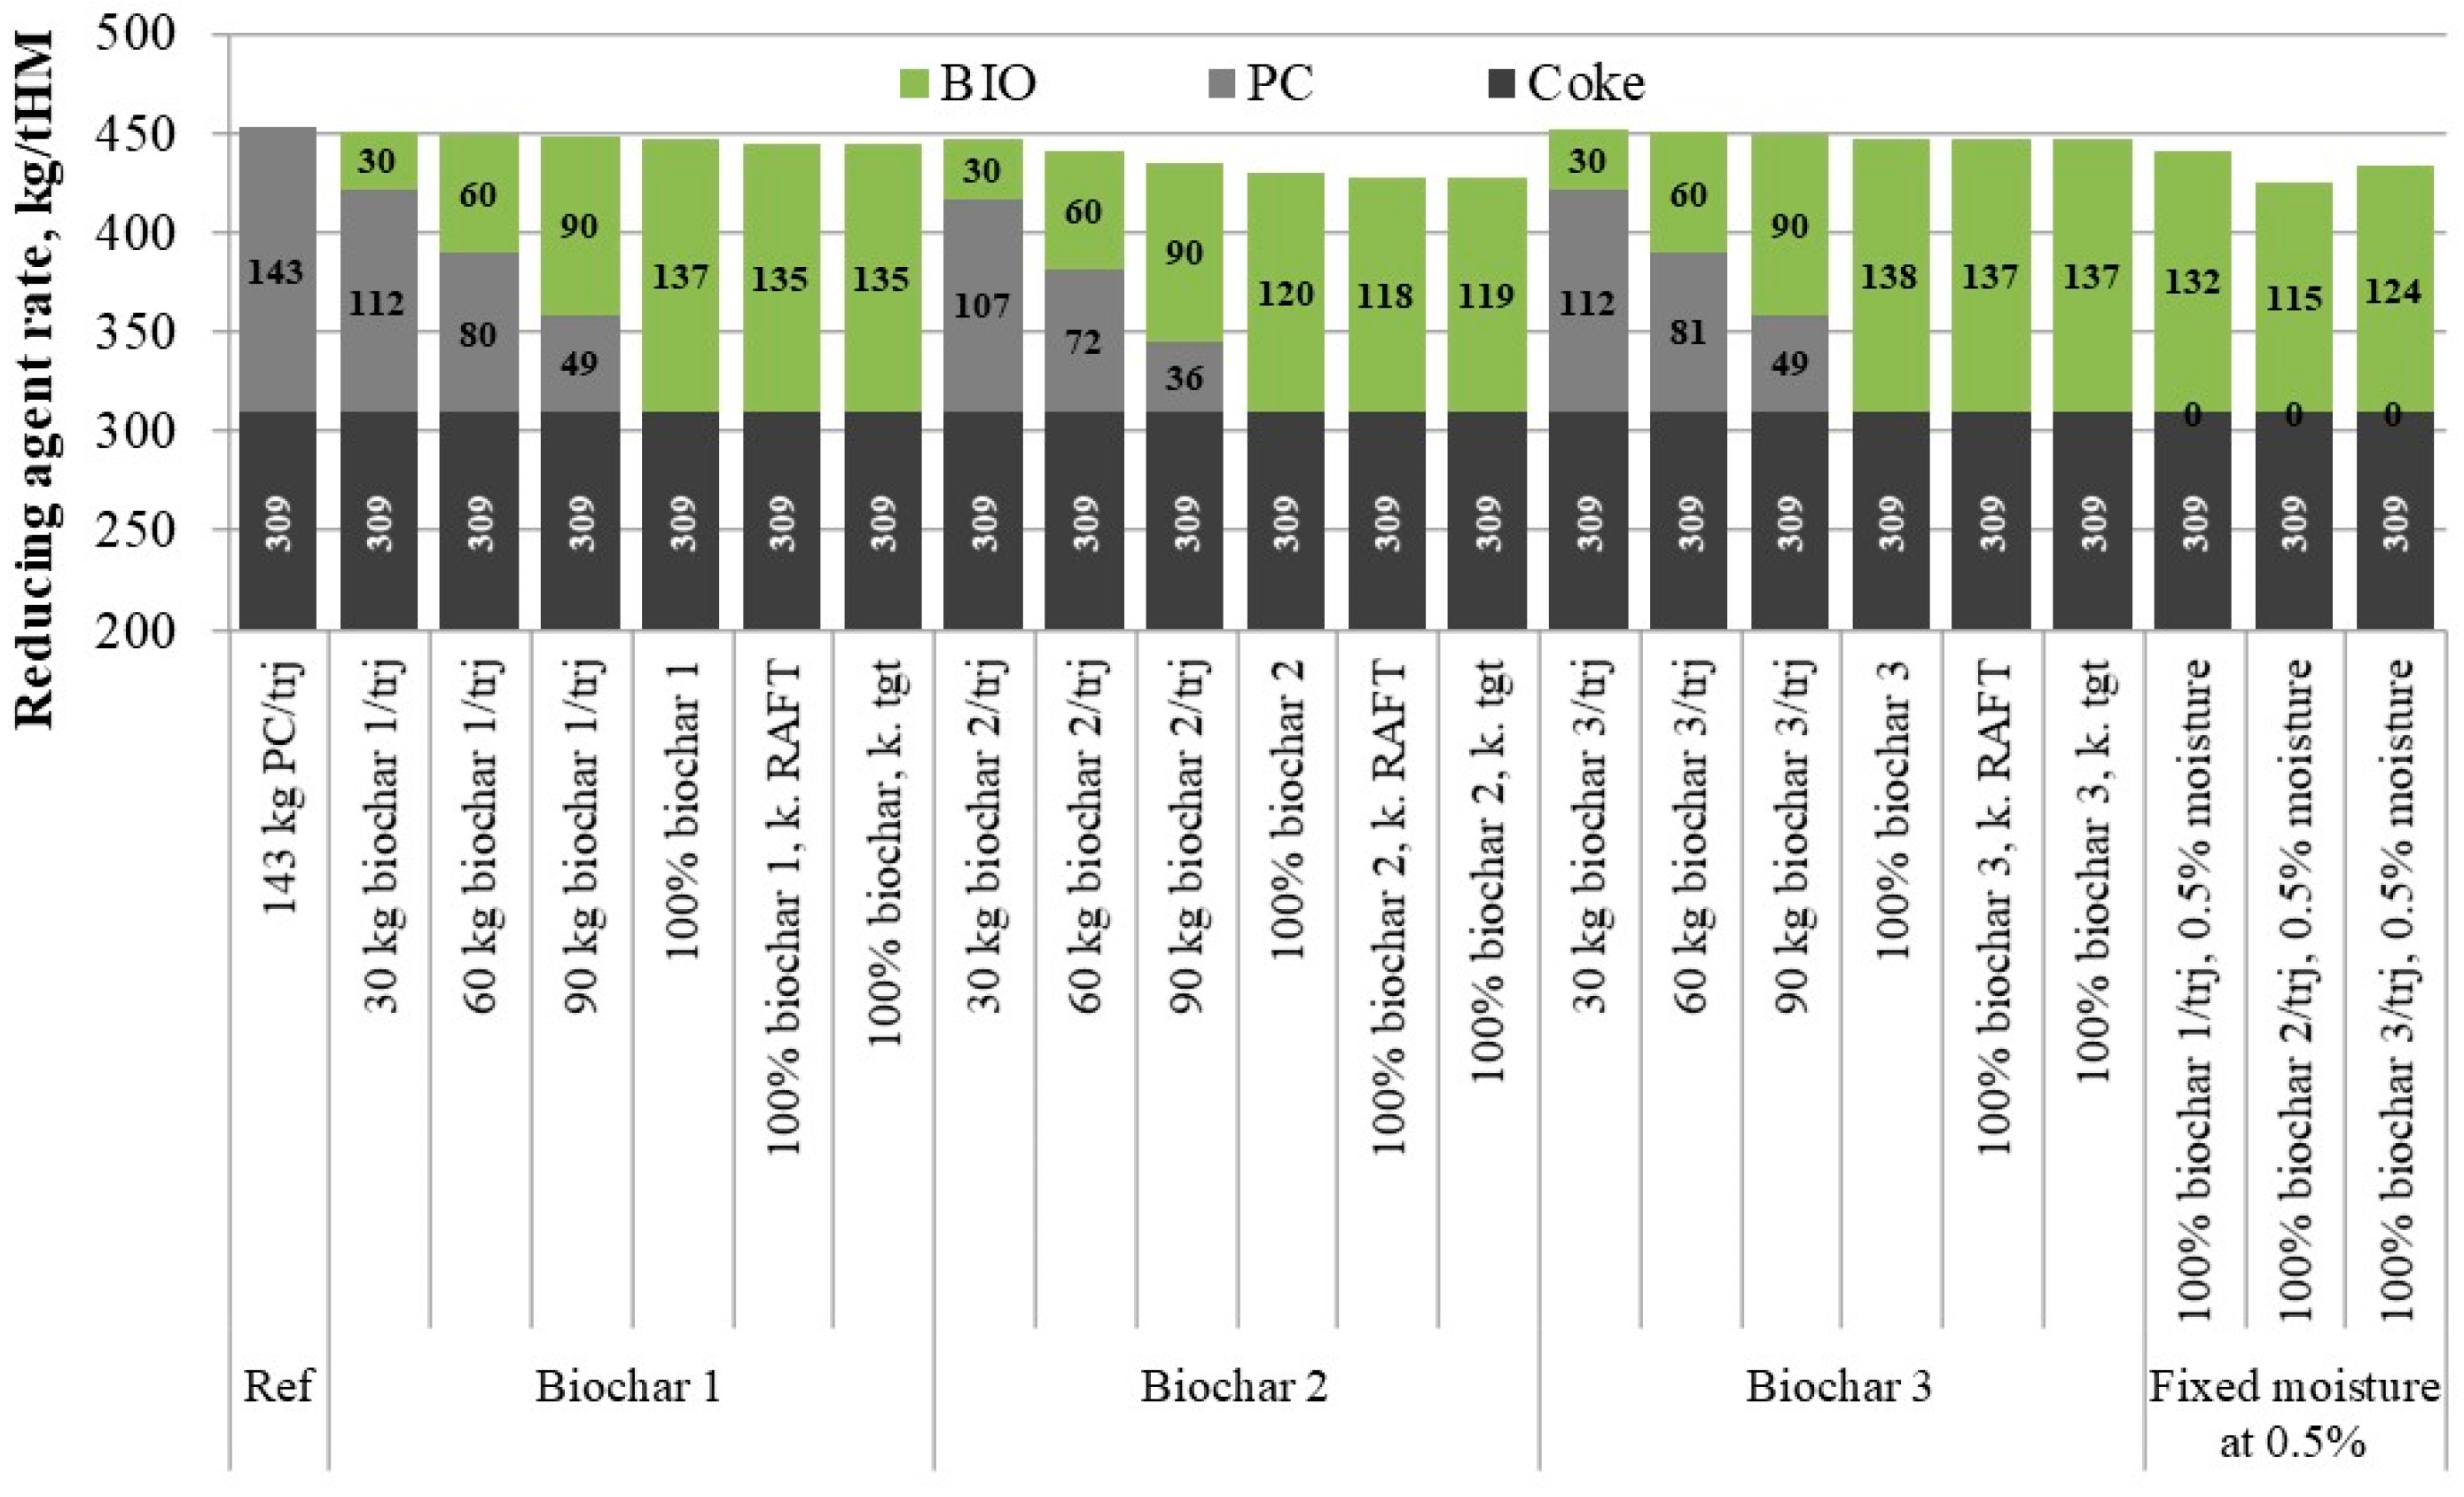
Figure 3 shows the changing of reducing agent rate by partial and full replacement of PC with different grades of biochar as-received, and when the moisture fixed at 0.5% as that in the PC. It can be seen that biochar 2 has the highest potential in replacing all of PC compared to biochar 1 and 3. The replacement grade of biochar for PC is given in Table 4. The replacement ratio of all types of biocoal is higher than 1.0, and the highest ratio was exhibited by biochar 2. The replacement ratio increased by fixing the moisture content at 0.5%. Biochar 1 and biochar 3 as-received have an equal replacement ratio for PC.
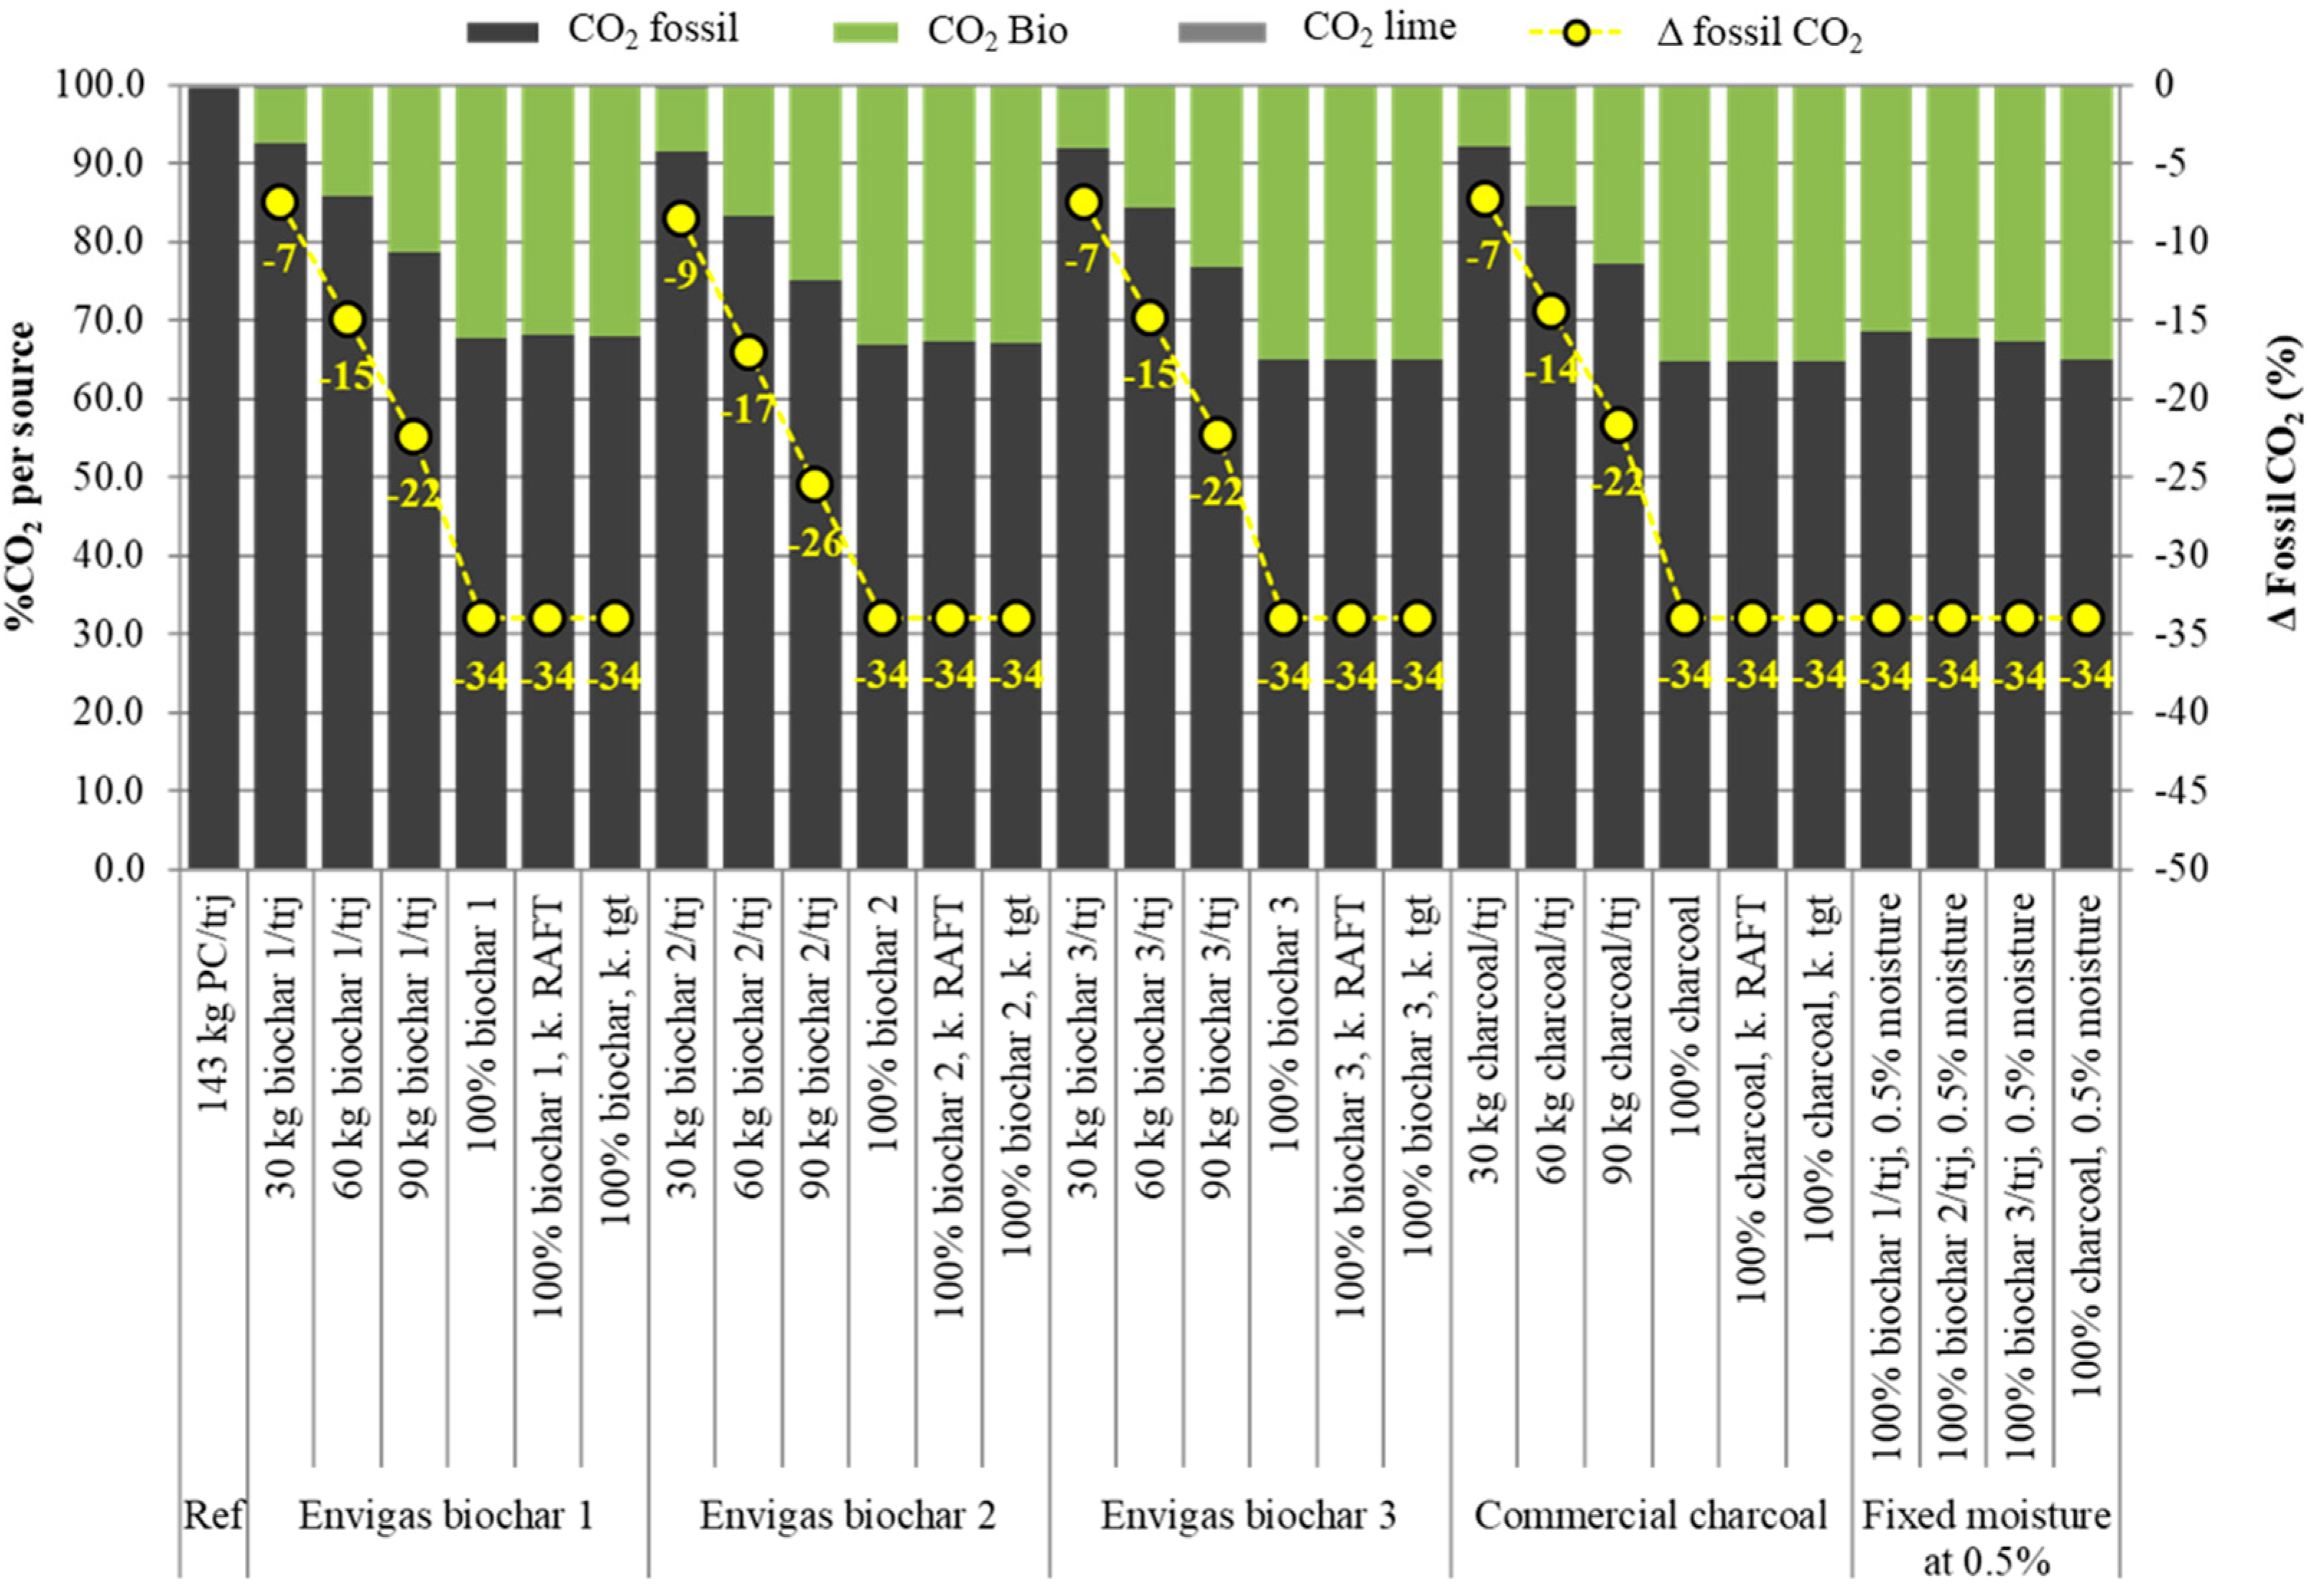
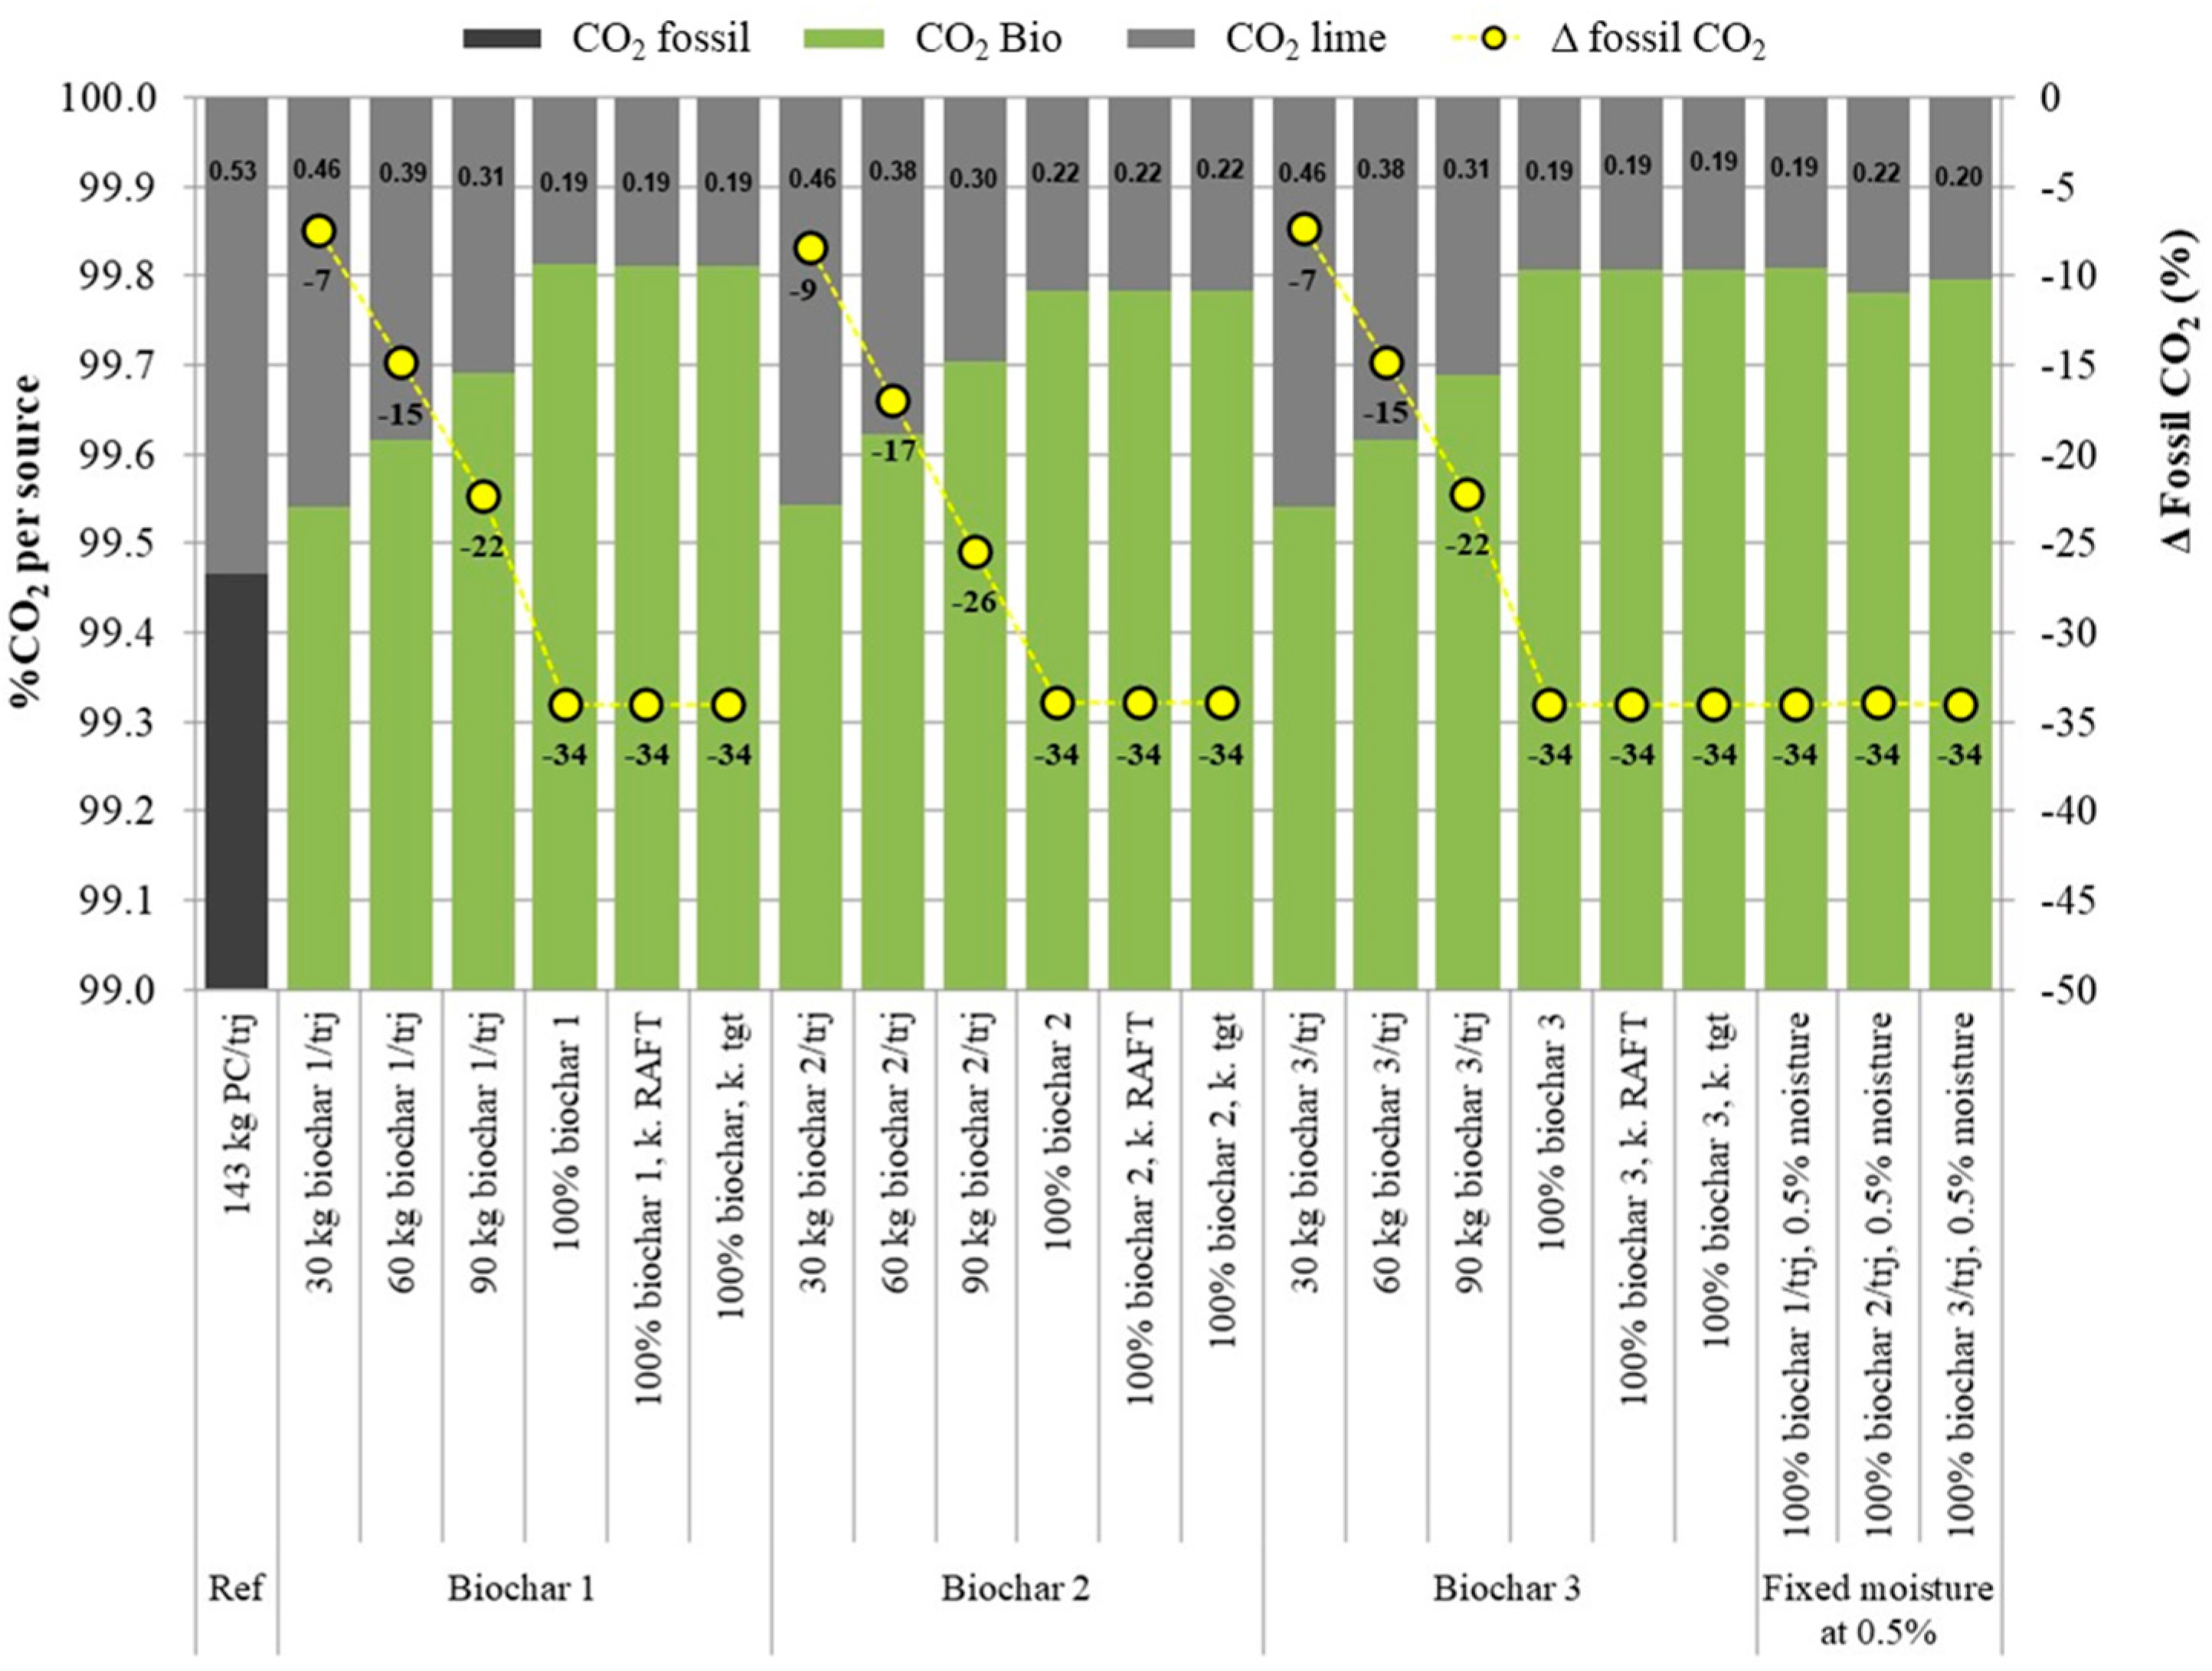
The effect of biochar injection on CO2 emission is shown in Figure 4. All types of biochar can theoretically save up to 34% of fossil CO2 emission when 100% of PC is replaced by biochar. The biochar has lower SiO2 compared to PC (see Table 3), and, consequently, less lime is needed to adjust the basicity in the BF. To clarify the effect of lime changing on the fossil CO2 emission, the y-axis is enlarged, as shown in Figure 5. The fossil CO2 emission from lime decreases from 0.53% in reference case (PC) to only 0.19% by full replacement of PC with biochar.

3.2. Effect of Biochar Injection on RAFT and TGT

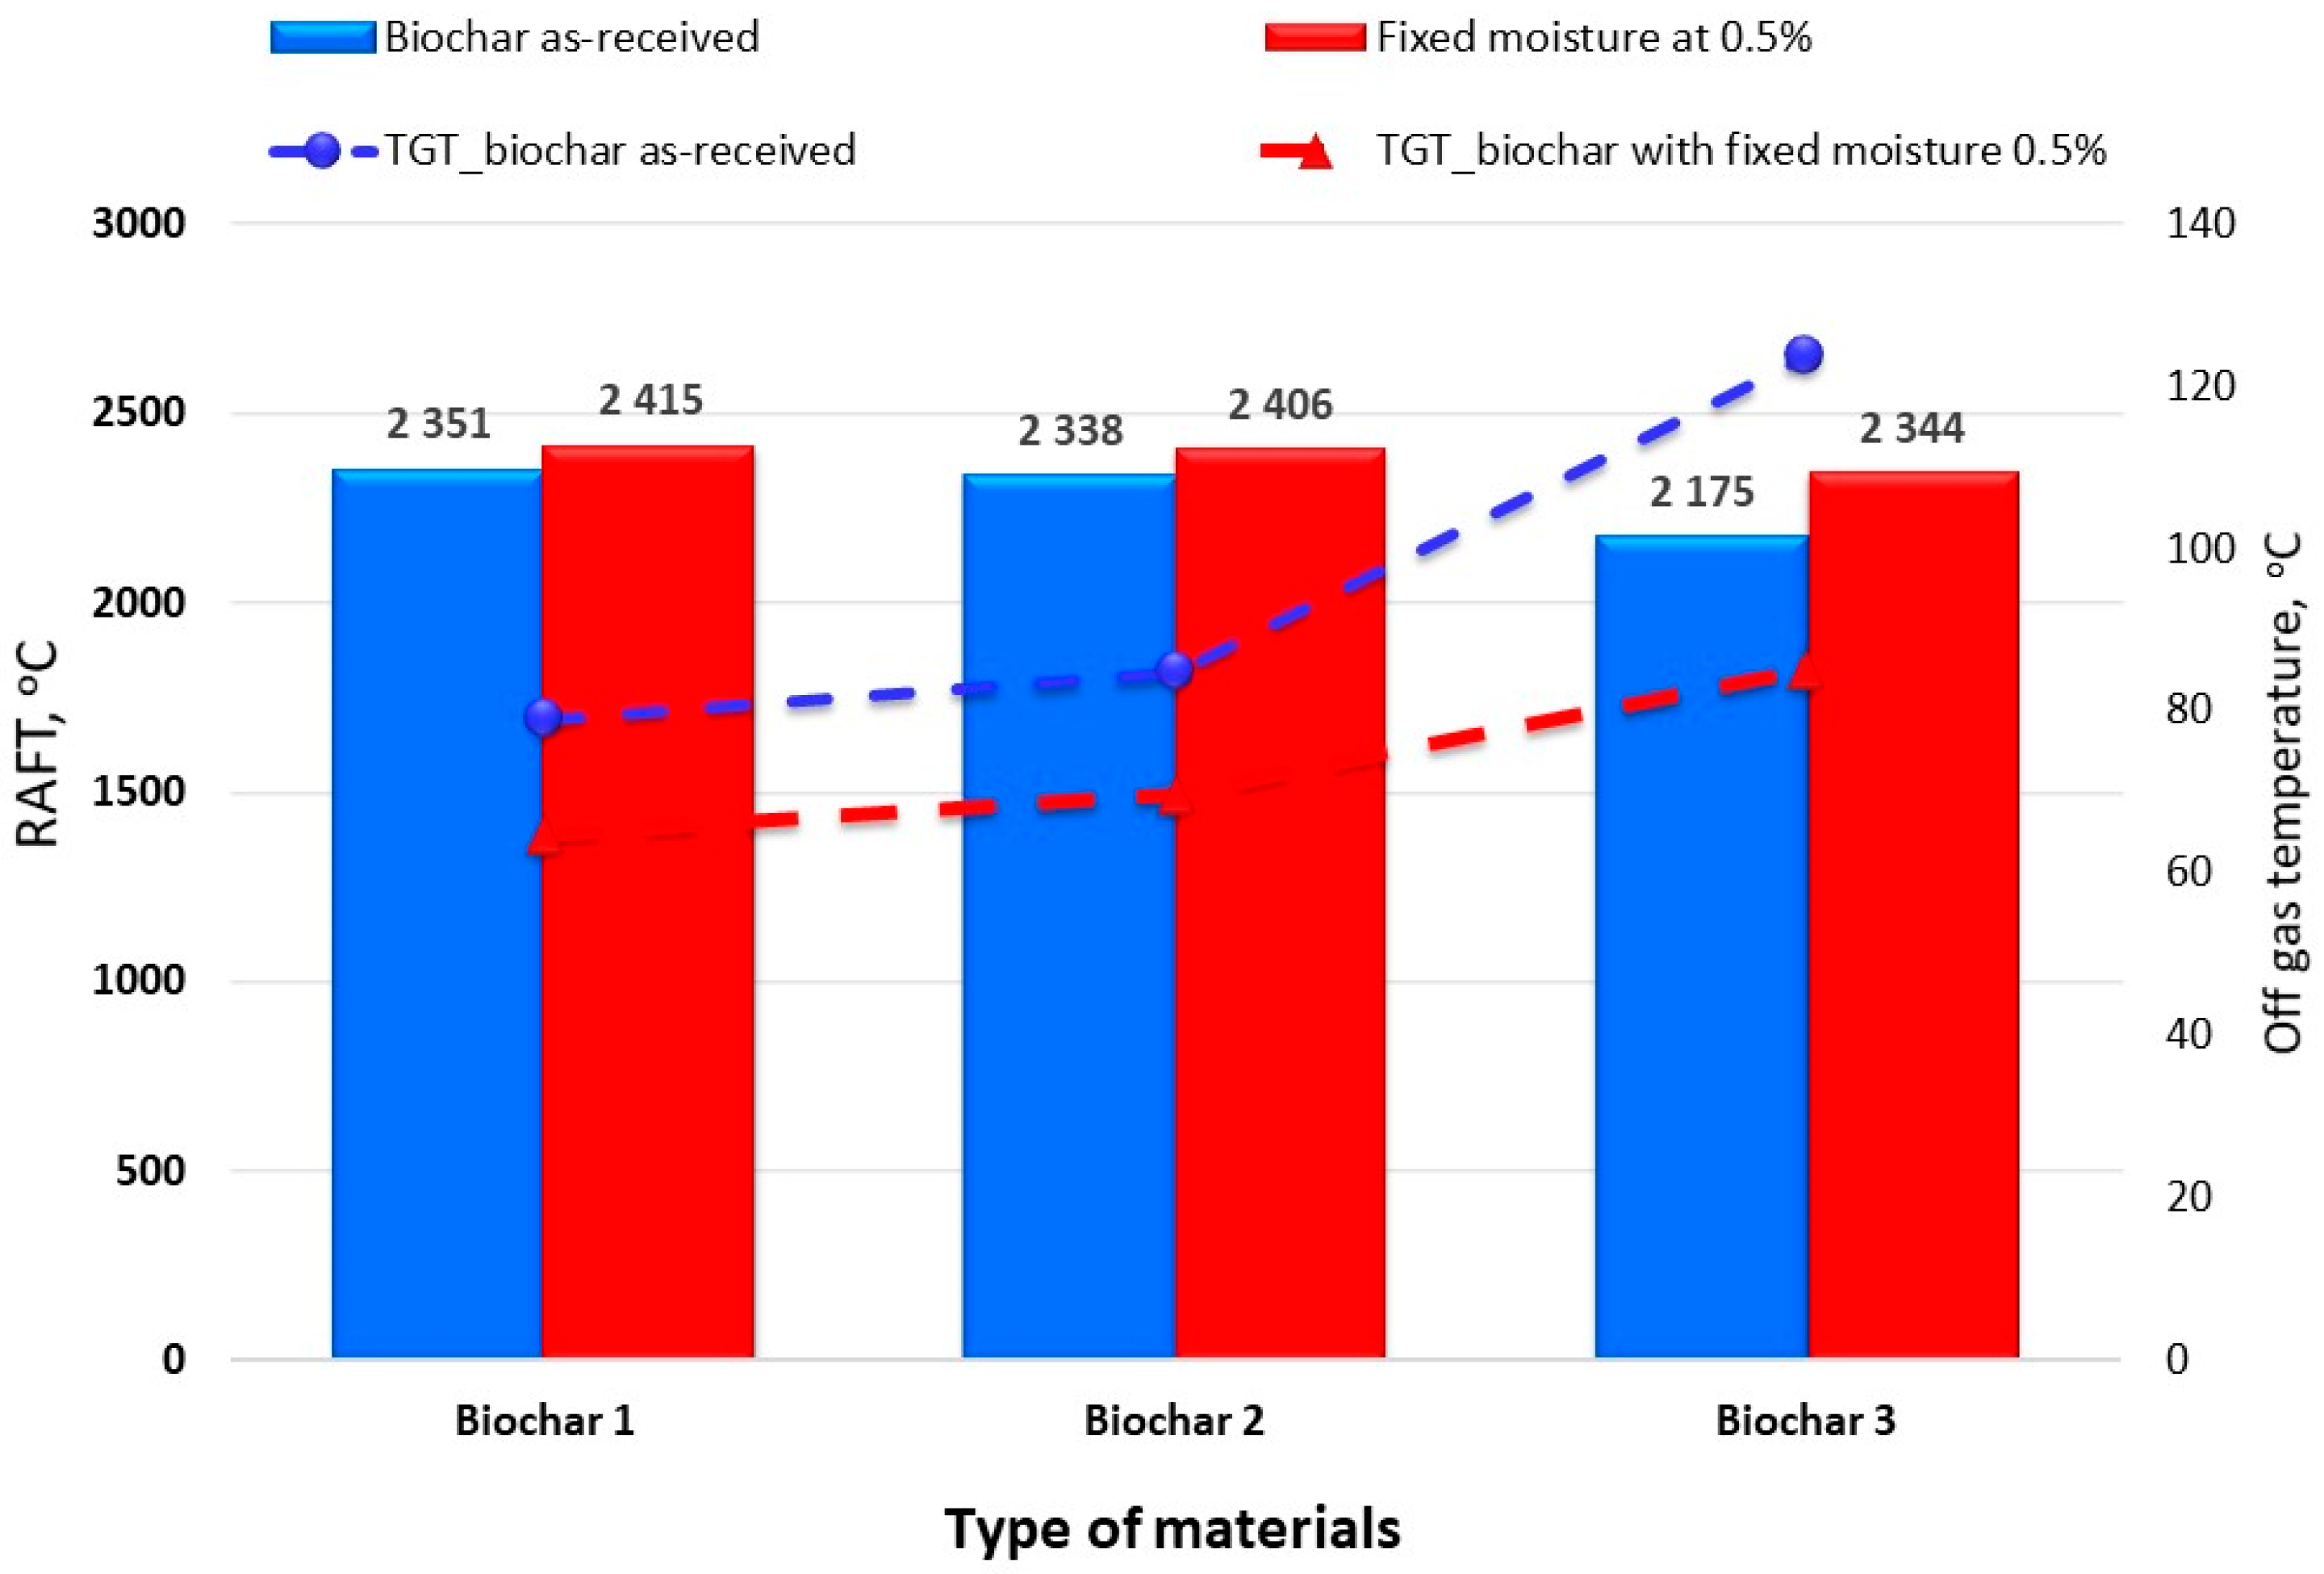
The effect of biochar grades and the replacement rate of PC on the RAFT and the top gas temperature is given in Figure 6. When O2 enrichment was fixed as reference, the RAFT was gradually increased by increasing the replacement amount of PC with biochar 1 and biochar 2. The RAFT increased by ~190 °C by injection of biochar 1, while the top gas temperature (TGT) was gradually decreased to reach ~45 °C lower than that of reference case. This can be attributed to the lower H2 content in biochar 1 and 2 compared to the reference case, which resulted in reducing the specific gas volume, causing a reduction in TGT and higher RAFT. Although biochar 3 has almost equal concentration of H2 as that in biochar 1, the higher moisture content was able to balance the impact on both RAFT and TGT, which means that the higher moisture content increased the specific gas volume to avoid the negative effects of TGT and restricted the increase of RAFT. It was not possible to fix the RAFT at 100% replacement of biochar 1 and biochar 2, and it was increased by ~40 °C and 30 °C, respectively, compared to the reference case. In order to fix the TGT, the O2 enrichment should be reduced to become ~0.8% and 1.3% for biochar 1 and biochar 2, respectively, instead of 4.2% in the reference case. Biochar 3 exhibited close results for TGT and RAFT, and both could be used to replace 100% of biochar without much affecting the O2 enrichment, TGT, and RAFT. Figure 7 shows the changing of RAFT and TGT when all PC is replaced with biochar, when the moisture kept as-received, and when the moisture fixed at 0.5%, as in the reference case. By reducing the moisture content of biochar at 0.5%, the RAFT was sharply increased to be higher than 2400 °C for biochar 1 and 2, while the TGT is sharply reduced to become less than 65 °C. Based on these results, reducing the moisture content of biochar will reduce its potential for PC replacement, while optimization of the moisture content of biochar and O2 enrichment in the blast provide a good opportunity to sustain the highest replacement ratio of PC without deteriorating the TGT and/or RAFT.
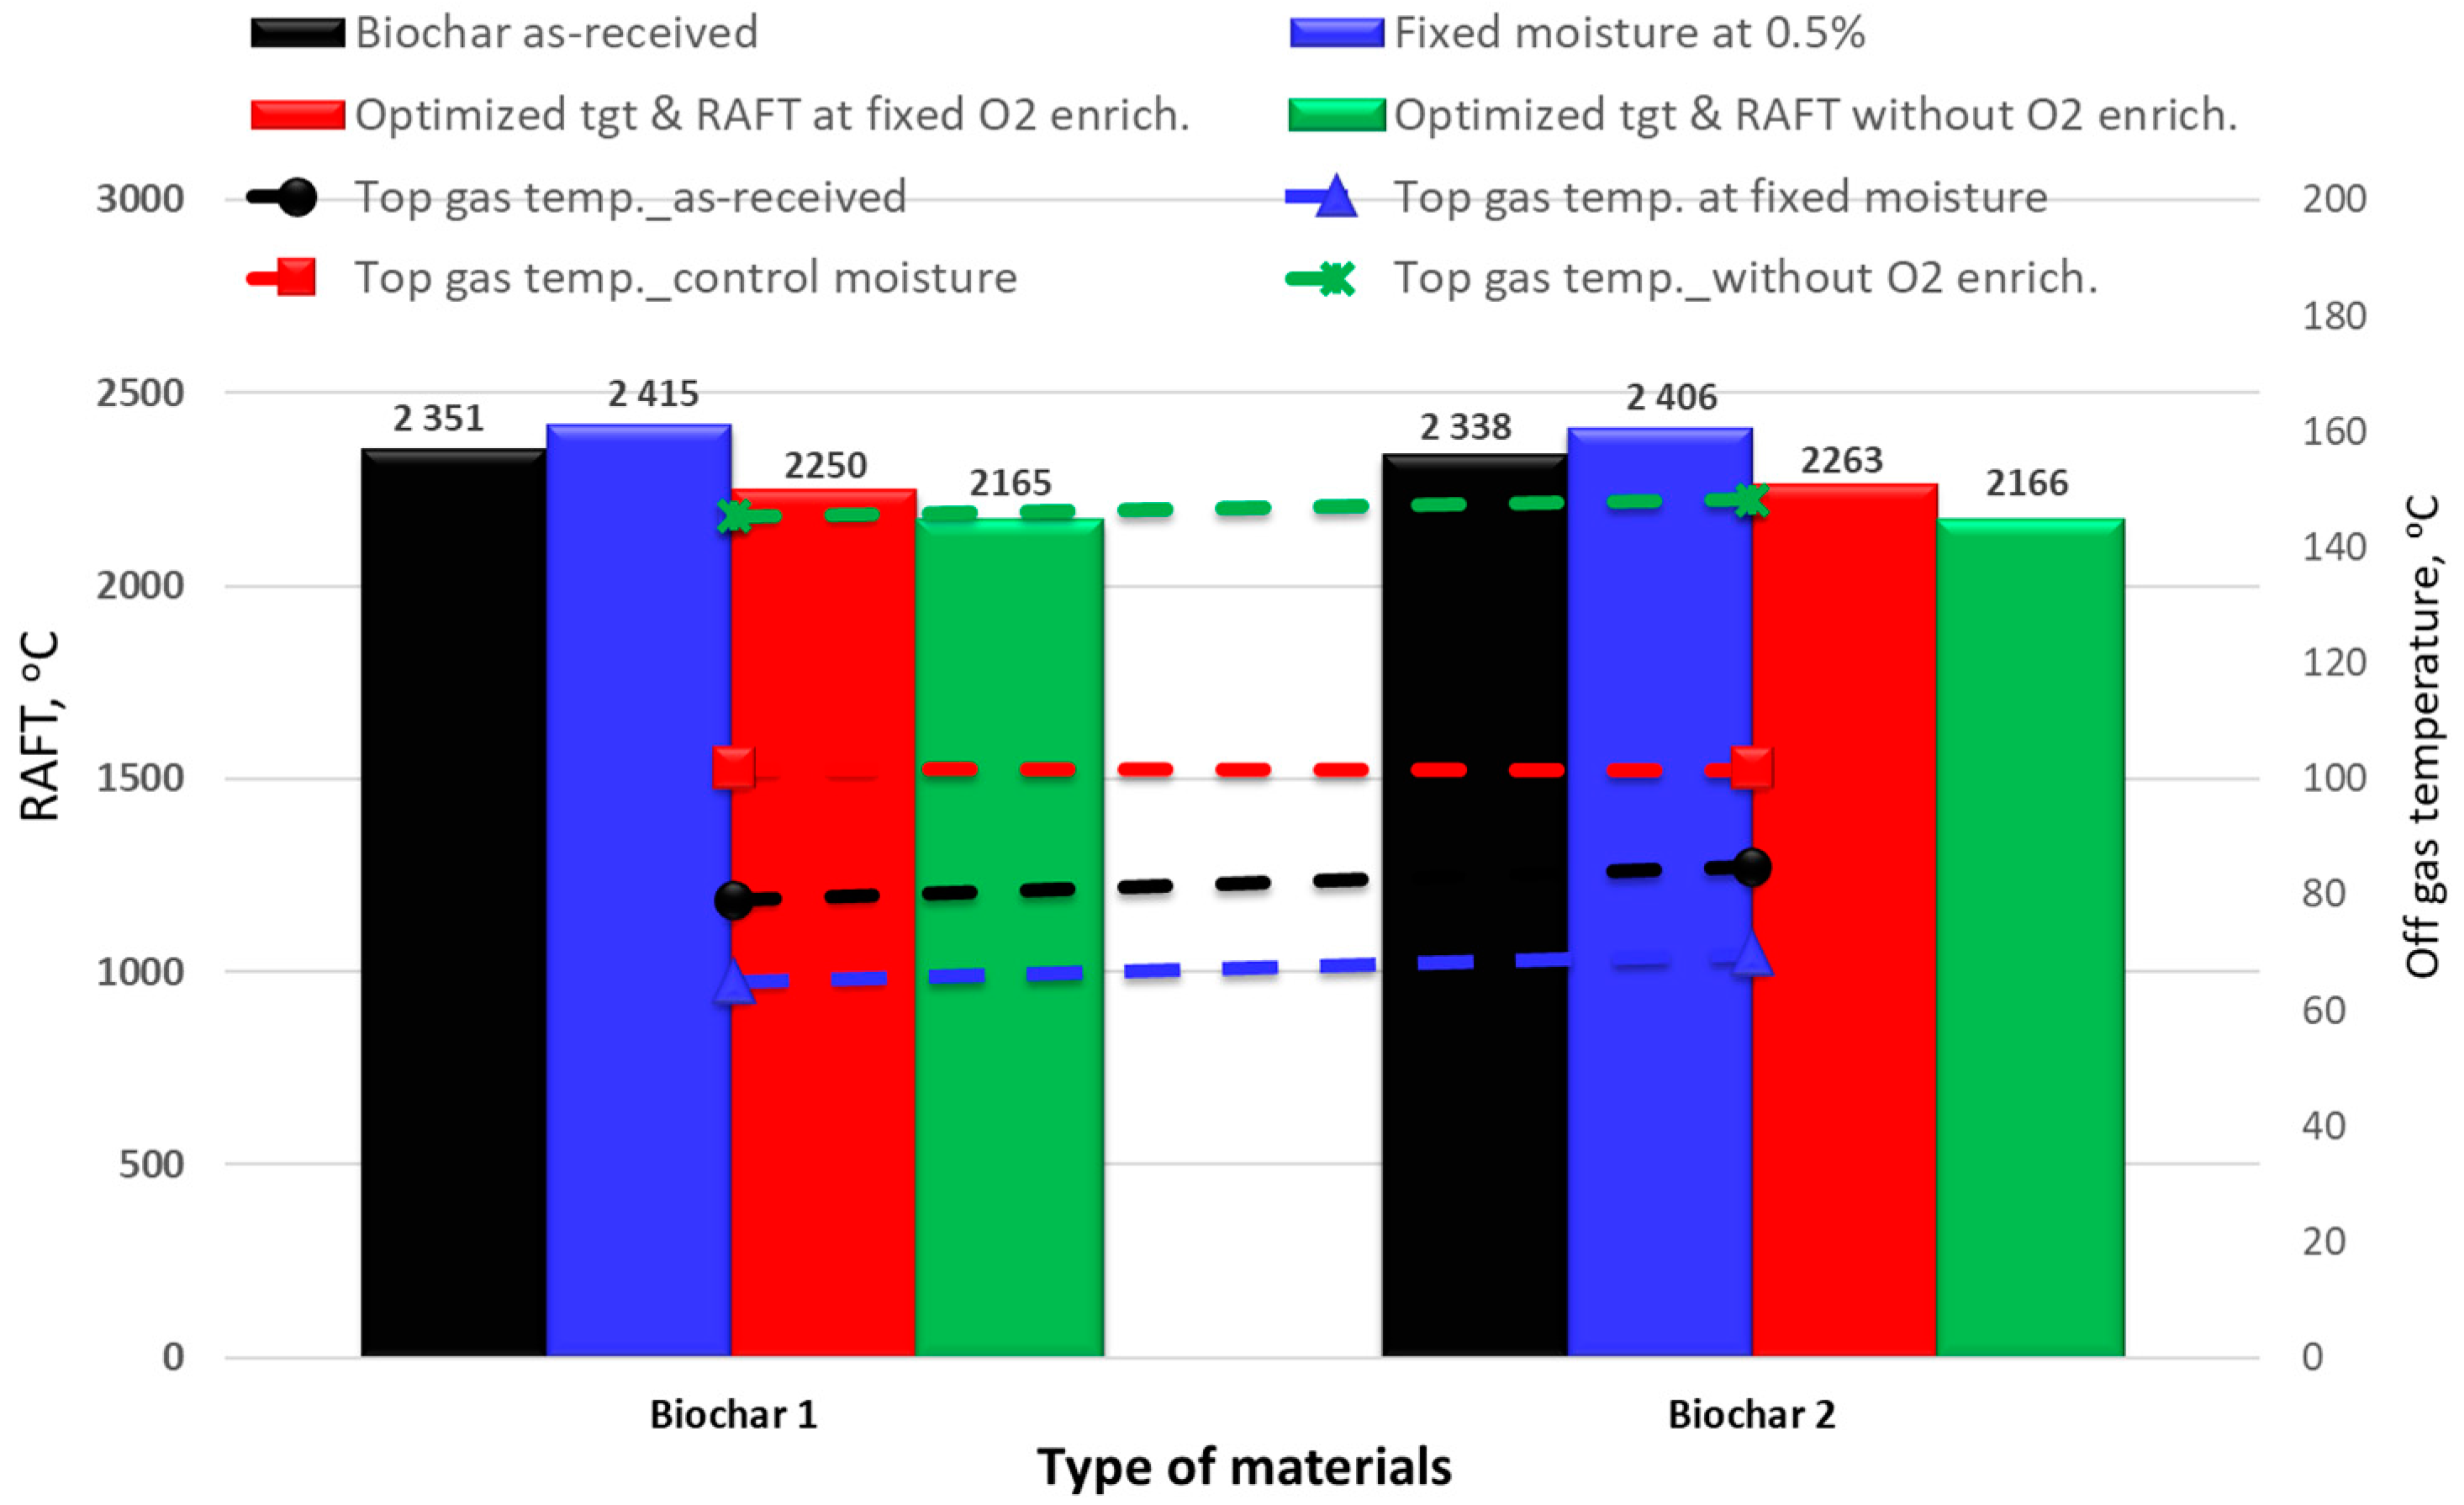
Table 5 shows the condition proposed to optimize the TGT and RAFT at 100% replacement of PC with biochar 1 and biochar 2. The first option is to fix the O2 enrichment at 4.2%, as in the reference. This requires increasing the moisture content in biochar 1 and biochar 2 to 12%. The second option is to avoid the O2 enrichment in the blast; meanwhile, the moisture content of biochar has to be increased to 8.5%. The results of optimized cases, compared to that obtained when biochar is used as-received, or when biochar dried to 0.5% moisture, is given in Figure 8. It can be seen that both options were able to increase the TGT and reduce the RAFT, and the second option will be more efficient than the first one on optimizing the TGT and the RAFT. The potential of biochar injection at 100% replacement of PC and its impact on reducing the fossil CO2 emission is given in Table 6. The full replacement of PC with biochar 3 can annually save more than 1042 ktons of fossil CO2, ~24 ktons of limestone and 33 ktons of slag. In future work, the calculated values from MASMOD will be tested and validated with the actual measured operational data of BF during the biochar injection campaign.

4. Conclusions

Three grades of sawdust biochar were produced and investigated to replace pulverized coal (PC) injection in the blast furnace (BF) using the heat and mass balance model (MASMOD). The total carbon content was 79.2%, 93.4% and 89.2% in biochar 1, 2 and 3, respectively, while it was 81.6% in the reference PC. The effect of biochar injection at different levels from 30 kg/tHM up to 143 kg/tHM (represent 100% replacement of PC) is evaluated. The MASMOD calculations showed that injection of biochar has great potential to reduce the fossil CO2 emissions in the BF. The fossil CO2 emission can be theoretically reduced by up to 34% by full replacement of PC with biochar in the BF. As the injection rate of biochar 1 and biochar 2 increased, the RAFT increased by ~190 °C, while TGT decreased by ~45 °C at 100% replacement of PC with biochar. By optimizing the moisture content of biochar 1 and 2 and the oxygen enrichment in the blast, it is possible to reach 100% replacement of PC with biochar without much affecting the RAFT and TGT. Biochar 3 was able to replace 100% of PC without deteriorating the RAFT or TGT. Under current assumptions, the full replacement of PC with biochar can annually save more than 1042 ktons of fossil CO2, ~24 ktons of limestone and 33 ktons of slag in the applied BF case. Our next investigation will focus on testing the fluidization characteristics, combustion efficiency, reaction rate and technical feasibility of biochar injection into the ironmaking BF, and validating the modeling assessment with the measured operational BF data.

Author Contributions

E.M.: Methodology, Investigation, Formal analysis, Writing—original manuscript. K.S.: Methodology, Writing—review & editing, Funding acquisition. All authors have read and agreed to the published version of the manuscript.

Funding

This research was funded by Envigas AB, Sweden and the APC was funded by Swerim AB.

Conflicts of Interest

The authors declare that they have no know competing financial interests or personal relationships that could have appeared to influence the work reported in this paper.

References

  1. World Steel Association. Total Production of Crude Steel. Available online: https://worldsteel.org/steel-by-topic/statistics/annual-production-steel-data/P1_crude_steel_total_pub/CHN/IND (accessed on 11 February 2022).
  2. Gerres, T.; Lehne, J.; Mete, G.; Schenk, S.; Swalec, C. Green Steel Production: How G7 Countries Can Help Change the Global Landscape. Available online: https://www.industrytransition.org/insights/g7-green-steel-production/ (accessed on 11 February 2022).
  3. Taylor, P. Energy Technology Perspectives 2010: Scenarios & Strategies to 2050. Available online: https://iea.blob.core.windows.net/assets/imports/events/320/taylor.pdf (accessed on 2 January 2022).
  4. European Commission. Energy Roadmap 2050. Available online: http://eur-lex.europa.eu/legal-content/EN/TXT/PDF/?uri=CELEX:52011DC0885&from=EN (accessed on 25 November 2020).
  5. Paris Agreement. Available online: https://ec.europa.eu/clima/policies/international/negotiations/paris_en#:~:text=The%20EU’s%20nationally%20determined%20contribution,by%20the%20end%20of%202018 (accessed on 21 December 2020).
  6. Hydrogen in Steel Production: What is Happening in Europe–Part One. Available online: https://bellona.org/news/climate-change/2021-03-hydrogen-in-steel-production-what-is-happening-in-europe-part-one#bio-9 (accessed on 2 January 2022).
  7. Homann, Q. Hydrogen as a Clean Alternative in the Iron and Steel Industry. Available online: https://www.fchea.org/in-transition/2019/11/25/hydrogen-in-the-iron-and-steel-industry (accessed on 2 January 2022).
  8. Pei, M.; Petäjäniemi, M.; Regnell, A.; Wijk, O. Toward a fossil free future with HYBRIT: Development of iron and steelmaking technology in Sweden and Finland. Metals 2020, 10, 972. [Google Scholar] [CrossRef]
  9. Suopajärvi, H.; Kemppainen, A.; Haapakangas, J.; Fabritius, T. Extensive review of the opportunities to use biomass-based fuels in iron and steelmaking processes. J. Clean. Prod. 2017, 148, 709. [Google Scholar] [CrossRef]
  10. Mousa, E.; Wang, C.; Riesbeck, J.; Larsson, M. Biomass applications in iron and steel industry: An overview of challenges and opportunities. Renew. Sustain. Energy Rev. 2016, 65, 1247–1266. [Google Scholar] [CrossRef]
  11. Mousa, E.A.; Ahmed, H.M.; Viswanathan, N.N.; Larsson, M. Recent trends in ironmaking blast furnace technology to mitigate CO2 emissions: Tuyeres injection. In Ironmaking and Steelmaking Processes: Greenhouse Emissions, Control and Reduction; Cavaliere, P., Ed.; Springer: Cham, Switzerland, 2016; ISBN 978-3-319-39527-2. [Google Scholar]
  12. Wang, C.; Mellin, P.; Lövgren, J.; Nilsson, L.; Yang, W.; Salman, H.; Hultgren, H.; Larsson, M. Biomass as blast furnace injectant–Considering availability, pretreatment and deployment in the Swedish steel industry. Energy Convers. Manag. 2015, 102, 217–226. [Google Scholar] [CrossRef] [Green Version]
  13. Wang, C.; Larsson, M.; Lövgren, J.; Nilsson, L.; Mellin, P.; Yang, W.; Salman, H.; Hultgren, A. Injection of solid biomass products into the blast furnace and its potential effects on an integrated steel plant. Energy Procedia 2014, 61, 2184–2187. [Google Scholar] [CrossRef] [Green Version]
  14. Wijayanta, A.T.; Alam, M.-S.; Nakaso, K.; Fukai, J.; Kunitomo, K.; Shimizu, M. Combustibility of biochar injected into the raceway of a blast furnace. Fuel Process. Technol. 2014, 117, 53–59. [Google Scholar] [CrossRef]
  15. Babich, A.; Senk, D.; Fernandez, M. Charcoal behaviour by its injection into the modern blast furnace. ISIJ Int. 2010, 50, 81–88. [Google Scholar] [CrossRef] [Green Version]
  16. Suopajärvi, H.; Pongrácz, E.; Fabritius, T. The potential of using biomass-based reducing agents in the blast furnace: A review of thermochemical conversion technologies and assessments related to sustainability. Renew. Sustain. Energy Rev. 2013, 25511–25528. [Google Scholar] [CrossRef]
  17. Sieminski, A. Annual Energy Outlook 2015. US Energy Information Administration. 2015. Available online: https://www.eia.gov/pressroom/testimonies/sieminski_04162015.pdf (accessed on 18 February 2022).
  18. De Castro, J.A.; de Mattos, A.G.; da Mota, I.d.O.; Sasaki, Y.; Yagi, J. Analysis of the combined injection of pulverized coal and charcoal into large blast furnaces. J. Mater. Res. Technol. 2013, 2, 308–314. [Google Scholar] [CrossRef] [Green Version]
  19. Feliciano-Bruzual, C. Charcoal injection in blast furnaces (Bio-PCI): CO2 reduction potential and economic prospects. J. Mater. Res. Technol. 2014, 3, 233–243. [Google Scholar] [CrossRef] [Green Version]
  20. Ahmed, H.; Sideris, D.; Björkman, B. Injection of H2-rich carbonaceous materials into the Blast furnace: Devolatilization, gasification and combustion characteristics and effect of increased H2-H2O on iron ore pellets reducibility. J. Mater. Res. Technol. 2020, 9, 16029–16037. [Google Scholar] [CrossRef]
  21. Yang, K.; Choi, S.; Chung, J.; Yagi, J. Numerical modeling of reaction and flow characteristics in a blast furnace with consideration of layered burden. ISIJ Int. 2010, 50, 972–980. [Google Scholar] [CrossRef] [Green Version]
  22. Matsuzaki, S.; Shinotake, A.; Naito, M.; Nishimura, T.; Kunitomo, K.; Sugiyama, T. Development of mathematical model of blast furnace. Nippon Steel Tech. Rep. 2006, 94, 87. [Google Scholar]
  23. Chu, M.S.; Yang, X.F.; Shen, F.M.; Yagi, J.I.; Nogami, H. Numerical Simulation of Innovative Operation of Blast Furnace Based on Multi-Fluid Model. J. Iron Steel Res. Int. 2006, 13, 8–15. [Google Scholar] [CrossRef]
  24. Castro, J.A.; Nogami, H.; Yagi, J. Three-dimensional multiphase mathematical modeling of the blast furnace based on the multifluid model. ISIJ Int. 2002, 42, 44. [Google Scholar] [CrossRef]
  25. Dong, X.F.; Yu, A.B.; Burgess, J.M.; Pinson, D.; Chew, S.; Zulli, P. Modelling of multiphase flow in ironmaking blast furnace. Ind. Eng. Chem. Res. 2009, 48, 214–226. [Google Scholar] [CrossRef]
  26. Abdel Halim, K.S.; Andronov, V.N.; Nasr, M.I. Blast furnace operation with natural gas injection and minimum theoretical flame temperature. Ironmak. Steelmak. 2009, 36, 12–18. [Google Scholar] [CrossRef]
  27. Nogami, H.; Pintowantoro, S.; Yagi, J. Numerical analysis on behavior of unburned char and fine coke in blast furnace. ISIJ Int. 2005, 45, 1489–1495. [Google Scholar] [CrossRef] [Green Version]
  28. Dong, X.; Yu, A.; Yagi, J.; Zulli, P. Modelling of multiphase flow in a blast furnace: Recent developments and future work. ISIJ Int. 2007, 47, 1553–1570. [Google Scholar] [CrossRef] [Green Version]
  29. Maier, C.; Jordan, C.; Harasek, M.E.; Feilmayr, C.; Thaler, C. Investigation of alternative reducing agent injection into the raceway of blast furnaces using CFD. Chem. Eng. Trans. 2013, 35, 1345–1350. [Google Scholar]
  30. Ariyama, T.; Natsui, S.; Kon, T.; Ueda, S.; Kikuchi, S.; Nogami. H. Recent progress on advanced blast furnace mathematical models based on discrete method. ISIJ Int. 2014, 54, 1457–1471. [Google Scholar] [CrossRef] [Green Version]
  31. Ökvist, L.-S.; Lundgren, M. Experiences of bio-coal applications in the blast furnace process—Opportunities and limitations. Minerals 2021, 11, 863. [Google Scholar] [CrossRef]
  32. Feliciano-Bruzual, C.; Mathews, J. BIO-PCI, charcoal injection in blast furnaces: State of the art and economic perspectives. Rev. Metal. 2013, 49, 458–468. [Google Scholar] [CrossRef] [Green Version]
  33. Committee on Reaction within Blast Furnace, Joint Society on Iron and Steel Research, The Iron and Steel Institute of Japan. Blast Furnace Phenomena and Modeling. Elsevier Applied Science: Amsterdam, 1987. Available online: https://link.springer.com/chapter/10.1007/978-94-009-3431-3_1 (accessed on 18 February 2022).
  34. Yagi, J.; Muchi, I. Theoretical estimations on the longitudinal distribution of process variables in blast furnace and on its productivity. Trans. Iron Steel Inst. Jpn. 1970, 10, 392–405. [Google Scholar] [CrossRef] [Green Version]
  35. Roine, A.; Mansikka-Aho, J.; Kotiranta, T.; Björklund, P.; Lamberg, P. HSC Chemistry® v. 6.0; Outotec Research Oy: Pori, Finland, 2006. [Google Scholar]
  36. Bale, C.W.; Pelton, A.D.; Thompson, W.T. Facility for the Analysis of Chemical Thermodynamics (Factsage™ 5.5); École Polytechnique: Montreal, QC, Canada, 2000. [Google Scholar]
  37. Hooey, P.L.; Bodén, A.; Wang, C.; Grip, C.E.; Jansson, B. Design and application of a spreadsheet-based model of the blast furnace factory. ISIJ Int. 2010, 50, 924–930. [Google Scholar] [CrossRef]
  38. Mousa, E.A.; Lundgren, M.; Ökvist, L.S.; From, L.-E.; Robles, A.; Hällsten, S.; Sundelin, B.; Friberg, H.; El-Tawil, A. Reduced carbon consumption and CO2 emission at the blast furnace by use of briquette containing torrefied sawdust. J. Sustain. Metall. 2019, 5, 391–401. [Google Scholar] [CrossRef] [Green Version]
  39. Orre, J.; Ökvist, L.-S.; Bodén, A.; Björkman, B. Understanding of blast furnace performance with biomass introduction. Minerals 2021, 11, 157. [Google Scholar] [CrossRef]
  40. Ökvist, L.S.; Lagerwall, P.; Sundelin, B.; Orre, J.; Brämming, M.; Lundgren, M. Low CO2 ironmaking in the blast furnace. Stahl Eisen 2017, 137, 29–37. [Google Scholar]
  41. Zaini, I.N.; Sophonrat, N.; Sjöblom, K.; Yang, W. Creating values from biomass pyrolysis in Sweden: Co-production of H2, biocarbon and bio-oil. Processes 2021, 9, 415. [Google Scholar] [CrossRef]
  42. Envigas AB. Available online: https://www.envigas.com/ (accessed on 2 January 2022).
Figure 1. Schematic description of the BF model [12].
Sustainability 14 02393 g001
Figure 2. Envigas pilot plant used for the pyrolysis of biomass and biocarbon production.
Sustainability 14 02393 g002
Figure 3. Effect of biochar replacement for PC on the rate of reducing agent.
Sustainability 14 02393 g003
Figure 4. Effect of biochar injection on fossil CO2 emission.
Sustainability 14 02393 g004
Figure 5. Effect of biochar injection on fossil CO2 emission.
Sustainability 14 02393 g005
Figure 6. RAFT and TGT calculated under different conditions of biochar injection.
Sustainability 14 02393 g006
Figure 7. Changing of RAFT and top gas temperature by injection of biochar at fixed O2 enrichment.
Sustainability 14 02393 g007
Figure 8. Optimization of RAFT & top gas temperature for biochar 1 & 2.
Sustainability 14 02393 g008
Table 1. Set-up of parameter settings for MASMOD.
ParameterUnitBFConditions
Feed & production rate
Cokekg/tHM309.0Constant
PCIkg/tHM143.0Varies with injected biochar
Limestonekg/tHM15.7varied to adjust the slag basicity
Pelletskg/tHM1331.5kept constant
LD slagkg/tHM45.1kept constant
Injected dustkg/tHM6.1kept constant
Briquetteskg/tHM102.1kept constant
Production ratetHM/h275.3kept constant
Operating conditions
Eta CO%54.9varied
Eta H2%35.5kept constant as reference
Top gas temp.°C124.0varied
Shaft efficiency%95.1kept constant
Blast temp.°C1076kept constant
TRZT°C850kept constant
O2 in the blast%4.17constant or varied
RAFT°C2161constant or varied
Heat lossesMJ/tHM353.1kept constant
Heat losses distribution%55.2kept constant
Table 2. Designed cases of biochar injection for MASMOD calculations.
Ironmaking BFRef.Biochar
ParameterUnitCase 1Case 2Case 3Case 4Case 5Case 6Case 7
Bio injectionkg/tHM0306090100%100%100%
PC injectionkg/tHM143Varies for constant coke0
O2 enrichment%4.24.24.2VariesVaries
RAFT°C2162VariesVaries2162Varies
Top gas temp°C124VariesVariesVaries124
Table 3. Chemical analysis of PC and biochars.
PCBiochar 1Biochar 2Biochar 3
wt.%, (db)
CaO0.650.910.280.60
MgO0.240.160.050.11
SiO23.840.450.140.30
Al2O31.920.090.030.06
TiO20.060.080.020.05
Na2O0.040.080.030.06
K2O0.140.530.160.35
S0.280.020.010.01
P0.020.030.010.00
Mn0.010.070.020.05
Fe0.610.550.170.37
C81.6779.2093.4089.20
H4.092.201.402.10
O3.857.903.806.00
N2.170.230.230.23
Zn0.000.010.000.01
Pb0.000.030.010.02
Cl0.000.080.020.06
Cr0.020.000.000.00
Moisture0.505.406.4013.10
Ash8.004.201.302.80
HHV_dry basis32.4531.1334.6733.58
LHV_dry basis28.8130.6934.3933.12
Table 4. Replacement grade of PC with biochar.
Type of BiocoalReplacement Ratio_Moisture as ReceivedReplacement Ratio_Moisture Optimized at 0.5%
Biochar 11.041.08
Biochar 21.191.24
Biochar 31.041.16
Table 5. Replacement grade of PC with biochar.
Optimization of RAFT & TGT for Biochar 1 & 2At 4.2% O2 EnrichAt 0% O2 Enrich
Moisture content, %
12.0%8.5%
Table 6. Potential of biochar injection into BF.
Ref.Biochar 3
(100% Replacement of PC)
HM, t/h275.3275.3
Coke, kg/tHM309.0309.0
PCI, kg/tHM143.00.0
Biochar, kg/tHM0.0137.5
Limestone, kg/tHM15.75.8
Slag, kg/tHM168.5154.7
CO2 fossil, kg/tHM1270.5838.2
Annual limestone saved, ton0.023,968
Annual slag saved, ton0.033,155
Annual reduction of CO2, tons0.01,042,227
Annual biochar needed, tons0.0331,575
Publisher’s Note: MDPI stays neutral with regard to jurisdictional claims in published maps and institutional affiliations.