Article

Enhancing Governance Capacity to Ensure a Long-Term Water Supply: The Case of Windhoek, Namibia

by
Flavia Olivieri
1,
Steven Hendrik Andreas Koop
2,3,
Kees Van Leeuwen
2,3 and
Jan Hofman
1,*
1
Water Innovation and Research Centre, Department of Chemical Engineering, University of Bath, Claverton Down, Bath BA2 7AY, UK
2
KWR Water Research Institute, Groningenhaven 7, 3433 PE Nieuwegein, The Netherlands
3
Copernicus Institute of Sustainable Development, Utrecht University, Princetonlaan 8a, 3584 CB Utrecht, The Netherlands
*
Author to whom correspondence should be addressed.
Sustainability 2022, 14(4), 2387; https://doi.org/10.3390/su14042387
Submission received: 7 January 2022 / Revised: 14 February 2022 / Accepted: 15 February 2022 / Published: 19 February 2022
(This article belongs to the Special Issue Water Security and Resilience)

Abstract

:
Windhoek, Namibia, faces water stress, urbanisation, climate change and governance challenges; these issues are constraining water provision and underpinning the urgency to implement an integrated water resource management plan. Windhoek has provided access to water during droughts by relying on multiple water resources including treated wastewater. However, significant infrastructure investments are required to ensure continued water security. Through applying the City Blueprint Approach—an indicator assessment aiming to provide a holistic understanding of water management and governance—we substantiate how Namibia can enhance the capacity to implement legislation, with long-term focus and collaboration with experts and stakeholders.

1. Introduction

One of the major global challenges facing water resource management is working out how to meet water demand in the future [1]. As most of the population growth is centred in urban areas, cities face unprecedented water challenges that require long-term sustainable solutions with strong leadership and governance to establish them [2]. One in four large cities (population >750,000) is water stressed (water use/availability ratio >0.4; [3]). The issues of nearly empty water reservoirs in Melbourne in 2007 and in São Paulo in 2014 and Cape Town’s threat of day zero in 2018 are expected to unfold more frequently and more intensely. The climate impacts on water stress will be experienced in Europe, Southeast Asia and North America, but the strongest impacts will be felt in Africa [4,5].
The combination of climate change, population growth and economic development is projected to lead to 1.0–1.3 billion more people living with overly exploited water conditions in 2050. In these extreme conditions, the total water demand will consistently exceed surface water supply [6]. There will be no other option but to take the following measures: improve water-use efficiency, apply water-reuse practices, reduce or redirect consumption (or do both) and be prepared to manage recurrent periods of water stress emergencies or curtailments. Water stress, particularly in the socio-economic and climatic context of Africa, urges for a coordinated, holistic and anticipatory approach. Due to its arid conditions and socio-economic development, the city of Windhoek (Namibia) is already addressing a level of water stress that many cities will experience in the near future. Hence, the city can provide key insights of the challenges, solutions and contextual factors that are now or will soon become pertinent for many cities on the African continent and beyond. Over 80% of Namibia’s 842,000 square kilometres are desert, arid or semi-arid [7]. Windhoek is the capital of Namibia and is its largest city. The city receives around 370 mm of annual rainfall but experiences up to 3400 mm/y of evapotranspiration. The number of days when temperatures exceed 35 °C have increased; days when the temperature is below 5 °C have decreased since the 1970s [8]. Rainfall has decreased by 20% in the central parts of Namibia, including Windhoek [9]. Infrequent rainfall and the high evapotranspiration rate result in frequent droughts across the country [7]. Furthermore, the current population of Windhoek of 240,000 is growing at a rate of 5% per annum, meaning that the current water consumption of 21 million m3/y is expected to increase [10].

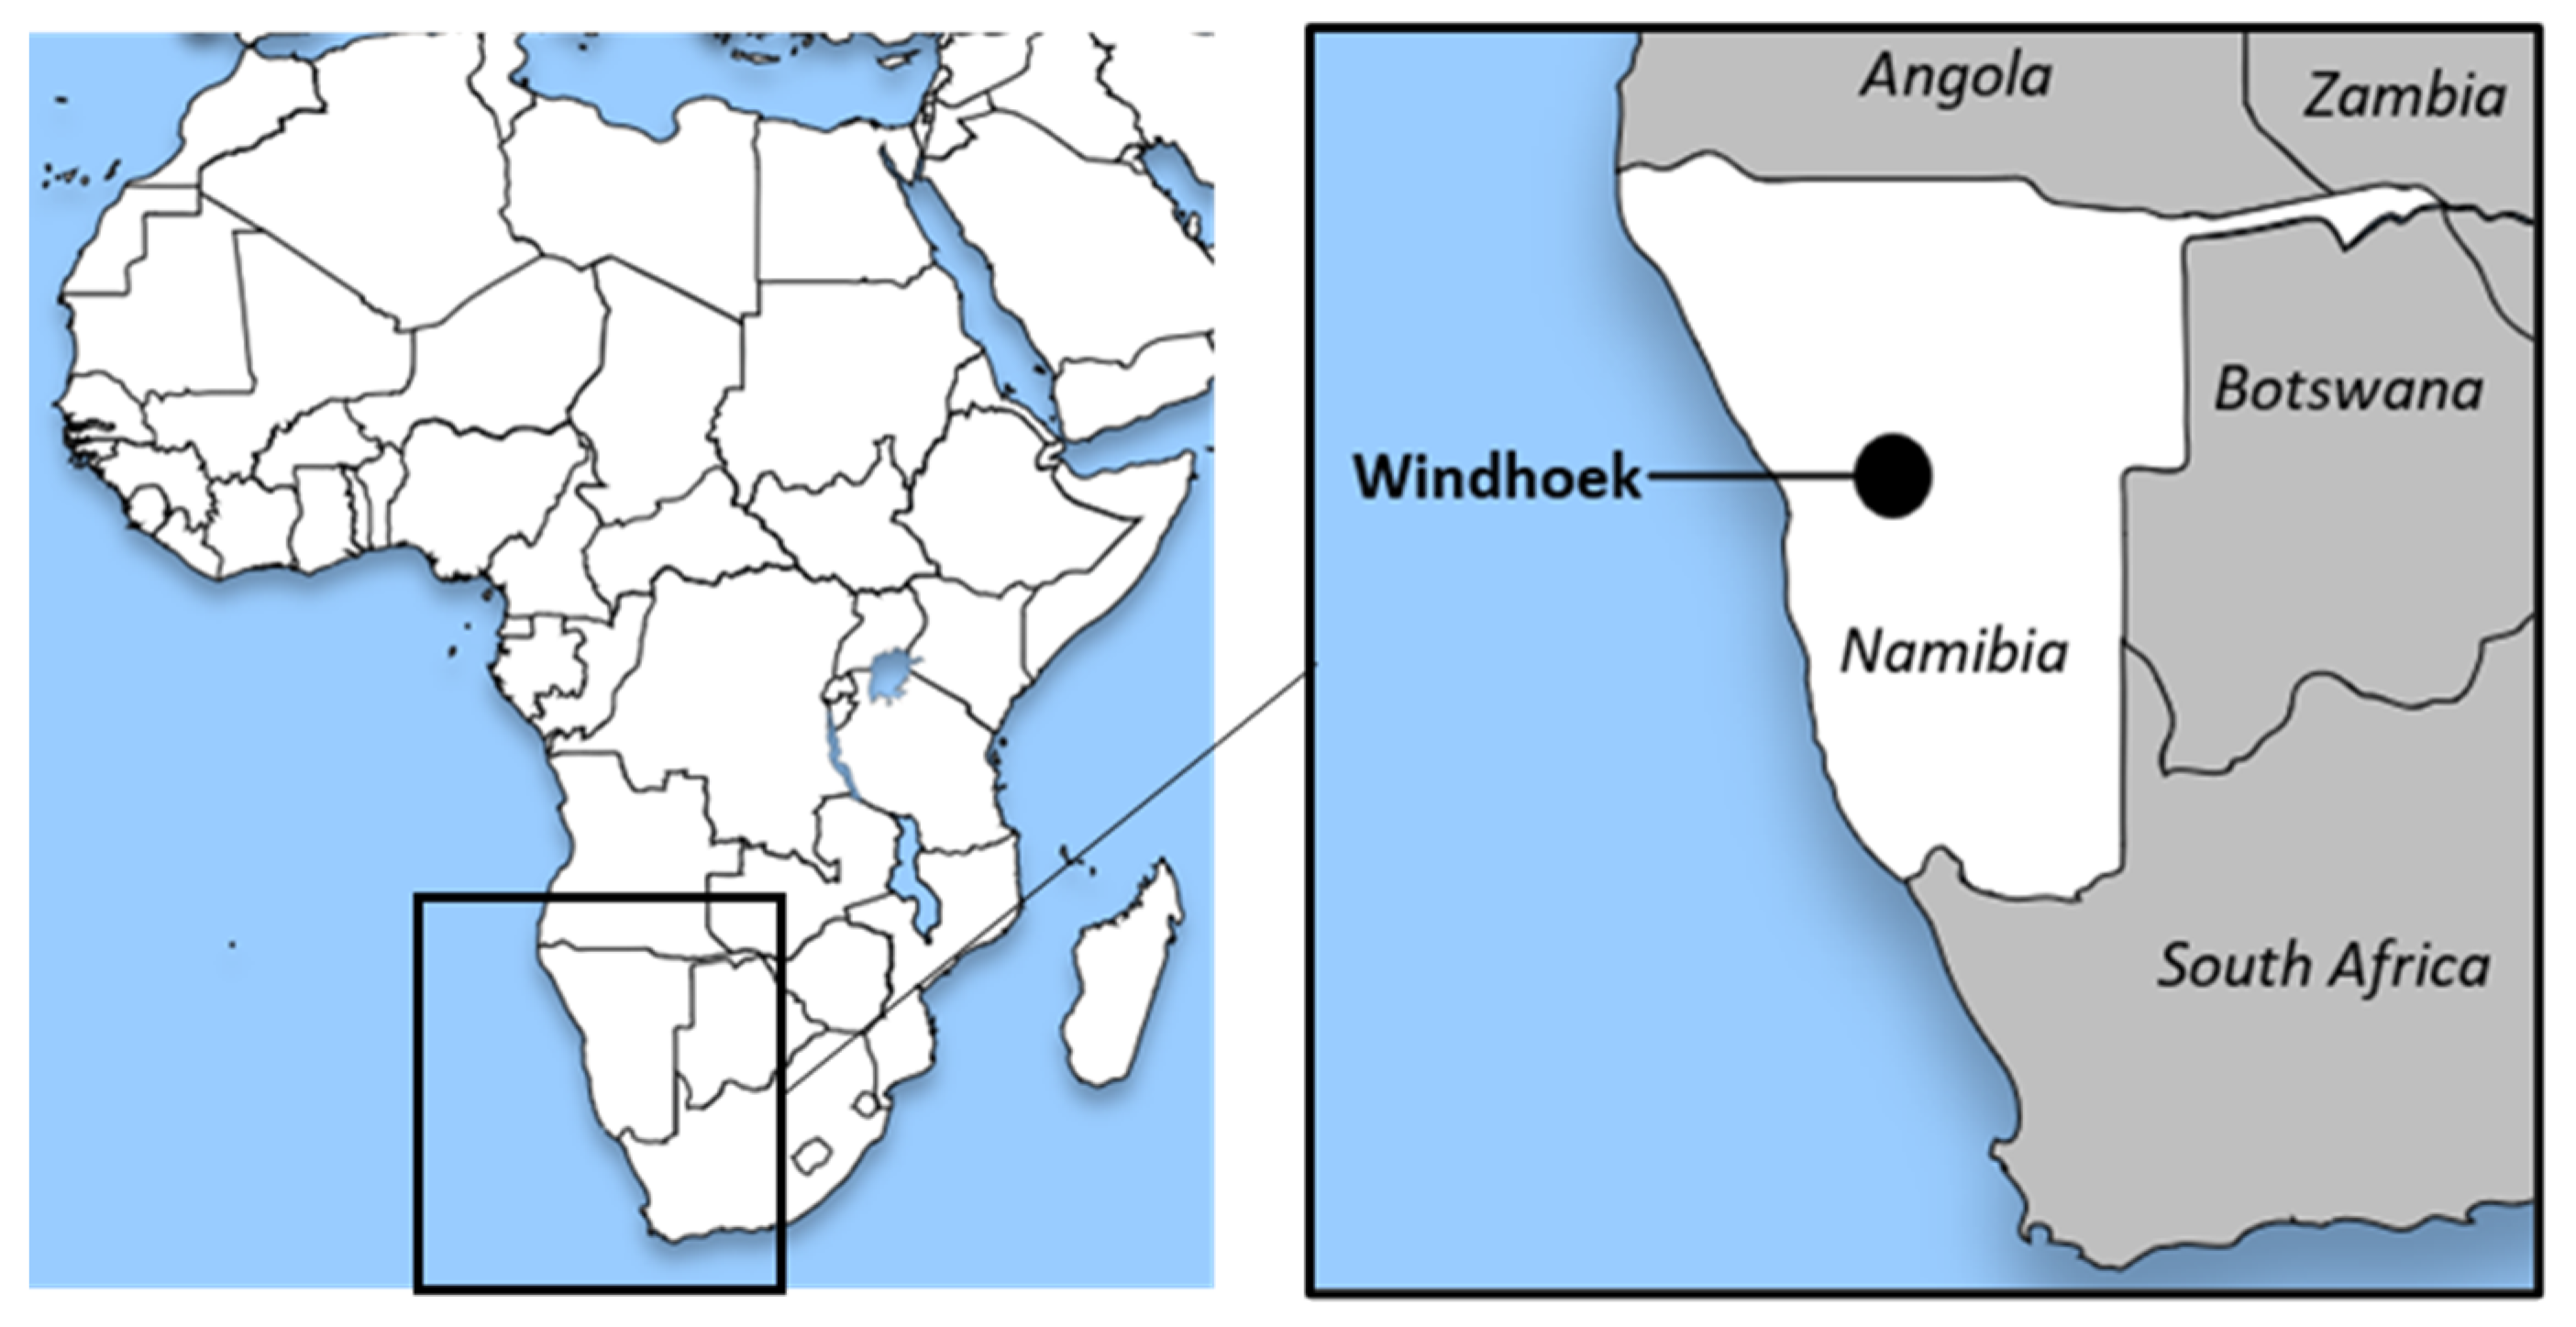
1.1. Water Resources of Windhoek

Windhoek (Figure 1) has three main water supply sources: (1) river water, (2) groundwater and (3) reclaimed wastewater [7]. The Grootfontein-Omatako Eastern National Water Carrier, which feeds into three large, interlinked reservoirs (i.e., the Omatako, Von Bach and Swakoppoort dams) uses surface water from ephemeral rivers and groundwater transferred from aquifers around 450 km north of the city. This has the potential to supply around 95% of the city’s required water [11].
The reclaimed wastewater facility was developed in the 1960s when the city approached the limits of groundwater and surface water sources. This led to the pioneering direct potable reuse of municipal wastewater [2]. This has become a sound drinking water resource, supplying around 25% of the city. It also delivers positive financial benefits compared with other supply alternatives, highlighting its value as a sustainable, long-term water source [10].
The option of artificially recharging the aquifer with 75% surface water and 25% reclaimed wastewater was considered in 1997, as underground storage is better at reducing water loss compared with dam storage [11]. The aquifer’s useful storage capacity is around 90 million m3, or around three times the city’s current water demand; however, a full recharge has been limited by a lack of available resources. Meanwhile, the city is considering other augmentation ideas, for instance, transfer of water from the Okavango River. However, as the river is on a shared border, extracting this water is politically sensitive. Other alternatives, such as desalination, take time and money and have environmental hazards that need to be thoroughly assessed prior to implementation [11].
Despite diversifying its water supply, poor network maintenance caused water losses in the distribution network, and low water prices disincentivised water conservation measures [7,12]. These combined impacts led to the depletion of all potable water resources within 500 km of Windhoek [7].
In a bid to control this, the city implemented specific measures to reduce consumption. In 1993, it installed a dual pipe system that enabled treated sewage effluent to irrigate municipal parks, gardens and sports fields, replacing around 6% of the potable water demand [11]. Despite these efforts, in 1995, Windhoek began to fall short of the demand for drinkable water once again due to a rising population [2]. Block tariffs penalised individuals whose water consumption exceeded 200 L/day, reducing residential water use by 40%, from 201 to 130 L/cap/day between 1994–1999 [7]. Over time, this decrease reached a plateau, despite water rates increasing almost annually [11]. This led to a penalty tariff for households consuming over 50 m3 of water per month, later lowered to 40 m3 per month [11]. Lastly, a progressive water tariff structure was introduced [13], where the price of water increases with the volume used [14]. While this initially helped achieve water savings and consumer changes, these changes eventually levelled off. This was newly addressed in 2015 with a new penalty tariff for individual households consuming over 50 m3 per month [14]. Water tariffs were also increased by 5% in 2019 [15].
Windhoek also implemented technical measures such as leakage control, leading to a systematic pipe replacement system that reduced water supply losses from 18% (1997–1998) to 13% (2001–2002) [16]. Regulations against pollution base themselves on the “polluter pays” principle, whereby the polluter pays to repair the damage [17]. The regulations also make provisions for a new groundwater protection land zone, close to which no potentially polluting business or industry can be built [11]. Lastly, Windhoek has established a public awareness campaign on reducing water use and overcoming the psychological barriers to the wastewater reclamation plant [7].

1.2. Water Governance Challenges of Windhoek

In Windhoek, the needed development of long-term strategic plans is hindered by economic, political and social issues [11]. Governance plays a key role in urban water management performance [18]. Studies have shown that Windhoek’s council features few staff members with technical water-related expertise [11]; a lot of the experienced staff moved to the private sector due to more attractive benefits, creating an imbalance of skills that hinders adequate water management [19]. The top-down approaches used to manage the resources have limited stakeholder involvement, aggravated by the absence of platforms through which stakeholders and water experts can engage with the government: solutions may exist, but they are not effectively communicated to the individuals that are responsible for enacting them [20]. As a result, the current communication and coordination strategy needs to be revisited and alternative systems of cooperation must be established [11].
Namibia’s national budget has prioritised transport, military and educational services over water and sanitation [21]. Consequently, the water sector is constantly challenged with a lack of finances for capital investments in new projects as well as the maintenance of existing structures. This has resulted in obsolete water infrastructure, leading to leakage rates in municipal water infrastructure of between 31–110 L/day/household [11]. It is stated that the annual savings that could be achieved with proper maintenance of water infrastructure are up to NAD 5.8 million (approximately USD 390,000) [11], which suggests that the council needs to address maintenance as part of a sustainable water supply strategy and as a means to retain more finances for future developments.

1.3. The Challenges of Water Security in Windhoek

Although the rapidly growing city of Windhoek may continue outgrowing its resources, urban areas also act as the solution to water challenges: their fast pace of development increases the likelihood of adopting novel technologies, which may eventually build up resilience to these stressors. However, potentially adaptive urban water infrastructure needs to be combined with a detailed understanding of water quality and quantity [1]. Long-term policies aimed at protecting water supplies are mostly in place but only partly implemented or operated [22]. It is assumed that overcoming this issue will provide resilience during climate-induced disruptions [1].

1.4. Aim of the Study
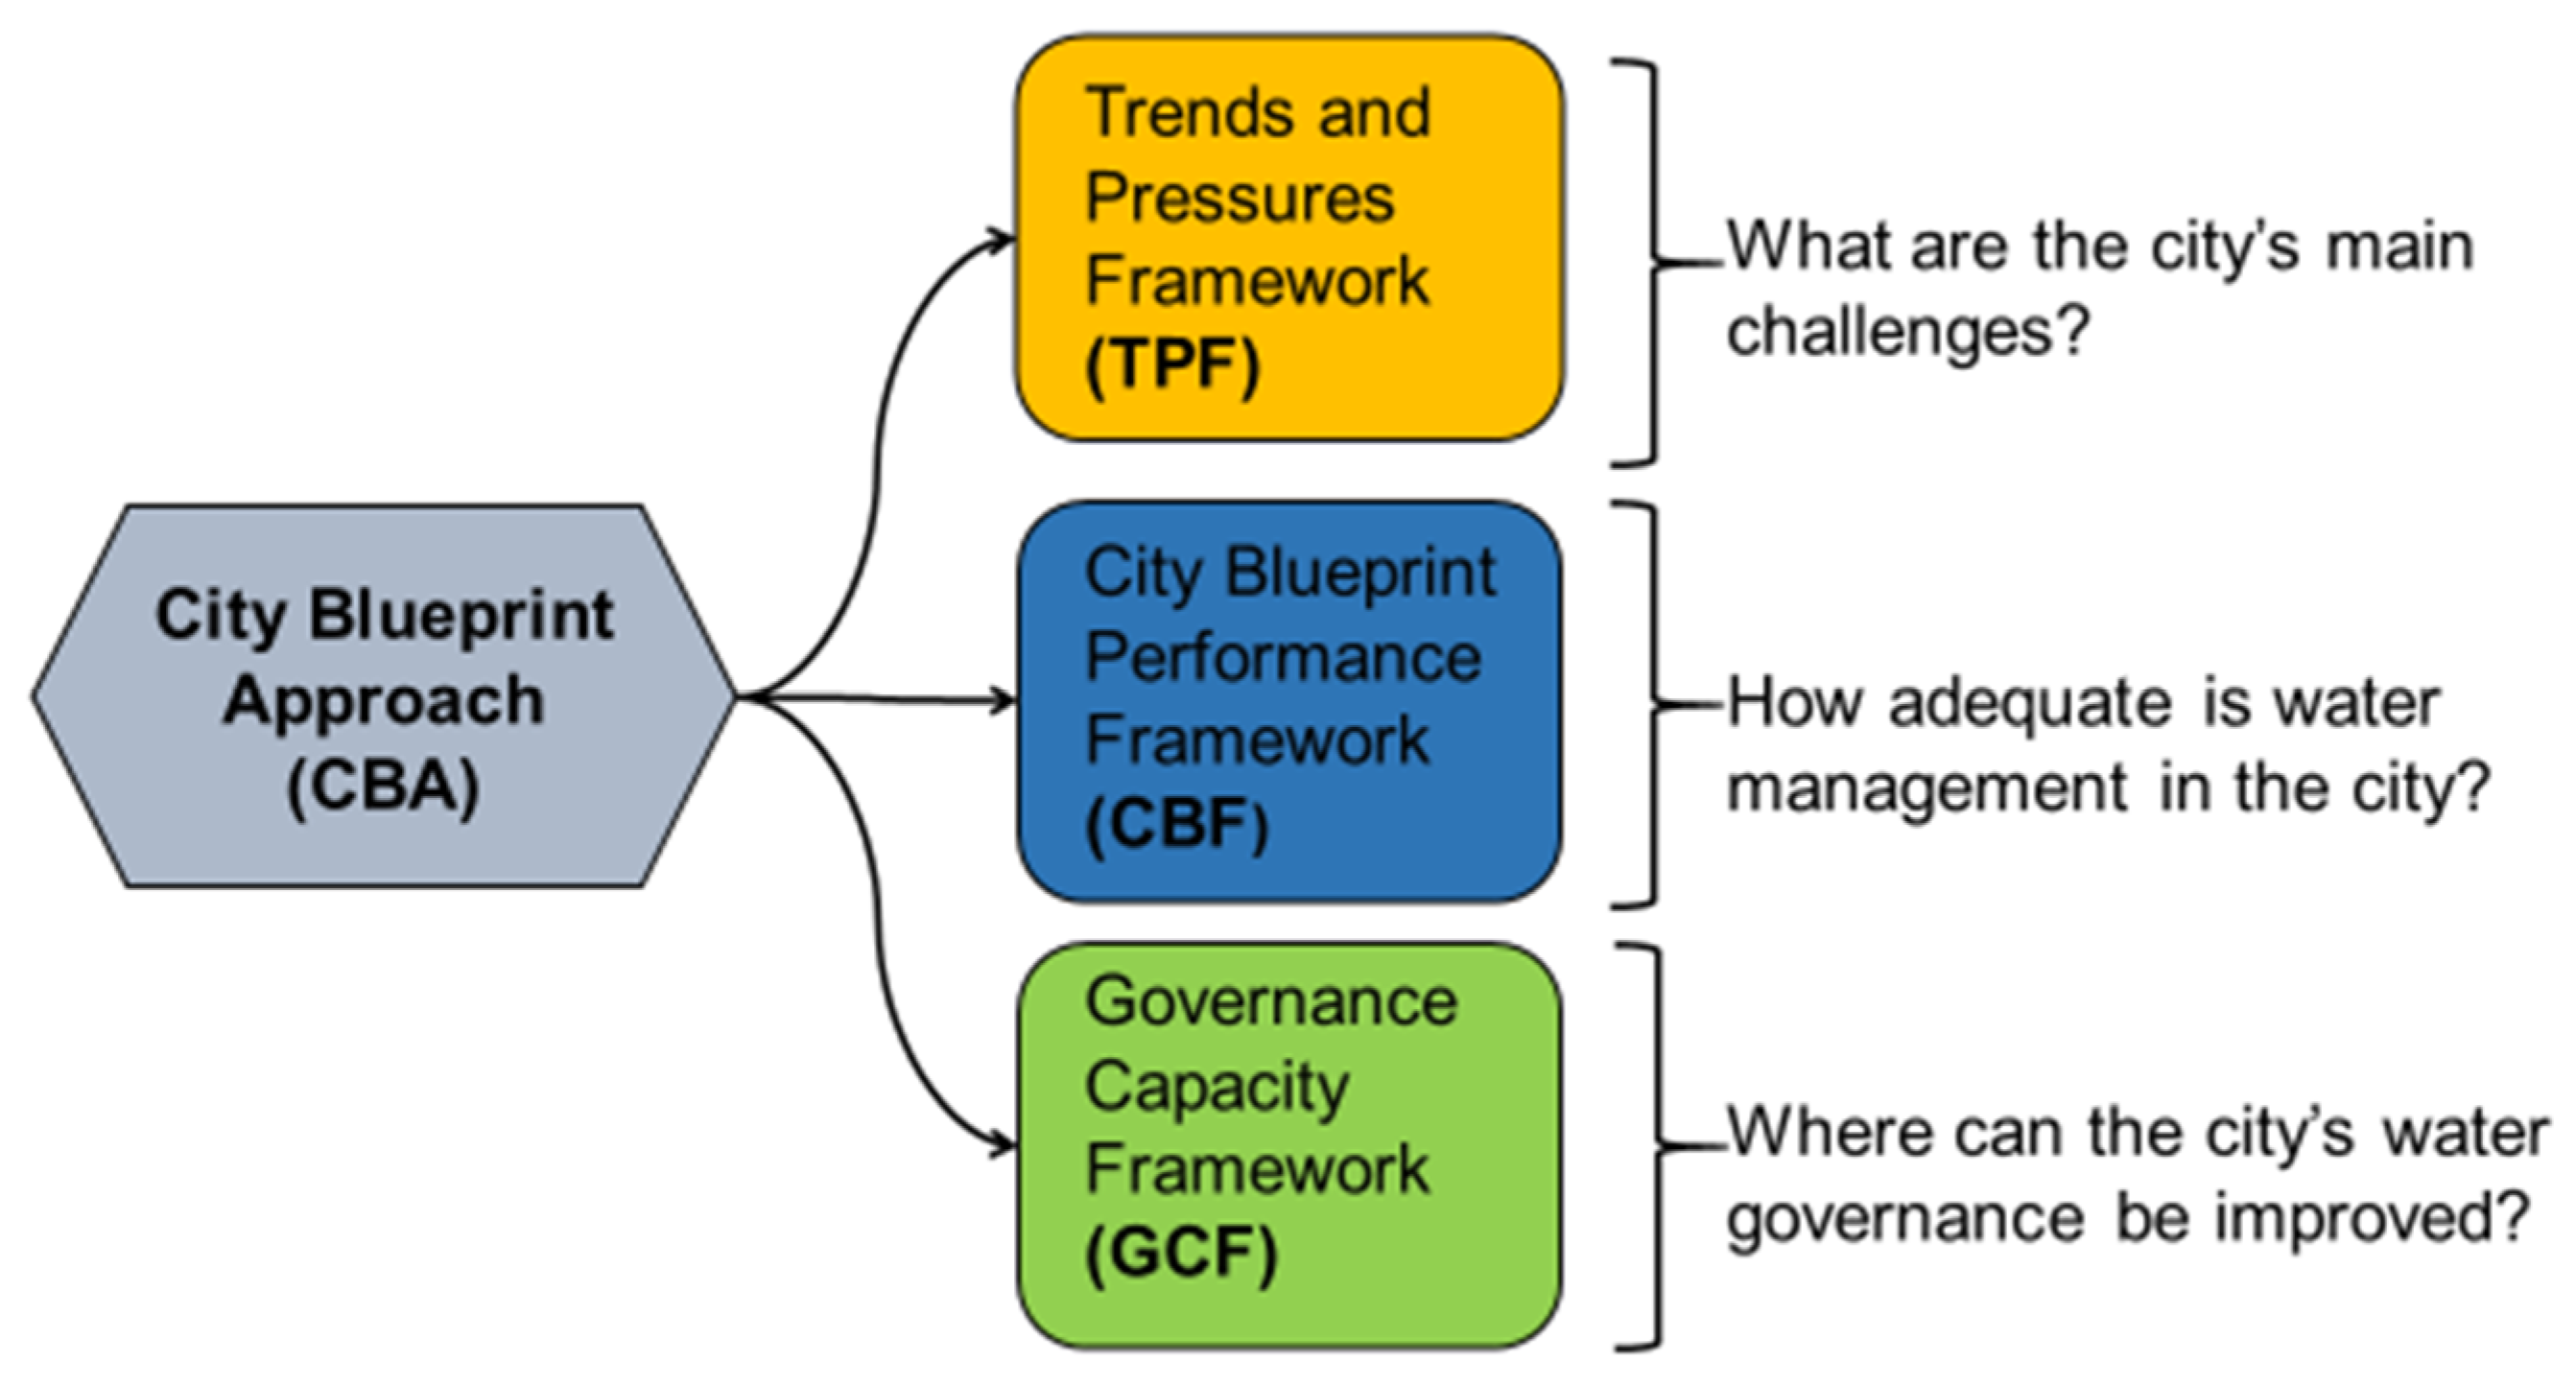
In the field of urban water governance, there is a need for a clear empirical-based frame of reference that will enable people to overcome knowledge fragmentation and will thereby enable meaningful science-policy interaction that can facilitate cities to better govern water-related challenges. As urban challenges relating to water, waste and climate change are by nature multi-disciplinary and the decisions and policies made affect many stakeholders, they also require a comprehensive assessment approach which provides a frame for broad understanding.
The City Blueprint Approach (CBA) is a systematic method used to evaluate water systems in an integrated and diagnostic manner [1,23,24,25,26,27,28,29]. This paper reflects on (a) the potential the CBA may have to address the aforementioned challenges and on (b) the potential to facilitate joint knowledge production by evaluating the process through which the approach has been implemented [23].
To do so, we assess features related to its content and to the process through which the approach is applied. Regarding its content, the CBA is a systematic and standardised urban water governance assessment framework. It consists of three complementary frameworks. First, the Trends and Pressures Framework (TPF) identifies the city’s main social, environmental and financial challenges that may affect water management. Second, the City Blueprint performance Framework (CBF) identifies the current state of integrated water management ranging from drinking water, infrastructure, wastewater treatment and climate adaptation to water scarcity, extreme rainfall and urban heat islands. Finally, the Governance Capacity Framework (GCF) analyses the main barriers and opportunities for cities to increase their capacity to govern specific water challenges that require effective collaboration between different institutions. The CBA also has related processes of knowledge integration created by researchers in collaboration with stakeholders, which together may constitute an adequate science-policy interface for strengthening water governance capacity in cities.
The first two frameworks, the TPF and CBF, have currently been applied in 135 cities globally, including seventeen cities in Africa. They consist of a structured and easy-to-understand methodology, providing a transparent baseline assessment method for Integrated Water Resources Management (IWRM), whilst the assessment results database provides a benchmark. Based on this, cities and decision-makers can strategically form action plans to manage water resources in a sustainable and integrated manner, while learning from best practices in other cities [1]. In this way, the City Blueprint Approach provides the scientific foundation that can inform policy changes [26]. The standardised nature of the methodology enables city-to-city learning, which enhances the global transition towards improved urban water management [1]. Therefore, this assessment can provide answers to the more methodological questions (a) and (b) that are given above. The thorough, detailed assessment of IWRM in Windhoek achieved by applying the CBA can also provide (c) a comprehensive understanding of how Namibia can enhance its capacity to address its water security challenges through inclusive and long-term policy implementation.
The following sections respectively outline the methodology and results from surveys and literature study. Then the policy implications and the necessity for further research that this study illuminates are discussed. Overall, the evaluation will focus on the methodological questions and the multi-faceted challenges Windhoek faces, and how it currently addresses them. We end with the key conclusions.

2. Methodology

2.1. Water Management Performance Assessment

The City Blueprint Approach comprises three complementary frameworks [27,28,29]: The Trends and Pressures Framework (TPF), the City Blueprint performance Framework (CBF) and the Governance Capacity Framework (GCF) as shown in Figure 2. The approach is comprehensive and consistently applied in dozens of cities across the globe to identify capacity development priorities for addressing water-related challenges. This level of standardisation, reproducibility and the method’s empirically oriented approach fits the assessment of complex urban water-related challenges, such as that in Windhoek, particularly well.
The TPF collates the main social, environmental, financial and governance settings in which water managers operate and the resulting pressures that may impede successful water management. This analysis consists of 24 indicators scored 0 (low pressure) to 10 (high pressure). The CBF includes 24 performance indicators scored zero (low performance) to 10 (high performance) that are divided over seven broad categories covering the entire urban water cycle: (i) basic water services, (ii) water quality, (iii) wastewater treatment, (iv) water infrastructure, (v) solid waste, (vi) climate adaptation and (vii) plans and actions. This analysis provides an integrated overview of the current urban management performances from a technical perspective. The Blue City Index (BCI), the geometric mean of the 24 performance indicator scores, is the overarching score for this part of the analysis [28]. The TPF and CBF result in an easy to understand and comprehensive assessment of a city’s water management performance. For Windhoek, data for the TPF and CBF analyses was mainly obtained from verifiable sources, such as online academic literature, government documents and open-access studies. The limited volume of studies on water systems in Windhoek means that some data were also obtained by interviewing municipal staff of the City of Windhoek.

2.2. Water Governance Assessment

Ineffective governance may be the biggest obstacle in the way of the sustainable management of water resources [24,25]. This highlights the value of integrating a comprehensive account of water systems with the understanding of how they are being governed, leading to the GCF analysis.
The GCF identifies gaps between awareness, desire for change and subsequent implementation, providing a holistic overview of the governance of a city’s water services [23]. Each of the frameworks’ 27 indicators shown in Table 1 has a pre-defined question and a Likert-type scoring system ranging from very encouraging for (++) to very limiting to (− −) the overall governance capacity. This will help to source the opportunities for the improvement of local governance, which are crucial for establishing a sustainable water supply in cities (Supplementary Materials).
Primary and secondary data, mainly of qualitative nature, were required for the GCF. A comprehensive desk study provided the first level of understanding of water management systems in Windhoek. There is a paucity of high-level studies on Windhoek’s water systems, meaning that the literature search needed to be substantiated with primary data. Attaining this resulted in the involvement of stakeholders via semi-structured interviews.
A standardised matrix has been applied for the stakeholder analysis. The matrix divides the stakeholders’ roles and responsibilities into four categories based on their importance (priority given to satisfying needs and interests of stakeholder) and influence (power of stakeholder to impact a policy). From each category, at least one stakeholder as well as all of the identified ‘key players’ (i.e., high importance and high influence) were selected. This resulted in individuals being recruited across the water sector, from the universities of Namibia, NamWater, the Municipality of Windhoek and private companies. This approach is hypothesised to result in a comprehensive and unbiased perspective. A total of 35 stakeholders were contacted (anonymised, named ‘S-number’ in the results and discussion sections) online via email and by phone calls through local liaisons. From this, 17 interviews were arranged via online platforms, and one additional interview was conducted in writing. The data collection period ran from June to mid-August 2020. Once an interview was confirmed, background research on the interviewee and his or her post allowed the selection of the most relevant indicators. In addition, the pre-defined GCF questions were rephrased so that they were more memorable during the interview (Supplementary Materials). A total of ten indicators were prepared for each stakeholder. Nevertheless, the interviewees were not constrained or timed, creating a semi-structured interview allowing for each expert to fully elaborate on their perspective.
Interviews were conducted on online platforms and lasted an hour. All participants agreed to be recorded, which allowed for a detailed, individual interview transcript to be produced and sent back to each stakeholder. This gave them the opportunity to ensure that the paraphrased information was correct, as well as to add any more information where needed or relevant. Eight interviewees responded to this, of which five gave additional feedback.

3. Results

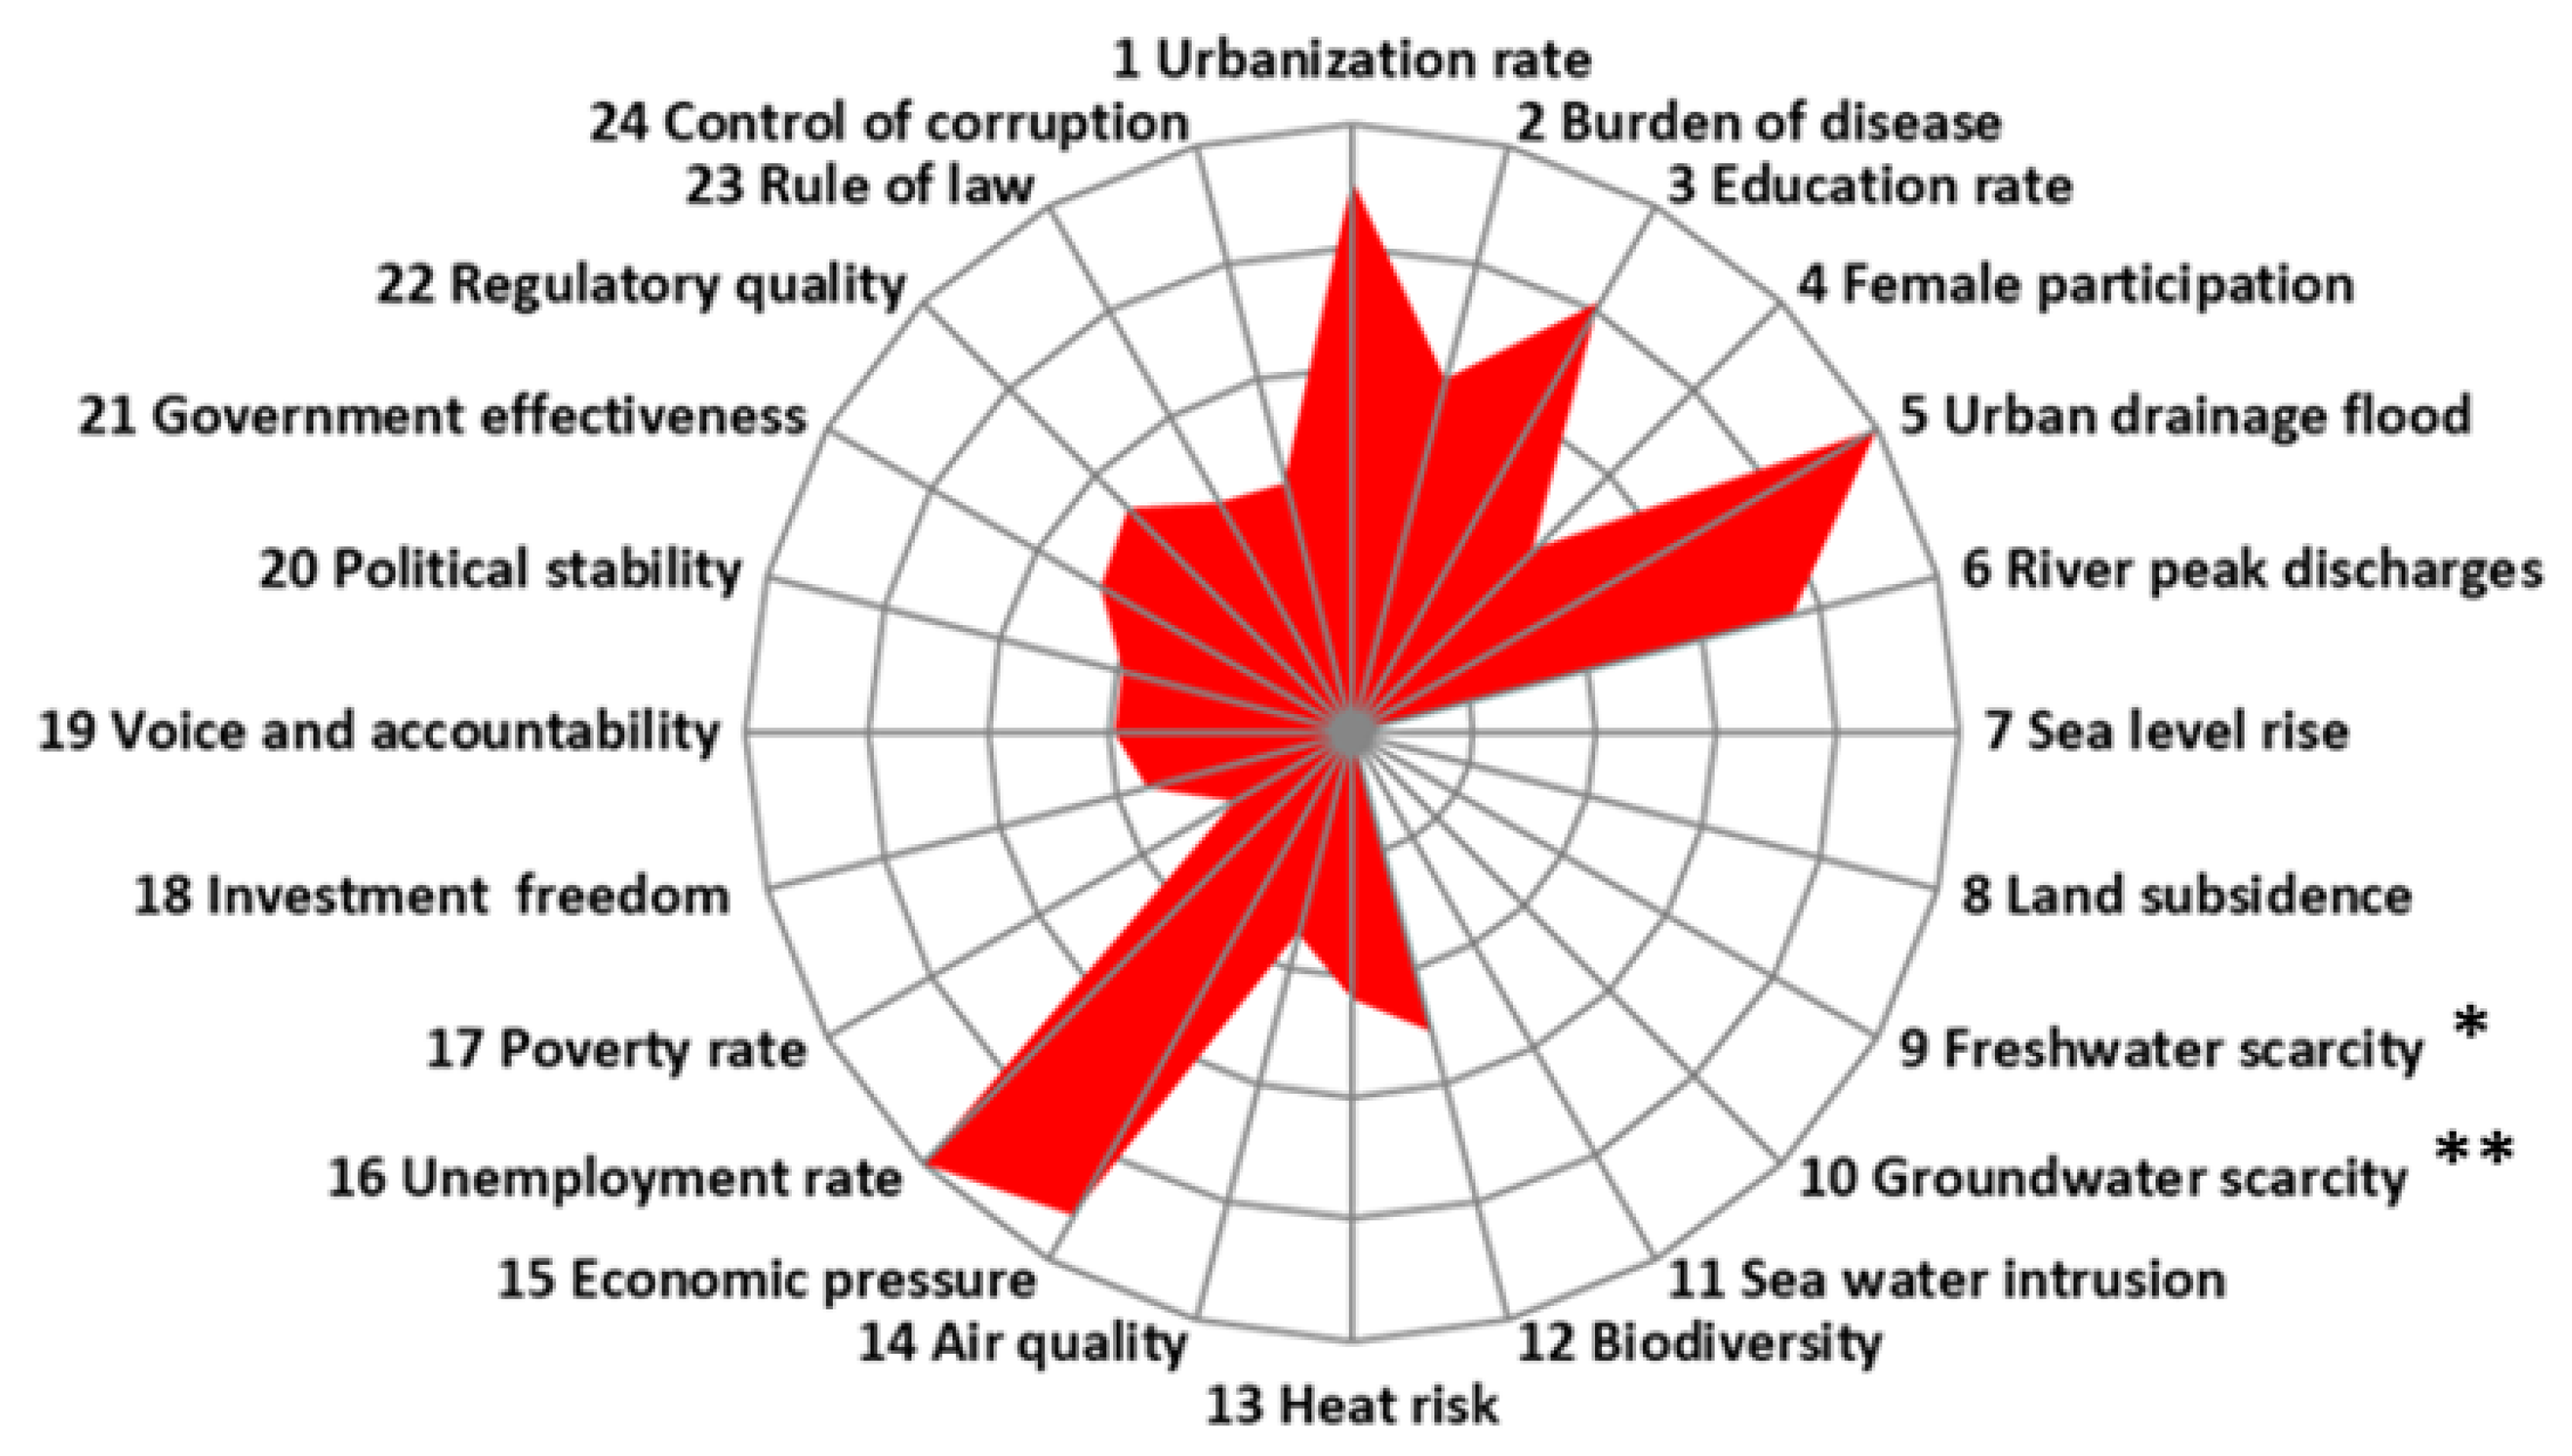
3.1. Trends and Pressures Framework

The average score of the TPF indicators was 4.6. Unemployment (Indicator 16) and urban drainage flood (Indicator 5) are the highest-ranking indicators, both achieving 10 points (Figure 3), meaning that they create a strong societal pressure. Sea level rise (Indicator 7) and land subsidence (Indicator 8) are not relevant for Windhoek and therefore have a 0-score. Issues such as female participation (Indicator 4), political instability (Indicator 20), heat risk (Indicator 13), investment freedom (Indicator 18), accountability (Indicator 19), corruption (Indicator 24) and rule of law (Indicator 23) all scored poorly, all of which impact the already precarious water resources. Freshwater scarcity (Indicator 9) scores low because, although Namibia is a water scarce country, hardly any of the limited resources are exploited. For groundwater scarcity (Indicator 10) this is also the case. Therefore, the latter two indicators score counter-intuitive and should be interpreted with care.

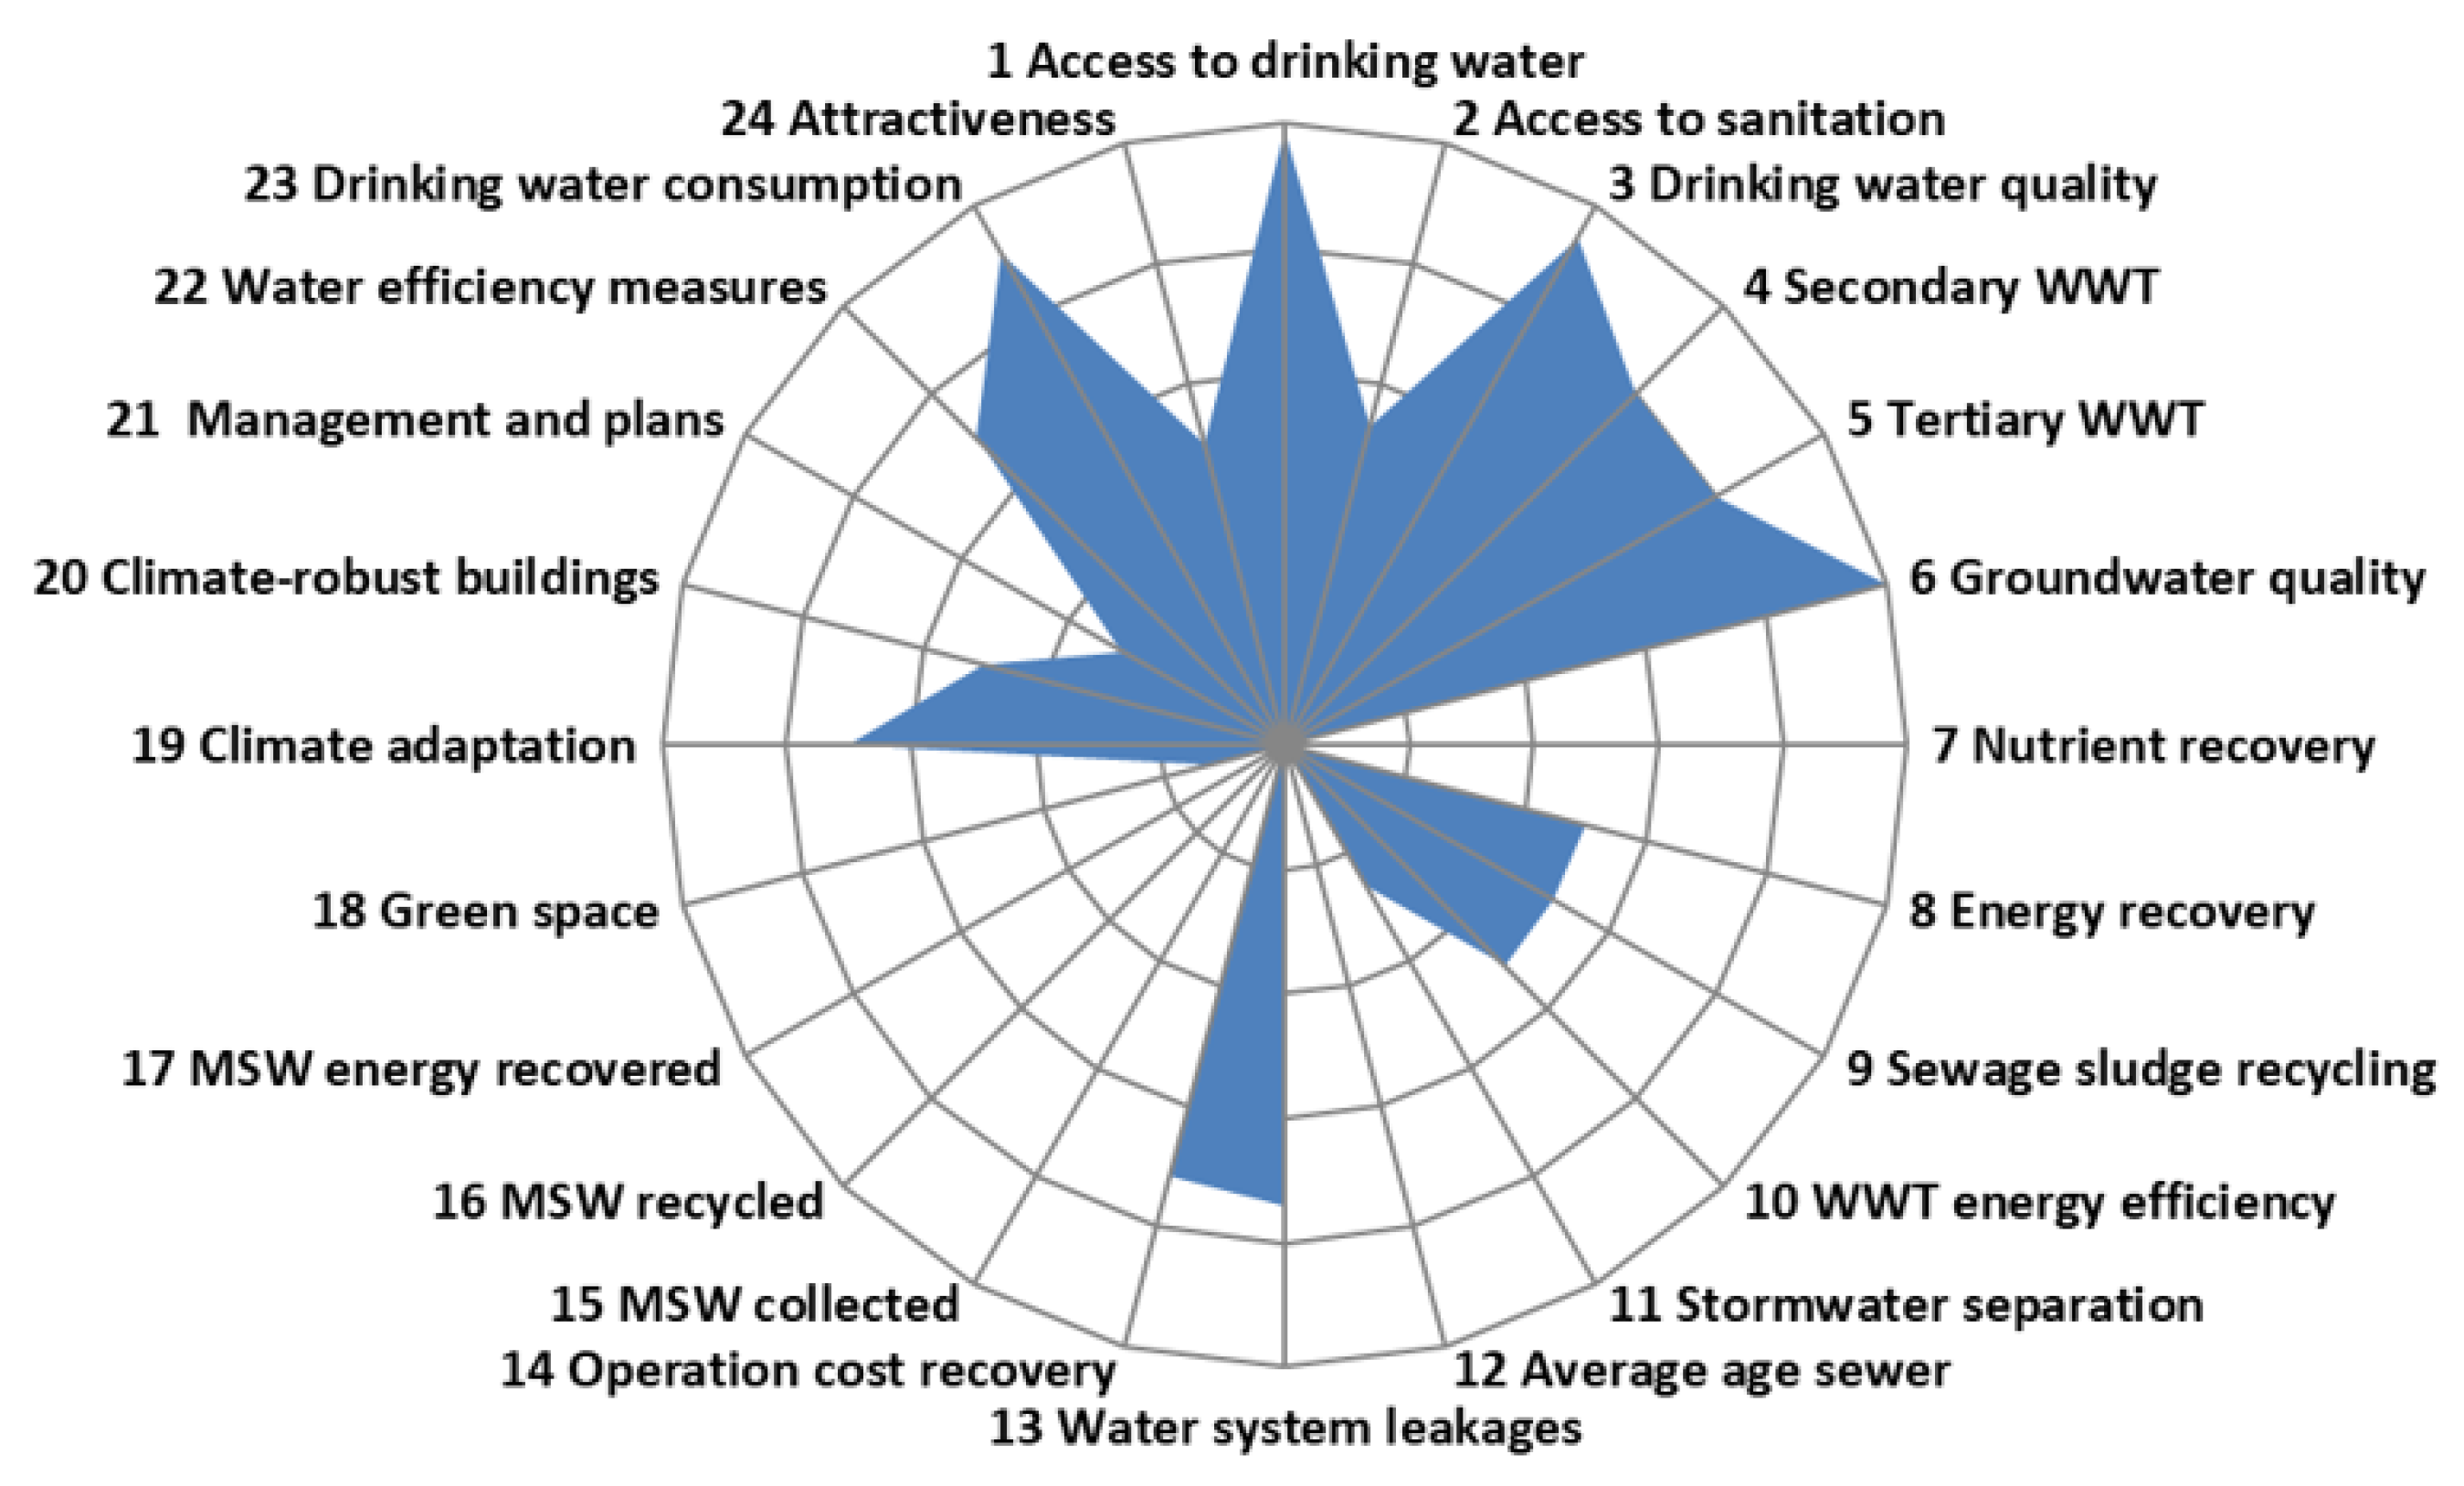
3.2. City Blueprint Framework

The results for the City Blueprint scoring are shown in Figure 4. The overall geometric mean, the BCI value for Windhoek, is 3.6. The highest-ranking score was groundwater quality (Indicator 6), which achieved a 10, closely followed by access to drinking water (Indicator 1) that scored 9.9. Multiple indicators gained a score of zero, suggesting that water infrastructure needs to be upgraded in Windhoek.

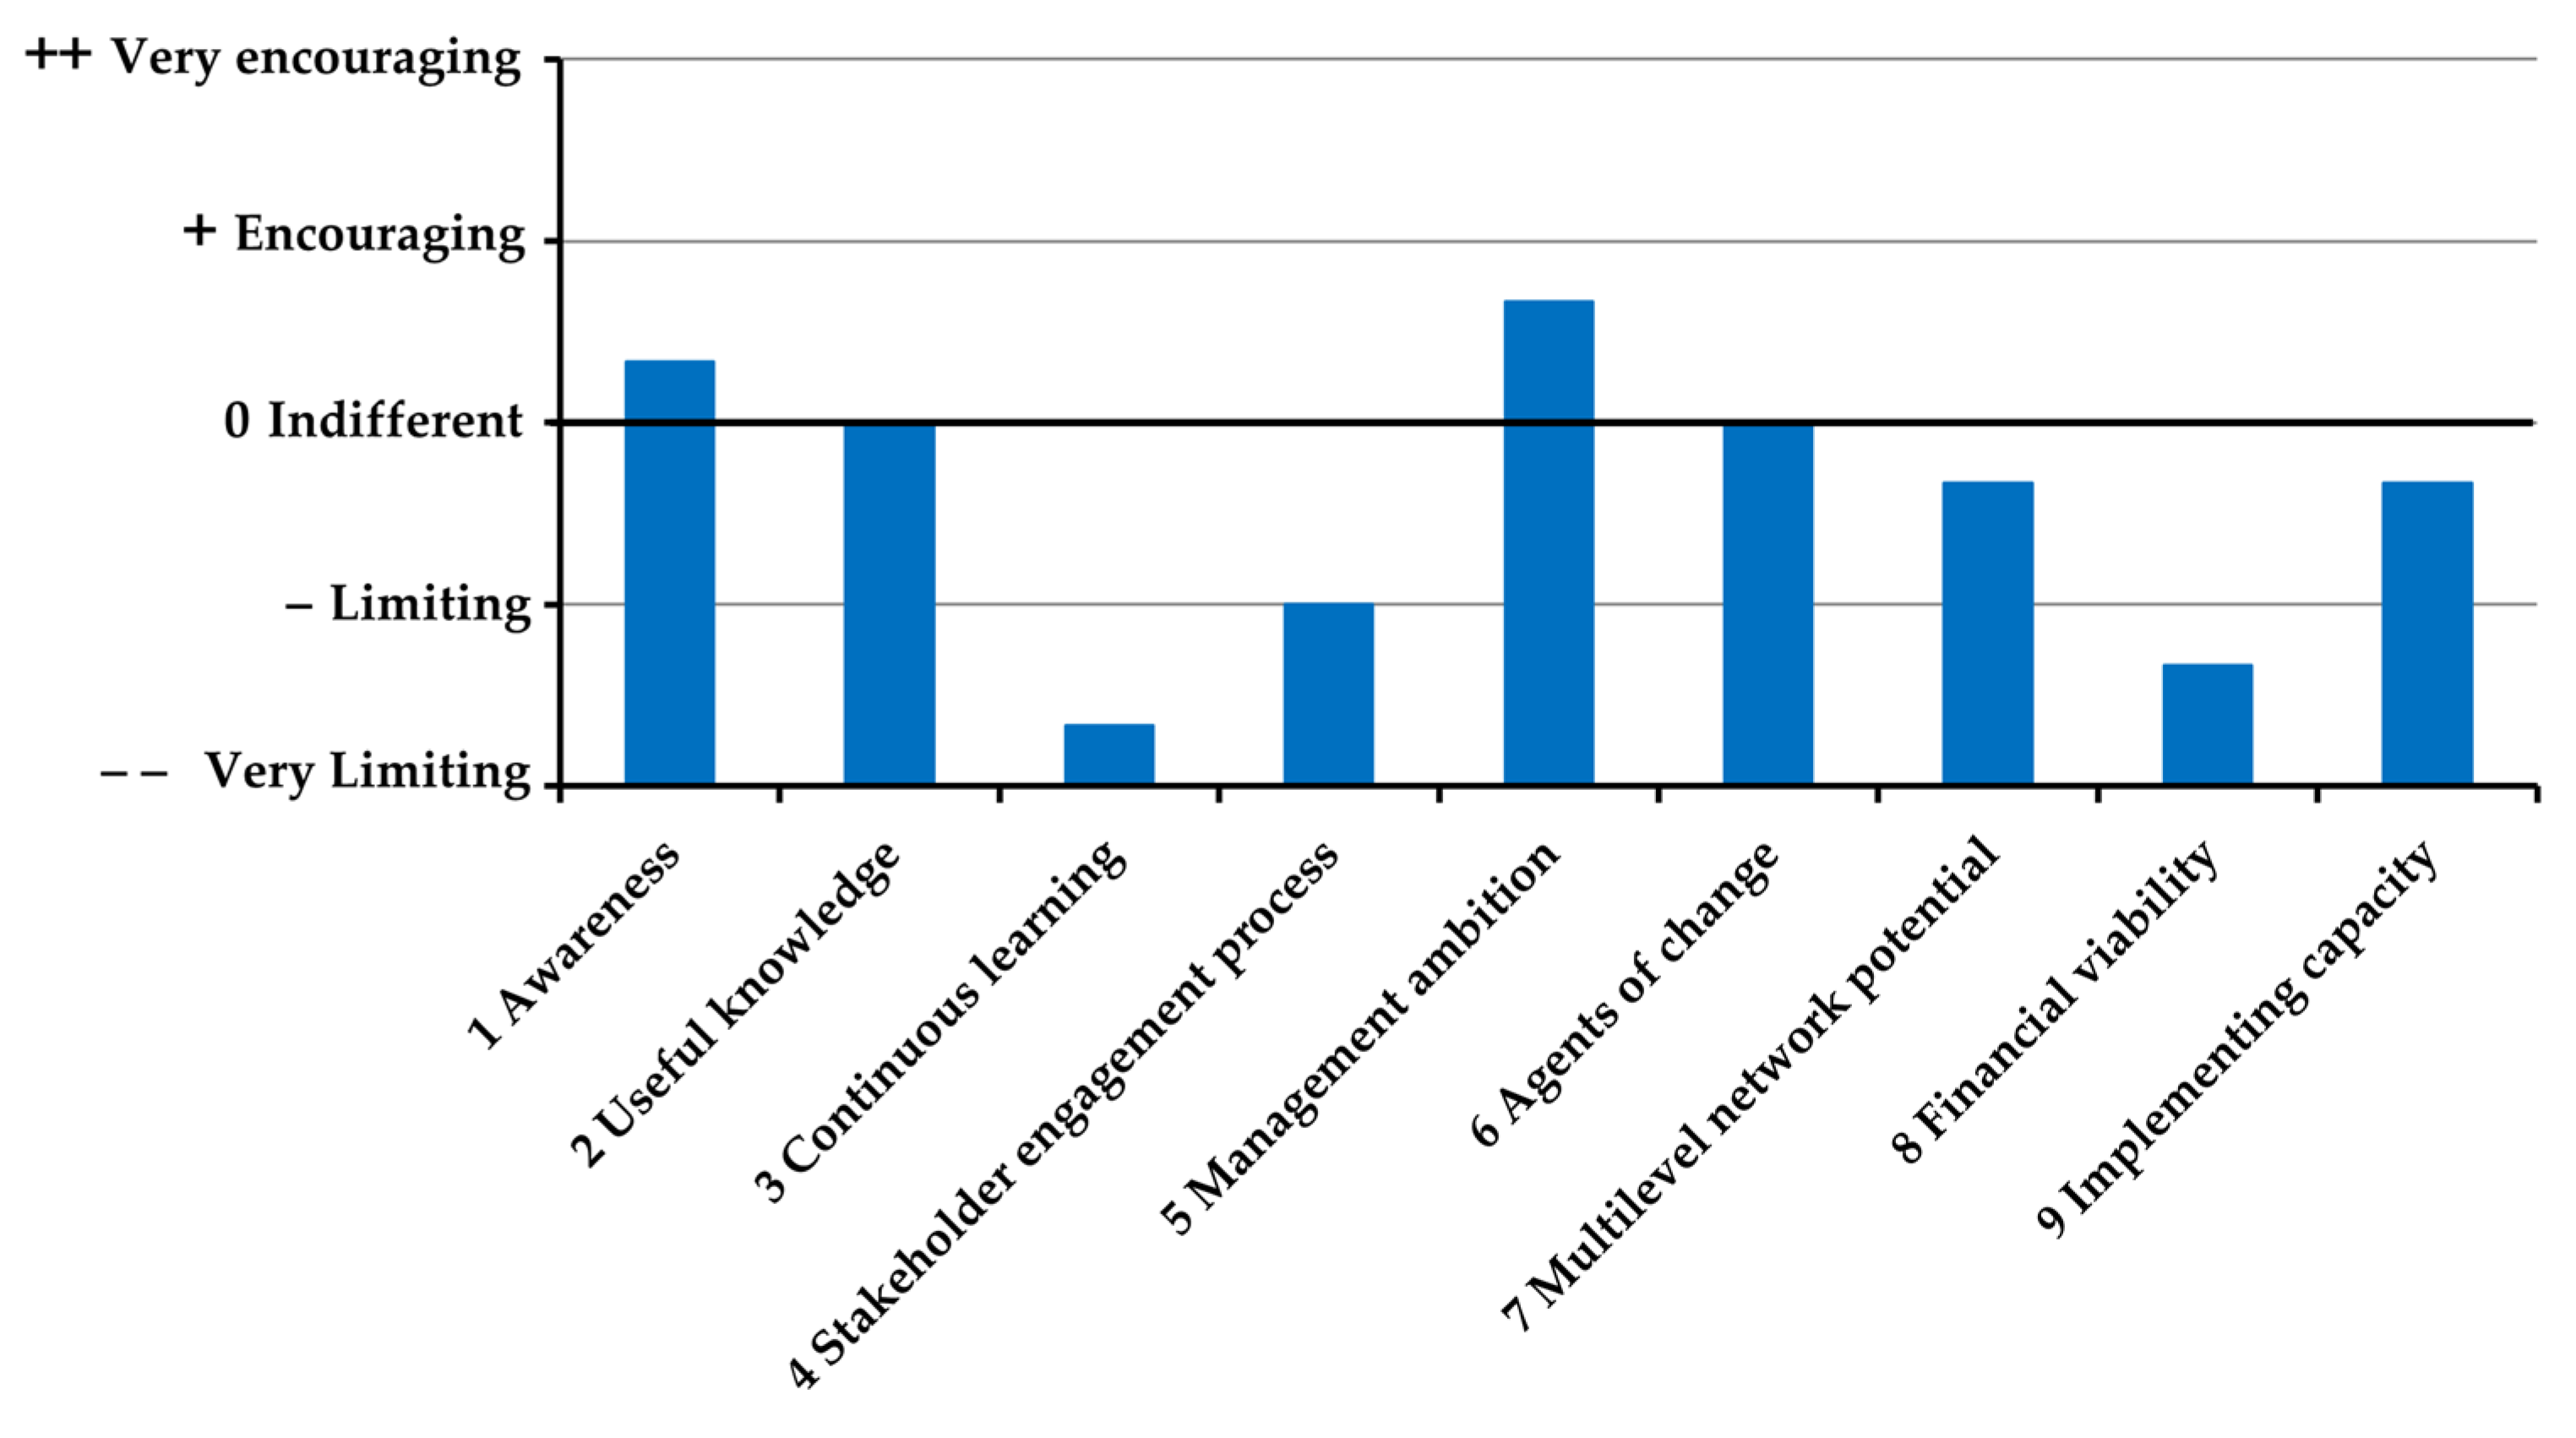
3.3. Governance Capacity Analysis

The Governance Capacity Assessment identified several governance issues, within the context of water supply security. There were minor discrepancies amongst stakeholders. The average scores for nine categories are found in Figure 5. Details of the scoring can be found in the Supplementary Materials. For privacy purposes, the stakeholders are referred to as “S1–18”. Below we give a more detailed overview for the dimensions Knowing, Wanting and Enabling.
The average score for Awareness is just above ‘0′ (Figure 5). Windhoek’s community is aware of the water security risks that exist because of frequent droughts, the arid nature of the country and climate change (Indicator 1.1: 0). Behavioural changes are encouraged via priming methods (S6), weekly bulletins and monthly newsletters (S2 and S18) and school interventions (S18). Nevertheless, the degree of internalisation of water conservation behaviour varies across the community (Indicator 1.3: +; S2). During drought periods, people are reported to talk of “Day Zero” and collaboratively work to reduce water consumption (S2). However, this sense of urgency is discontinued once drought periods are over (Indicator 1.2: +; S5). Beyond this awareness of water security risks, there is little understanding of which technologies and methods are best suited to produce clean water (S3, S8 and S9). The awareness of the water security issue is not matched with appropriate municipal responses. For example, pipe bursts are not immediately dealt with (S3 and S4), despite the community being active in calling “hotlines” or communicating on Neighbourhood Watch groups (S4 and S12).
The average score for Useful Knowledge is a ‘0′. A comprehensive set of academic literature looks at Windhoek’s water resource, water systems and the challenges these face [10], but timely data is lacking on the quality of water (Indicator 2.1: 0) [30]. Information mainly focuses on drought risks (S3 and S17), although it is unclear whether it is matched with updated, reliable and complete technical data (Indicator 2.2: +). Research does not address on-ground requirements (S2, S15 and S17). There needs to be a data bank where all of the water-related knowledge can be placed, as this is only available for those who actively research information (Indicator 2.3: −; S10 and S15).
The average score for Continuous Learning is the lowest across the entire questionnaire, almost at ‘– –’. Windhoek employs a range of monitoring methods, although this is not in real-time (S3 and S10) and may often be based on estimates [31]. Fully integrated and automatic systems measure water flows at stations along the water network (S12), which helps identify major pipe bursts (S12). Rain and drought periods occur in regular and reliable cycles, which makes forecasting drought events a possibility (Indicator 3.1: 0; S16). Collaborations with neighbouring countries allow for Zambezi River flood forecasting to be made up to two weeks in advance (S12). None of these advanced warning systems are coupled with a risk management strategy (S12), and monitoring mainly occurs ad hoc or in isolation, which reflects a low degree of stakeholder involvement (Indicator 3.2: − −): there is a closed attitude to this and interaction between stakeholders occurs on a case-by-case basis (S7, S10, S12, S14 and S15). The few efforts made to involve more stakeholders are either inconsequential (S14 and S15) or include only a small group of stakeholders (Indicator 3.3: − −; S5, S7, S12, S14 and S15;).
The Stakeholder Engagement Process gained a ‘−’ score, limiting the overall capacity to secure long-term water provision. The water sector is monopolised (Indicator 4.1: −): the Ministry of Agriculture, Water and Land Reform (MAWLR) protects the water resource, and the parastatal NamWater distributes water in bulk to local authorities, such as the City of Windhoek, which in turn distributes the water in the city (S5, S7 and S16). There is cooperation between these entities; beyond this, stakeholder participation is treated as a “checkbox” exercise (S13, S14 and S15). According to a minority, stakeholder mapping is conducted to ensure widespread involvement. However, the latter does not resonate with what most interviewees said: civil engineers are involved in water-related projects as consultants, the private sector is consistently excluded, and it appears that no stakeholder actively sways decisions, given that most of these decisions are made top-down based on contacts and are often determined by personal ties (Indicator 4.3: − −; S6-8, S10 and S14). Overall, decisions are insufficiently guided by research (S15). On a more positive note, the multitude of water sources indicate that some key decisions have been made from an informed position (S15), a broad consultation process was carried out for the formulation of an IWRM plan (S15 and S17), and there is an increased consideration for the importance of stakeholder involvement (Indicator 4.2: −; S12).
Management Ambition gained a ‘+’ score. A salient policy is the IWRM plan that includes policy matters, legislation, education, technical and financial measures, special measures for water reuse and saving, consumption-related water pricing and public awareness (Indicator 5.1: 0; [7]. This includes long-term considerations as well as improved inclusiveness (S6, S11 and S14) as there is a clear need to comprehensively improve the security of water provision (S5). Basin Management Committees (BMCs) have been established via the IWRM for dealing with drought risks and water supply in a comprehensive, decentralised and collaborative way. However, the BMCs are largely inactive (Indicator 5.3: 0; S14). Transboundary rivers are also managed with international committees (Indicator 5.2: +); however, this cross-country collaboration does not always result in effective solutions (S5 and S14). Ultimately, cross-sectorial planning is dysfunctional (S14), particularly as the end of drought periods usually marks the end of collaboration efforts (S14, S15 and S17).
The criteria for Agents of Change gained an average score of ‘0′. Although there is a recognised need to continuously update and innovate (Indicator 6.3: 0; S3 and S17), the limited knowledge, funding and acceptance of new ideas inhibits this (Indicator 6.1: 0; S1 and S15). The monopoly of water-related affairs does not allow space for competition, which would drive innovation (Indicator 6.2: 0; S8).
An average score of ‘0′ is found across the indicators for Multilevel Network Potential. A paucity of government funds limits the development of alternative approaches (Indicator 7.1: 0; S1 and S11). Strong leadership is required to oversee collaborative action: this is currently lacking, and as a result most initiatives occur in isolation (Indicator 7.3: −; S1 and S15). Although responsibilities in the water sector are clearly formulated, there is no ministry of water: it floats around as a subsidiary of other departments (S7). In addition, the president set up a technical committee dealing with water security, tasked with developing a master plan for water infrastructure, overlapping the work done by MAWLR and suggesting that there is mistrust in the institution (S5 and S14).
According to the aforementioned IWRM plan, new institutions are supposed to be established with clearly defined roles (S15); however, this is still to be implemented and, as a result, most responsibilities are allocated to the minister (S12; Indicator 7.2: 0). Ministers are the highest authority figures, typically governing for five years or less: the result is that their policy ambition goes towards securing support rather than a steady, sustainable, long-term vision that is needed to ensure water security (S5).
Financial Viability received an average score of ‘−’ across its indicators. Consumption-related water pricing means that people living in informal settlements pay less for the same volume of water compared with people living in more affluent areas (Indicator 8.1: 0 and Indicator 8.2: − −; S18). In fact, according to some, water is too cheap, impacting the funds available for project development (S10 and S13). Additionally, funding for the ministry of water is side-lined in favour of infrastructure, education and defence (S2), which has affected the delivery of climate adaptation measures such as aquifer recharge (S18). The little money that is available is not necessarily allocated to the right projects (S9 and S11), the overall result of which is a reliance on external and irregular sources of funding (Indicator 8.3: − −; S7 and S11).
An average score of ‘0′ is found across Implementing Capacity: the implementation of policy frameworks is a recurring issue. This partly occurs because many objectives have been modelled on European systems, where collaboration between stakeholders is easily achieved and water is readily available. These frameworks do not work in the Namibian context (S11): as a result, the comprehensive IWRM plan is still not 5% complete in 2020, despite being formulated a decade ago (Indicator 9.2: 0; S18). Windhoek currently operates on 1956 legislation from the South African rule (S6), a system which holds no accountability and lacks sufficient expertise and clear governance structures that can fulfil objectives (Indicator 9.1: −; S5). For instance, response to a recent drought had been modelled in the years prior to the drought, but nobody was held accountable for failing to implement better measures to offset its impacts (S14). Collaborations may emerge during crises, but these are short-lived, and, in practice, most situations are dealt with as they emerge (Indicator 9.3: −; S4, S5 and S14). In fact, there is a “fire brigade” office that responds to crises ad hoc (S2). Added to this, there is a lot of room for not following the guidelines: lucrative businesses may not abide to legislation or may find ways around meeting quality standards (S8).

4. Discussion

4.1. Data Limitations

The volume of literature and freely accessible information on Windhoek’s water systems are limited. The CBF information was collated from online resources and studies, with additional information sourced from stakeholders. While some of the literature is dated, there is also the absence of consistent, comprehensive, high-quality studies on water infrastructure and systems in Windhoek. This affects the confidence with which outputs can be interpreted.
Data for the GCF was based on 18 interviews, of which one occurred in writing due to time constraints. The selected interviewees work across different aspects of the water system, each with their own perspective: as a result, data were verified, where possible, with scientific literature, or cross-checked between stakeholders. Most points raised agreed, and minor discrepancies mainly related to the roles of institutions. This is understandable, considering that the absence of clear institutional roles and responsibilities was one of the identified problems.
There are other considerations worth making: from a psychological perspective, the role of the interviewer and his or her presentation may have influenced the nature of the responses [32]. Implicit biases, reticence, awareness of being recorded and desire to appease the interviewer may all have swayed the direction of the responses. This was partially offset by repetition: some questions were rephrased and asked multiple times throughout the same interviews, and the same questions were addressed across multiple interviewees. It is expected that these strategies helped achieve a comprehensive understanding of each indicator.

4.2. Trends and Pressures Framework

The results from the TPF reveal a city that is faced with multiple pressures. The most urgent crisis relates to water, universally acknowledged by the literature and stakeholders as being scarce. This issue has been partly addressed by the city via its water supply diversification, albeit insufficiently. Furthermore, the lowest ranking criteria encompassed governance considerations: Windhoek is prone to corruption and lacks fair representation and accountability. This suggests that strong leadership must be established in order to drive the security of water services forward. Unemployment is low, although it is unclear whether informal settlements were considered as part of Windhoek. The dynamically changing nature of these settlements suggests that unemployment rates may be higher than reported.

4.3. City Blueprint Framework

Overall, the results from the CBF highlight a gap in the technical infrastructure that would be needed to support water services. However, these same results also indicate that the municipality of Windhoek has excelled in providing a vast majority of its citizens with potable water, despite finding itself in a water scarce context, which is a commendable outcome.
Literature results occasionally disagreed with the findings in the present study: for example, the 2019 NamWater Annual Report [33] claimed that 67% of its annual budget is spent on maintenance, but this was not reflected in the status of infrastructure nor in the stakeholder perception of it. In fact, the absence of adequate maintenance was highlighted as one of the key issues. Water systems require expensive capital investment and high maintenance costs [34], so it may be that the money allocated is simply not enough to maintain the entire urban water cycle. This is troubling considering the high percentage of the total budget that is spent on maintenance.
The literature research identified some discrepancies and highlighted the paucity of high-quality, easily accessible data: “access to drinking water” was rated a high 9.9, based on data by Uhlendahl et al. [31]. According to Lewis et al. [14] however, only 11% of residents in informal settlements live within one kilometre of safe drinking water. This is the minimum potable water access standard set by the World Health Organisation (WHO). A total of 67% of the households live between one and five kilometres away from a water tap, which sheds a different light on the high-ranking criteria. Access to drinking water can be interpreted in many ways, for example it may exclude a maximum travel distance, which suggests that the criteria requirement may need to integrate these international standards. This is compounded by Windhoek’s ambiguous boundaries: informal settlements are formed ad hoc and are constantly evolving. This means that Windhoek’s boundary will have changed since the Uhlendahl et al. [31] paper was published. The result is that the water supply infrastructure may need to be constantly updated to reflect new migration. In our project described here, we aim to encompass all of Windhoek and its surrounding informal settlements, so in person substantiation of this criteria may be required.
Another high-ranking criterion was “drinking water quality”: the results were found from a paper assessing groundwater quality from 15 grab samples of the Goreangab Dam [35], all of which met quality standards, and from NamWater’s 2019 Annual Report [33], which included 2620 bacteriological samples, of which, 5.61% did not meet water quality standards. Overall, these findings are reliable but also reflect the absence of a data port that brings together all the information on water quality across the multiple water sources (groundwater, surface water and reclaimed wastewater). This same applies to the “groundwater quality” criterion, ranked 10, based on the same Weler study on the Goreangab dam [35]. Additionally, according to some stakeholders, there is missing knowledge regarding what is defined as good quality drinking water. This is true even within water-related businesses and suggests that this information should be freely and openly available for everybody to ensure that a high degree of water quality follows international standards and not personal interpretation.
The “water system leakages” criterion is worth elaborating on: a 13% loss was identified in literature [16], which is a good outcome even in developed countries: this finding is dated, but multiple interviews for the GCF featured comments on domestic water losses and pipe leakages. Lewis et al. [14] found that leakage rates in households were high, due to inferior equipment and lack of maintenance, reaching an average loss of 88 L/day. This further underlined the issues associated with finding high-quality data.
The literature highlights the success story of Windhoek’s solid waste management [36], particularly given that the municipality implemented a 2010 Solid Waste Management Policy; however, the results from the CBF point to a different story: of the 985.5 kg/cap/year of solid waste collected, 7% is recycled and none is incinerated with energy recovery; all of which yielded low scores for the solid waste criteria [37,38]. Although residents separate their waste, 20% of this is sent to landfill whereas the rest is sent to South Africa for recycling. Across sub-Saharan Africa, Kaza et al. [37] found that 69% of waste is openly dumped or incinerated. It may be worthwhile updating these results to see whether the 2010 Solid Waste Management Policy yielded positive changes for solid waste management. Overall, better monitoring is required, as this will enable more effective policy evaluation and learning and thereby improve governance capacity.
Interviews have substantiated some of the CBF results and contrasted others. Multiple stakeholders mentioned the old age of existing infrastructure and the lack of financing to support capital project as well as maintenance efforts. Findings from this study closely match those found by Lewis et al. [14], who summarised urban water management challenges in Windhoek as relating to lack of funds and staff, limited expertise, poor communication between stakeholders and weak regulation and enforcement.

4.4. Governance Capacity Framework

The governance analysis overall identified several issues that will be elaborated below. There are strengths of the existing system that mainly relate to the resourcefulness of Windhoek and its ability to provide its citizens with continued water supply, even in times of drought: this resilience is possibly a function of the diversified water source, of which one is reclaimed wastewater. This makes Windhoek an interesting case study, as it shows the wider community that it is possible to reclaim wastewater and transform it into potable water. This reduces the wastage of water but also improves the water supply security. Another strength identified was the agreement between stakeholders: there were generally common themes, issues and concerns that emerged, which are positive indicators as they suggest that the people on the ground have identified recurring issues in water management systems. Therefore, they are better equipped to collaboratively address the issues and concerns.

4.4.1. Implementation Capacity

The reduced capacity to implement legislation was frequently quoted by stakeholders (S4, S5, S12, S14, S17). This occurs for multiple reasons, which include a Eurocentric vision (S12) combined with a lack of funding (S10, S13), technical expertise (S7, S8, S9), and accountability (S5, S11). The IWRM plan was finalised around 2013-4 and approved by the Namibian Parliament. This plan addresses the water security challenge in a comprehensive and holistic manner and defines the importance of the water resource in terms of human well-being, socio-economic development and the environment. Despite this, the regulations supporting the act have not been finalised (S1, S5, S15, S6). As a result, today, Windhoek operates on the Water Act N.54 [39] from 1956, which does not offer the inclusive and sustainable vision that is needed by the water sector.
  • Eurocentrism—The current and planned legislative frameworks do not work in the Namibian context, and this is either because they were created during the period of apartheid, that speak to a white minority, or because they are modelled on European systems (S12). The latter features stakeholder collaboration and widespread water availability that are not reflected in Windhoek’s context. Consequently, the policies that are promoted assure success in Europe but not in Namibia, or as a stakeholder defined it, “the policy is ahead of its times” (S12, S5). The traditional laws that embed water-saving principles are discarded in favour of modern legislation, which looks at the principles of city living including excessive water consumption. As a result, the legislative frameworks need to be re-formulated to better reflect the context in which they would be applied. This is expected to offset some of the implementation issues (S12, S5, S13).
  • Accountability—A lack of accountability impacts the implementation and monitoring of policies (S5, S14, S13). When a water crisis occurs, it is blamed on climate change or an arid Namibian environment (S17): although these are to blame, this generates a reduced sense of initiative for dealing with the challenge. An integrated mandate for water management and clear division of responsibilities would enable individuals and institutions to be held accountable and to provide incentive to take action to ensure long-term security of water provision (S5, S18). At present, water management responsibilities are scattered over many departments, which leads to inertia and inaction. This means that Windhoek is incapable of preparing for crises in advance, rather it deals with these when they arise (S5, S8, S11). The changing conditions that continuous water depletion and climate change will bring will not be offset in this manner, compromising the long-term and sustainable water supply.
  • Technical expertise—The level of technical expertise required to support policy implementation is lacking, especially at governance level (S15, S7, S8). There was a recent turnaround of young heads in institutions, which compromises the experience and capacity of fulfilling these positions (S5, S11). Although it is important to improve equality and representation, the impulsive way this is done results in experienced figures being unable to address the water security challenge. Added to this, multiple technical experts have migrated to the private sector due to more appealing working conditions (S7, S9, S8). This has resulted in the public sector being mostly unqualified to create working systems or come up with adequate solutions to water security issues, an issue further compounded by the absence of cross-stakeholder learning. This suggests that Windhoek needs a body that can take in all types of water treatment professionals and adequately consult them, so that stakeholders can also influence policy development (S5, S11, S10). Further to this, although institutional roles are clear on paper, water resources are managed ad hoc, further compounding the implementation of relevant policy. This underlines the need for strong, central drivers, who can coordinate all activities (S1).
  • Funding—The city’s water sector is underfunded, as financing education, infrastructure and transport and defence departments are prioritised (S2, S4). There is no clear link between the money generated and the funds that are available for development, maintenance and new infrastructure. This lack of transparency reduces stakeholders’ trust that money is well-spent. Overall, the money shortage has meant that boreholes cannot be replaced, capital investment is impossible and maintenance is virtually non-existent (S11, S5, S13, S17). The lack of technical expertise results in insufficient maintenance of equipment, even if the equipment is new (S8). Moreover, the government relies on external sources of funding rather than addressing this issue (S11, S13).
The allocation of funds tends to be problematic: multiple examples of developments occurring because political players have become involved in decisions that should be technical have been listed (S7, S8). Major decisions are made top-down, without proper consultation of the water experts and with a short-term vision (See section ‘Short-term thinking’ below, S11). This prevents decision-makers from looking at the wider impacts of their decisions. Developments such as aquifer recharge, that consider a long-term sustainable supply climate mitigation strategy, have come to a halt due to finances; however, money is invested in other major projects that are not essential, such as road development (S11, S12). Another issue is that officials measure the rate of performance based on the money spent, even if this is not needed (S11). This results in avoidable and hasty decisions that are made on the wrong principles.
Lastly, NamWater, MAWLR and the University of Namibia attempted to establish a water research fund, formed by channelling part of the taxpayers’ money (S10, S5). This was not successful, possibly due to the side-lining of the water institutes and projects. Adequate financing is essential for training staff, investing in new projects, maintaining existing infrastructure, giving weight to structures such as the BMCs and providing long-term water solutions. The absence of investments in water security are likely to impede the social-economic development of the city.

4.4.2. Trust

Trust emerged as a key issue: a lot of water-related decisions occur top-down, and from behind closed doors, leaving stakeholders excluded and potentially valuable inputs ignored. This has fuelled an environment of mistrust in institutions.
  • Closed door policy—The limited engagement opportunities and lack of open forums for discussion impact the ability stakeholders have to voice their concerns in a manner that leads to remediated action (See section ‘Stakeholder involvement’ above). The same few companies are commissioned for most water-related projects and if stakeholder engagement is carried out, this occurs from behind closed doors (S7, S8, S9). Achieving stakeholder engagement is more a result of contacts and friendships than expertise and experience. The decisions are reached in a top-down manner, and little discourse from stakeholders can influence this (S5, S11). These combined features have impacted the trust that stakeholders have in their institutions.
  • Community—As shown by the GCF results, the community is aware of the water security risks and the need to save water (S1, S2). However, there is no promoting of information regarding why water needs to be saved, the decision is made at governance level and individuals need to conform: fines for over-consumption are distributed more than educational initiatives on the value of saving water (S4, S5). As a result, the community may not always act responsibly towards the resource. The trends in water consumption do not reflect the context as these are more reactive to the crisis rather than focused on making water conservation an embedded feature of daily life. Above all, local authority responses do not necessarily match the awareness campaigns: it may take days for a water leakage to be fixed, which contrasts the claimed water shortages (S4, S3). This has fostered a mistrust in the local community towards authority figures and the urgency of the water security issue.
  • Short-term thinking—Water-related issues such as drought or flooding are addressed when they arise: remediated actions are curative rather than preventative. For example, drought events may be predicted, but the action taken to offset their impacts materialises during the drought and not prior to it (S6, S14, S15). NamWater’s annual workshops focus on water availability for the following two or three years: this is the extent of future planning (S11). The result is that aquifer resources are extracted with short-term requirements in mind. Water security needs to be considered over longer periods of time, suggesting that more risk-based, prospective thinking needs to be encompassed in these workshops and subsequent actions. In addition, there is no permanency in politics: politicians consider the short term and prioritise policies that are more likely to get them re-elected (S5, S17, S15). The ambitions promoted by politicians might be different to the policy direction needed in the country. The water sector is a long-term focus: it needs a strong technical level of focus that can maintain continuity even if governance figures change. Although this technical level exists, it is being infiltrated by the politically minded who promote short-term, personal goals. For example, an irrigation policy may be implemented without adequately addressing the issue of water security (S5, S11, S1).

5. Conclusions

The nature of the City Blueprint Analysis has allowed for a comprehensive overview of Namibia’s water security challenge and how it is being managed. Policymakers and stakeholders will have access to a full baseline assessment of their water system, based on locally sourced information. The key issues agree with literature findings, which strengthens the value of this data. Is it hoped that an action plan with a long-term vision can be formed on this basis? Based on this information, we recommend the followings three steps to be taken:
  • A full, on-ground study effort of Windhoek’s water management needs to be completed. This will help to find the infrastructure that needs updating or changing.
  • A transparent online data-port that can feature academic and non-academic articles, technical data and status progress of the water systems in Windhoek needs to be created.
  • A workshop needs to be organised and maintained on a recurring basis, as a platform for stakeholders to converse with each other and with policymakers.
The city of Windhoek has implemented positive measures to offset its water security crisis, but these are insufficient. The looming risks associated with the rapid urbanisation and climate change mean that the city’s infrastructure needs serious maintenance and updating and that governance strategies need to be reformulated to involve more expert inputs and a comprehensive and sustainable view of the water resource.
Finally, the applied approach methodology has been demonstrated to provide case-specific understanding of the key water stress challenges and capacities required to address these challenges. However, the standardised methodological approach can also enable a more comprehensive understanding of how to overcome the key hurdles of existing and projected water stress at a local level across the diversity of African regions. Governing a conjunctive approach for combatting water stress with multiple stakeholders and applying a diversity of solution strategies requires a thorough empirically based understanding of capacity-development priorities. In particular, the identification of transferable lessons that are obtained from and embedded in localised knowledge is essential. The application of our methodology in more African cities therefore seems a promising way to obtain such an understanding.

Supplementary Materials

The following supporting information can be downloaded at: https://www.mdpi.com/article/10.3390/su14042387/s1, (1) Explanation of Governance Capacity Assessment framework with predefined questions and Likert-scale for scoring, (2) Rephrased questions for Windhoek case, (3) Substantiating, scoring and justification of GCA indicators for Windhoek. References [2,7,10,14,30,31,39,40,41] are cited in the Supplementary Material.

Author Contributions

Conceptualization, F.O., S.H.A.K. and J.H.; methodology, S.H.A.K. and K.V.L.; validation, F.O., S.H.A.K. and K.V.L.; resources, F.O.; data curation, F.O. and K.V.L.; writing—original draft preparation, F.O. and J.H.; writing—review and editing, J.H., S.H.A.K. and K.V.L. All authors have read and agreed to the published version of the manuscript.

Funding

This research received no external funding.

Institutional Review Board Statement

Not applicable.

Informed Consent Statement

Informed consent was obtained from all stakeholders interviewed for this study.

Acknowledgments

The authors would like to thank interviewees involved for contributing to this research effort and local UNESCO staff who liaised with stakeholders and contributed to this research.

Conflicts of Interest

The authors declare no conflict of interest.

References

  1. Koop, S.H.A.; Van Leeuwen, C.J. Assessment of the Sustainability of Water Resources Management: A Critical Review of the City Blueprint Approach. Water Resour. Manag. 2015, 29, 5649–5670. [Google Scholar] [CrossRef] [Green Version]
  2. Haarhoff, J.; Van Der Merwe, B. Twenty-five years of wastewater reclamation in Windhoek, Namibia. Water Sci. Technol. 1996, 33, 25–35. [Google Scholar] [CrossRef]
  3. McDonald, R.I.; Weber, K.; Padowski, J.; Florke, M.; Schneider, C.; Green, P.A.; Gleeson, T.; Eckman, S.; Lehner, B.; Balk, D.; et al. Water on an urban planet: Urbanization and the reach of urban water infrastructure. Glob. Environ. Chang. 2014, 27, 96–105. [Google Scholar] [CrossRef] [Green Version]
  4. Le Blanc, D.; Perez, R. The relationship between rainfall and human density and its implications for future water stress in Sub-Saharan Africa. Ecol. Econ. 2008, 66, 319–336. [Google Scholar] [CrossRef]
  5. Fant, C.; Schlosser, C.A.; Gao, X.; Strzepek, K.; Reilly, J. Projections of Water Stress Based on an Ensemble of Socioeconomic Growth and Climate Change Scenarios: A Case Study in Asia. PLoS ONE 2016, 11, e0150633. [Google Scholar] [CrossRef] [PubMed] [Green Version]
  6. Schlosser, C.A.; Strzepek, K.; Gao, X.; Fant, C.; Blanc, E.; Paltsev, S.; Jacoby, H.; Reilly, J.; Gueneau, A. The future of global water stress: An integrated assessment. Earths Future 2014, 2, 341–361. [Google Scholar] [CrossRef]
  7. Lahnsteiner, J.; Lempert, G. Water management in Windhoek, Namibia. Water Sci. Technol. 2007, 55, 441–448. [Google Scholar] [CrossRef] [PubMed]
  8. Dirx, E.; Hager, C.; Tadross, M.; Bethune, S.; Curtis, B. Climate Change Vulnerability & Adaptation Assessment; Desert Research Foundation of Namibia & Climate Systems Analysis Group: Windhoek, Namibia, 2008. [Google Scholar]
  9. Turpie, J.; Midgley, G.; Brown, C.; Barnes, J.; Pallett, J.; Desmet, P.; Tarr, J.; Tarr, P. Climate Change Vulnerability and Adaptation Assessment for Namibia’s Biodiversity and Protected Area System; Ministry of Environment and Tourism, Directorate of Parks & Wildlife Management, Republic of Namibia: Windhoek, Namibia, 2018. [Google Scholar]
  10. Van Der Merwe, B. Integrated water resource management in Windhoek, Namibia. Water Supply 2000, 18, 376–381. [Google Scholar]
  11. Lewis, E.W.; Staddon, C.; Sirunda, J. Urban water management challenges and achievements in Windhoek, Namibia. Water Pract. Technol. 2019, 14, 703–713. [Google Scholar] [CrossRef] [Green Version]
  12. Šteflová, M.; Koop, S.H.A.; Fragkou, M.C.; Mees, H. Desalinated drinking-water provision in water-stressed regions: Challenges of consumer-perception and environmental impact lessons from Antofagasta, Chile. Int. J. Water Resour. Dev. 2021, 1–24. [Google Scholar] [CrossRef]
  13. Municipality of Windhoek. Department of Infrastructure Water and Technical Services Division: Bulk and Waste Water, Government Gazette No. 3228. Available online: https://gazettes.africa/archive/na/2004/na-government-gazette-dated-2004-07-01-no-3228.pdf (accessed on 20 August 2020).
  14. Lewis, E.W.; Siyambango, N.; Lendelvo, S. Assessment of accessibility of safe drinking water: A case study of the goreangab informal settlement, Windhoek, Namibia. Water Pract. Technol. 2018, 13, 871–878. [Google Scholar] [CrossRef]
  15. Iikela, S. Namibia: Windhoek Corrects Water Tariffs. Available online: https://allafrica.com/stories/201910010200.html (accessed on 6 December 2021).
  16. Ministry of Agriculture Water and Forestry. Technical Summary of Water Accounts. Available online: https://unstats.un.org/unsd/envaccounting/ceea/archive/Water/Namibia_Technical%20Report-Final%20Jan2006.PDF (accessed on 15 June 2020).
  17. Moyo, L.J. Wastewater Production, Treatment and Use in Namibia; Polytechnic of Namibia: Windhoek, Namibia, 2012. [Google Scholar]
  18. Grindle, M.S. Good enough governance revisited. Dev. Policy Rev. 2007, 25, 533–574. [Google Scholar] [CrossRef]
  19. Remmert, D. Managing Windhoek’s Water Crisis: Short-Term Success vs Long-Term Uncertainty. Available online: https://ippr.org.na/publication/managing-windhoeks-water-crisis/ (accessed on 18 August 2020).
  20. New Era. City of Windhoek Water Restrictions in Place. Available online: https://neweralive.na/posts/city-windhoek-waterrestrictions-place (accessed on 10 August 2020).
  21. Brown, R. Financial Sustainability and Growth: A Difficult Balancing Act. Available online: https://ippr.org.na/wp-content/uploads/2016/04/Special%20Brief%20Report%2012%20web.pdf (accessed on 1 August 2020).
  22. Remmert, D. Water Governance in Nambia: A Tale of Delayed Implementation, Policy Shortfalls and Miscommunication. Available online: https://ippr.org.na/wp-content/uploads/2016/10/Water_Goverance_Namibia_FINAL.pdf (accessed on 15 August 2020).
  23. Koop, S.H.A.; Koetsier, L.; Doornhof, A.; Reinstra, O.; Van Leeuwen, C.J.; Brouwer, S.; Dieperink, C.; Driessen, P.P.J. Assessing the Governance Capacity of Cities to Address Challenges of Water, Waste, and Climate Change. Water Resour. Manag. 2017, 31, 3427–3443. [Google Scholar] [CrossRef] [Green Version]
  24. Koop, S.H.A.; Van Leeuwen, C.J. The challenges of water, waste and climate change in cities. Environ. Dev. Sustain. 2017, 19, 385–418. [Google Scholar] [CrossRef] [Green Version]
  25. Feingold, D.; Koop, S.; Van Leeuwen, K. The City Blueprint Approach: Urban Water Management and Governance in Cities in the U.S. Environ. Manag. 2018, 61, 9–23. [Google Scholar] [CrossRef] [PubMed] [Green Version]
  26. Chang, I.S.; Zhao, M.; Chen, Y.; Guo, X.; Zhu, Y.; Wu, J.; Yuan, T. Evaluation on the integrated water resources management in China’s major cities—Based on City Blueprint® Approach. J. Clean. Prod. 2020, 262, 121410. [Google Scholar] [CrossRef]
  27. Koop, S.H.A.; Van Leeuwen, C.J. Indicators of the Trends and Pressures Framework (TPF) (Revision June 2021). Available online: https://library.kwrwater.nl/publication/61396712/ (accessed on 8 July 2021).
  28. Koop, S.H.A.; Van Leeuwen, C.J. Indicators of the City Blueprint Performance Framework (CBF) (Version June 2021). Available online: https://library.kwrwater.nl/publication/61397318/ (accessed on 8 July 2021).
  29. Koop, S.H.A.; Van Leeuwen, C.J. Indicators of the Governance Capacity Framework (GCF) (Version June 2021). Available online: https://library.kwrwater.nl/publication/61397218/ (accessed on 8 July 2021).
  30. Lapworth, D.J.; Nkhuwa, D.C.W.; Okotto-Okotto, J.; Pedley, S.; Stuart, M.E.; Tijani, M.N.; Wright, J. Urban groundwater quality in sub-Saharan Africa: Current status and implications for water security and public health. Hydrogeol. J. 2017, 25, 1093–1116. [Google Scholar] [CrossRef] [PubMed] [Green Version]
  31. Uhlendahl, T.; Ziegelmayer, D.; Wienecke, A.; Mawisa, M.L.; du Pisani, P. Water Consumption at Household Level in Windhoek, Namibia. Available online: https://freidok.uni-freiburg.de/dnb/download/7937 (accessed on 10 June 2020).
  32. Katz, D. Do Interviewers Bias Poll Results? Public Opin. Q. 1942, 6, 248–268. [Google Scholar] [CrossRef]
  33. NamWater. Integrated Annual Report. Available online: https://www.namwater.com.na/images/docs/NamWater_AR_2019_FINAL.pdf (accessed on 25 June 2020).
  34. UN High Level Panel on Water. Water Infrastructure and Investment. Available online: https://sustainabledevelopment.un.org/content/documents/hlpwater/08-WaterInfrastInvest.pdf (accessed on 22 December 2021).
  35. Weler Consulting Services. Water Quality Assessment Dry Season Results. Available online: http://www.landscapesnamibia.org/windhoek-green-belt/sites/default/files/resources/Water%20Quality%20Assessment.pdf (accessed on 10 June 2020).
  36. Global Recycling. Namibia: Long-Term Market Opportunities Ahead. Available online: https://global-recycling.info/archives/525 (accessed on 8 June 2020).
  37. Kaza, S.; Yao, L.C.; Bhada-Tata, P.; Van Woerden, F. What a Waste 2.0: A Global Snapshot of Solid Waste Management to 2050; World Bank: Washington, DC, USA, 2018. [Google Scholar] [CrossRef]
  38. African Clean Cities. Namibia, Windhoek. Available online: https://africancleancities.org/assets/data/Organization/Windhoek_EN.pdf (accessed on 15 June 2020).
  39. Republic of Namibia. Water Act 54 of 1956 (SA). Available online: http://www.lac.org.na/laws/annoSTAT/Water%20Act%2054%20of%201956.pdf (accessed on 15 August 2020).
  40. Lange, G. An approach to sustainable water management in Southern Africa using natural resource accounts: The experience in Namibia. Ecol. Econ. 1998, 26, 299–311. [Google Scholar] [CrossRef]
  41. Kanyerere, T.; Tramberend, S.; Levine, A.D.; Mokoena, P.; Mensah, P.; Chingombe, W.; Goldin, J.; Fatima, S.; Prakash, M. Water futures and solutions: Options to enhance water security in Sub-Saharan Africa. In Systems Analysis Approach for Complex Global Challenges; Springer: Cham, Switzerland, 2018; pp. 93–111. [Google Scholar] [CrossRef]
Figure 1. Maps of Africa and Namibia.
Sustainability 14 02387 g001
Figure 2. Overview of the City Blueprint Approach which consists of three separate but complementary assessment frameworks ([20,21,22]).
Sustainability 14 02387 g002
Figure 3. Trends and Pressure Framework of Windhoek, Namibia. Freshwater scarcity (*) and Groundwater scarcity (**) score low because, although these resources are limited, only very few of them are exploited.
Sustainability 14 02387 g003
Figure 4. City Blueprint Framework of Windhoek, Namibia.
Sustainability 14 02387 g004
Figure 5. Average scores of each category of the GCF. No category gained a “very encouraging” rating. Continuous learning was the lowest scoring category whereas management ambition was the highest scoring category.
Sustainability 14 02387 g005
Table 1. The GCF framework comprises 27 indicators grouped in nine governance conditions, in turn classed under three broader principles.
DimensionConditionIndicator
Knowing
1
Awareness
1.1 Community Knowledge
1.2 Local sense of urgency
1.3 Behavioural internalisation
2
Useful knowledge
2.1 Information availability
2.2 Information transparency
2.3 Knowledge cohesion
3
Continuous learning
3.1 Smart monitoring
3.2 Evaluation
3.3 Cross-stakeholder learning
Wanting
4
Stakeholder engagement processes
4.1 Stakeholder inclusiveness
4.2 Protection of core values
4.3 Progress and variety of options
5
Management ambition
5.1 Ambitious and realistic management
5.2 Discourse embedding
5.3 Management cohesion
6
Agents of change
6.1 Entrepreneurial agents
6.2 Collaborative agents
6.3 Visionary agents
Enabling
7
Multi-level network potential
7.1 Room to manoeuvre
7.2 Clear division of responsibility
7.3 Authority
8
Financial viability
8.1 Affordability
8.2 Consumer willingness-to-pay
8.3 Financial continuation
9
Implementing capacity
9.1 Policy instruments
9.2 Statutory compliance
9.3 Preparedness
Publisher’s Note: MDPI stays neutral with regard to jurisdictional claims in published maps and institutional affiliations.

