
Empirical Evidence of the Livelihood Vulnerability to Climate Change Impacts: A Case of Potato-Based Mountain Farming Systems in Bhutan

 ,
,  ,
,  ,
,
Abstract
1. Introduction
2. Materials and Methods
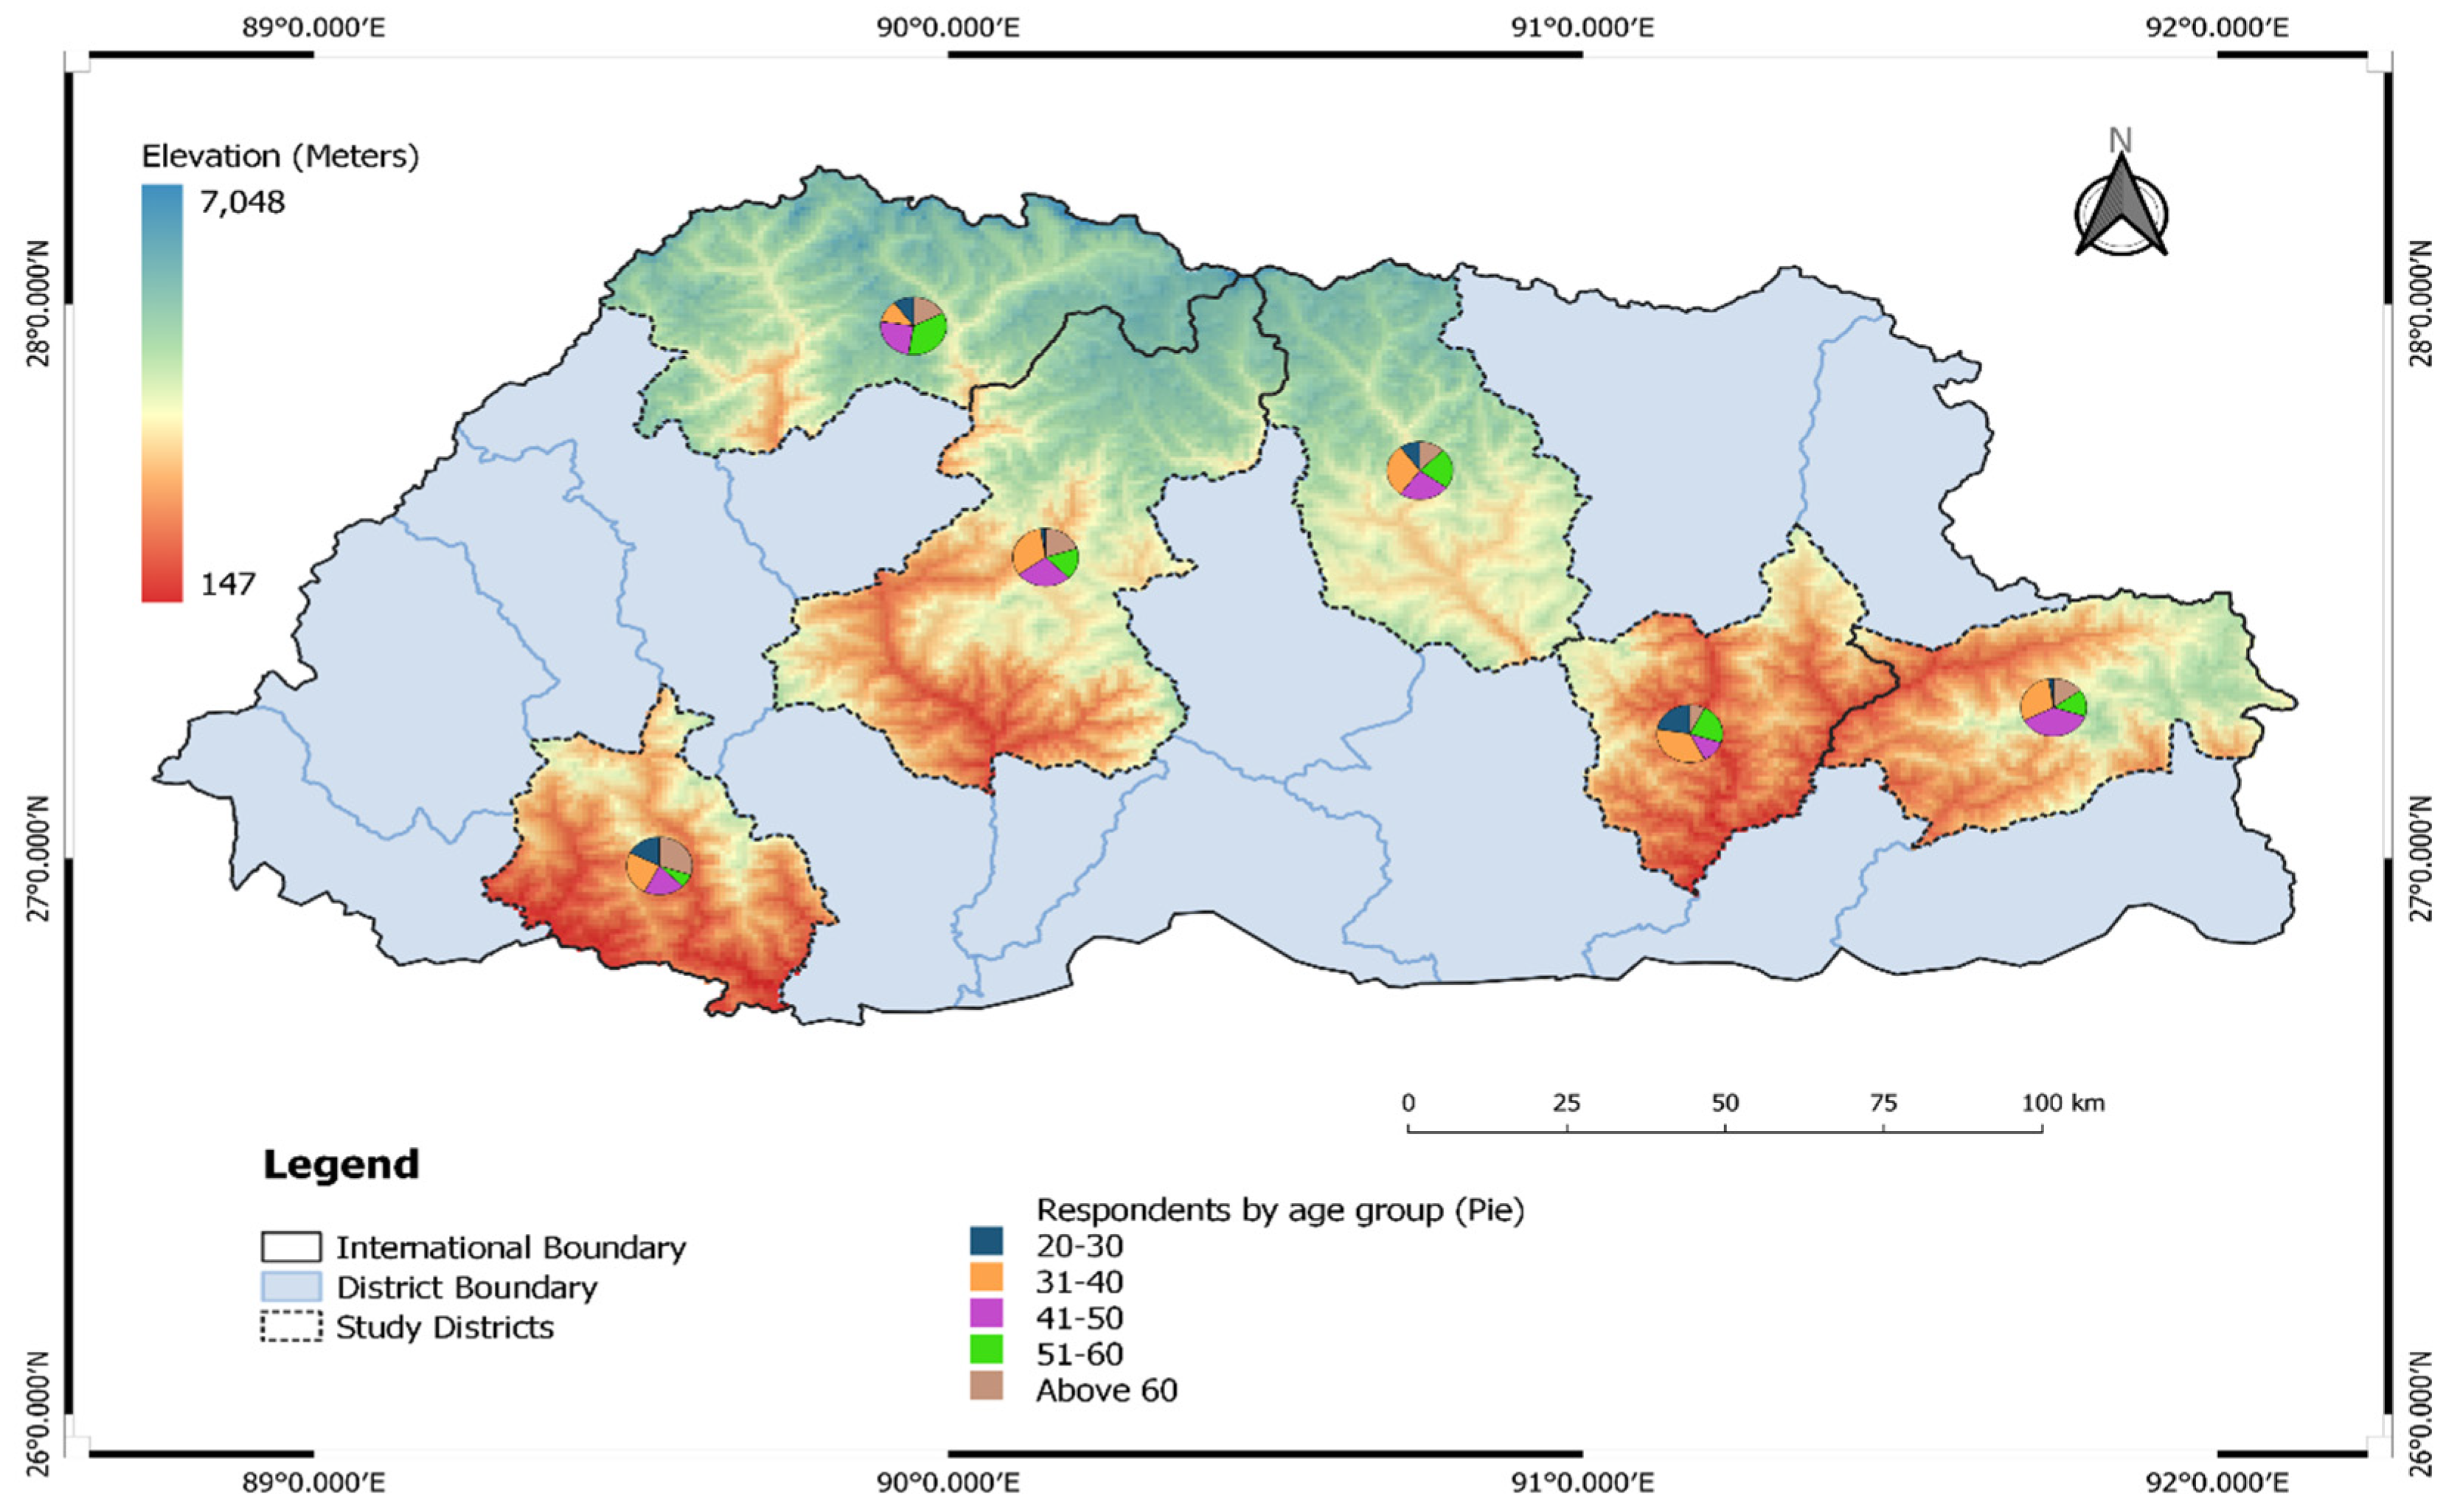
2.1. Data Collection
2.2. Data Analysis
2.2.1. Livelihood Vulnerability Index (LVI) Approach
2.2.2. Intergovernmental Panel for Climate Change Framework for Calculating LVI (LVI-IPCC)
3. Results
3.1. Demographic Profile of Surveyed Respondents
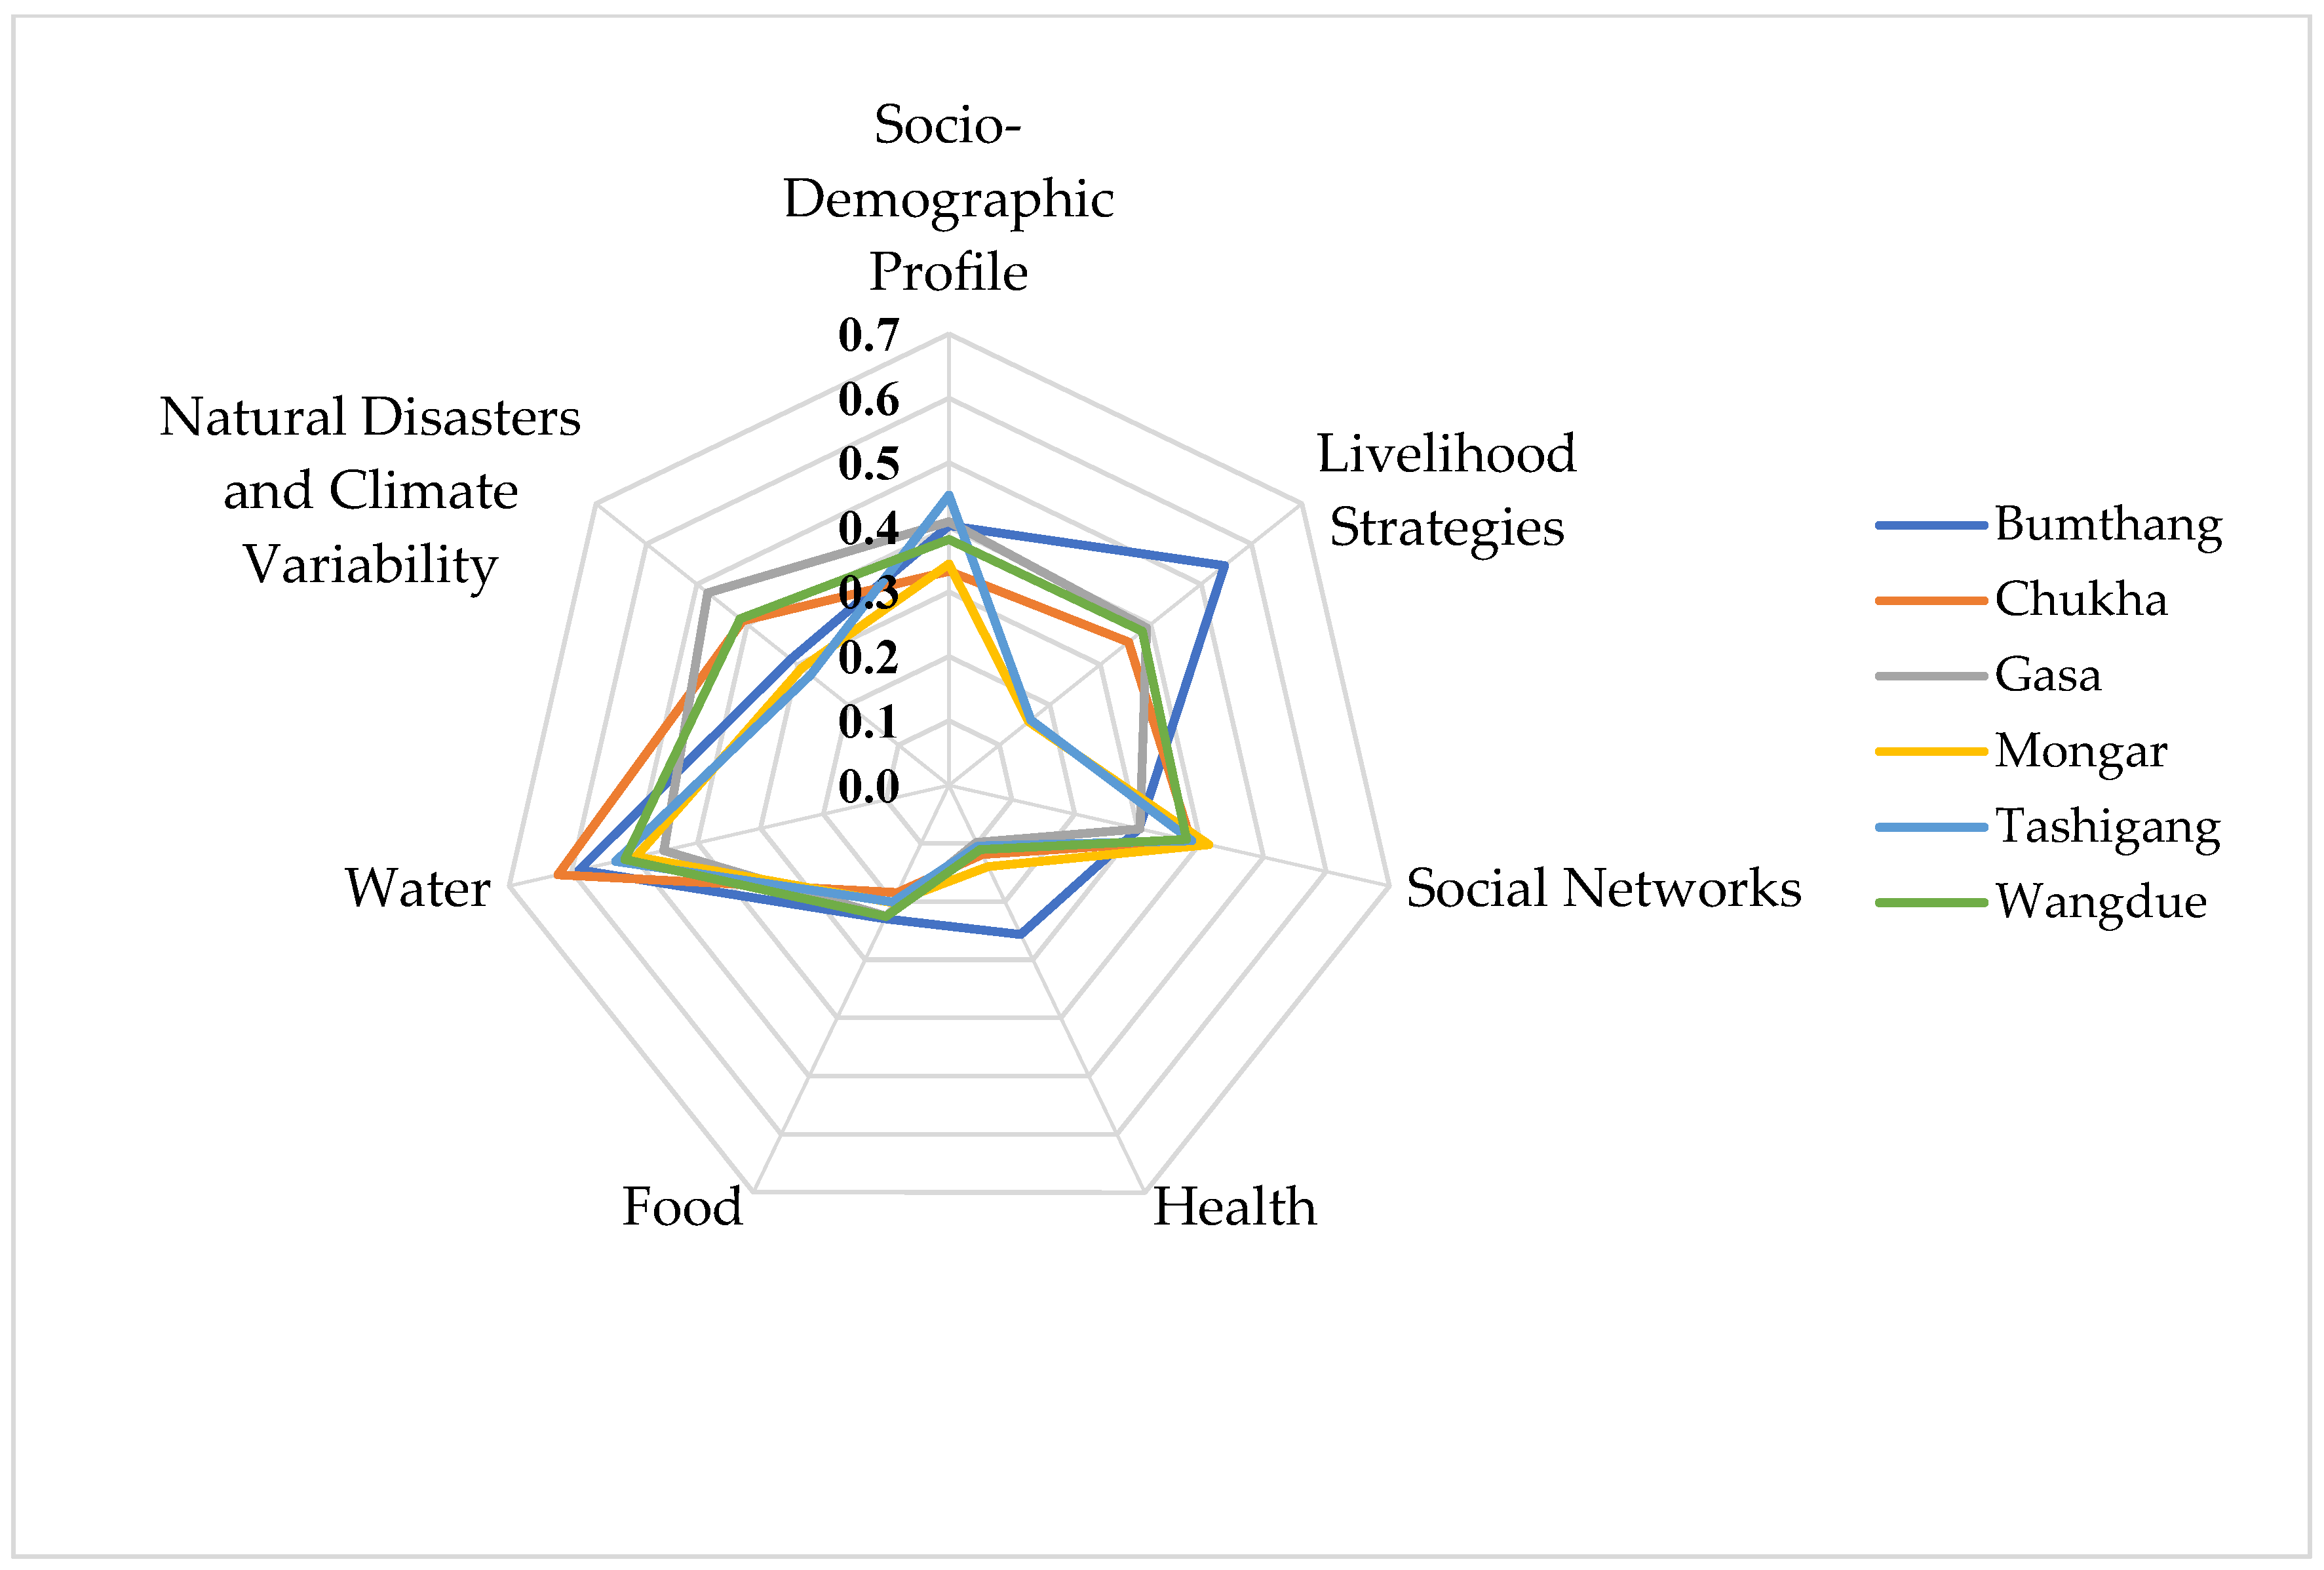
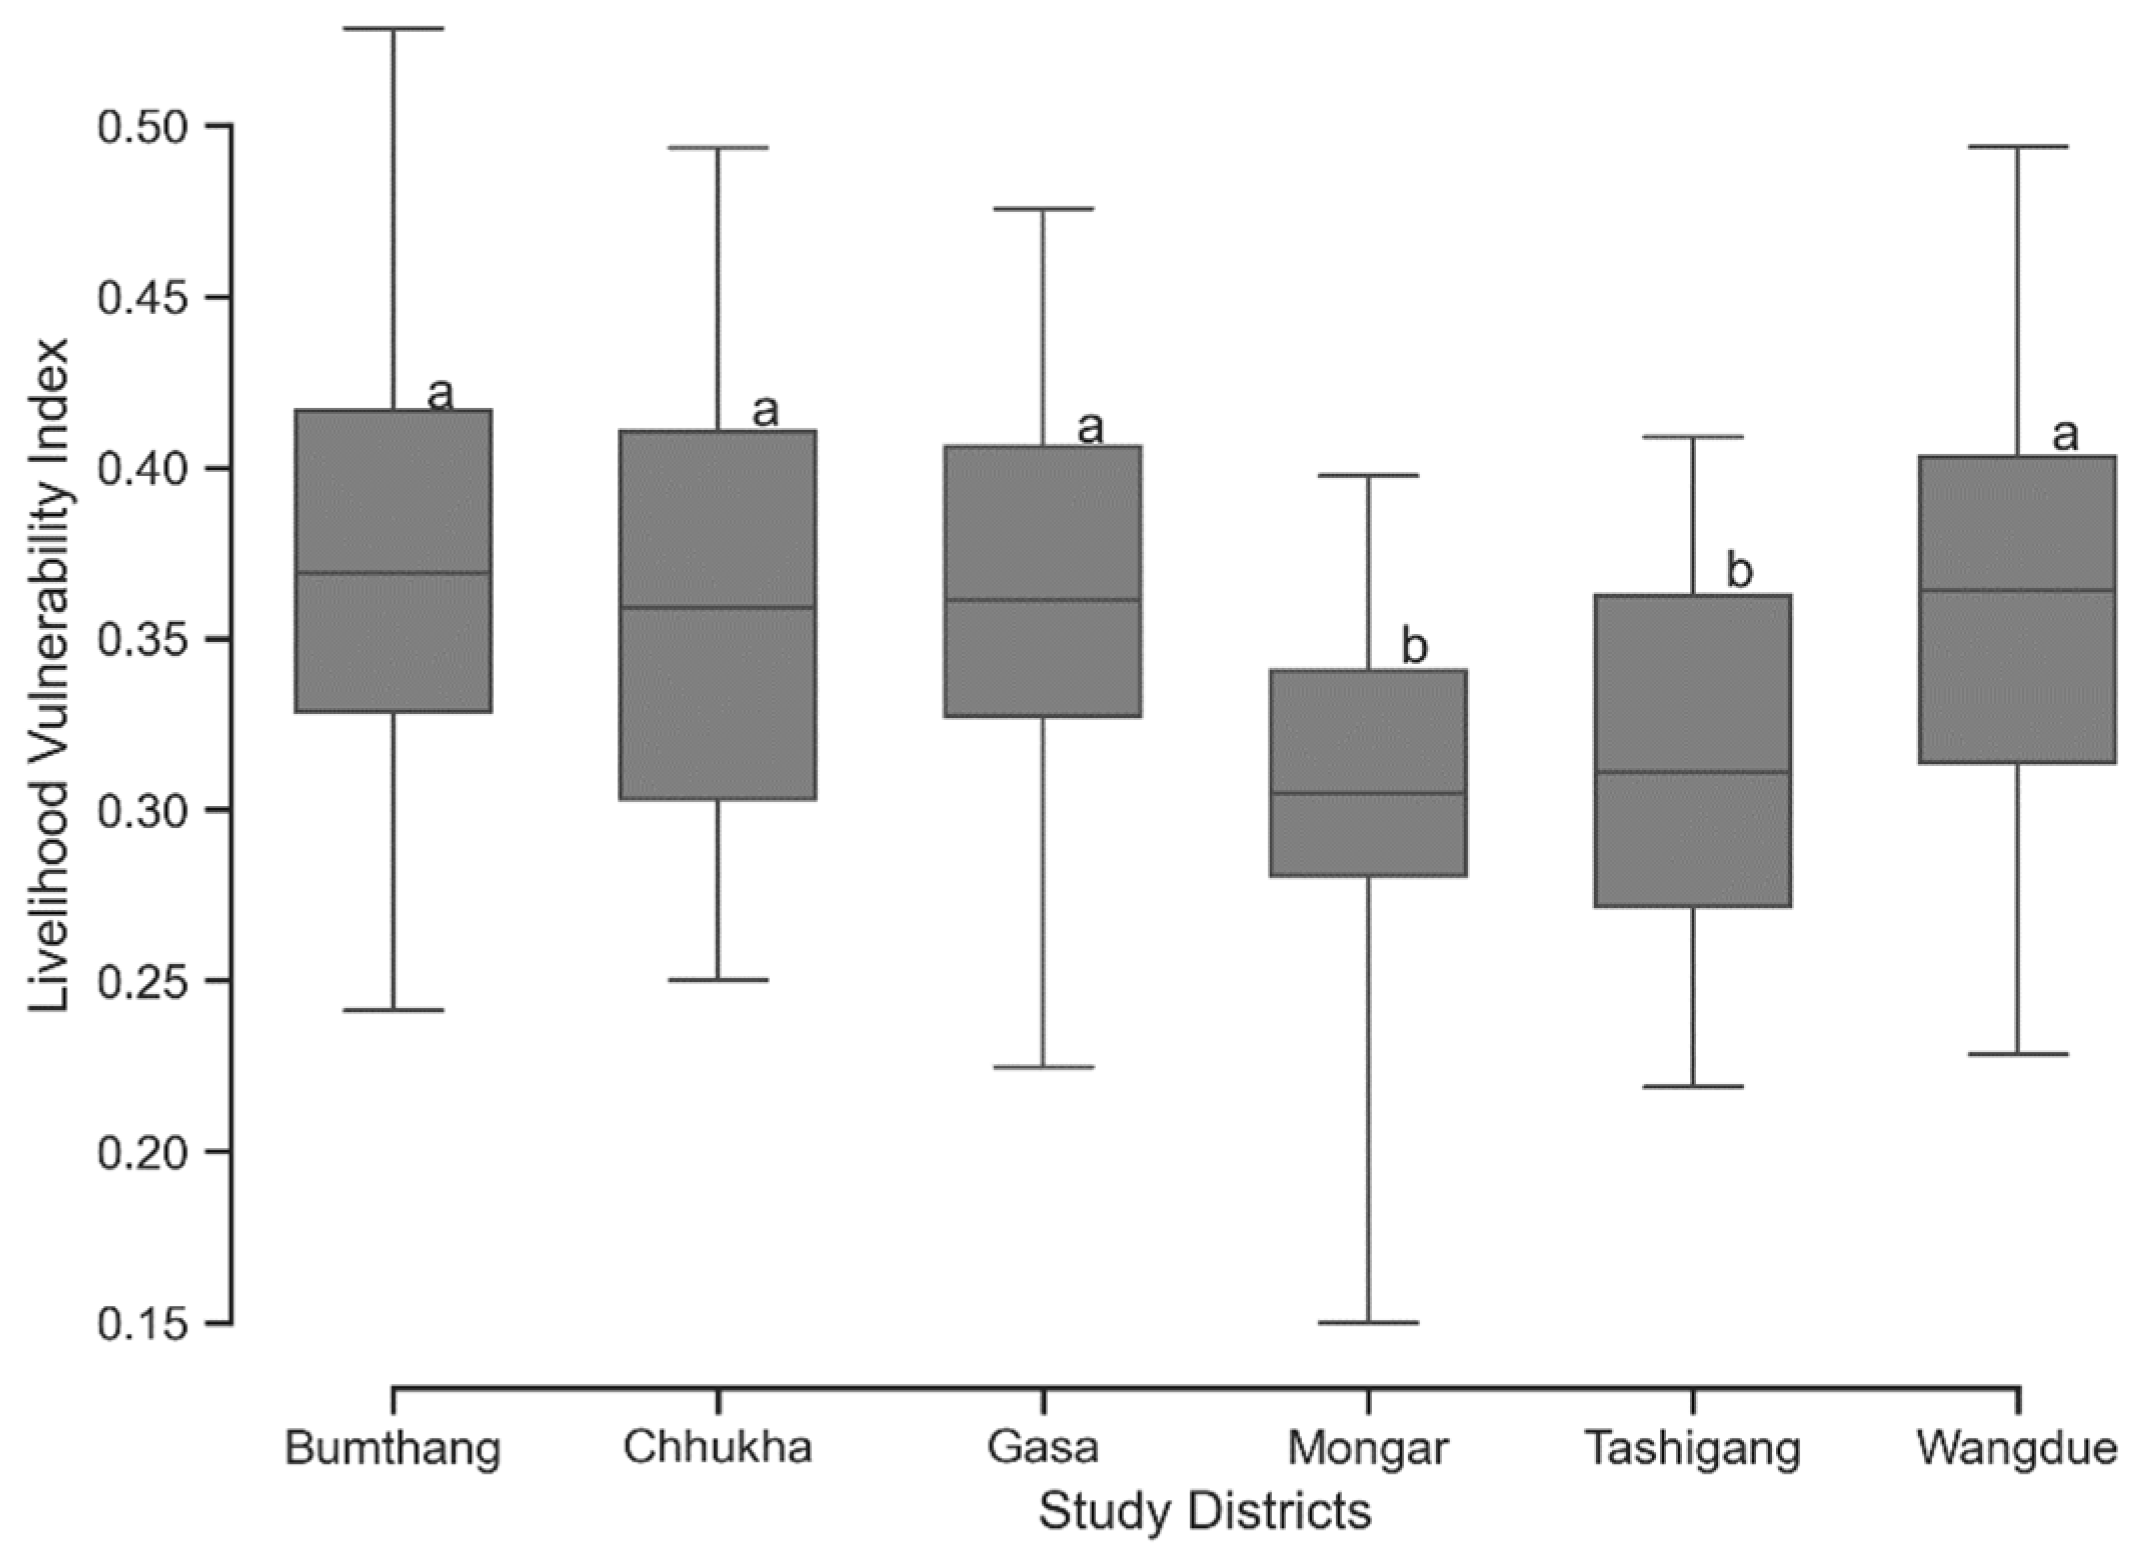
3.2. Livelihood Vulnerability Index (LVI) for the Six Study Districts
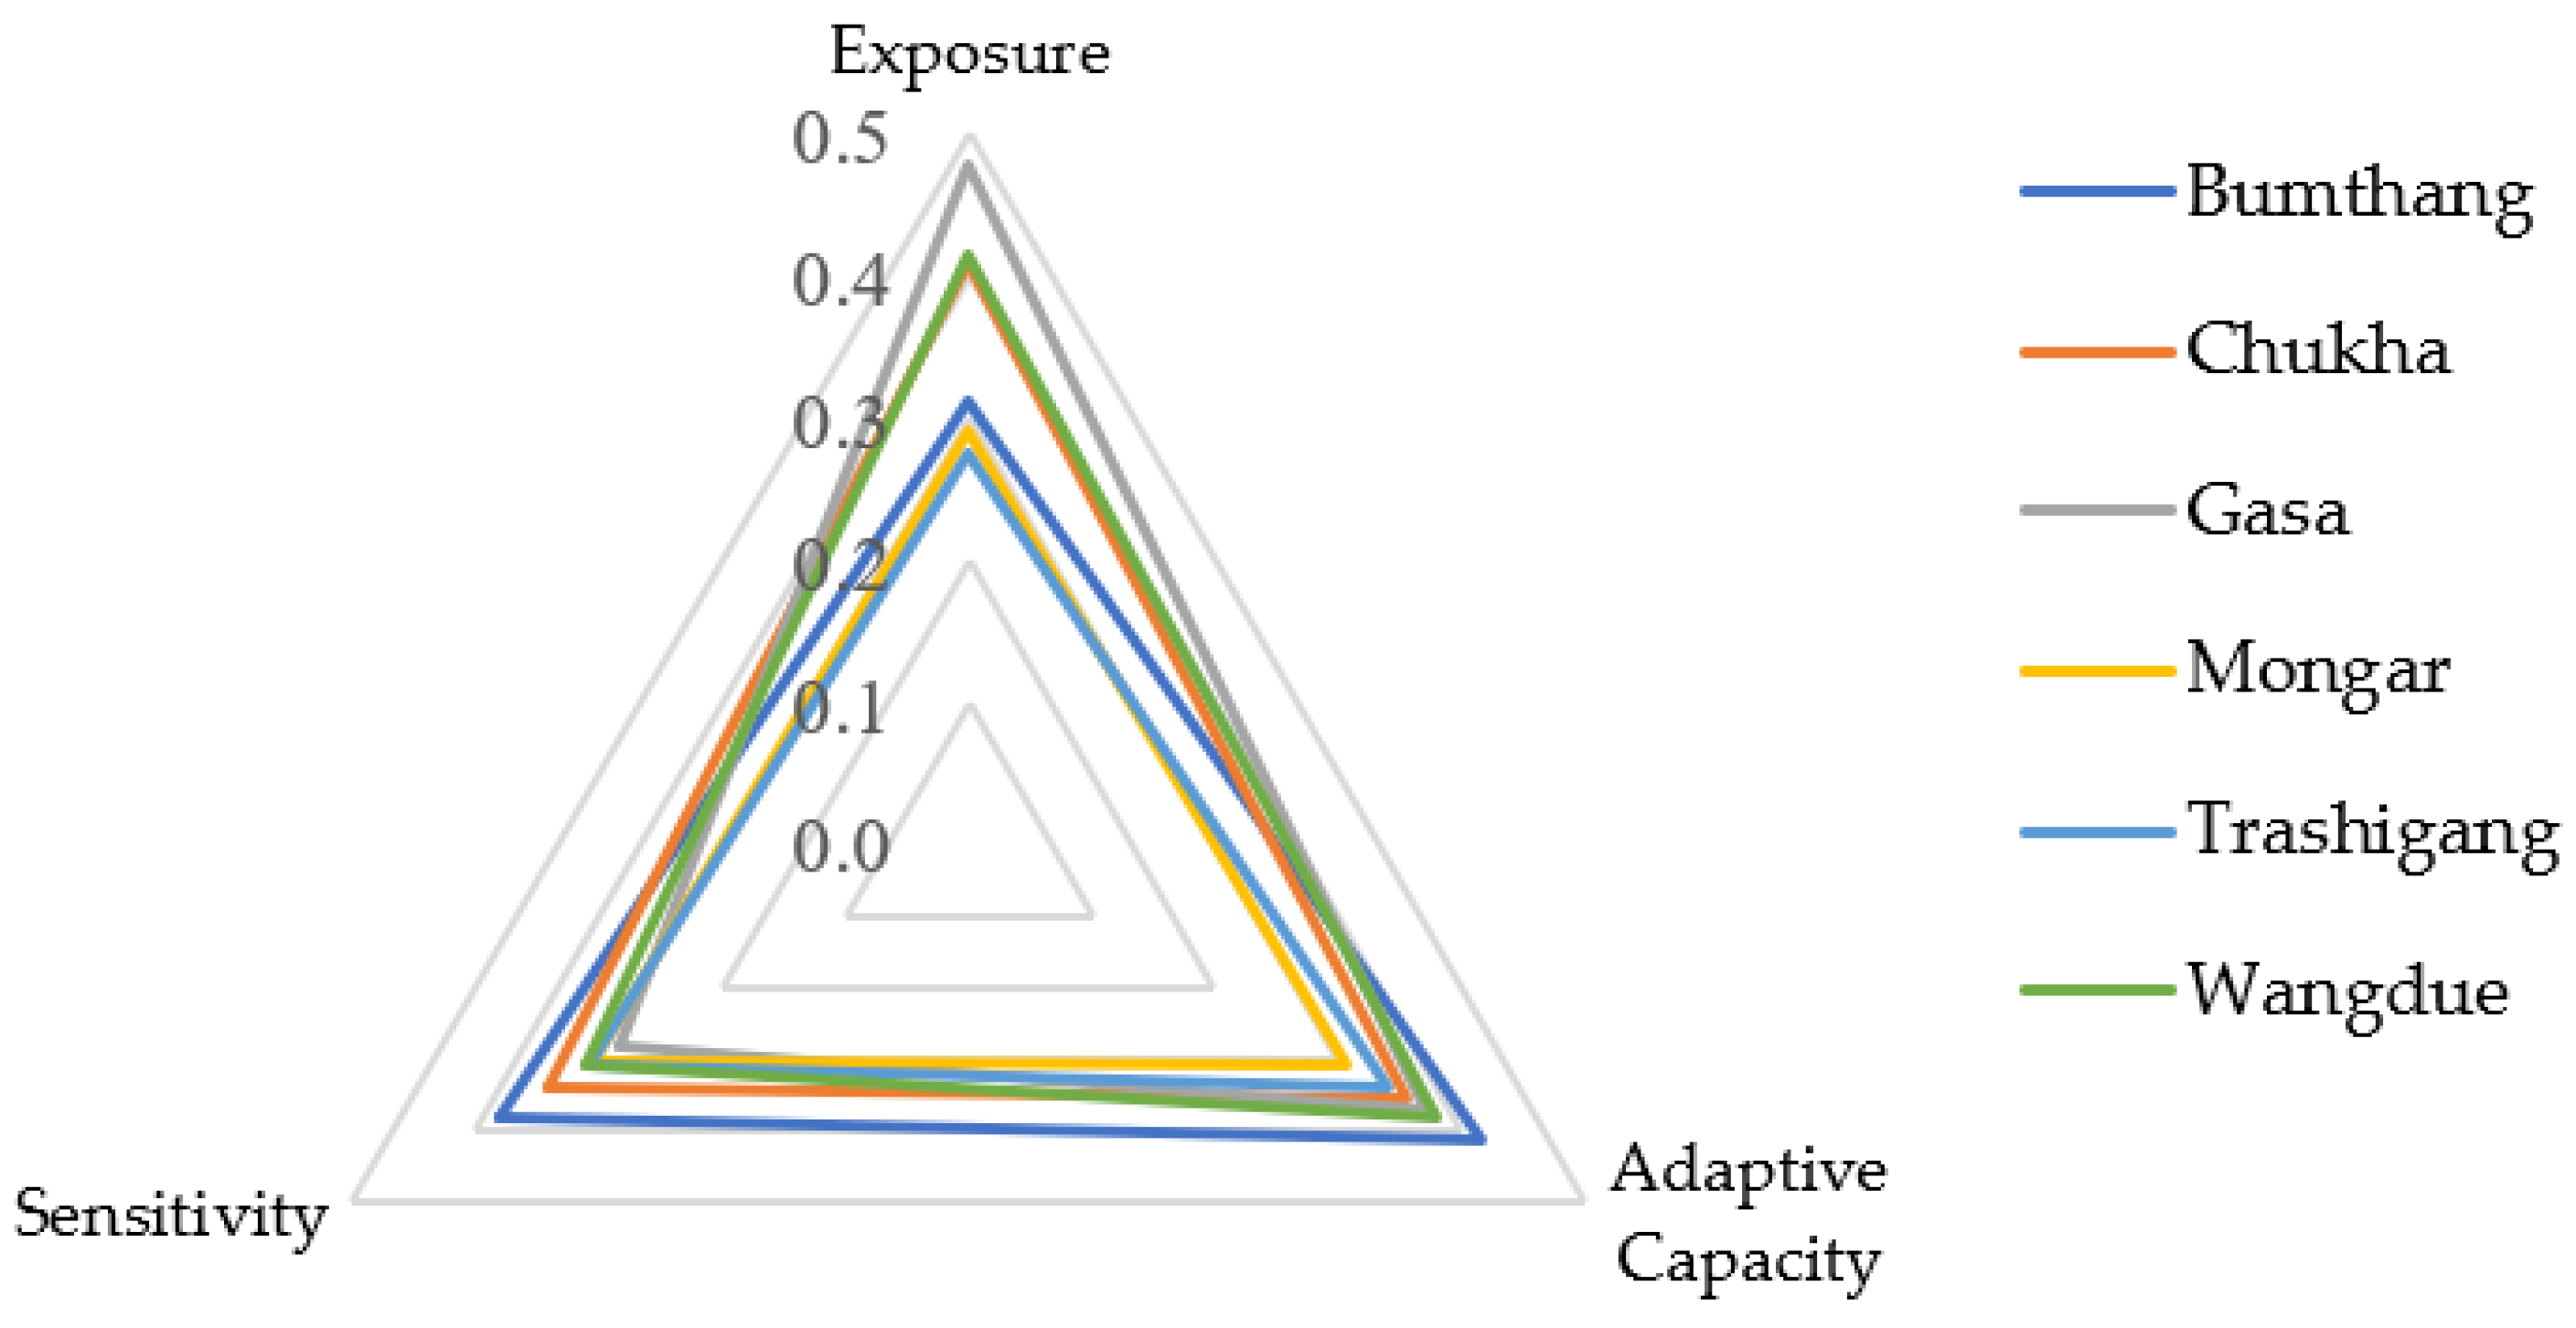
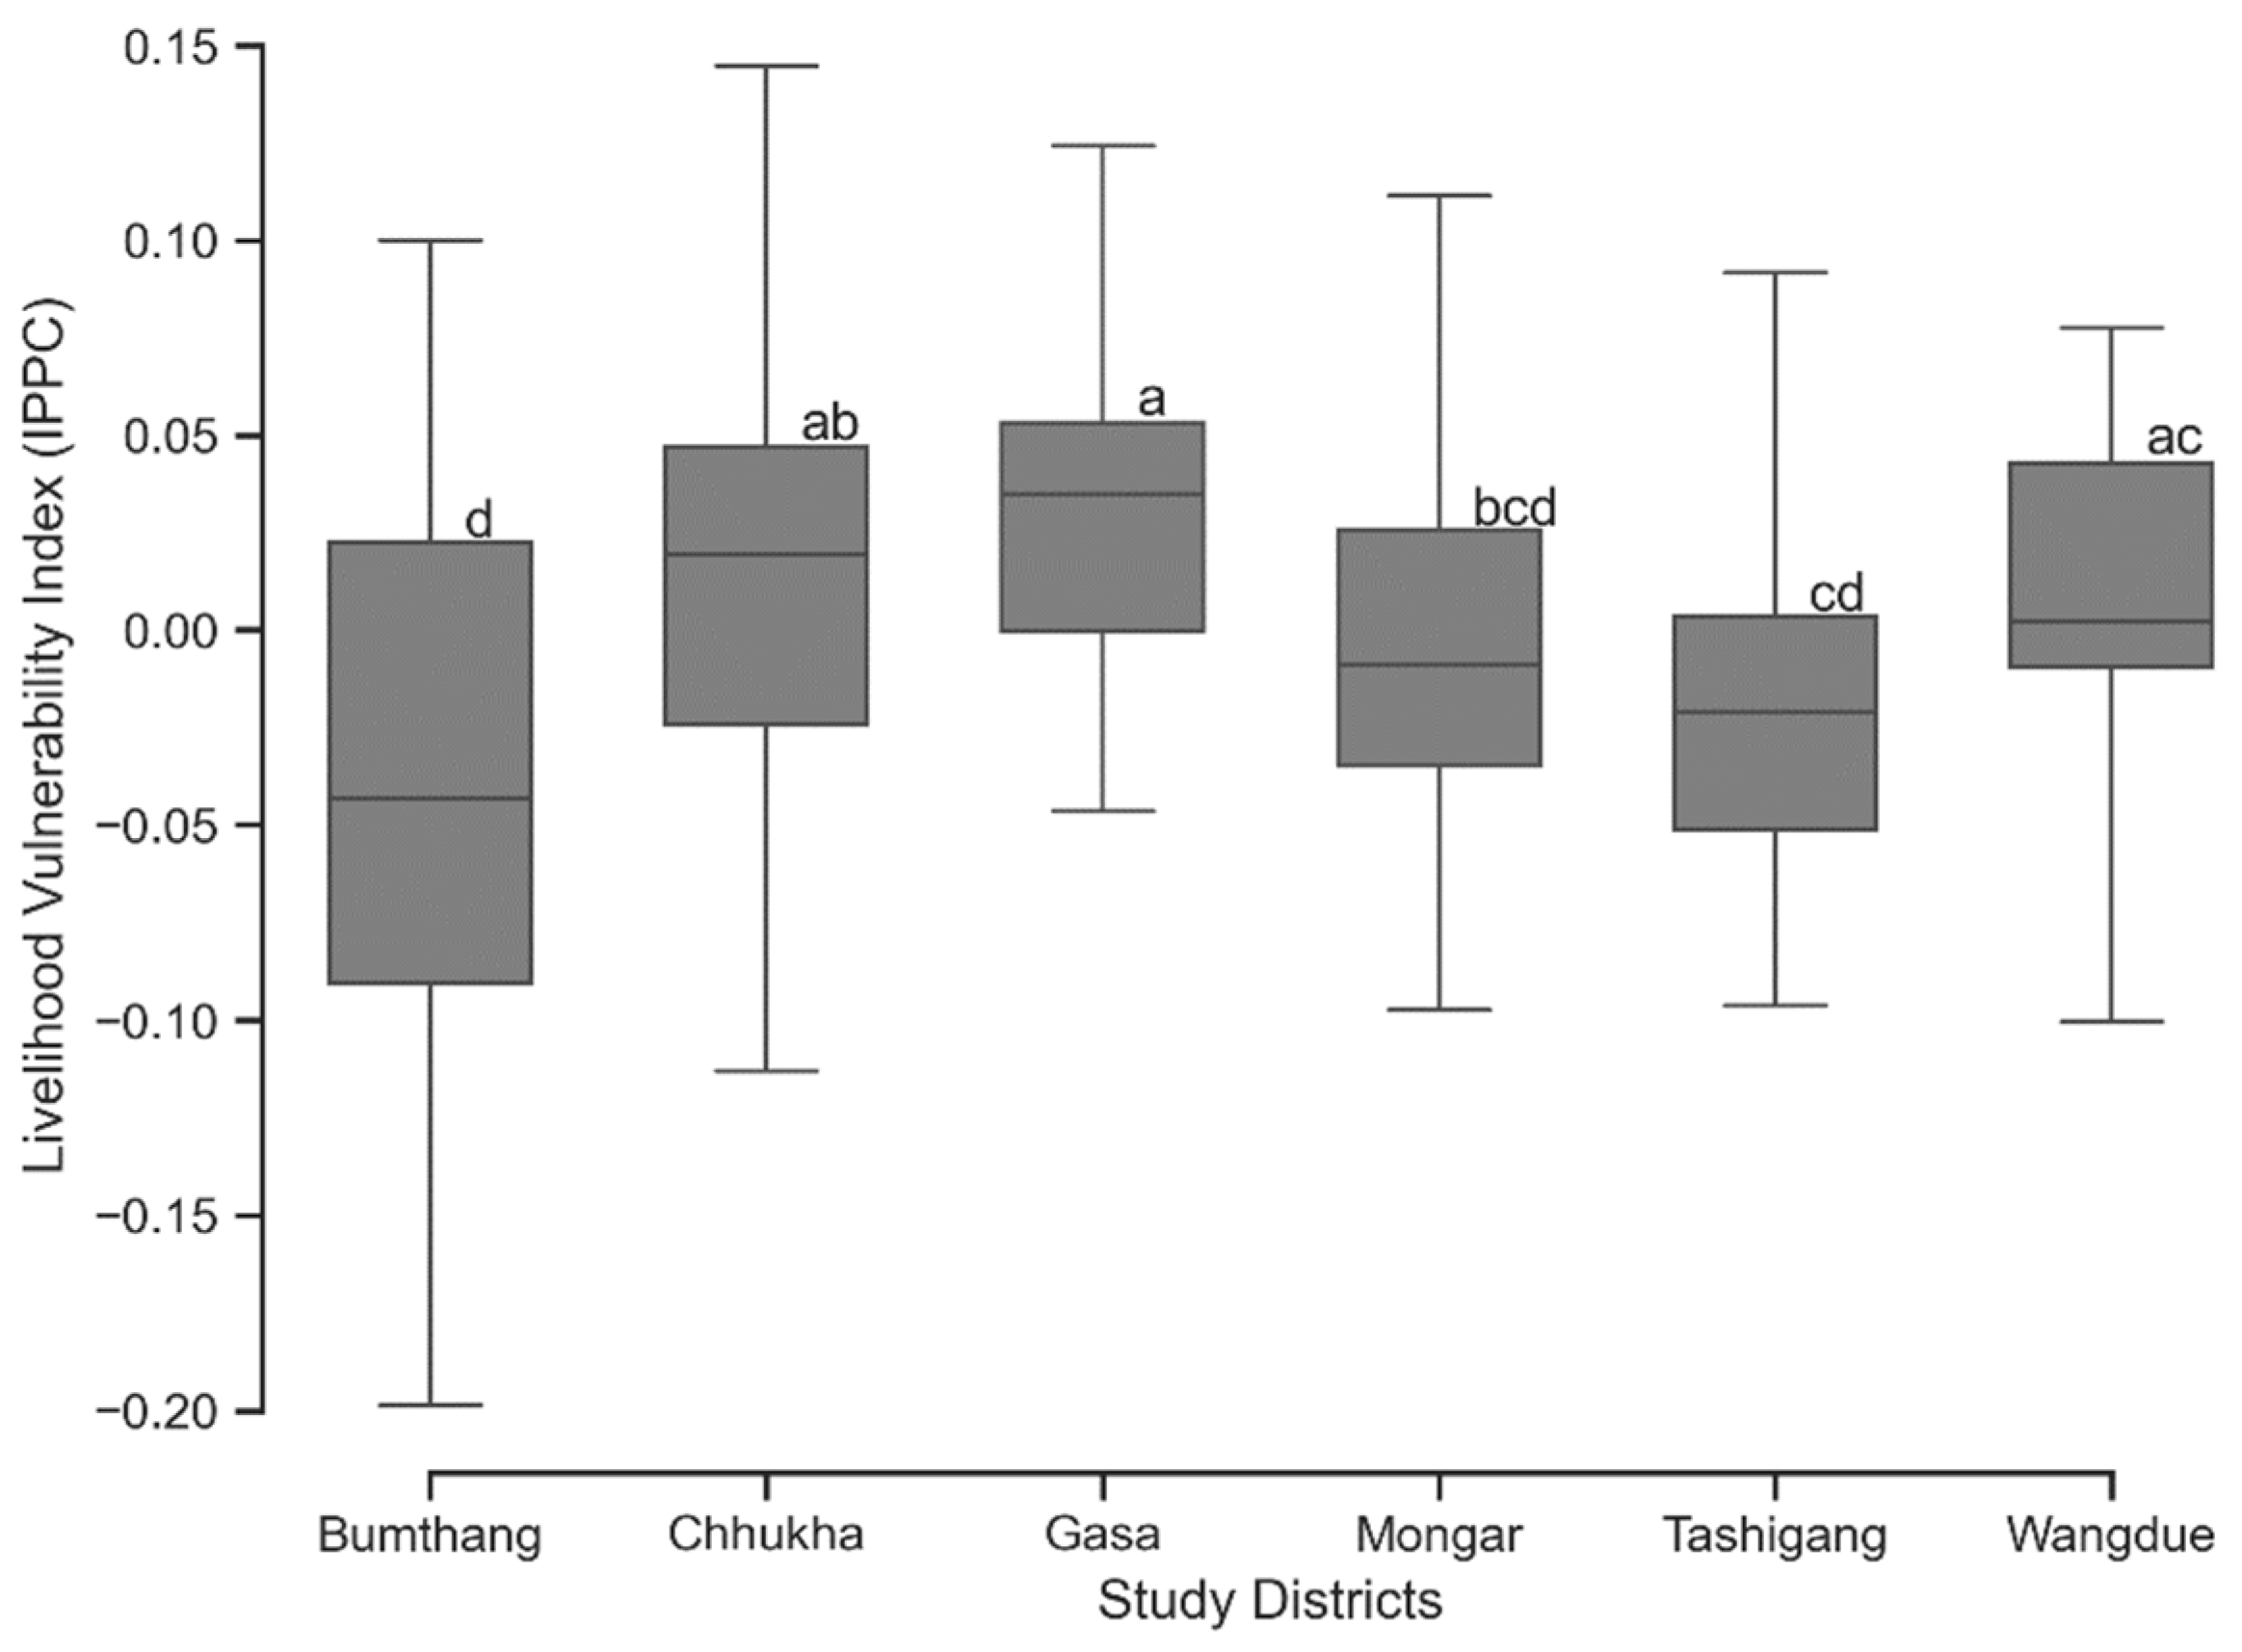
3.3. LVI-IPCC for the Six Study Districts
4. Discussion
4.1. Livelihood Vulnerability Index for the Six Districts
4.1.1. Sociodemographic Profile
4.1.2. Livelihood Strategies
4.1.3. Social Networks
4.1.4. Health
4.1.5. Food
4.1.6. Water
4.1.7. Natural Disasters and Climate Variability
4.2. LVI-IPCC for the Six Study Districts
4.2.1. Exposure
4.2.2. Sensitivity
4.2.3. Adaptive Capacity
5. Conclusions
Author Contributions
Funding
Institutional Review Board Statement
Informed Consent Statement
Data Availability Statement
Acknowledgments
Conflicts of Interest
Appendix A

| Subcomponents for FOOD Major Component | Subcomponent Values for Bumthang | Maximum Subcomponent Value for Study Population | Minimum Subcomponent Value for Study Population | Index Value for Bumthang | Food Major Component Value for Bumthang |
|---|---|---|---|---|---|
| % Households dependent on the family farm for food | 97.50 | 100 | 0 | 0.975 | 0.229 |
| Avg. months of household food shortage | 0.83 | 12 | 0 | 0.069 | |
| Avg. Crop Diversity Index | 0.17 | 1 | 0.125 | 0.053 | |
| % Households not saving crops | 0.00 | 100 | 0 | 0 | |
| % Households not saving seeds | 5.00 | 100 | 0 | 0.050 |
Appendix B
| Contributing Factors | Major Components for Bumthang District | Major Component Values for Bumthang | Number of Subcomponents Per Major Component | Contributing Factor Values | LVI–IPCC Value for Bumthang |
|---|---|---|---|---|---|
| Adaptive capacity | Sociodemographic Profile | 0.403 | 5 | 0.416 | −0.039 |
| Livelihood Strategies | 0.546 | 4 | |||
| Social Networks | 0.302 | 4 | |||
| Sensitivity | Health | 0.256 | 4 | 0.380 | |
| Food | 0.229 | 5 | |||
| Water | 0.588 | 6 | |||
| Exposure | Natural Disasters and Climate Variability | 0.313 | 10 | 0.313 |
References
- NSB. Stastical Year Book of Bhutan; National Statistical Bureau, Royal Government of Bhutan: Thimphu, Bhutan, 2020.
- NSB. Bhutan Living Standards Survey Report; National Statistical Bureau, Royal Government of Bhutan: Thimphu, Bhutan, 2017.
- Katwal, T.B.; Bazile, D. First adaptation of quinoa in the Bhutanese mountain agriculture systems. PLoS ONE 2020, 15, e0219804. [Google Scholar] [CrossRef] [PubMed]
- NSB. Population and Housing Census of Bhutan; National Statistical Bureau, Royal Government of Bhutan: Thimphu, Bhutan, 2017.
- NSB. Poverty Analysis Report; National Statistical Bureau, Royal Government of Bhutan: Thimphu, Bhutan, 2017.
- Shrestha, B.; Arun, D.; Prasad, L. Climate Change in the Eastern Himalayas: Observed Trends and Model Projections; ICIMOD: Kathmandu, Nepal, 2010; p. 20. [Google Scholar]
- Katel, O.N.; Schmidt-Vogt, D.; Dendup, N. Transboundary Water Resources Management in the Context of Global Environmental Change: The Case of Bhutan Himalaya. Manag. Water Resour. Under Clim. Uncertain. 2014, 269–290. [Google Scholar] [CrossRef]
- Subedi, K.; Chhetri, N.B.; Karki, T. Land Use Practices, Cropping Systems and Climate Change Vulnerability to Mountain Agro-Ecosystems of Nepal; Nova Science Publishers, Inc.: Hauppauge, NY, USA, 2016; pp. 103–132. [Google Scholar]
- Tobgay, S.; Mischler, F.; Covarrubias, K.; Zezza, A. Fighting Hunger: The Right to Food Way; FAO: Rome, Italy, 2015. [Google Scholar]
- Shrestha, M.; Goodrich, C.; Udas, P.; Rai, D.; Gurung, M.; Khadgi, V. Flood Early Warning Systems in Bhutan: A Gendered Perspective; ICIMOD: Kathmandu, Nepal, 2016. [Google Scholar]
- Wester, P.; Mishra, A.; Mukherji, A.; Shrestha, A.B. The Hindu Kush Himalaya Assessment: Mountains, Climate Change, Sustainability and People; Springer Nature: Cham, Switzerland, 2019. [Google Scholar]
- NEC. Third National Communication to the UNFCCC; National Environment Commission, Royal Government of Bhutan: Thimphu, Bhutan, 2020.
- NCHM. Analysis of Historical Climate and Climate Change Projection for Bhutan; National Center for Hydrology and Meteorology, Royal Government of Bhutan: Thimphu, Bhutan, 2019; pp. 1–52.
- Chhogyel, N.; Kumar, L.; Bajgai, Y. Spatio-temporal landscape changes and the impacts of climate change in mountainous Bhutan: A case of Punatsang Chhu Basin. Remote Sens. Appl. Soc. Environ. 2020, 18, 100307. [Google Scholar] [CrossRef]
- Hoy, A.; Katel, O.; Thapa, P.; Dendup, N.; Matschullat, J. Climatic changes and their impact on socio-economic sectors in the Bhutan Himalayas: An implementation strategy. Reg. Environ. Chang. 2015, 16, 1401–1415. [Google Scholar] [CrossRef]
- Chhogyel, N.; Kumar, L.; Bajgai, Y. Consequences of Climate Change Impacts and Incidences of Extreme Weather Events in Relation to Crop Production in Bhutan. Sustainability 2020, 12, 4319. [Google Scholar] [CrossRef]
- Chhogyel, N.; Kumar, L.; Bajgai, Y.; Hasan, K. Perception of farmers on climate change and its impacts on agriculture across various altitudinal zones of Bhutan Himalayas. Int. J. Environ. Sci. Technol. 2020, 17, 3607–3620. [Google Scholar] [CrossRef]
- Scoones, I. Livelihoods perspectives and rural development. J. Peasant Stud. 2009, 36, 171–196. [Google Scholar] [CrossRef]
- Chambers, R.; Conway, G. Sustainable Rural Livelihoods: Practical Concepts for the 21st Century; IDS Discussion Paper: London, UK, 1992; p. 296. [Google Scholar]
- Novienyo, L.; Simatele, M. Food Security and Coping Strategies of Rural Household Livelihoods to Climate Change in the Eastern Cape of South Africa. Front. Sustain. Food Syst. 2021, 5, 692185. [Google Scholar]
- O’Brien, K.; Eriksen, S.; Nygaard, L.P.; Schjolden, A.N.E. Why different interpretations of vulnerability matter in climate change discourses. Clim. Policy 2007, 7, 73–88. [Google Scholar] [CrossRef]
- Ford, J.D.; Keskitalo, E.C.H.; Smith, T.; Pearce, T.; Berrang-Ford, L.; Duerden, F.; Smit, B. Case study and analogue methodologies in climate change vulnerability research. WIREs Clim. Chang. 2010, 1, 374–392. [Google Scholar] [CrossRef]
- Basu, J.P. Climate Change Vulnerability and Communities in Agro-climatic Regions of West Bengal, India; Springer Nature: Cham, Switzerland, 2021. [Google Scholar] [CrossRef]
- Sachs, J. The end of poverty: Economic possibilities for our time. Eur. J. Dent. Educ. 2008, 12, 17–21. [Google Scholar] [CrossRef]
- Dercon, S.; Krishnan, P. Vulnerability, seasonality and poverty in Ethiopia. J. Dev. Stud. 2000, 36, 25–53. [Google Scholar] [CrossRef]
- Sujakhu, N.M.; Ranjitkar, S.; He, J.; Schmidt-Vogt, D.; Su, Y.; Xu, J. Assessing the Livelihood Vulnerability of Rural Indigenous Households to Climate Changes in Central Nepal, Himalaya. Sustainability 2019, 11, 2977. [Google Scholar] [CrossRef]
- Habtezion, S. Overview of Linkages between Gender and Climate Change—Policy Brief (Africa); UNDP: New York, NY, USA, 2012. [Google Scholar]
- Mbow, C.; Rosenzweig, C.; Barioni, L.G.; Benton, T.G.; Herrero, M.; Krishnapillai, M.; Liwenga, E.; Pradhan, P.; Rivera-Ferre, M.G.; Sapkota, T.; et al. Food Security. In Climate Change and Land: An IPCC Special Report on Climate Change, Desertification, Land Degradation, Sustainable Land Management, Food Security, and Greenhouse Gas Fluxes in Terrestrial Ecosystems; Intergovernmental Panel on Climate Change: Geneva, Switzerland, 2019. [Google Scholar]
- World Bank. Turn Down the Heat: Confronting the New Climate Normal; World Bank: Washington, DC, USA, 2014. [Google Scholar]
- IPCC. Contribution of Working Group I to the Fifth Assessment Report of the Intergovernmental Panel on Climate Change. In Climate Change 2013: The Physical Science Basis; Intergovernmental Panel for Climate Change, Cambridge University Press: Cambridge, NY, USA, 2013; pp. 3–29. [Google Scholar]
- Mbah, E. Use of Indigenous Knowledge as a Strategy for Climate Change Adaptation among Farmers in sub-Saharan Africa: Implications for Policy. Asian J. Agric. Ext. Econ. Sociol. 2013, 2, 23–40. [Google Scholar]
- IPCC. Climate Change: Impacts, Adaptation and Vulnerability. Contribution of Working Group II to the Fourth Assessment Report of the Intergovernmental Panel on Climate Change, in Climate Change 2007: The Physical Science Basis; Parry, O.F., Palutikof, J.P., van der Linden, P.J., Hanson, C.E., Eds.; Inter Governmental Panel for Climate Change, Cambridge University Press: Cambridge, UK, 2007. [Google Scholar]
- Shah, K.U.; Dulal, H.B.; Johnson, C.; Baptiste, A. Understanding livelihood vulnerability to climate change: Applying the livelihood vulnerability index in Trinidad and Tobago. Geoforum 2013, 47, 125–137. [Google Scholar] [CrossRef]
- Ofori, S.A.; Cobbina, S.J.; Obiri, S. Climate Change, Land, Water, and Food Security: Perspectives from Sub-Saharan Africa. Front. Sustain. Food Syst. 2021, 5, 680924. [Google Scholar] [CrossRef]
- IPCC. Mitigaton of Climate Change "Contribution of Working Group III to the Fifth Assessment Report of the Intergovernmental Panel on Climate Change, in Fifth Assessment Report of the Intergovernmental Panel on Mitigation of Climate Change; Edenhofer, O., Pichs-Madruga, R., Sokona, Y., Farahani, E., Kadner, S.K., Seyboth, A.A., Baum, I., Brunner, S., Eickemeier, P., Kriemann, B., et al., Eds.; Intergovernmental Panel for Climate Change, Cambridge University Press: Cambridge, UK; New York, NY, USA, 2014. [Google Scholar]
- Adu, D.T.; Kuwornu, J.K.; Anim-Somuah, H.; Sasaki, N. Application of livelihood vulnerability index in assessing smallholder maize farming households’ vulnerability to climate change in Brong-Ahafo region of Ghana. Kasetsart J. Soc. Sci. 2018, 39, 22–32. [Google Scholar] [CrossRef]
- Ringler, C.; Zhu, T.; Cai, X.; Koo, J.; Wang, D. Climate Change Impacts on Food Security in Sub-Saharan Africa: Insights from Comprehensive Climate Change Scenarios; IFPRI: Washington, DC, USA, 2010. [Google Scholar]
- Ncube, M.; Madubula, N.; Ngwenya, H.; Mthunzi, T.; Madzivhandila, T.; Zinyengere, N.; Olivier, C.; Zhou, L.; Francis, J. Climate change, household vulnerability and smart agriculture: The case of two South African provinces: Original research. Jamba J. Disaster Risk Stud. 2016, 8, 1–14. [Google Scholar] [CrossRef]
- Harvey, C.A.; Rakotobe, Z.L.; Rao, N.S.; Dave, R.; Razafimahatratra, H.; Rabarijohn, R.H.; Rajaofara, H.; MacKinnon, J.L. Extreme vulnerability of smallholder farmers to agricultural risks and climate change in Madagascar. Philos. Trans. R. Soc. B Biol. Sci. 2014, 369, 20130089. [Google Scholar] [CrossRef]
- Cruz, R.; Harasawa, H.; Lal, M.; Wu, S.; Anokhin, Y.; Punsalmaa, B.; Honda, Y.; Jafari, M.; Li, C.; Ninh, N. Asia Climate Change 2007: Impacts, Adaptation and Vulnerability; Contribution of Working Group II to the Fourth Assessment Report of the Intergovernmental Panel on Climate Change; Cambridge University Press: Cambridge, UK, 2007; pp. 469–506. [Google Scholar]
- Kumar, K.K.; Patwardhan, S.K.; Kulkarni, A.; Kamala, K.; Rao, K.K.; Jones, R. Simulated projections for summer monsoon climate over India by a high-resolution regional climate model (PRECIS). Curr. Sci. 2011, 101, 312–326. [Google Scholar]
- Daloz, A.; Rydsaa, J.; Hodnebrog, Ø.; Sillmann, J.; van Oort, B.; Mohr, C.W.; Agrawal, M.; Emberson, L.; Stordal, F.; Zhang, T. Direct and indirect impacts of climate change on wheat yield in the Indo-Gangetic plain in India. J. Agric. Food Res. 2021, 4, 100132. [Google Scholar] [CrossRef]
- Kumar, R.; Gautam, H. Climate Change and its Impact on Agricultural Productivity in India. J. Climatol. Weather. Forecast. 2014, 109, 2. [Google Scholar] [CrossRef]
- Karki, M.; Mool, P.; Shrestha, A. Climate Change and its Increasing Impacts in Nepal. Initiation 1970, 3, 30–37. [Google Scholar] [CrossRef]
- Ayers, S.H.J. Climate Change Impacts and Responses in Bangladesh; International Institute for Environment and Development: London, UK, 2008. [Google Scholar]
- Rahaman, M. Climate Change Impact and Response: Experience from Satkhira, Bangladesh; Center for People and Environ: Dhaka, Bangladesh, 2019. [Google Scholar]
- Rabbani, G.; Rahman, A.A.; Shoef, I.J.; Khan, Z.M. Climate Change and Food Security in Vulnerable Coastal Zones of Bangladesh; Springer: Berlin, Germany, 2015; pp. 173–185. [Google Scholar] [CrossRef]
- Katwal, T.B.; Dorji, S.; Dorji, R.; Tshering, L.; Ghimiray, M.; Chhetri, G.B.; Dorji, T.Y.; Tamang, A.M. Community Perspectives on the On-Farm Diversity of Six Major Cereals and Climate Change in Bhutan. Agriculture 2015, 5, 2–16. [Google Scholar] [CrossRef]
- Roder, W.; Nidup, K.; Chettri, G.B. The Potato in Bhutan; Bhutan Potato Development Program, Department of Agriculture, Ministry of Agriculture and Forests: Thimphu, Bhutan, 2008.
- Bajgai, Y.; Dochen, T.; Wangchuk, P.; Kadian, S.; Felde, T.; Lefebvre, M.; Lobzang; Arya, S.; Sangay, S.; Wangdi, T.; et al. Participatory Varietal Selection of Potato and Agronomic Performance with Farmers’ Feedback on New Varieties; Department of Agriculture, Ministry of Agriculture: Thimphu, Bhutan, 2018.
- Rai, P.; Bajgai, Y.; Lhadon, T.; Lobzang, L.; Sangay, S. Productivity and preferences of new potato varieties and their relationships in five districts of Bhutan. Bhutanese J. Agric. 2021, 4, 11–27. [Google Scholar]
- RSD. Major Crops Auctioned by FCBL in 2019; Research and Statistics Division, Ministry of Agriculture and Forest: Thimphu, Bhutan, 2020.
- Roder, W.; Nidup, K.; Wangdi, S. Marketing Bhutanese Potato—Experiences, Challenges and Opportunities; Department of Agriculture, Ministry of Agriculture and Forests: Thimphu, Bhutan, 2007.
- Roder, W. Are Mountain Farmers Slow to Adopt New Technologies? Mt. Res. Dev. 2009, 34, 114–118. [Google Scholar] [CrossRef]
- Parker, L.; Than, N.; Nguyen, T.; Rinzin, C.; Tashi, D.; Wangchuk, D.; Bajgai, Y.; Subedi, K.; Phuntsho, L.; Thinley, N.; et al. Climate Change Impacts in Bhutan: Challenges and Opportunities for the Agricultural Sector Working Paper No. 191; CGIAR: Wageningen, The Netherlands; Montpellier, France, 2017. [Google Scholar]
- NCHM. Climate Data Book of Bhutan; National Center for Hydrology and Meteorology, Royal Government of Bhutan: Thimphu, Bhutan, 2018.
- RSD. RNR Census of Bhutan; Ministry of Agriculture and Forests: Thimphu, Bhutan, 2019.
- Baarda, B.; Hidajattoellah, D. Research. In This is it! Guidelines How to Design, Perform and Evaluate Quantitative and Qualitative Research, 2nd ed.; Noordhoff Uitgevers bv: Groningen, The Netherlands, 2014. [Google Scholar]
- Fowler, F.J. Survey Research Methods, 4th ed.; SAGE Publications, Inc.: Thousand Oaks, CA, USA, 2009. [Google Scholar]
- James, B.E.; Joe, W.K.; Chadwick, C.H. Organizational Research: Determining appropriate sample size in survey research. Inf. Technol. Learn. Perform. J. 2001, 19, 43–50. [Google Scholar]
- Hahn, M.B.; Riederer, A.M.; Foster, S.O. The Livelihood Vulnerability Index: A pragmatic approach to assessing risks from climate variability and change—A case study in Mozambique. Glob. Environ. Chang. 2009, 19, 74–88. [Google Scholar] [CrossRef]
- Suryanto, S.; Rahman, A. Application of livelihood vulnerability index to assess risks for farmers in the Sukoharjo Regency and Klaten Regency, Indonesia. Jamba 2019, 11, 739. [Google Scholar] [CrossRef]
- Panwar, P.; Bhatt, V.; Pal, S.; Loria, N.; Alam, N.M.; Sharma, N.K.; Mishra, P. Vulnerability of agricultural households to climate change in hill state of north Western Himalaya. Mausam 2020, 71, 199–208. [Google Scholar]
- UNDP. Human Development Report 2007/2008: Fighting Climate Change: Human Solidarity in A Divided World. Available online: http://lst-iiep.iiep-unesco.org/cgi-bin/wwwi32.exe/[in=epidoc1.in]/?t2000=024938/(100) (accessed on 6 August 2021).
- Sullivan, G.M.; Artino, A.R., Jr. Analyzing and Interpreting Data from Likert-Type Scales. J. Grad. Med. Educ. 2013, 5, 541–542. [Google Scholar] [CrossRef]
- Epule, T.E.; Chehbouni, A.; Dhiba, D.; Etongo, D.; Driouech, F.; Brouziyne, Y.; Peng, C. Vulnerability of maize, millet, and rice yields to growing season precipitation and socio-economic proxies in Cameroon. PLoS ONE 2021, 16, e0252335. [Google Scholar] [CrossRef] [PubMed]
- McKight, P.; Najab, J. Kruskal-Wallis Test. In The Corsini Encyclopedia of Psychology; John Wiley and Sons, Inc.: Hoboken, NJ, USA, 2010. [Google Scholar]
- Delmo, J.; Refugio, C. Empirical Research on Mann-Whitney U-Test; Negros Oriental State University: Dumaguete, Philippines, 2018. [Google Scholar]
- de Janvry, A.; Sadoulet, E. Income Strategies Among Rural Households in Mexico: The Role of Off-farm Activities. World Dev. 2001, 29, 467–480. [Google Scholar] [CrossRef]
- World Bank. Poverty, Vulnerability and Welfare in Bhutan: Progress and Challenges; World Bank: Washington, DC, USA, 2019. [Google Scholar]
- Rahut, D.B.; Mottaleb, K.; Ali, A. Rural Livelihood Diversification Strategies and Household Welfare in Bhutan. Eur. J. Dev. Res. 2017, 30, 718–748. [Google Scholar] [CrossRef]
- Sariyev, O.; Loos, T.K.; Zeller, M.; Gurung, T. Women in household decision-making and implications for dietary quality in Bhutan. Agric. Food Econ. 2020, 8, 13. [Google Scholar] [CrossRef]
- Lanjouw, J.; Lanjouw, P. The Rural Non-Farm Sector: Issues and Evidence from Developing Countries. Agric. Econ. 2001, 26, 1–23. [Google Scholar] [CrossRef]
- Pandey, R. Male out-migration from the Himalaya: Implications in gender roles and household food (in)security in the Kaligandaki Basin, Nepal. Migr. Dev. 2019, 10, 313–341. [Google Scholar] [CrossRef]
- Sandhu, H.; Sandhu, S. Poverty, development, and Himalayan ecosystems. Ambio 2014, 44, 297–307. [Google Scholar] [CrossRef]
- MOWHS. Infrastructure Development in Bhutan: A Journey Through Time; Ministry of Works and Human Settlements: Thimphu, Bhutan, 2015.
- Chambers, R.; Pacey, A.; Thrupp, L.A. Farmer first: Farmer Innovation and Agricultural Research; Public Administration and Development, Intermediate Technology Publications: Southampton, UK, 1989; Volume 10, pp. 474–475. [Google Scholar]
- Thompson, J.; Scoones, I. Addressing the dynamics of agri-food systems: An emerging agenda for social science research. Environ. Sci. Policy 2009, 12, 386–397. [Google Scholar] [CrossRef]
- Maredia, M.K.; Shankar, B.; Kelley, T.G.; Stevenson, J.R. Impact assessment of agricultural research, institutional innovation, and technology adoption: Introduction to the special section. Food Policy 2014, 44, 214–217. [Google Scholar] [CrossRef]
- Dendup, T. Agricultural Transformation in Bhutan: From Peasants to Entrepreneurial Farmers. Asian J. Agric. Extension, Econ. Sociol. 2018, 23, 1–8. [Google Scholar] [CrossRef]
- Tran, T.; Tuyen, T.; Tran, N.; Nguyen, H. The Role of Education in the Livelihood of Households in the Northwest Region; Educational Research for Policy and Practice; Springer Link: Berlin, Germany, 2020; p. 19. [Google Scholar]
- Thomas, D.; Osbahr, H.; Twyman, C.; Adger, W.; Hewitson, B. ADAPTIVE: Adaptations to Climate Change Amongst Natural Resource-Dependant Societies in the Developing World: Across the Souther African Climate Gradient; Tyndall Centre for Climate Change Research: Norwich, UK, 2005. [Google Scholar]
- Wiesinger, G. The importance of social capital in rural development, networking and decision-making in rural areas. J. Alp. Res. 2007, 43–56. [Google Scholar] [CrossRef]
- Williams, P.A.; Crespo, O.; Abu, M. Assessing vulnerability of horticultural smallholders’ to climate variability in Ghana: Applying the livelihood vulnerability approach. Environ. Dev. Sustain. 2018, 22, 2321–2342. [Google Scholar] [CrossRef]
- Thinley, S.; Tshering, P.; Wangmo, K.; Wangmo, K.; Wangchuk, N.; Dorji, T.; Tobgay, T.; Sharma, J. The Kingdom of Bhutan Health System Review; Health Systems in Transition; World Health Organization. Regional Office for South-East Asia: New Delhi, India, 2017; Volume 7.
- Hauc, S.C.; Tshering, D.; Feliciano, J.; Atayde, A.M.P.; Aboukhater, L.; Dorjee, K.; Dukpa, T.; Rinchen, P.; Yoezer, N.; Luc, C.M.; et al. Evaluating the effect of village health workers on hospital admission rates and their economic impact in the Kingdom of Bhutan. BMC Public Health 2020, 20, 1–7. [Google Scholar] [CrossRef] [PubMed]
- Edame, E.G.; Ekpenyong, A.; William, F.; Duru, E. Climate change, food security and agricultural productivity in Africa: Issues and policy directions. Int. J. Humanit. Soc. Sci. 2011, 1, 205–223. [Google Scholar]
- Tobgay, S. Agriculture Diversification in Bhutan; Department of Agriculture and Marketing Cooperatives, Ministry of Agriculture and Forests: Thimphu, Bhutan, 2006.
- Dzed, H.P.P.L. Chandralal Mongar, Loday Zangpo Addressing micronutrient gaps to reduce anaemia in Bhutan’s young children: Early experiences in home fortification. Nutr. Exch. Asia 2020, 2, 11. [Google Scholar]
- Atwood, S.; Nagpal, S.; Mbuya, N.; Laviolette, L. Nutrition in Bhutan: Situational Analysis and Policy Recommendations; World Bank: Washington, DC, USA, 2014; p. 20433. [Google Scholar]
- Aguayo, V.M.; Badgaiyan, N.; Dzed, L. Determinants of child wasting in Bhutan. Insights from nationally representative data. Public Health Nutr. 2016, 20, 315–324. [Google Scholar] [CrossRef]
- GNHC. Food and Nutrition Security Policy of the Kingdom of Bhutan; GNHC: Thimphu, Bhutan, 2014. [Google Scholar]
- Merz, J.; Nakarmi, G.; Shrestha, S.K.; Dahal, B.M.; Dangol, P.M.; Dhakal, M.P.; Dongol, B.S.; Sharma, S.; Shah, P.B.; Weingartner, R. Water: A Scarce Resource in Rural Watersheds of Nepal’s Middle Mountains. J. Mt. Res. Dev. 2003, 9, 41–49. [Google Scholar] [CrossRef]
- Rana, A.; Dua, V.K.; Chauhan, S.; Sharma, J. Climate Change and Potato Productivity in Punjab—Impacts and Adaptation. Potato Res. 2020, 63, 597–613. [Google Scholar] [CrossRef]
- Raymundo, R.; Asseng, S.; Robertson, R.; Petsakos, A.; Hoogenboom, G.; Quiroz, R.; Hareau, G.; Wolf, J. Climate change impact on global potato production. Eur. J. Agron. 2018, 100, 87–98. [Google Scholar] [CrossRef]
- Gornall, J.; Betts, R.; Burke, E.; Clark, R.; Camp, J.; Willett, K.; Wiltshire, A. Implications of climate change for agricultural productivity in the early twenty-first century. Philos. Trans. R. Soc. B Biol. Sci. 2010, 365, 2973–2989. [Google Scholar] [CrossRef] [PubMed]
- Lhendup, P.; Wikramanayake, E.; Freeman, S.; Sindorf, N.; Gyeltshen, K.; Forrest, J. Climate Change Variability Assessment of Wangchuk Centennial Park; WWF-Bhutan Program Office: Thimphu, Bhutan, 2011. [Google Scholar]
- Devkota, L.; Zhang, F. Climate Change in the Eastern Himalayas: Observed Trends and Model Projections; AGU Fall Meeting Abstracts: Washington, DC, USA, 2010. [Google Scholar]
- Levaque, L. Disaster Management Analysis in Bhutan; Department of Disaster Management, Ministry of Home Affairs: Thimphu, Bhutan, 2005.
- Pilli-Sihvola, K.; Namgyal, P.; Dorji, C. Socio-Economic Study on Improved Hydro-Meteorological Services in the Kingdom of Bhutan; National Center for Hydrology and Meteorology, Royal Government of Bhutan: Thimphu, Bhutan, 2014.
- Malhotra, S. Horticultural Crops and Climate Change: A Review; Ministry of Agriculture and Farmers Welfare, Government of India: New Delhi, India, 2017; Volume 87, pp. 12–22.
- Wangchuk, S.; Siebert, S.F. Agricultural Change in Bumthang, Bhutan: Market Opportunities, Government Policies, and Climate Change. Soc. Nat. Resour. 2013, 26, 1375–1389. [Google Scholar] [CrossRef]
- Antwi-Agyei, P.; Dougill, A.; Fraser, E.D.G.; Stringer, L. Characterizing the nature of household vulnerability to climate variability: Empirical evidence from two regions of Ghana. Environ. Dev. Sustain. 2012, 15, 903–926. [Google Scholar] [CrossRef]
- Magnani, N.; Struffi, L. Translation Sociology and Social Capital in Rural Development Initiatives. A Case Study from the Italian Alps. J. Rural. Stud. 2009, 25, 231–238. [Google Scholar] [CrossRef]
- Eakin, H.; A Bojórquez-Tapia, L. Insights into the composition of household vulnerability from multicriteria decision analysis. Glob. Environ. Chang. 2008, 18, 112–127. [Google Scholar] [CrossRef]
- Rivera, M.; Knickel, K.; Puente, J.M.D.; Afonso, A. The Role of Social Capital in Agricultural and Rural Development: Lessons Learnt from Case Studies in Seven Countries. Sociol. Rural. 2018, 59, 66–91. [Google Scholar] [CrossRef]


| Major Component | Subcomponents | Explanation of Subcomponents | Sources |
|---|---|---|---|
| Sociodemographic Profile (SDP) | Dependency ratio | Ratio of the population under 15 and over 65 years of age (inactive population) to the population between 15 and 65 years of age (active population) | [61] |
| % Households, female-headed | Percentage of female-headed households during the time of the interview | [61] | |
| Avg. age of head of household | Average age of the heads of households | ||
| % Households where the head of household has not attended school | Percentage of households where the head of the household (female/male) reports that they have attended 0 years of school. | [61] | |
| % Households with at least one orphan | Percentage of households with at least 1 orphan living in their home (orphans are children below 18 years old who have lost either one or both parents) | [61] | |
| Livelihood Strategies (LS) | % Households with family working outside community/country | Percentage of households that report at least 1 family member working outside of the community for their primary work activity and earning a wage | [61] |
| % Households dependent on agriculture for income | Percentage of households that report only agriculture as a source of income | ||
| % Households without incoming remittances | Percent of households who do not receive remittances | ||
| Avg. agriculture livelihood diversification index | The additional livelihood activities undertaken by households, calculated as the inverse of the number of agriculture livelihood activities (+1) reported by a household (e.g., a household that cultivates potato as the main crop and also cultivates vegetables for sale, and collects mushrooms from forests will have a Livelihood Diversification Index = 1/ (3 + 1) = 0.25) | [61] & modified | |
| Social Networks(SN) | Avg. help received/given ratio, in-kind | The ratio of the number of types of help received by a household in the past month (+1) to the number of types of help given by a household to someone else in the past month (+1) (e.g., help received during the sale of crops divided by the help given during times of need/emergency) | [61] |
| Avg. money borrowing/lending ratio | The ratio of a household borrowing money (in the past month) to a household lending money (in the past month) (e.g., if a household borrowed money but did not lend money, the ratio is 2:1 or 2; if a household lent money but did not borrow any, the ratio is 1:2 or 0.5) | ||
| % Households with poor neighbor relations | Percentage of households reporting to have poor relations with their neighbors | ||
| % Households with no recent local government assistance | Percentage of households that reported they had not asked their local government for any assistance in the past 12 months | [61] | |
| Health | Avg. time to the nearest health facility (Basic Health Unit) | The average time taken by the households to get to the nearest health facility on foot | [61] & modified |
| % Households with a family member with chronic illness | Percentage of households that report at least 1 family member with chronic illness, where ‘chronic illnesses’ was defined subjectively by respondents | ||
| % Households with a recent dreadful disease | Percentage of households that report at least 1 family member with a dreadful disease, where ‘dreadful disease’ was defined subjectively by respondent | ||
| % Households attending no recent health awareness programs | Percentage of households reporting that no family member attended any health awareness programs in the past 12 months | [61] | |
| Food | % Households dependent on the family farm for food | Percentage of households reporting that they depend solely on the family farm for their food | |
| Avg. months of household food shortage | The average number of months households face food shortage for their family members | modified (note: ‘food shortage’ does not reflect household ‘food insufficiency’) | |
| Avg. Crop Diversity Index | Calculated as the inverse of the number of crops grown by a household (+1) (e.g., a household that grows pumpkin, maize, chili, and beans will have a Crop Diversity Index = 1/ (4 + 1) = 0.2) | ||
| % Households not saving crops | Percentage of households that report that they do not save crops | ||
| % Households not saving seeds | Percentage of households that report that they do not save seeds for next seasons | ||
| Water | % Households reporting water conflicts | Percentage of households reporting having conflicts over water in their community | |
| % Households reporting watershortage for farming | Percentage of households reporting having water shortage in their community | ||
| % Households utilizing natural primary water source | Percentage of households reporting utilization of water through a natural source (spring, river/stream) | ||
| Avg. walking time to a water source | The average time it takes the households to travel to their primary water source | ||
| % Households with inconsistent water supply | Percentage of households reporting that they do not have consistent water supply | ||
| % Households with recent drying up of water sources | Percentage of households reporting increasing drying up of water sources | ||
| Natural Disasters and Climate Variability(NDCV) | % Households not receiving natural disaster warnings | Percentage of households reporting not receiving any warnings prior to natural disasters | |
| % Households with recent natural-disaster-related injury | Percentage of households reporting an injury due to natural disasters in the past 12 months | ||
| % Households reporting recent production-reducing crop, pest, or disease outbreak | Percentage of households reporting crop, pest or disease outbreak that affected their crop production in the past 5 years | ||
| % Households reporting more storms affecting crops recently | Percentage of households reporting increasing occurrences of hailstorm and affecting their crop production in their community in the past 5 years | ||
| % Households reporting recentcrop yield decline | Percentage of households reporting a decline in crop yield in their community in the past 5 years | ||
| % Households reporting increasing occurrences of natural hazards (landslides and flashflood) | Percentage of households reporting increasing occurrences of natural hazards affecting crop production in the past 5 years | ||
| % Households reporting a recent increase in erratic rainfall | Percentage of households reporting increasing occurrences of erratic rainfall affecting crop production in the past 5 years | ||
| Mean standard deviation of daily avg. maximum temperature | The standard deviation of the average daily maximum temperature by month between 2010 and 2020, averaged for each study district | [61] & modified | |
| Mean standard deviation of daily average maximum temperature | The standard deviation of the average daily minimum temperature by month between 2010 and 2020, averaged for each study district | [61] & modified | |
| Mean standard deviation of dailyaverage maximum precipitation | The standard deviation of the average daily maximum temperature by month between 2010 and 2020, averaged for each study district | [61] & modified |
| Study Districts | ||||||||||
|---|---|---|---|---|---|---|---|---|---|---|
| Major Component | Subcomponent | Units | Bumthang | Chukha | Gasa | Mongar | Tashigang | Wangdue | Max | Min |
| Socio-Demographic Profile | Dependency ratio | Ratio | 0.89 | 0.88 | 0.98 | 0.67 | 0.81 | 1.22 | 5.00 | 0 |
| % Household, female-headed | Percent | 83 | 50 | 73 | 65 | 90 | 55 | 100 | 0 | |
| Avg. age of head of household | Years | 45.75 | 47.05 | 48.00 | 41.13 | 47.30 | 47.38 | 79 | 20 | |
| % Households where the head of household has not attended school | Percent | 50 | 52.5 | 65 | 55 | 72.5 | 60 | 100 | 0 | |
| % Households with at least one orphan | Percent | 7.5 | 0 | 0 | 2.5 | 0 | 5 | 100 | 0 | |
| Livelihood Strategies | % Households with family working outside community/country | Percent | 72.5 | 30 | 22.5 | 15 | 50 | 27.5 | 100 | 0 |
| % Households dependent on agriculture for income | Percent | 55 | 62.5 | 50 | 42.5 | 12.5 | 45 | 100 | 0 | |
| % Households without incomingremittances | 53 | 27.5 | 53 | 2.5 | 2.5 | 53 | 100 | 0 | ||
| Avg. agricultural livelihood diversification index | 1/# livelihoods | 0.35 | 0.31 | 0.33 | 0.26 | 0.25 | 0.32 | 0.50 | 0.25 | |
| Social Networks | Avg. help received/given ratio, in-kind | Ratio | 0.99 | 1.05 | 1.01 | 0.97 | 0.97 | 0.97 | 1.5 | 0.5 |
| Avg. money borrowing/lending ratio | Ratio | 1.09 | 1.13 | 0.99 | 1.11 | 1.14 | 1.09 | 2 | 0.5 | |
| % Households with poor neighbor relations | Percent | 20.0 | 5.0 | 12.5 | 5.0 | 0.0 | 7.5 | 100 | 0.0 | |
| % Households with no recent local government assistance | Percent | 12.5 | 52.5 | 25 | 72.5 | 65 | 57.5 | 100 | 0 | |
| Health | Avg. time to nearest health facility (Basic Health Unit) | Minutes | 96 | 105 | 68 | 89 | 77 | 90 | 240 | 60 |
| % Households with a family member with chronic illness | Percent | 40 | 10 | 25 | 17.5 | 10 | 10 | 100 | 0 | |
| % Households with a recent dreadful disease | Percent | 30 | 12.5 | 7.5 | 15 | 7.5 | 5 | 100 | 0 | |
| % Households attending no recent health awareness programs | Percent | 12.5 | 0 | 2.5 | 7.5 | 15 | 12.5 | 100 | 0 | |
| Food | % Households dependent on the family farm for food | Percent | 97.5 | 80 | 95 | 60 | 25 | 95 | 100 | 0 |
| Avg. months of household food shortage | Months | 0.83 | 0.40 | 0.70 | 0.23 | 0.00 | 0.18 | 12 | 0 | |
| Average Crop Diversity Index | 1/# crops | 0.17 | 0.20 | 0.23 | 0.16 | 0.17 | 0.27 | 1 | 0.13 | |
| % Households not saving crops | Percent | 0.00 | 0.00 | 0.00 | 0.00 | 0.00 | 0.00 | 100 | 0 | |
| % Households not saving seeds | Percent | 5 | 0 | 0 | 0 | 0 | 0 | 100 | 0 | |
| Water | % Households reporting water conflicts | Percent | 65 | 47.5 | 27.5 | 12.5 | 5 | 22.5 | 100 | 0 |
| % Households reporting water shortage for farming | Percent | 23 | 55 | 10 | 30 | 27.5 | 22.5 | 100 | 0 | |
| % Households utilizing natural primary water source | Percent | 100.0 | 100.0 | 100.0 | 100.0 | 100.0 | 100.0 | 100 | 0 | |
| Avg. walking time to a water source | Minutes | 261 | 366 | 279 | 294 | 288 | 300 | 1020 | 0 | |
| % Households with inconsistent water supply | Percent | 90 | 63 | 23 | 33 | 58 | 38 | 100 | 0 | |
| % Households with recent drying up of water sources | Percent | 50 | 73 | 85.0 | 95.0 | 100.0 | 97.5 | 100 | 0 | |
| Natural Disasters and Climate Variability | % Households not receiving natural disaster warnings | Percent | 32.5 | 62.5 | 90 | 17.5 | 27.5 | 72.5 | 100 | 0 |
| % Households with recent natural-disaster-related injury | Percent | 0 | 0 | 2.5 | 0 | 0 | 0 | 100 | 0 | |
| % Households reporting recent production-reducing crop, pest, or disease outbreak | Percent | 70 | 60 | 77.5 | 42.5 | 45 | 47.5 | 100 | 0 | |
| % Households reporting more storms affecting crops recently | Percent | 27.5 | 35 | 47.5 | 15 | 20 | 67.5 | 100 | 0 | |
| % Households reporting recent crop yield decline | Percent | 32.5 | 45 | 50 | 30 | 37.5 | 70 | 100 | 0 | |
| % Households reporting increasing occurrences of natural hazards (landslides and flash floods) | Percent | 40 | 25 | 25 | 45 | 22.5 | 27.5 | 100 | 0 | |
| % Households reporting a recent increase in erratic rainfall | Percent | 67.5 | 60 | 77.5 | 60 | 37.5 | 72.5 | 100 | 0 | |
| Mean standard deviation of daily avg. maximum temperature | Celsius | 0.83 | 1.29 | 1.56 | 1.34 | 1.50 | 1.08 | 2.5 | 0.6 | |
| Mean standard deviation of dailyavg. maximum temperature | Celsius | 1.12 | 2.20 | 1.60 | 1.28 | 1.11 | 1.07 | 3.3 | 0.4 | |
| Mean standard deviation of dailyavg. maximum precipitation | Millimeters | 21.13 | 68.62 | 53.20 | 40.38 | 42.78 | 26.79 | 280.0 | 2.5 | |
| IPCC Contributing Factors to Vulnerability | Major Components |
|---|---|
| Exposure | Natural Disasters and Climate variability |
| Adaptive Capacity | Sociodemographic Profile |
| Livelihood Strategies | |
| Social Networks | |
| Sensitivity | Health |
| Food | |
| Water |
| Particulars | Category | Overall Study Districts (%) |
|---|---|---|
| Gender | Male | 30.83 |
| Female | 69.17 | |
| Age | 20–30 | 10.83 |
| 31–40 | 27.50 | |
| 40–50 | 24.59 | |
| 51–60 | 20.00 | |
| >60 | 17.08 | |
| Education level | None | 59.17 |
| Non-formal education | 18.33 | |
| Primary School | 15.00 | |
| High School | 5.83 | |
| Certificate/Vocational | 1.25 | |
| Diploma and above | 0.42 | |
| Family Size | Average household member | 7.5 |
| Land size | Average landholding (Acre) | 3.17 |
| Components/Indicators | Bumthang | Chukha | Gasa | Mongar | Tashigang | Wangdue |
|---|---|---|---|---|---|---|
| Sociodemographic Profile (Major component) | 0.403 | 0.332 | 0.409 | 0.343 | 0.450 | 0.381 |
| Subcomponents | ||||||
| Dependency ratio | 0.18 | 0.18 | 0.20 | 0.13 | 0.16 | 0.24 |
| % Households, female-headed | 0.83 | 0.50 | 0.73 | 0.65 | 0.90 | 0.55 |
| Avg. age of head of household | 0.44 | 0.46 | 0.47 | 0.36 | 0.46 | 0.46 |
| % Households where the head of household has not attended school | 0.50 | 0.53 | 0.65 | 0.55 | 0.73 | 0.60 |
| % Households with at least one orphan | 0.08 | 0.00 | 0.00 | 0.03 | 0.00 | 0.05 |
| Livelihood Strategies (Major component) | 0.546 | 0.356 | 0.392 | 0.158 | 0.163 | 0.383 |
| Subcomponents | ||||||
| % Households with family working outside community/country | 0.73 | 0.30 | 0.23 | 0.15 | 0.50 | 0.28 |
| % Households dependent on agriculture for income | 0.55 | 0.63 | 0.50 | 0.43 | 0.13 | 0.45 |
| % Households without incoming remittances | 0.53 | 0.28 | 0.53 | 0.03 | 0.03 | 0.53 |
| Avg. agriculture livelihood diversification index | 0.38 | 0.23 | 0.32 | 0.03 | 0.00 | 0.28 |
| Social networks (Major component) | 0.302 | 0.384 | 0.304 | 0.413 | 0.386 | 0.377 |
| Subcomponents | ||||||
| Avg. help received/given ratio, in kind | 0.49 | 0.55 | 0.51 | 0.47 | 0.47 | 0.47 |
| Avg. money borrowing/lending ratio | 0.39 | 0.42 | 0.33 | 0.41 | 0.43 | 0.39 |
| % Households with poor neighbor relations | 0.20 | 0.05 | 0.13 | 0.05 | 0.00 | 0.08 |
| % Households with no recent local government assistance | 0.13 | 0.53 | 0.25 | 0.73 | 0.65 | 0.58 |
| Health (Major component) | 0.256 | 0.119 | 0.098 | 0.140 | 0.104 | 0.110 |
| Subcomponents | ||||||
| Avg. time to the nearest health facility (Basic Health Unit) | 0.20 | 0.25 | 0.04 | 0.16 | 0.09 | 0.17 |
| % Households with a family member with chronic illness | 0.40 | 0.10 | 0.25 | 0.18 | 0.10 | 0.10 |
| % Households with recent dreadful disease | 0.30 | 0.13 | 0.08 | 0.15 | 0.08 | 0.05 |
| % Households attending no recent health awareness programs | 0.13 | 0.00 | 0.03 | 0.08 | 0.15 | 0.13 |
| Food (Major component) | 0.229 | 0.184 | 0.225 | 0.201 | 0.201 | 0.225 |
| Subcomponents | ||||||
| % Households dependent on the family farm for food | 0.98 | 0.80 | 0.95 | 0.95 | 0.95 | 0.95 |
| Avg. months of household food shortage | 0.07 | 0.03 | 0.06 | 0.02 | 0.00 | 0.01 |
| Avg. Crop Diversity Index | 0.05 | 0.09 | 0.12 | 0.04 | 0.05 | 0.16 |
| % Households not saving crops | 0.00 | 0.00 | 0.00 | 0.00 | 0.00 | 0.00 |
| % Households not saving seeds | 0.05 | 0.00 | 0.00 | 0.00 | 0.00 | 0.00 |
| Water (Major component) | 0.588 | 0.622 | 0.454 | 0.498 | 0.530 | 0.516 |
| Subcomponents | ||||||
| % Households reporting water conflicts | 0.65 | 0.48 | 0.28 | 0.13 | 0.05 | 0.23 |
| % Households reporting watershortage for farming | 0.23 | 0.55 | 0.10 | 0.30 | 0.28 | 0.23 |
| % Households utilizing natural primary water source | 1.00 | 1.00 | 1.00 | 1.00 | 1.00 | 1.00 |
| Avg. walking time to a water source | 0.26 | 0.36 | 0.27 | 0.29 | 0.28 | 0.29 |
| % Households with inconsistent water supply | 0.90 | 0.63 | 0.23 | 0.33 | 0.58 | 0.38 |
| % Households with recent drying up of water sources | 0.50 | 0.73 | 0.85 | 0.95 | 1.00 | 0.98 |
| Natural Disasters and Climate Variability(Major component) | 0.313 | 0.409 | 0.479 | 0.292 | 0.275 | 0.414 |
| Subcomponents | ||||||
| % Households not receiving natural disaster warnings | 0.33 | 0.63 | 0.90 | 0.18 | 0.28 | 0.73 |
| % Households with a recent natural disaster-related injury | 0.00 | 0.00 | 0.03 | 0.00 | 0.00 | 0.00 |
| % Households reporting recent production-reducing crop, pest, or disease outbreak | 0.70 | 0.60 | 0.78 | 0.43 | 0.45 | 0.48 |
| % Households reporting more storms affecting crops recently | 0.28 | 0.35 | 0.48 | 0.15 | 0.20 | 0.68 |
| % Households reporting recent crop yield decline | 0.33 | 0.45 | 0.50 | 0.30 | 0.38 | 0.70 |
| % Households reporting increasing occurrences of natural hazards (landslides and flashflood) | 0.40 | 0.25 | 0.25 | 0.45 | 0.23 | 0.28 |
| % Households reporting a recent increase in erratic rainfall | 0.68 | 0.60 | 0.78 | 0.60 | 0.38 | 0.73 |
| Mean standard deviation of daily avg. maximum temperature | 0.13 | 0.37 | 0.50 | 0.39 | 0.47 | 0.26 |
| Mean standard deviation of daily average maximum temperature | 0.24 | 0.61 | 0.41 | 0.29 | 0.23 | 0.22 |
| Mean standard deviation of dailyaverage maximum precipitation | 0.07 | 0.24 | 0.18 | 0.14 | 0.15 | 0.09 |
| Overall LVI | 0.375 | 0.364 | 0.365 | 0.302 | 0.310 | 0.362 |
| IPCC Contributing Factors to Vulnerability | Bumthang | Chukha | Gasa | Mongar | Tashigang | Wangdue |
|---|---|---|---|---|---|---|
| Exposure | 0.313 | 0.409 | 0.479 | 0.292 | 0.275 | 0.414 |
| Adaptive Capacity | 0.416 | 0.356 | 0.371 | 0.308 | 0.342 | 0.381 |
| Sensitivity | 0.380 | 0.342 | 0.283 | 0.304 | 0.307 | 0.311 |
| LVI–IPCC | −0.039 | 0.018 | 0.030 | −0.005 | −0.021 | 0.010 |
Publisher’s Note: MDPI stays neutral with regard to jurisdictional claims in published maps and institutional affiliations. |
© 2022 by the authors. Licensee MDPI, Basel, Switzerland. This article is an open access article distributed under the terms and conditions of the Creative Commons Attribution (CC BY) license (https://creativecommons.org/licenses/by/4.0/).
Share and Cite
Rai, P.; Bajgai, Y.; Rabgyal, J.; Katwal, T.B.; Delmond, A.R. Empirical Evidence of the Livelihood Vulnerability to Climate Change Impacts: A Case of Potato-Based Mountain Farming Systems in Bhutan. Sustainability 2022, 14, 2339. https://doi.org/10.3390/su14042339
Rai P, Bajgai Y, Rabgyal J, Katwal TB, Delmond AR. Empirical Evidence of the Livelihood Vulnerability to Climate Change Impacts: A Case of Potato-Based Mountain Farming Systems in Bhutan. Sustainability. 2022; 14(4):2339. https://doi.org/10.3390/su14042339
Chicago/Turabian StyleRai, Pradeep, Yadunath Bajgai, Jimba Rabgyal, Tirtha Bdr Katwal, and Anthony Ryan Delmond. 2022. "Empirical Evidence of the Livelihood Vulnerability to Climate Change Impacts: A Case of Potato-Based Mountain Farming Systems in Bhutan" Sustainability 14, no. 4: 2339. https://doi.org/10.3390/su14042339
APA StyleRai, P., Bajgai, Y., Rabgyal, J., Katwal, T. B., & Delmond, A. R. (2022). Empirical Evidence of the Livelihood Vulnerability to Climate Change Impacts: A Case of Potato-Based Mountain Farming Systems in Bhutan. Sustainability, 14(4), 2339. https://doi.org/10.3390/su14042339