Characterizing the Payback and Profitability for Automated Heavy Duty Vehicle Platooning
Abstract
:1. Introduction
2. Parametric Problem Bounding
- Class 8 tractor volume by state;
- Class 8 population annual/daily mileage statistics;
- Expected natural platooning due to road vehicles;
- Technology adoption profile hypothesis.
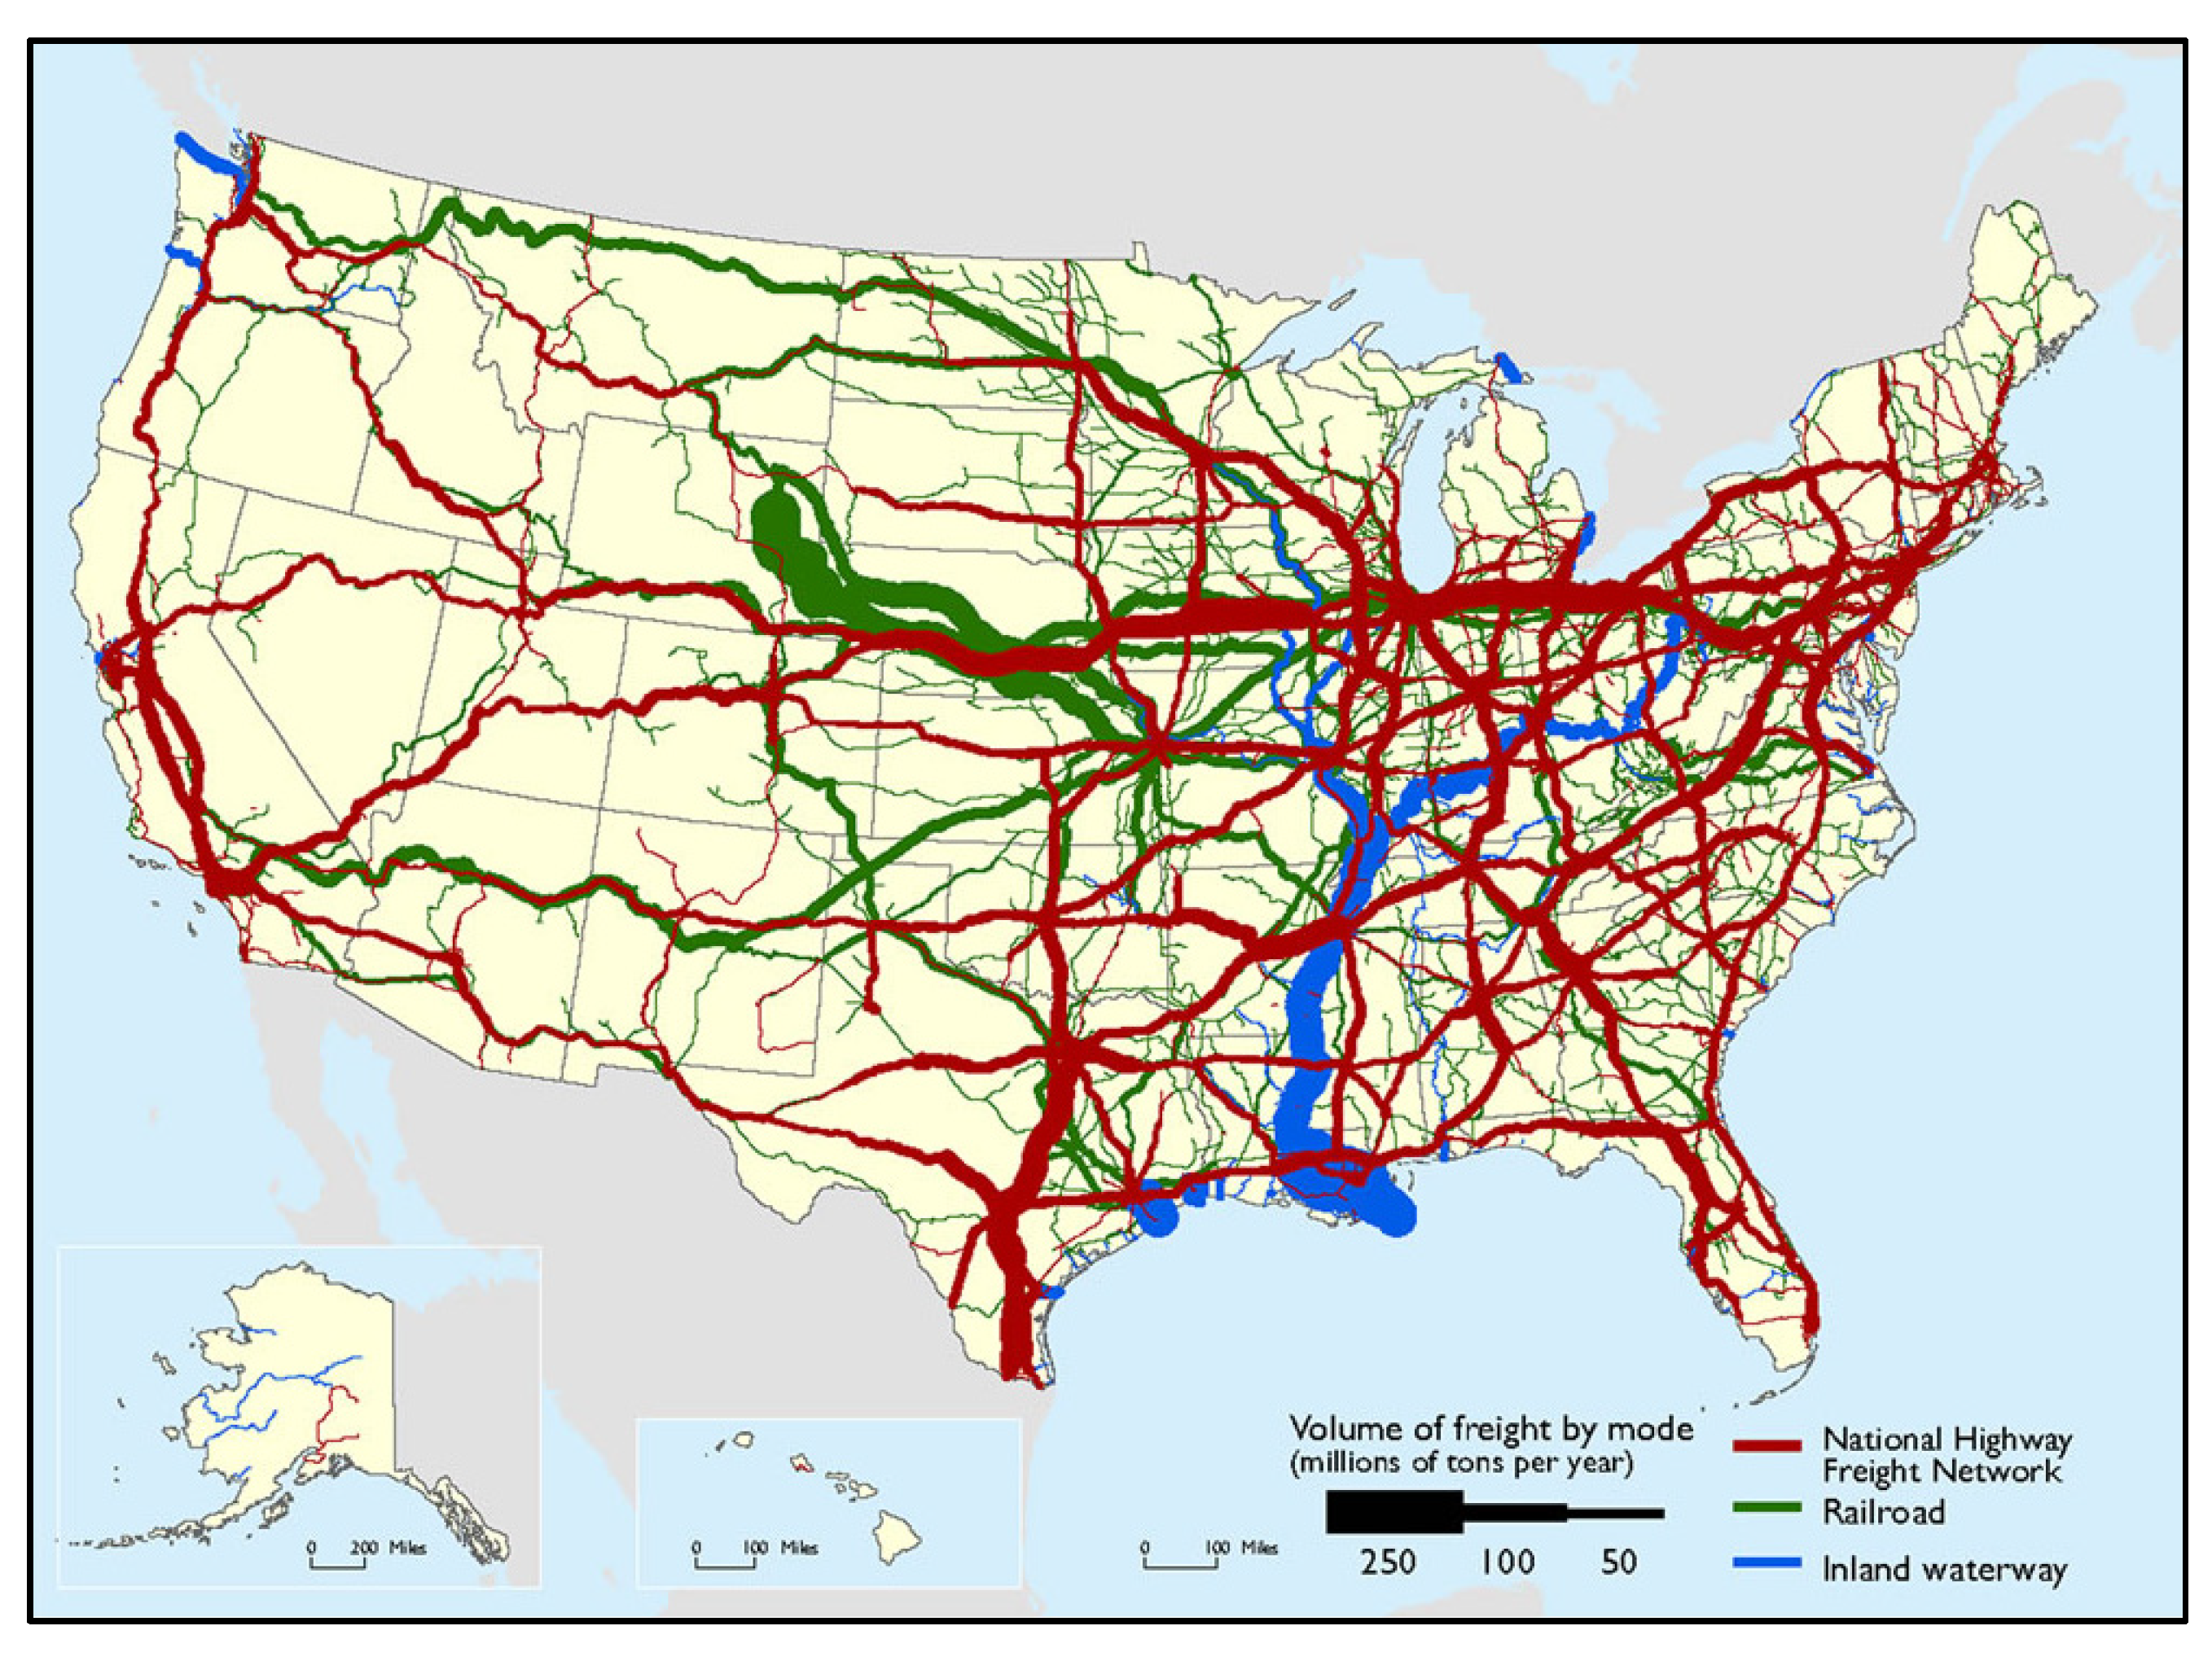
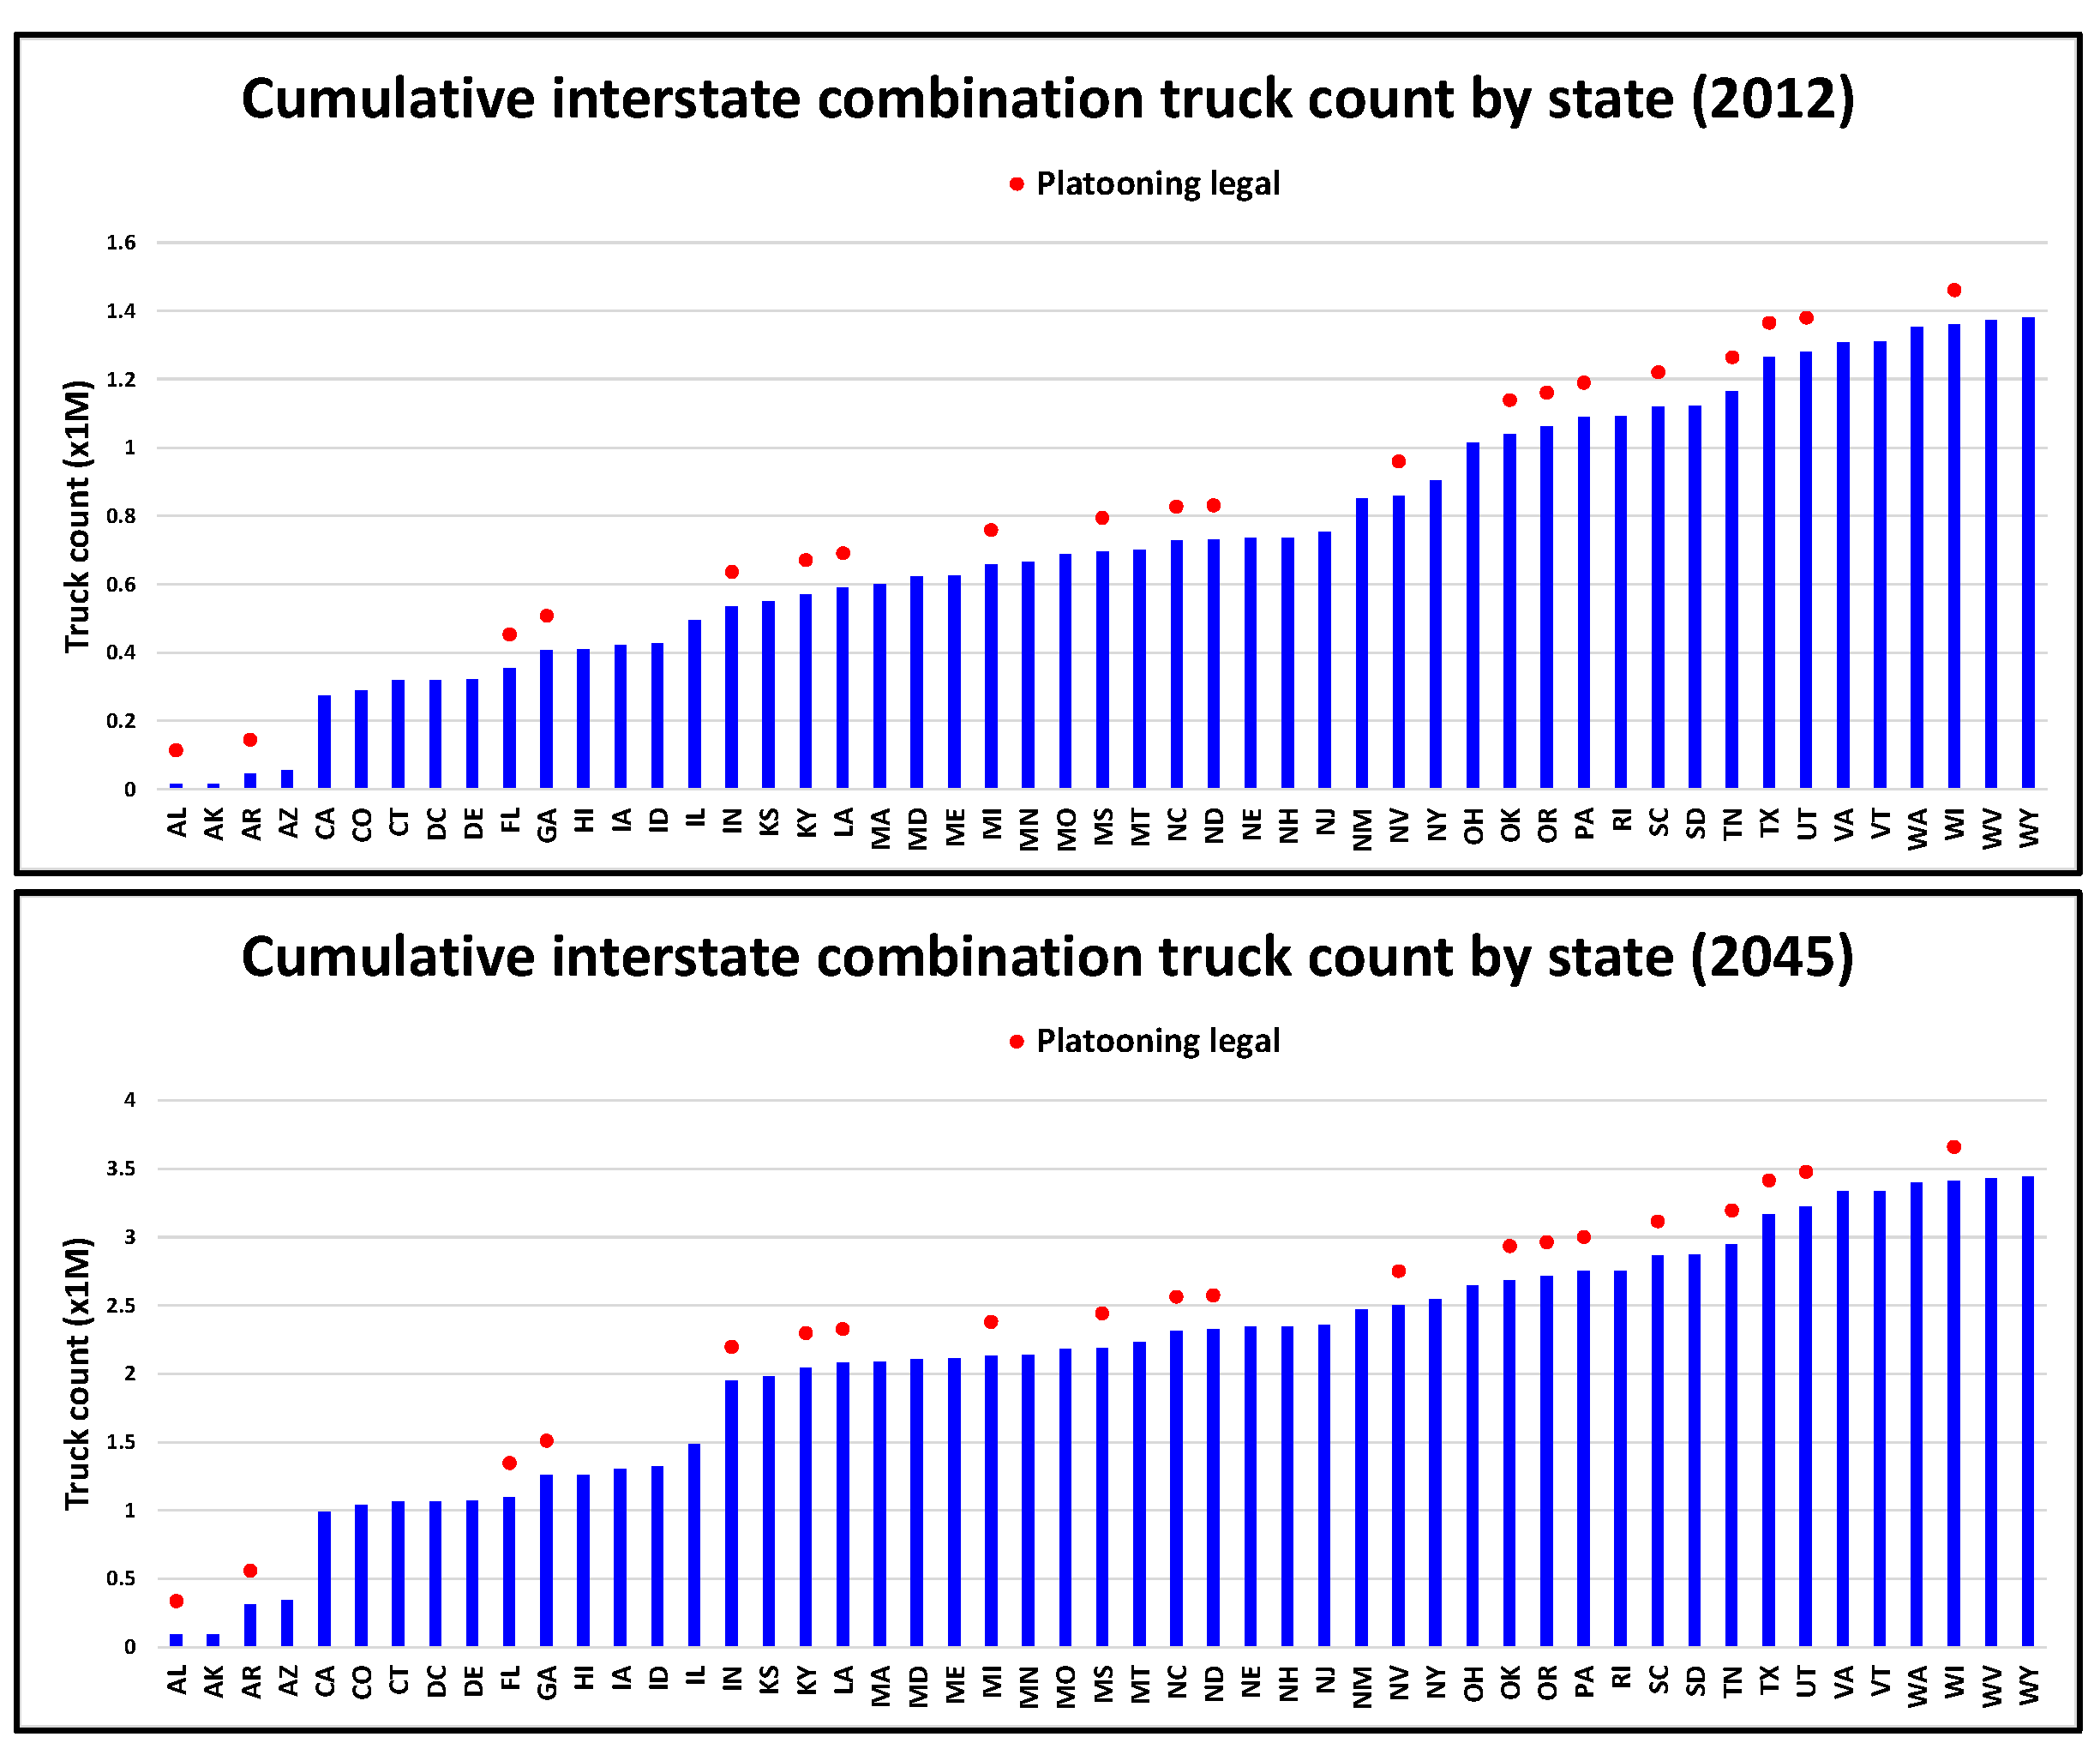
2.1. Class 8 Tractor Volume by State
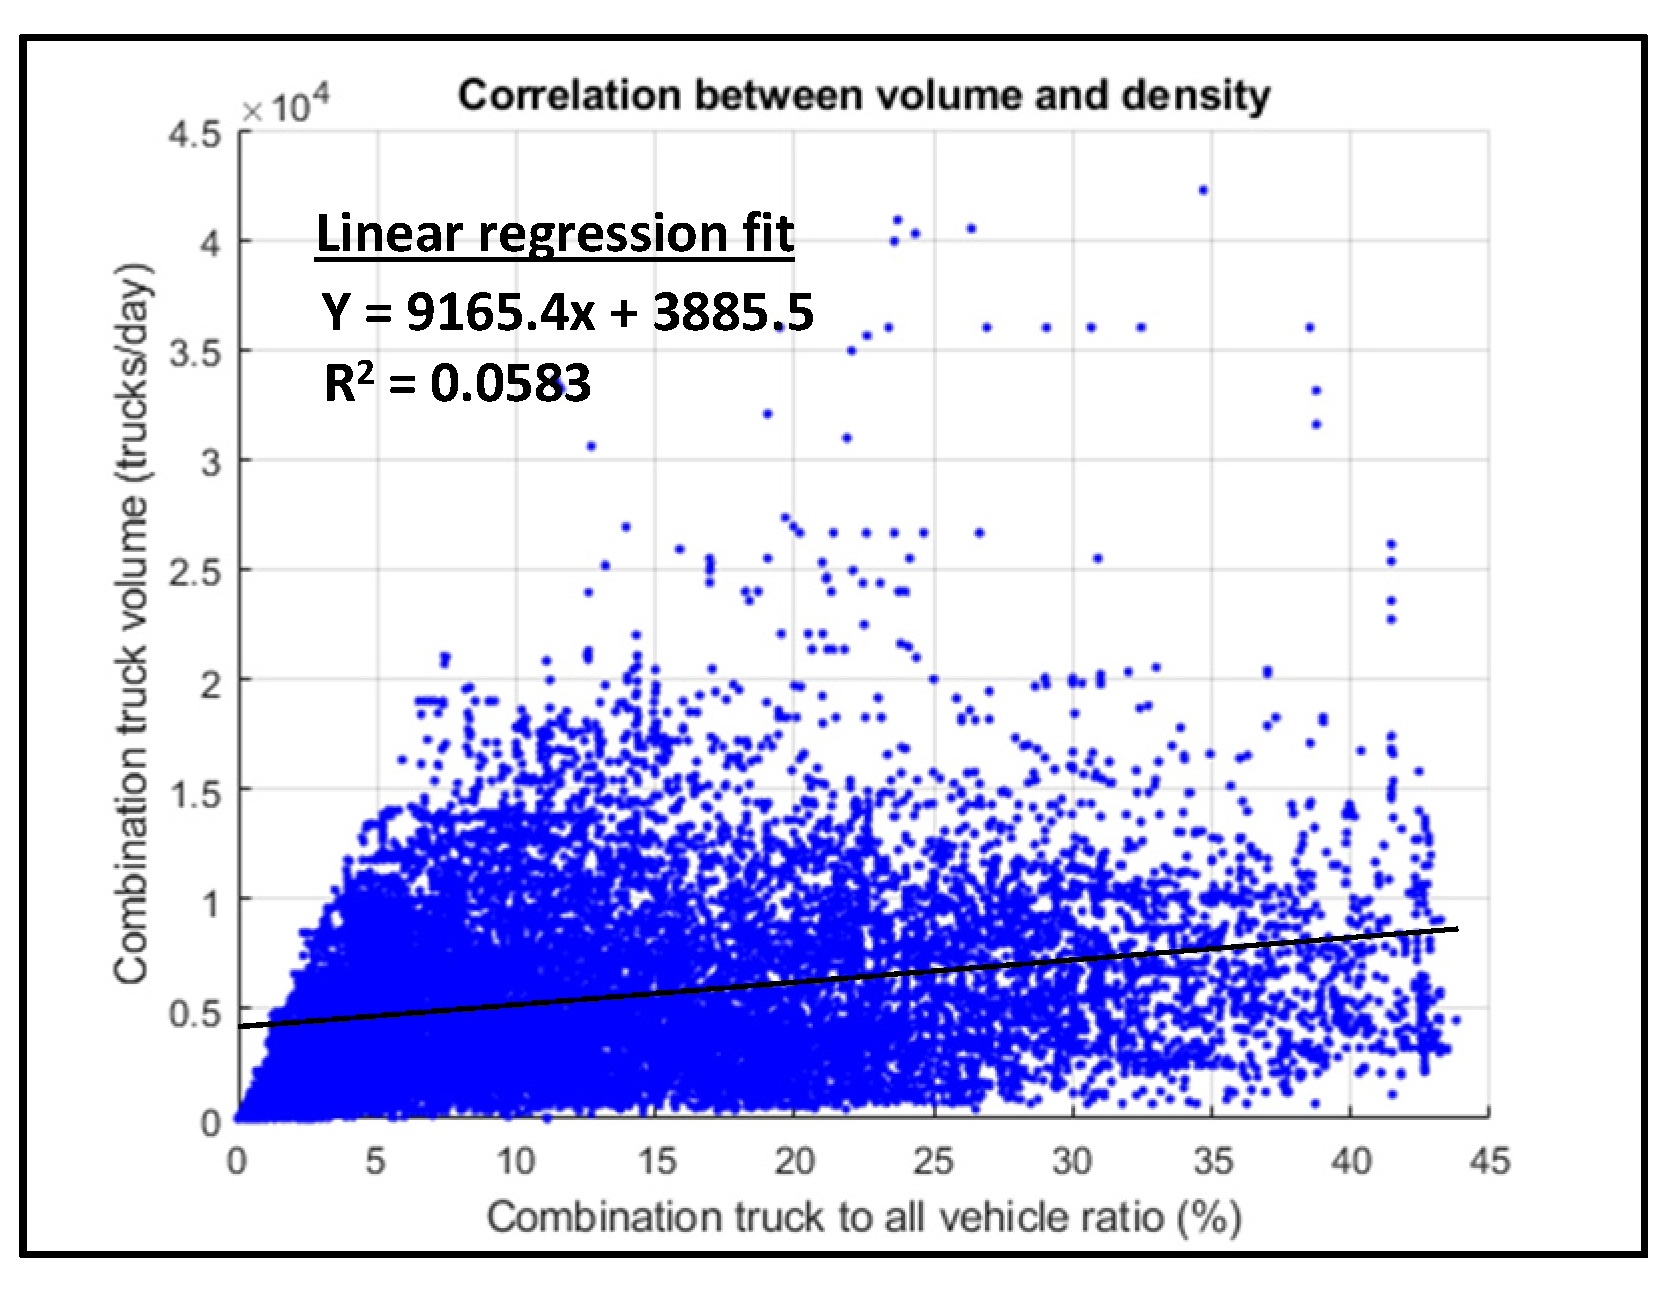
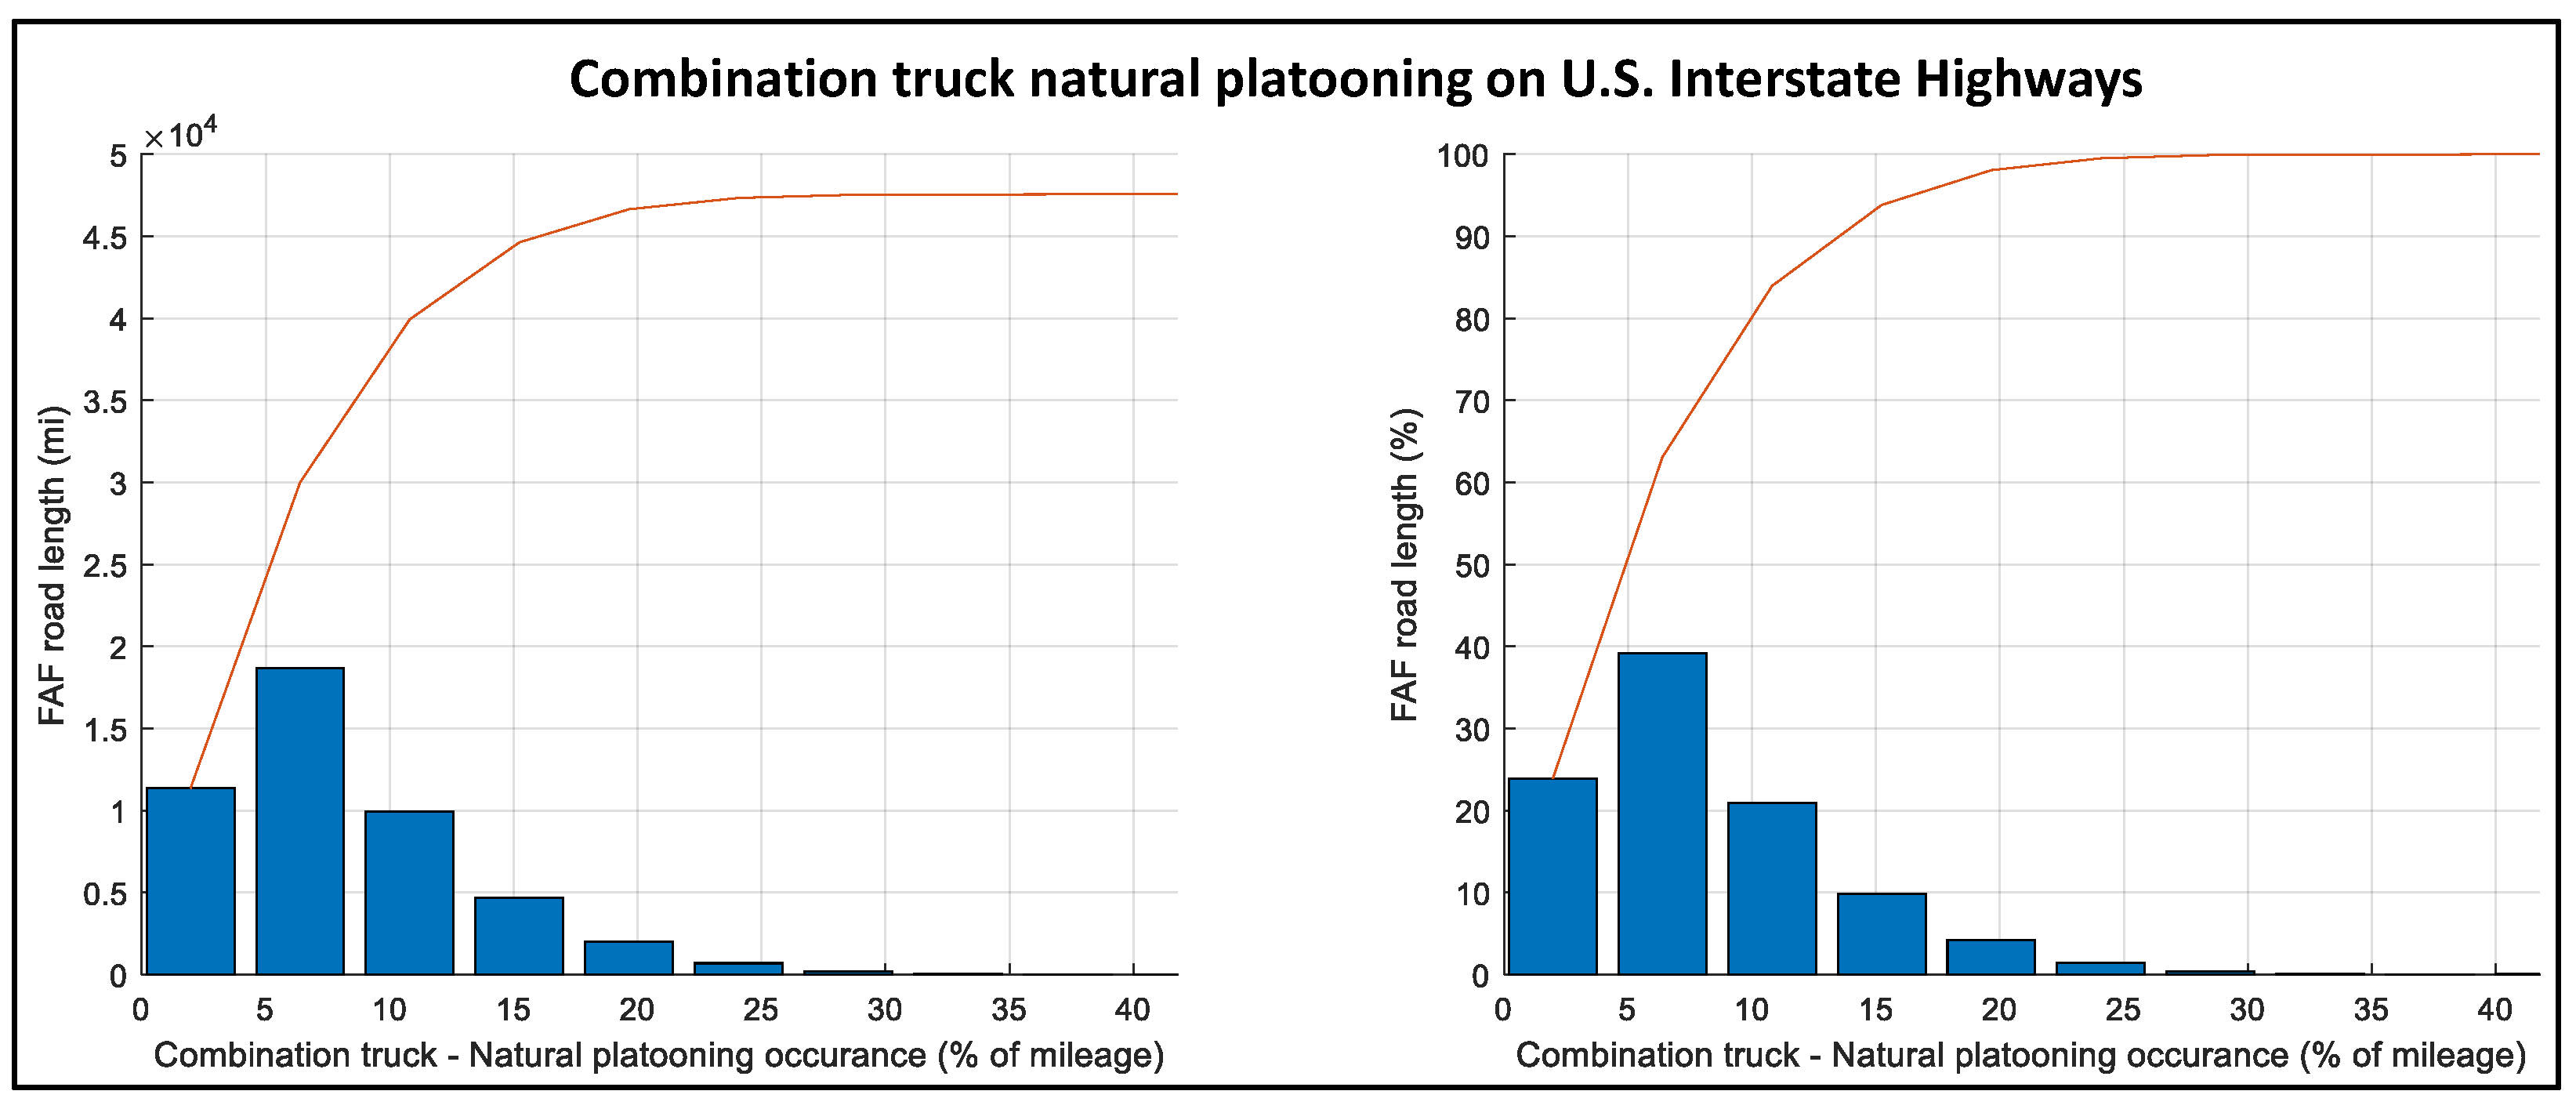
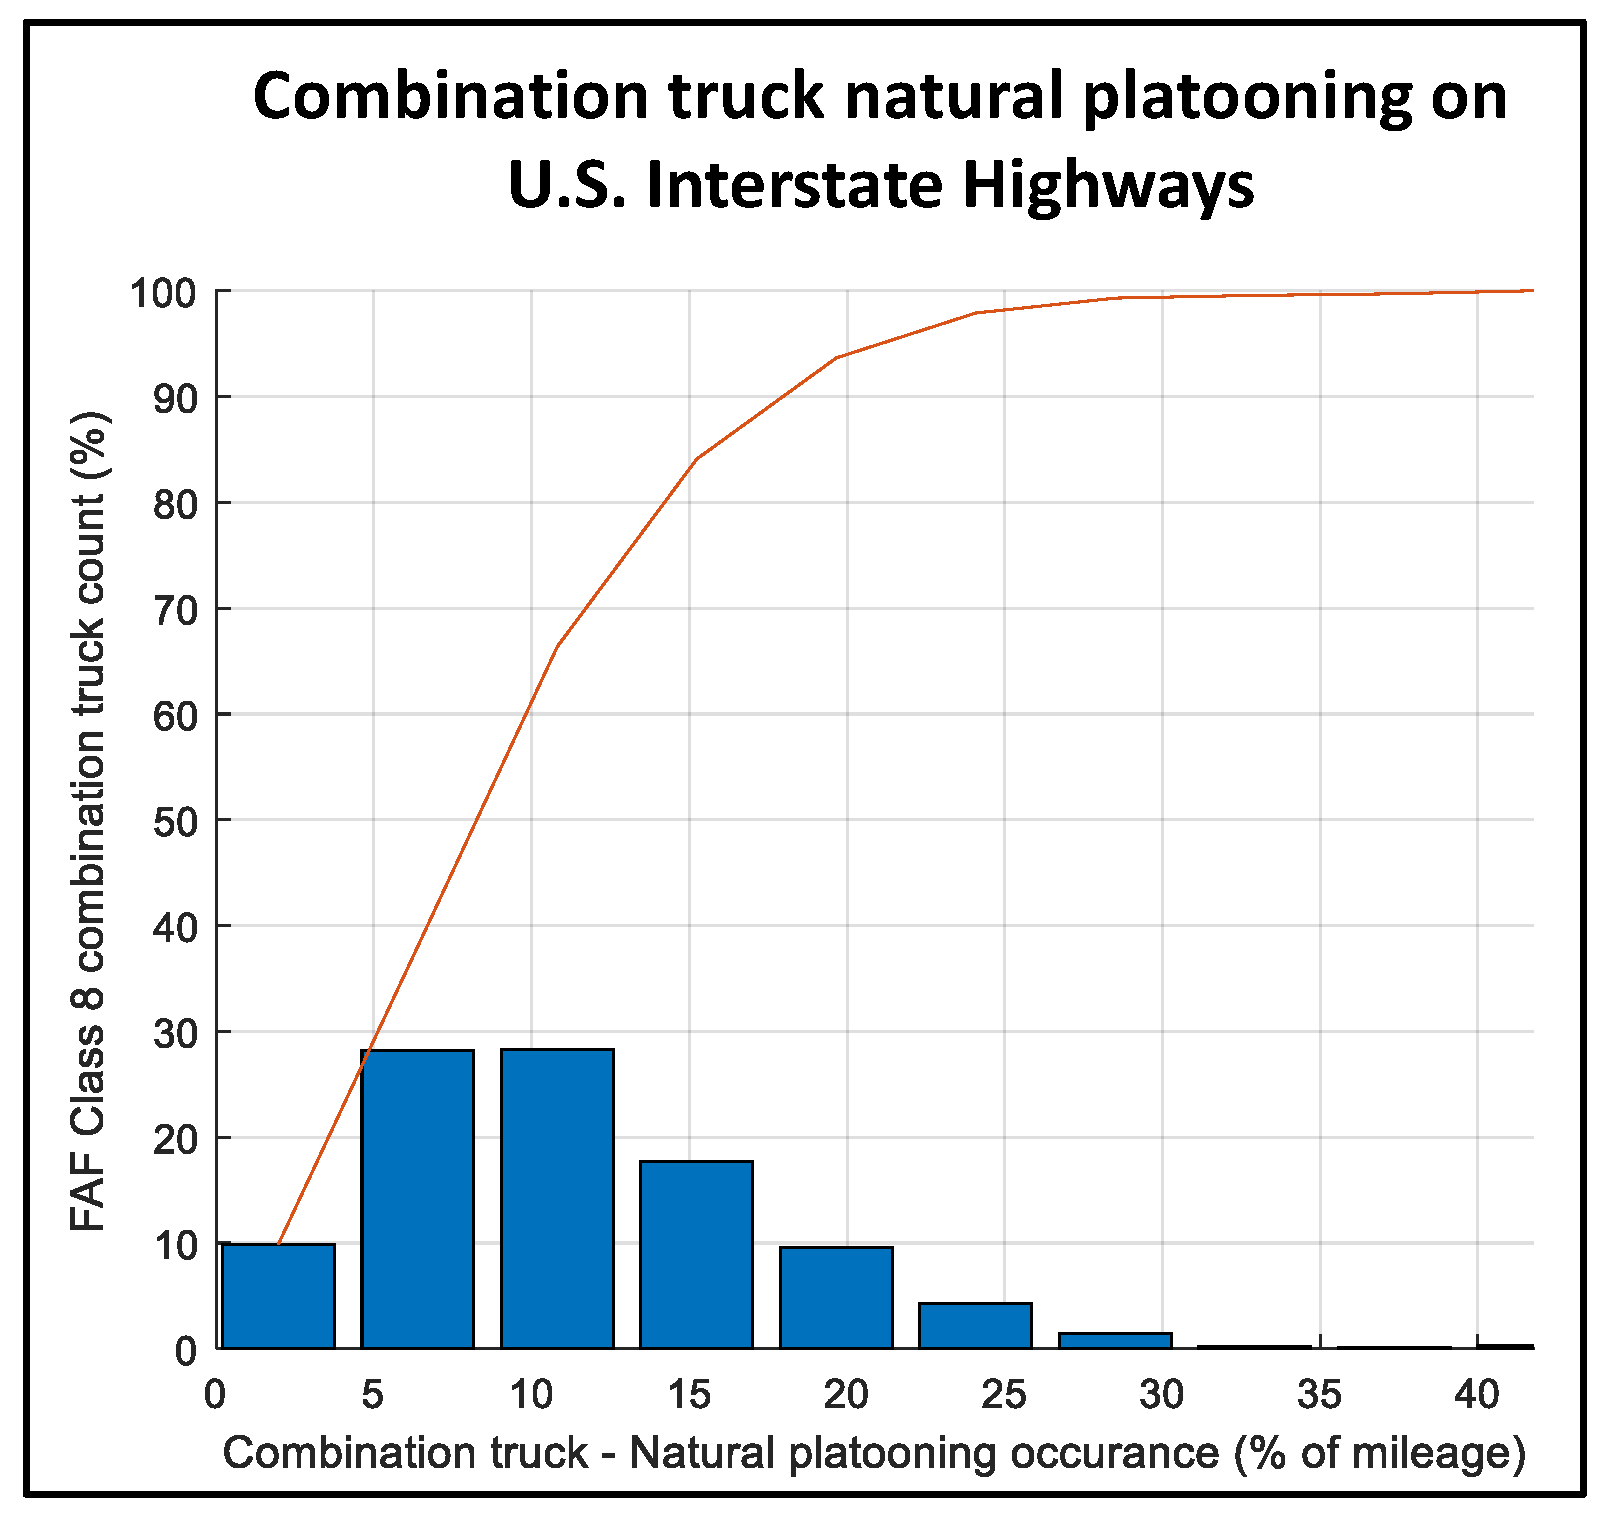
2.2. Expected Natural Platooning Due to Road-Traffic Vehicles
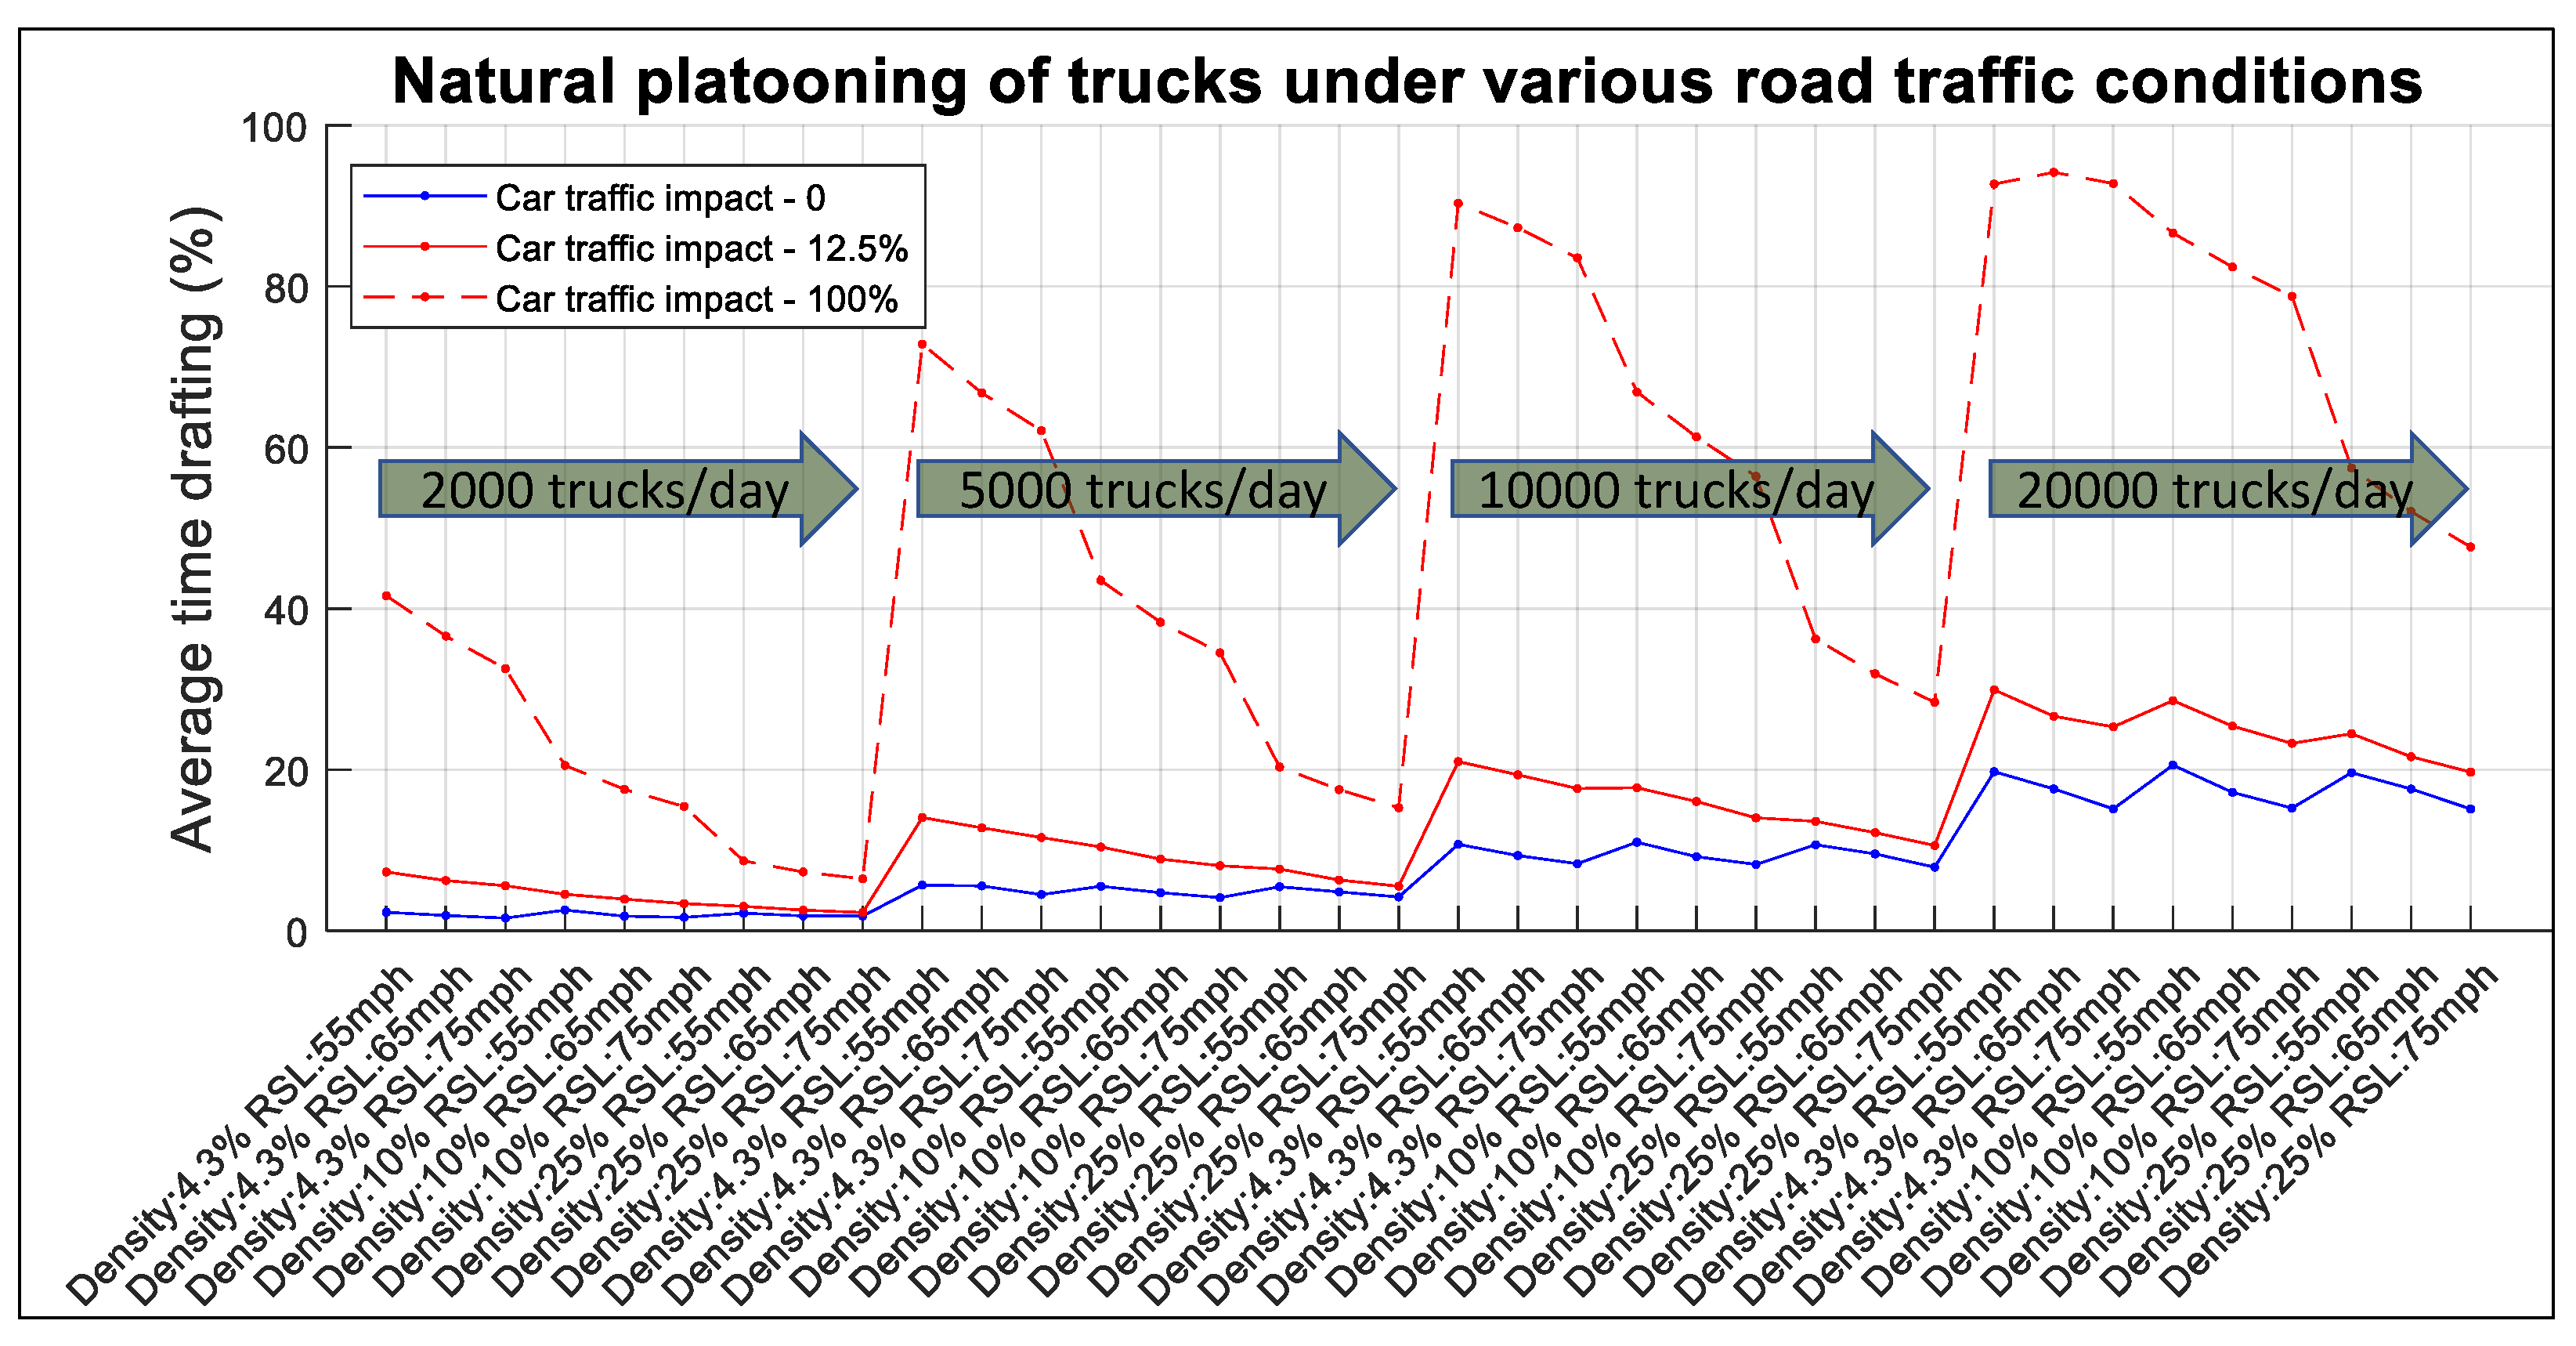
- Define study case (Class 8 tractor-trailer volume, Class 8 tractor-trailer density, RSL, drafting impact of non-Class 8 tractor-trailer vehicles);
- Create a sample of 1000 Class 8 tractor-trailer vehicles steady state speeds based on RSL and deviation from RSL statistics;
- Identify the quantity of non-Class 8 tractor-trailer vehicles from the truck density;
- Create a complementary sample of non-Class 8 tractor-trailer vehicles steady state speeds based on RSL and deviation from RSL statistics;
- Set the initial position of each vehicle based on separation distance calculated from RSL and the total vehicle volume. For example, at RSL of 65 mph and vehicle volume of 20,000 vehicles/day (2000 Class 8 tractor-trailer trucks/day and 10% truck density) the individual separation distance is 125.53 m;
- Simulate the position of each vehicle over n hours to determine how often each Class 8 tractor-trailer is drafting behind another vehicle;
- Based on the drafting impact of each leading vehicle, determine the aggregated duration that each Class 8 tractor-trailer is effectively drafting.
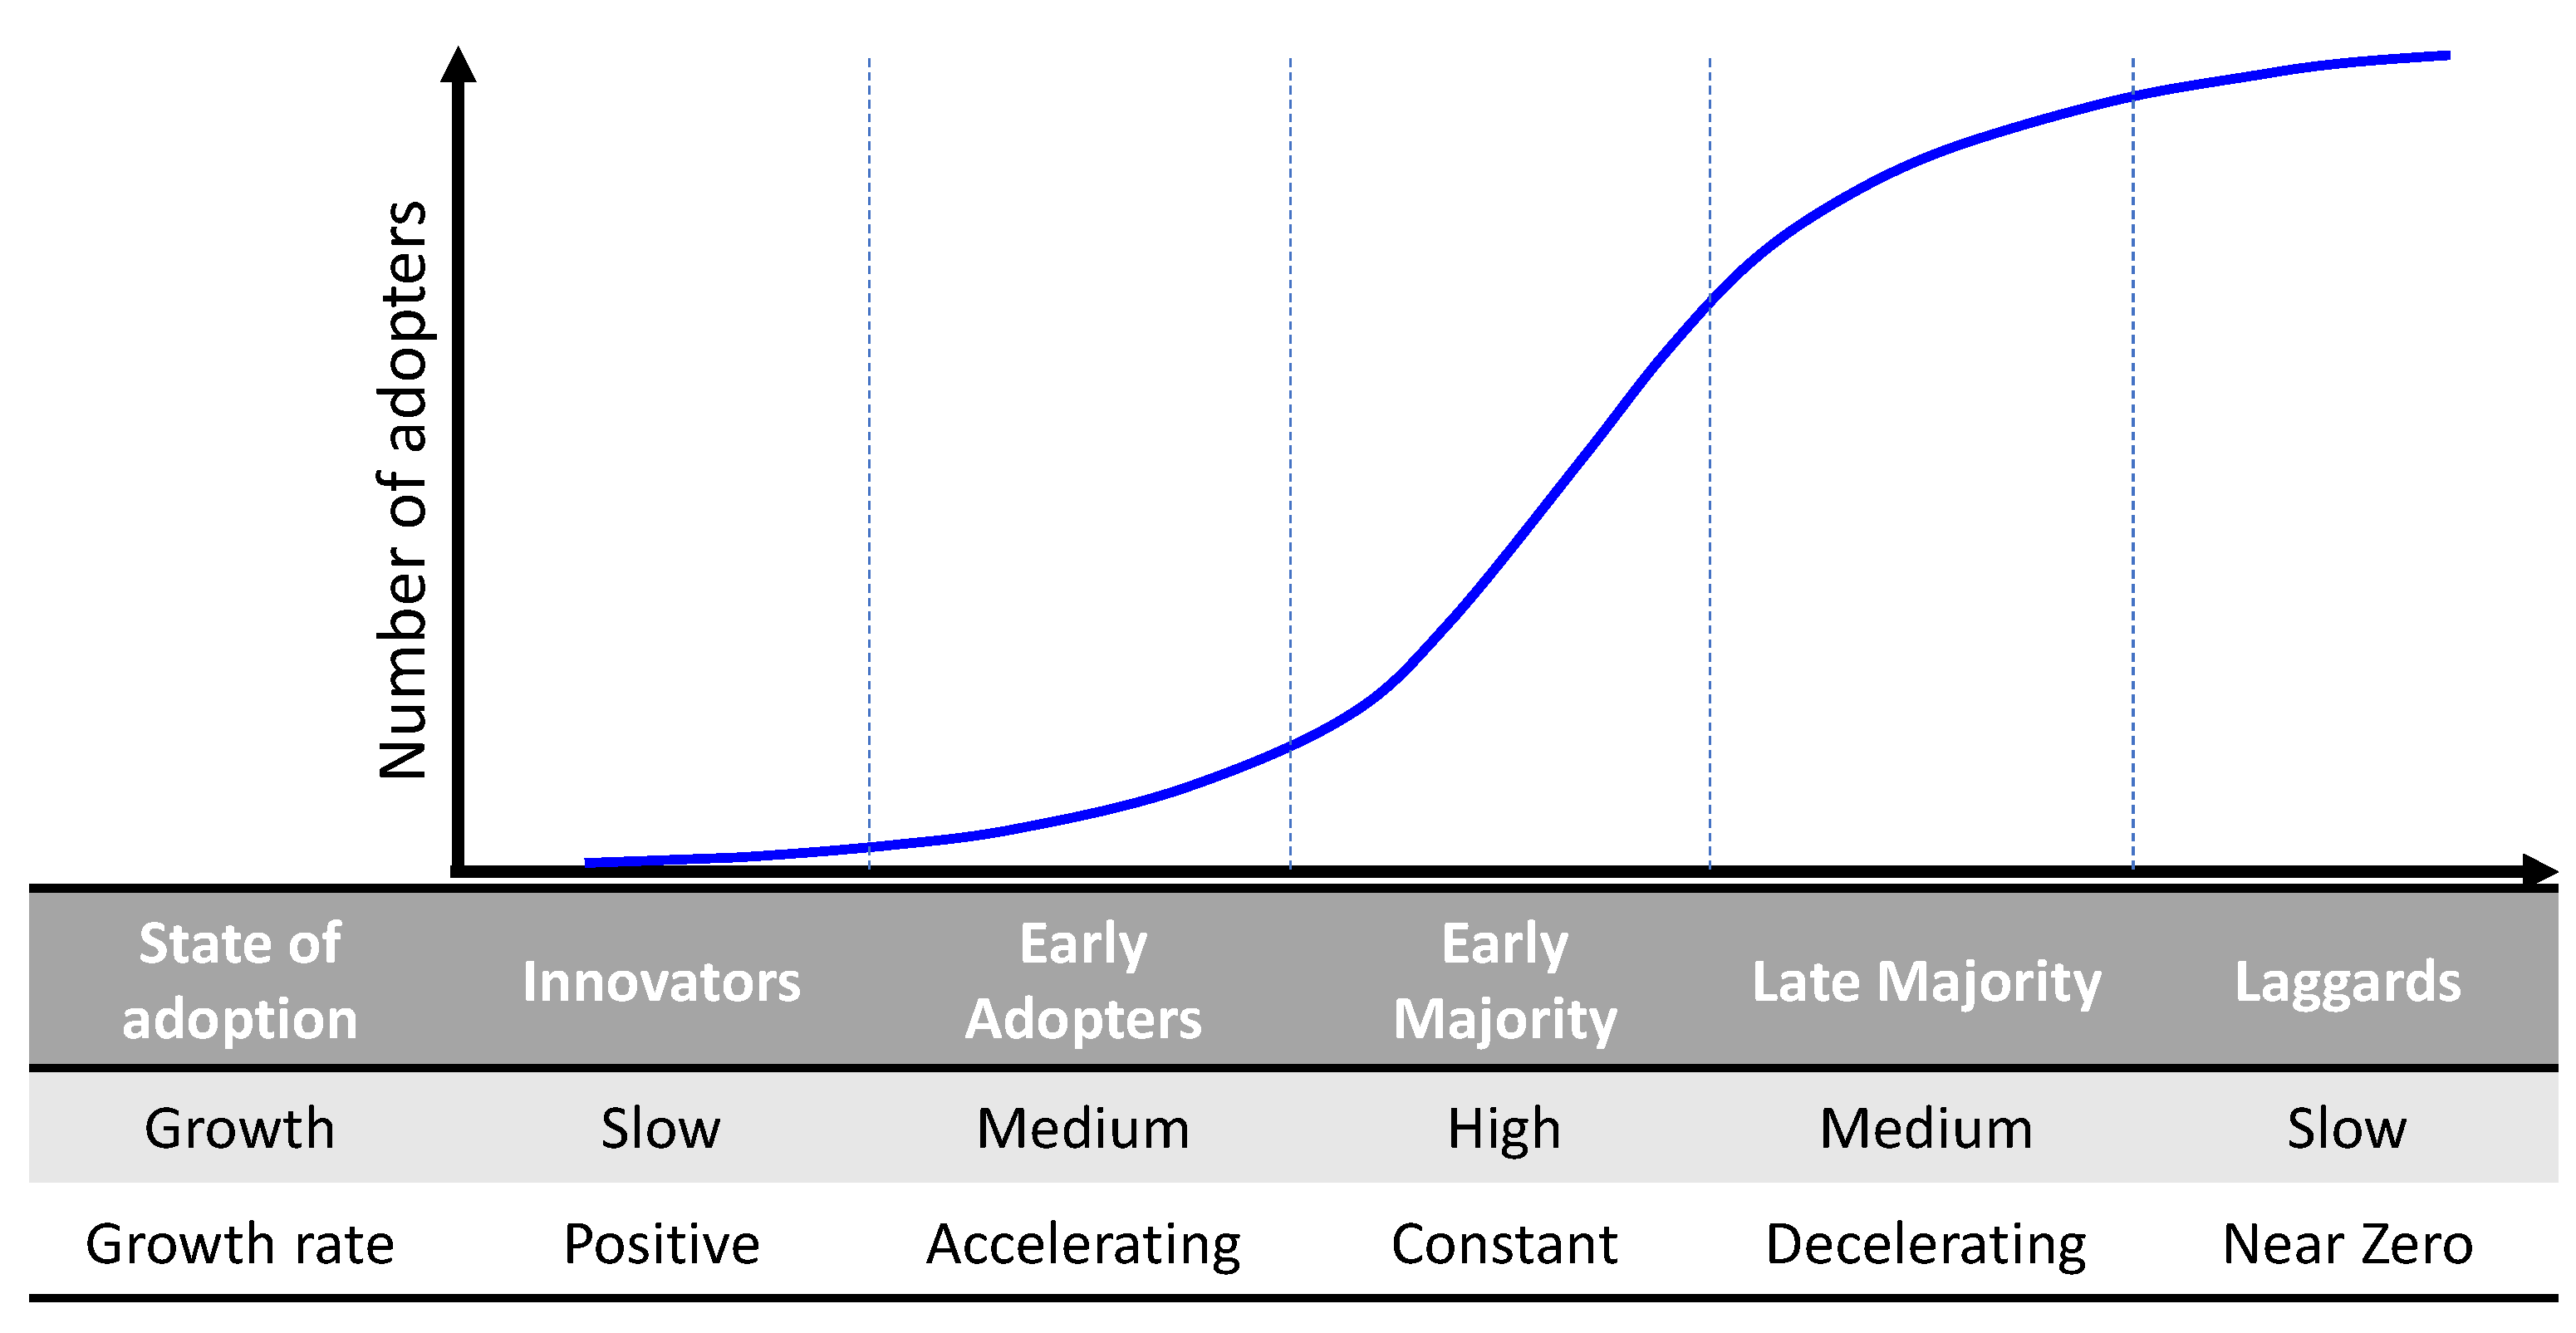
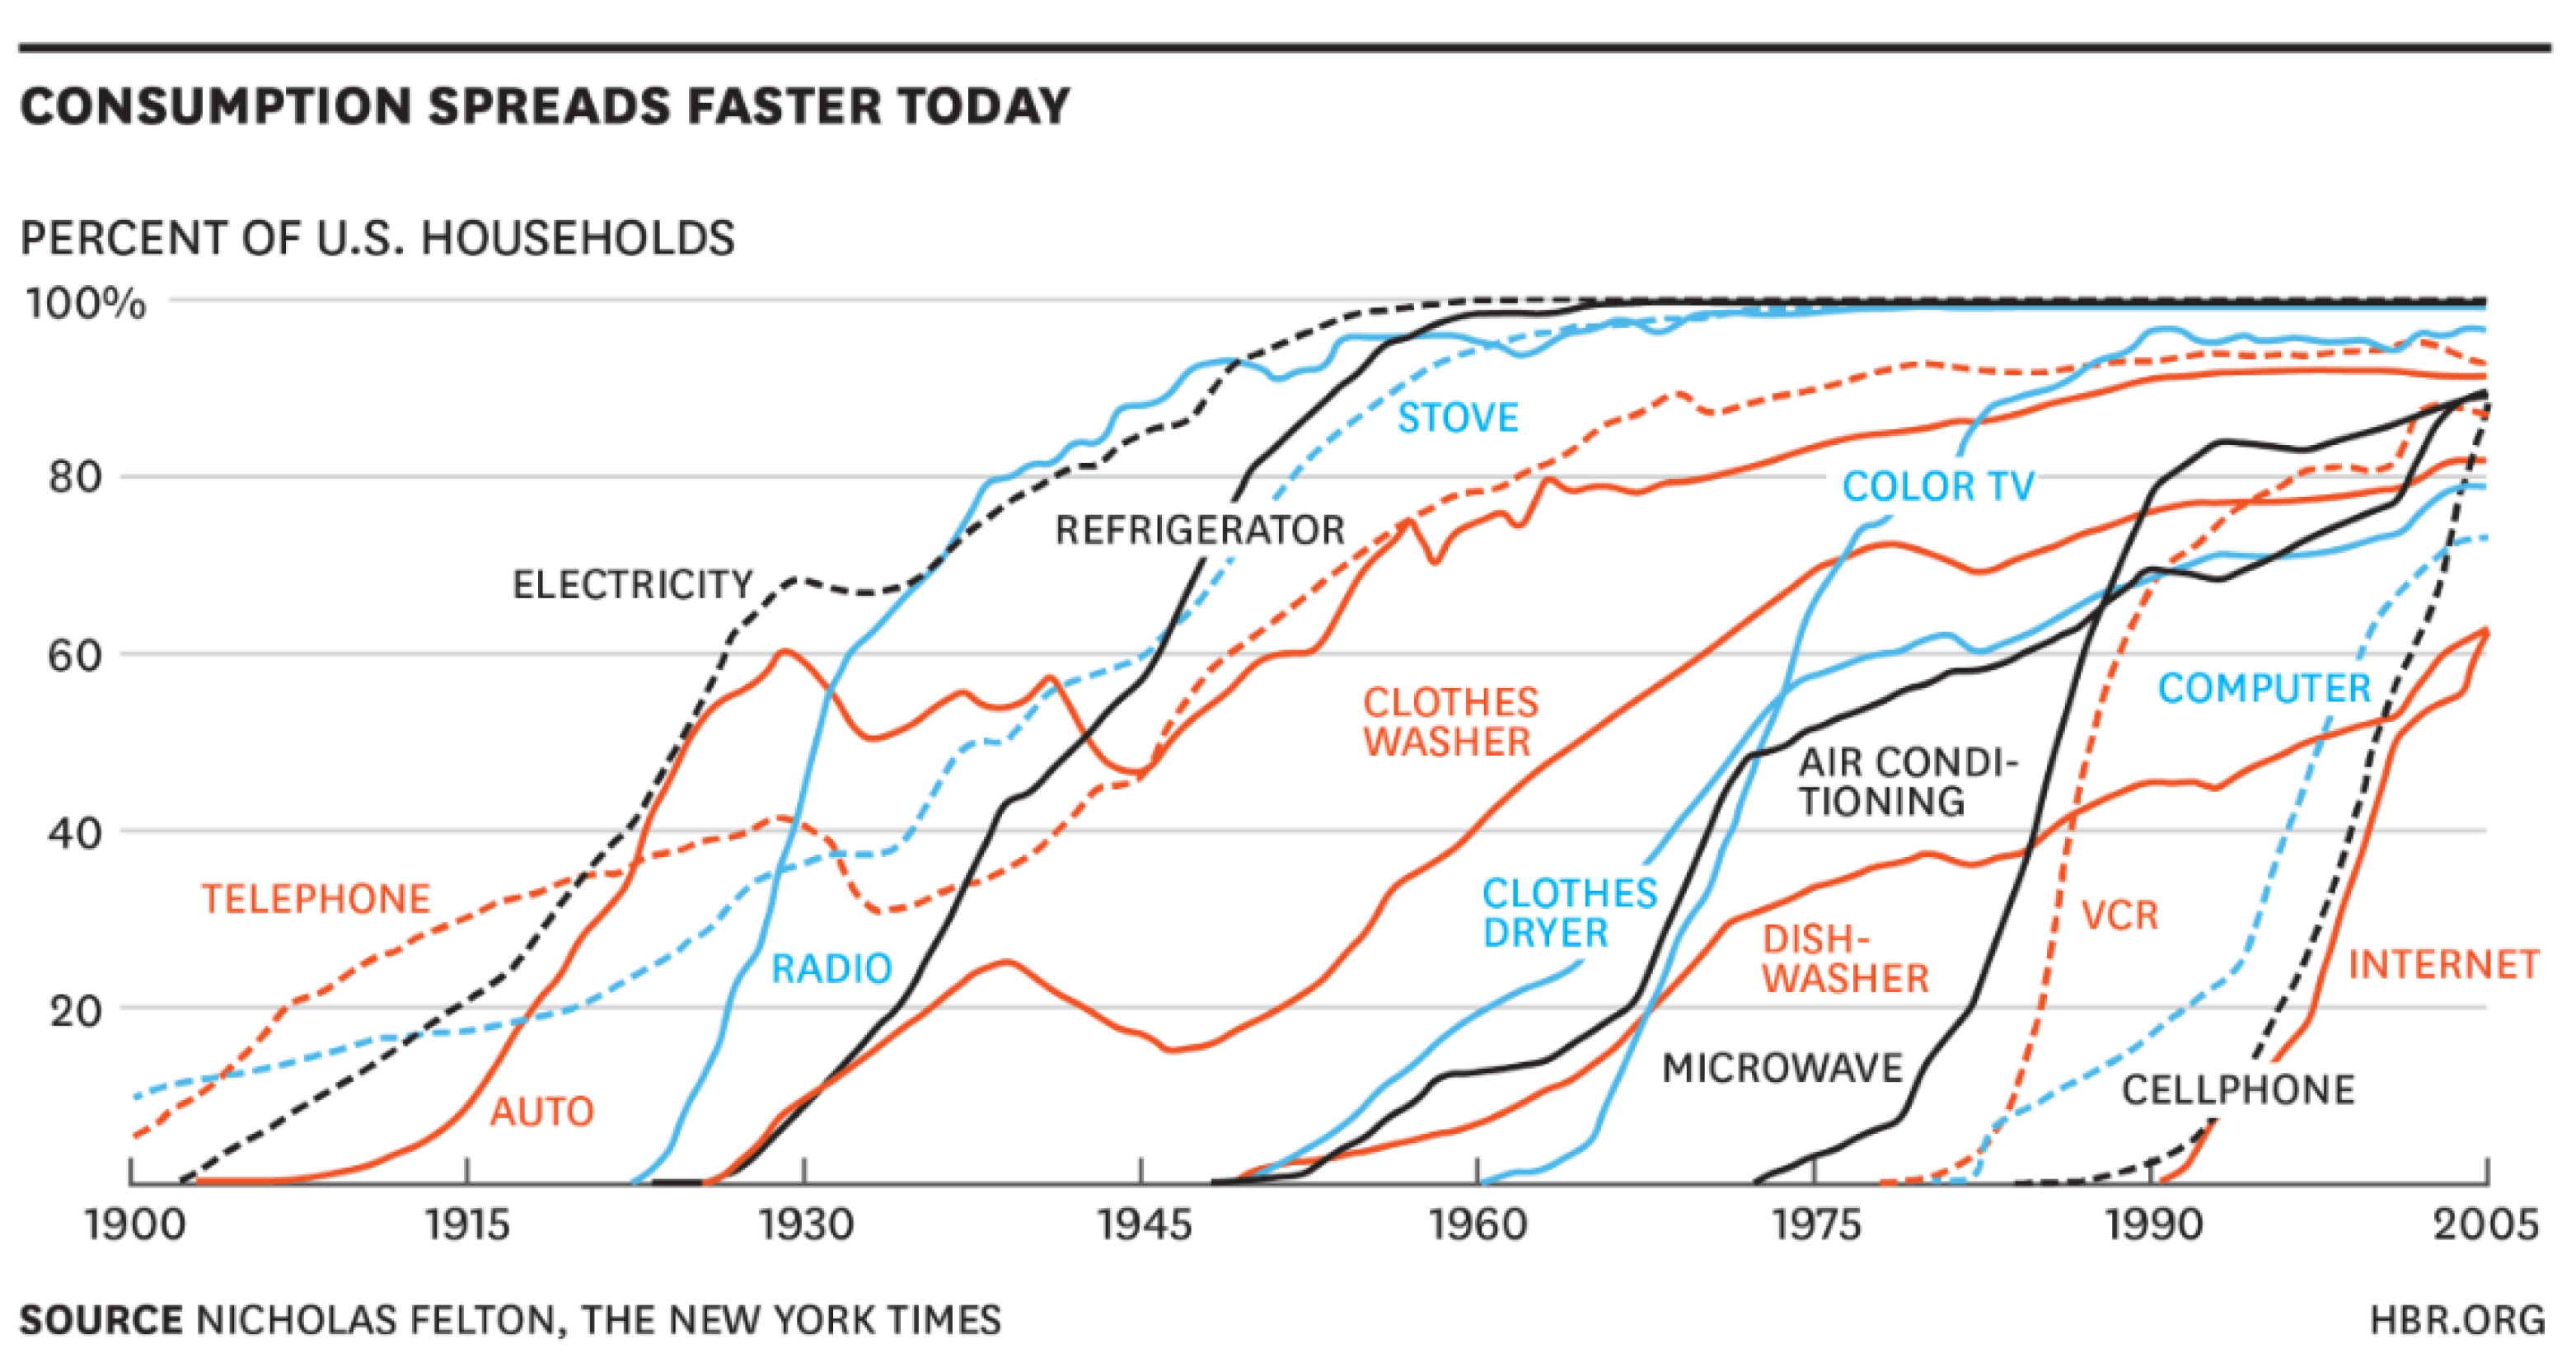
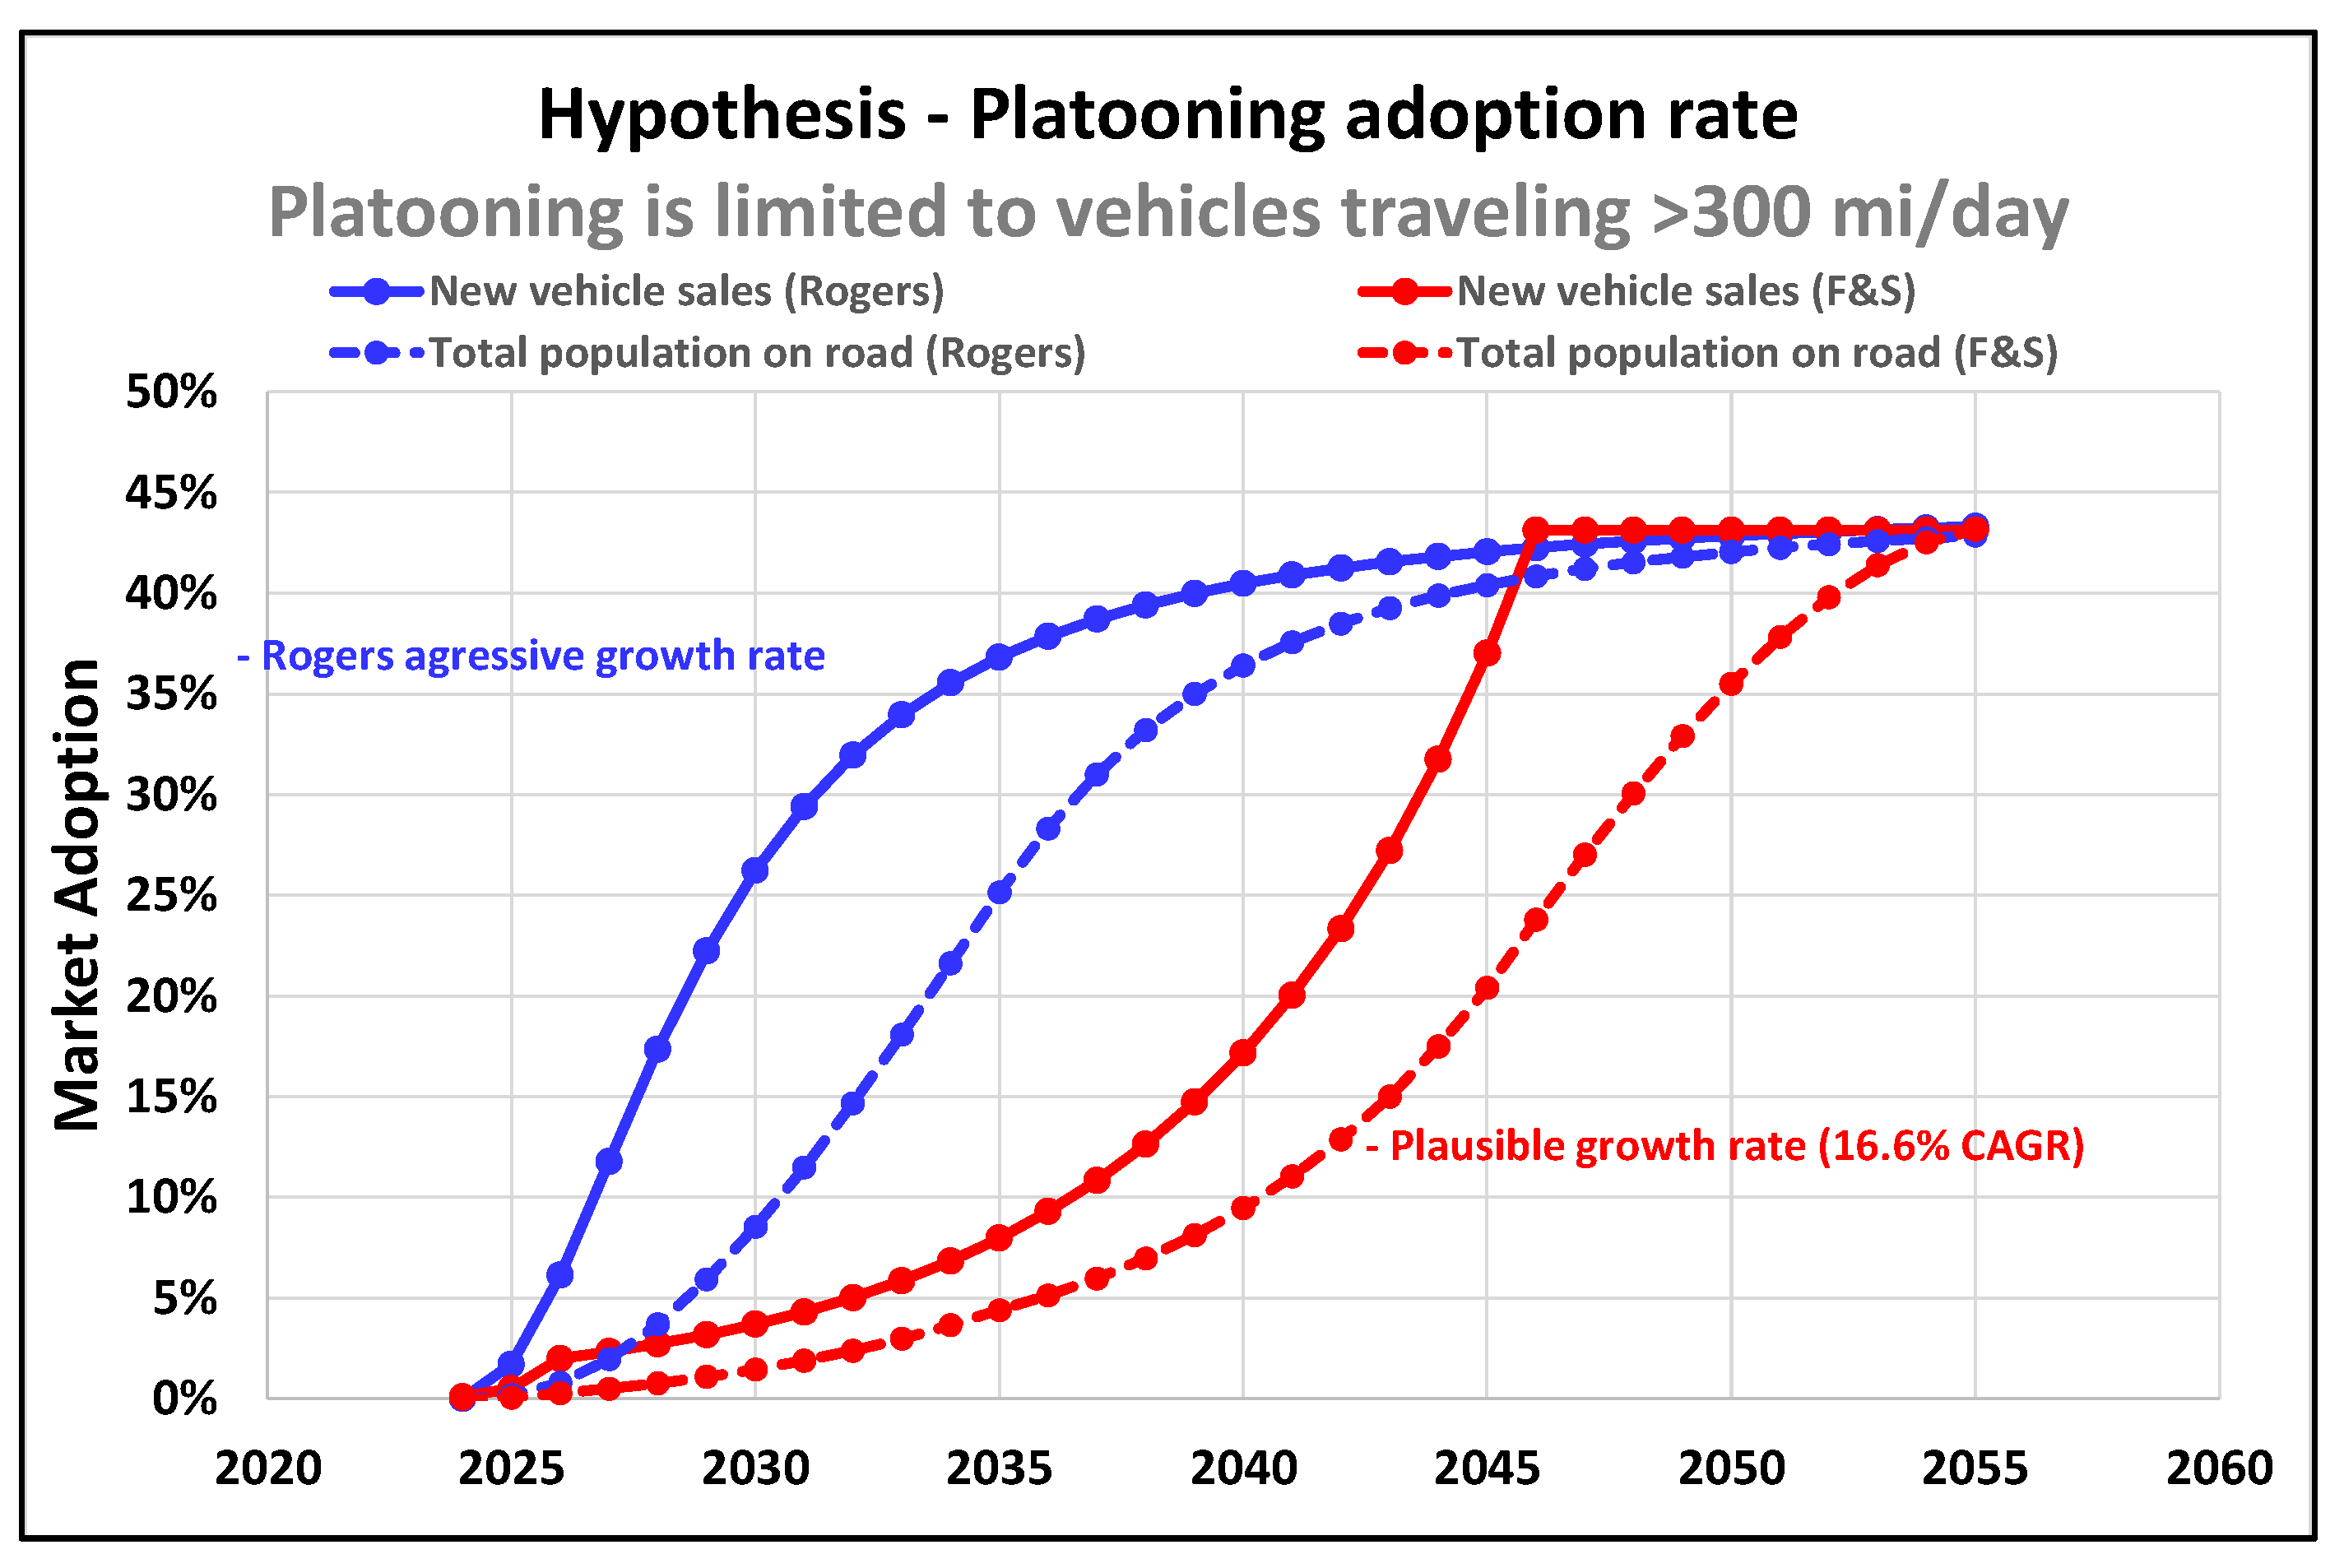
2.3. Adoption of Active Platooning by Class 8 Tractors
- Adoption starts slowly, with a small group of Innovators who are willing to take a chance on a new technology before it is proven or widely accepted;
- Next, a slightly larger group of Early Adopters accelerate the technology’s growth. This is a tipping point for the technology’s acceptance;
- The Early Majority, convinced by the Early Adopters, result in rapid growth where the Adoption S-curve slope is the steepest;
- Adoption continues growing as the Late Majority participate, and the technology appears almost everywhere;
- Finally, the Laggards, accept/adopt the technology.
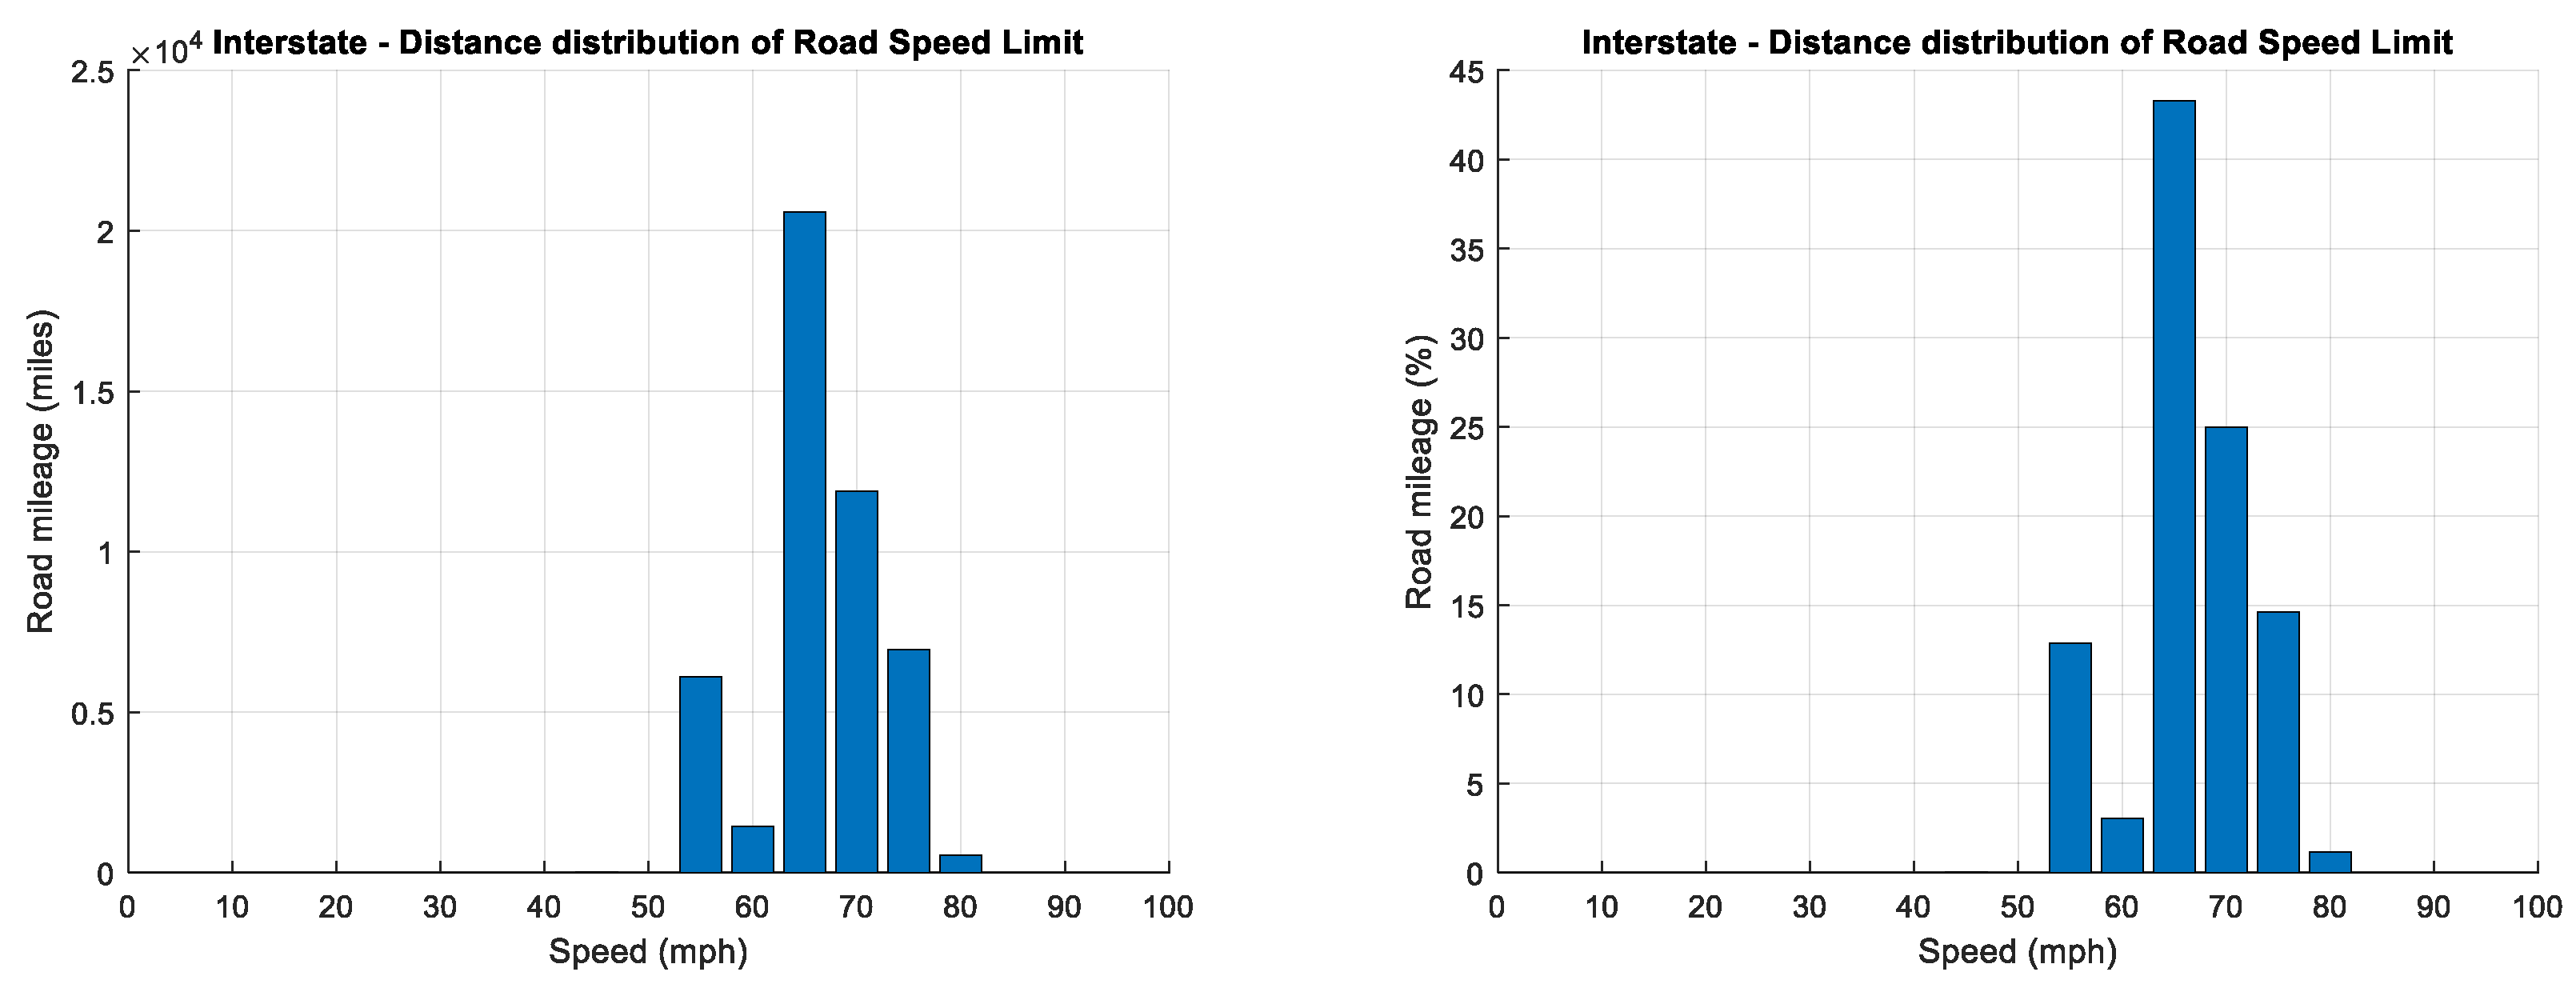
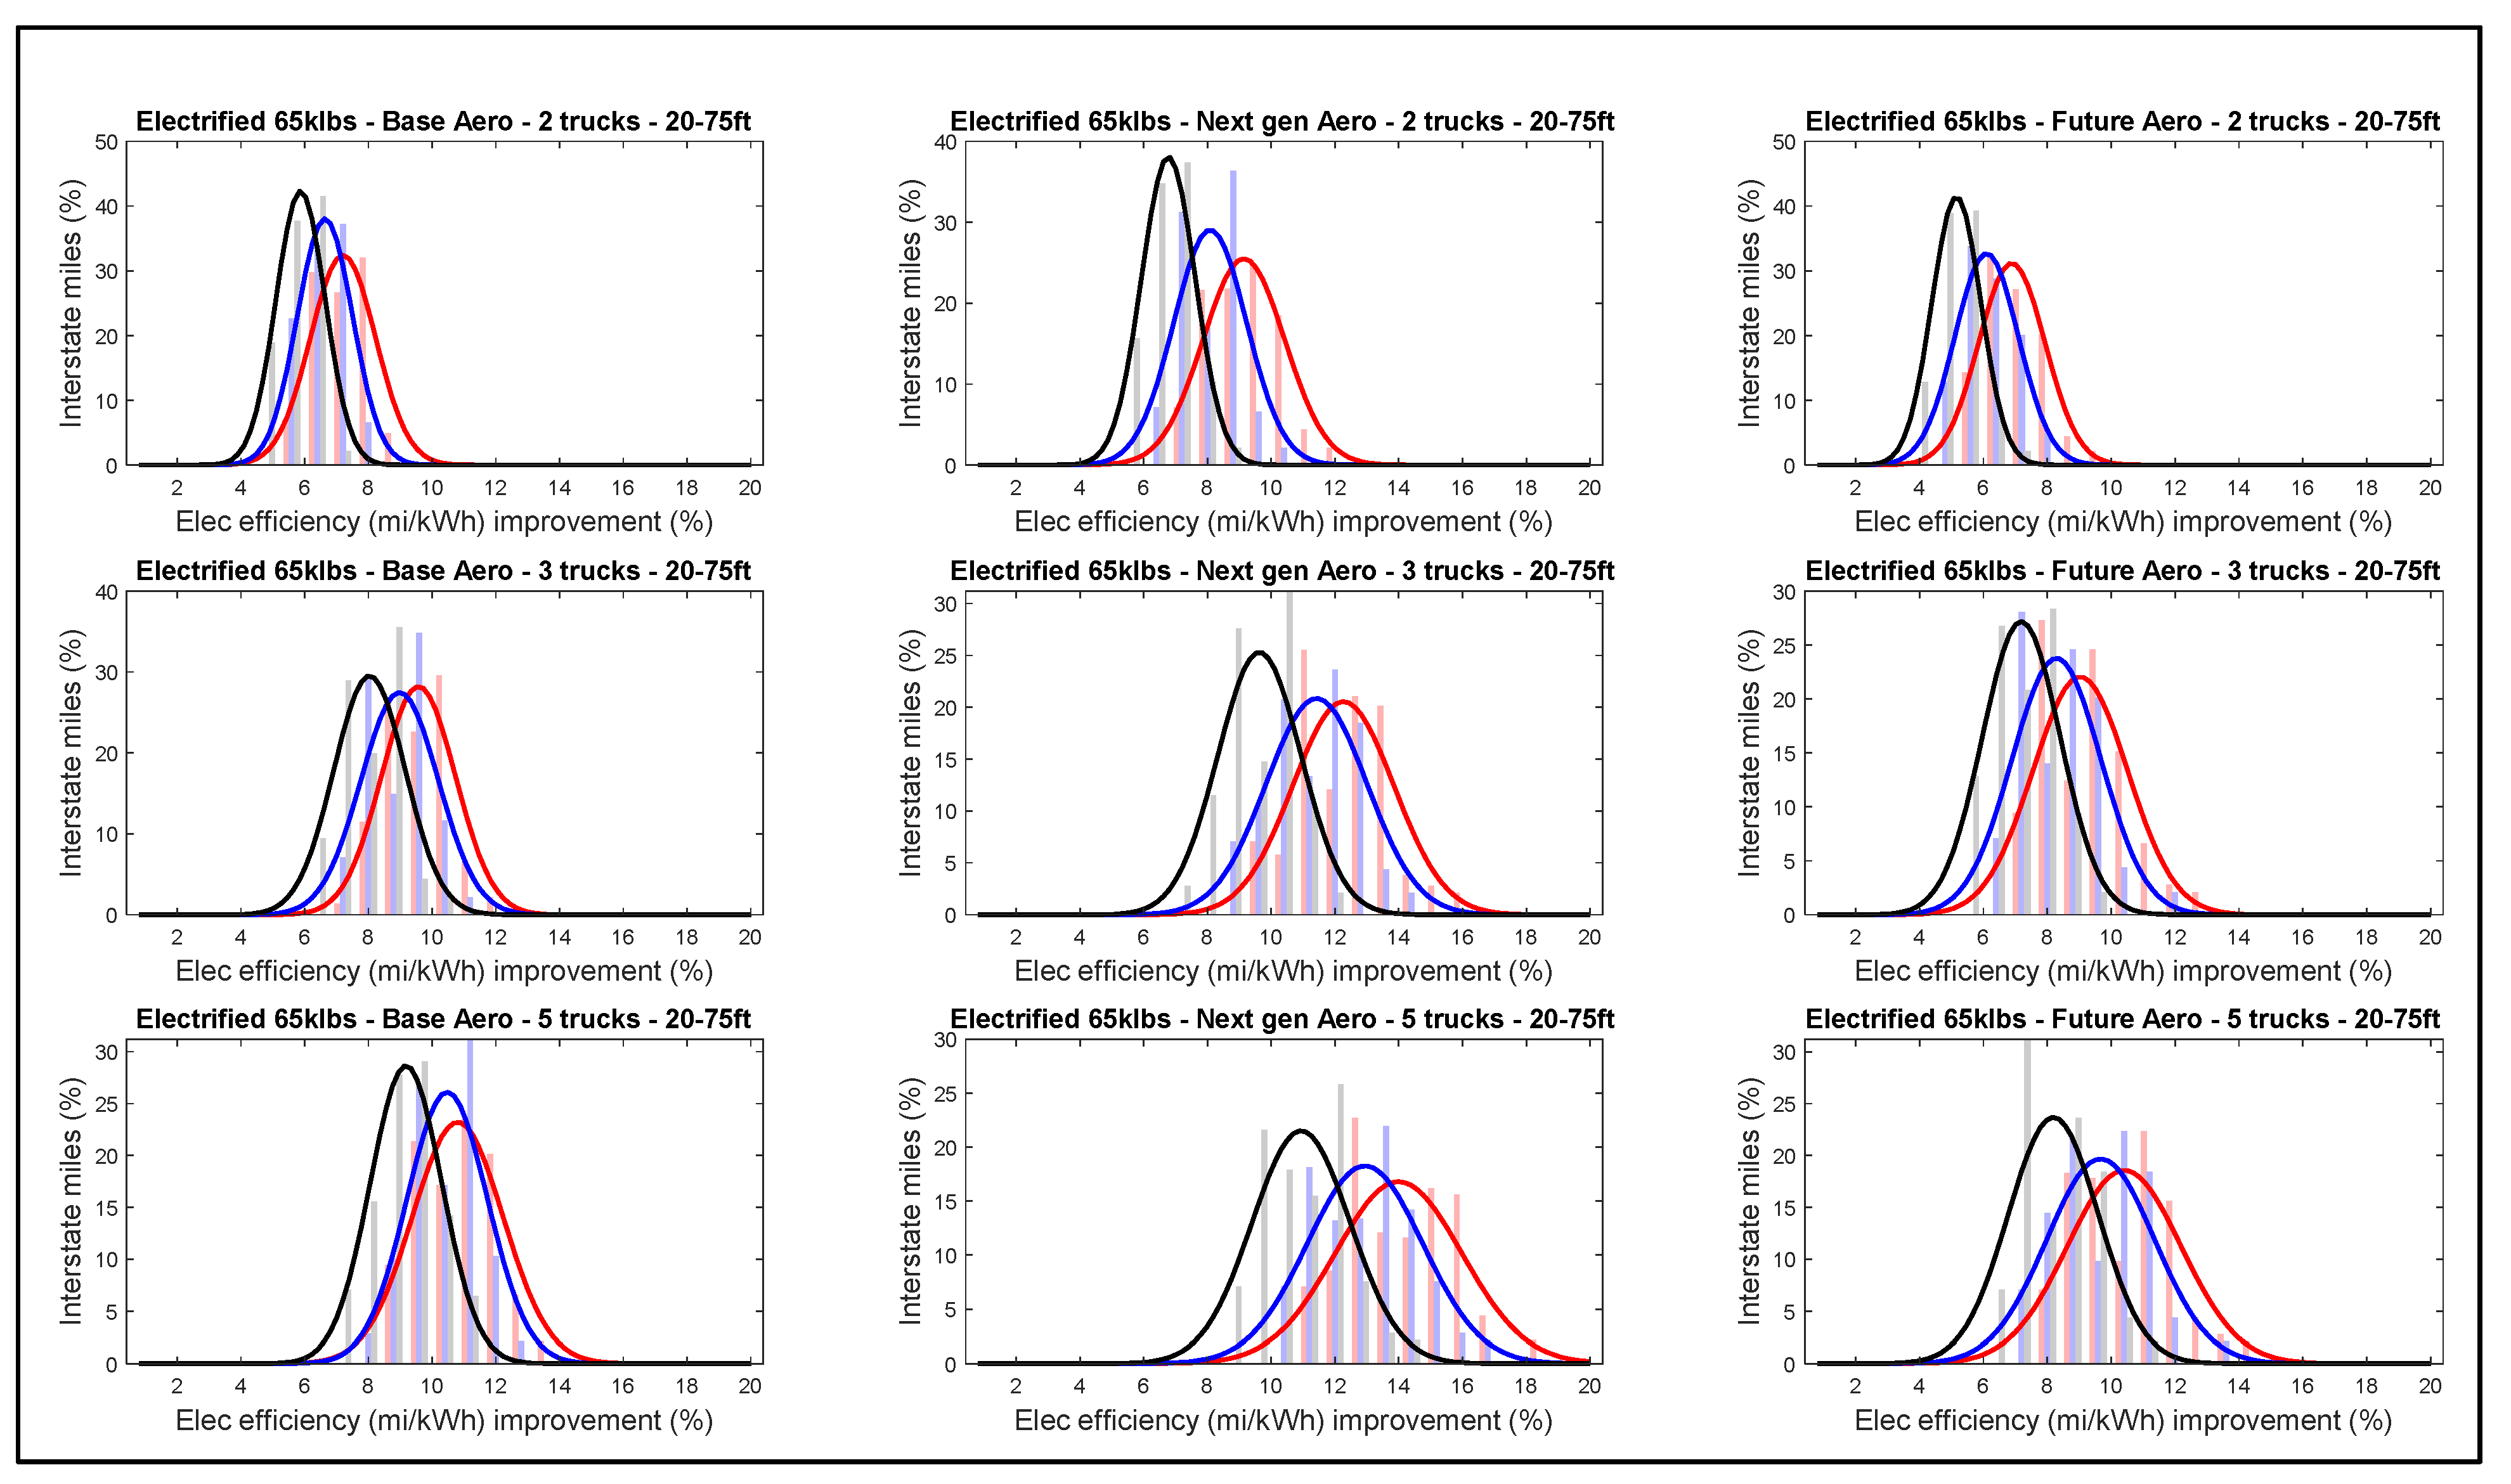
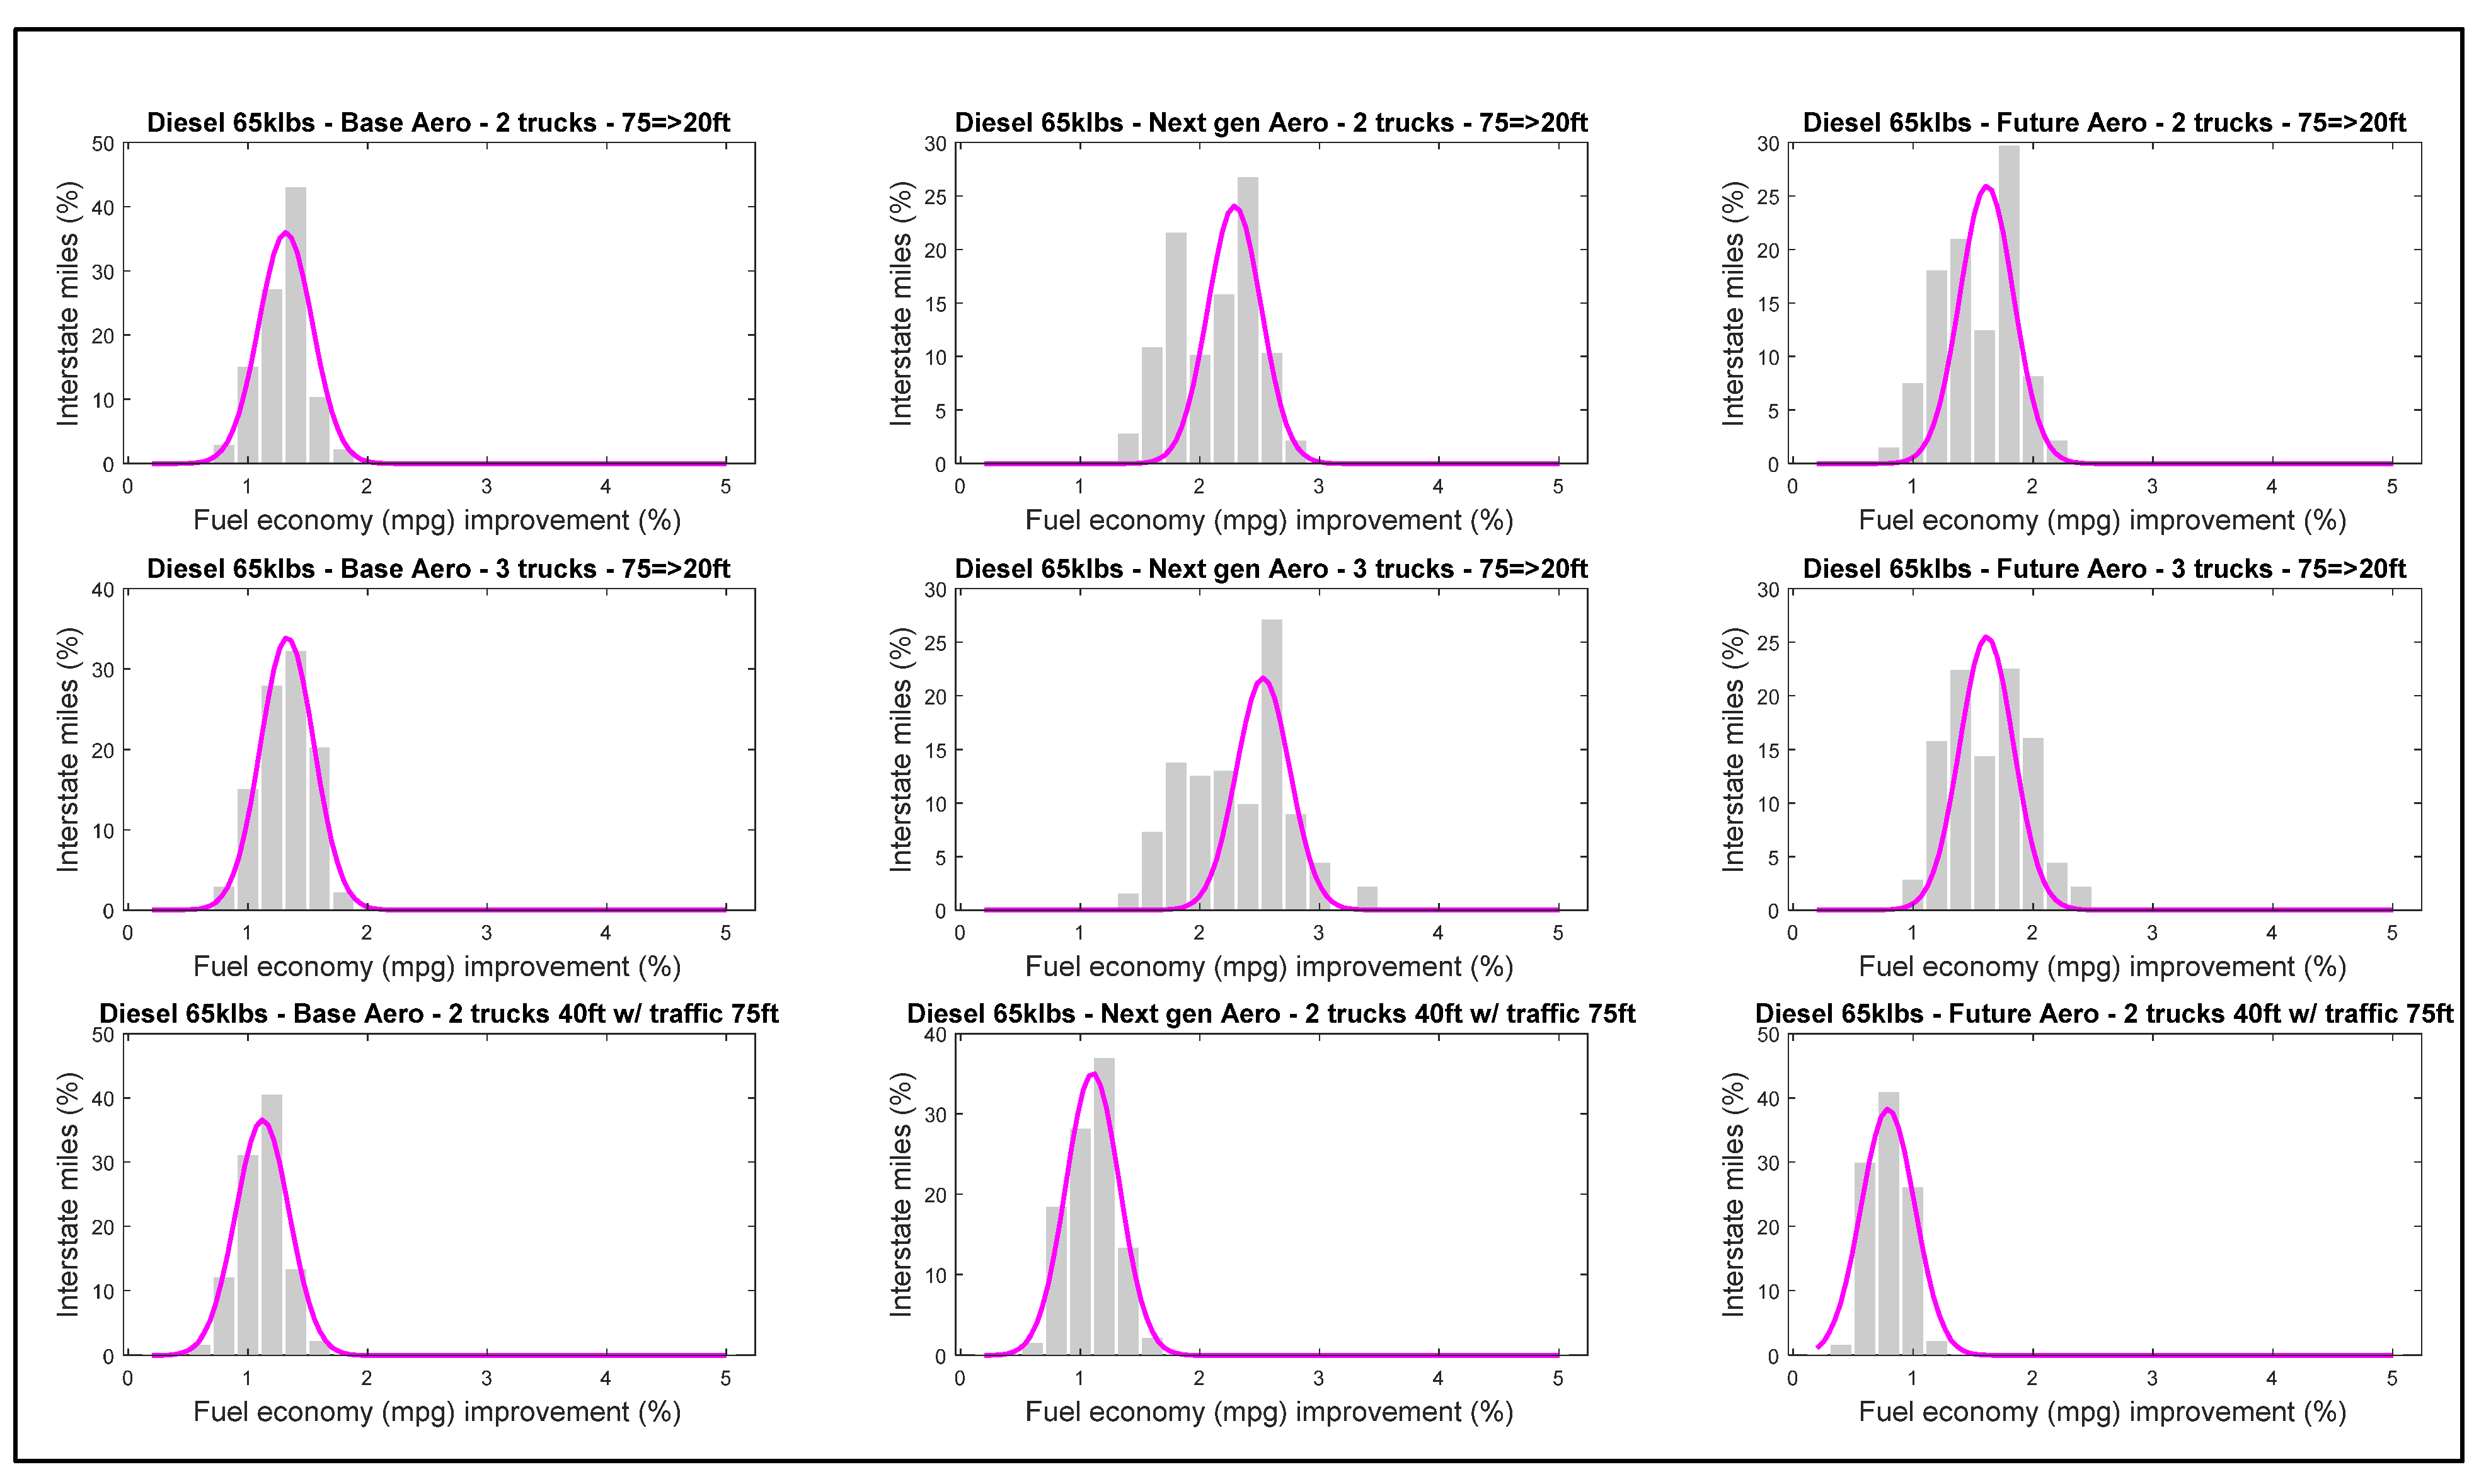
3. Interstate Road Models and Active Platooning Energy Improvements
4. Value Proposition of L1–L1 Automation
4.1. Scenario 1—Diesel v. BEV
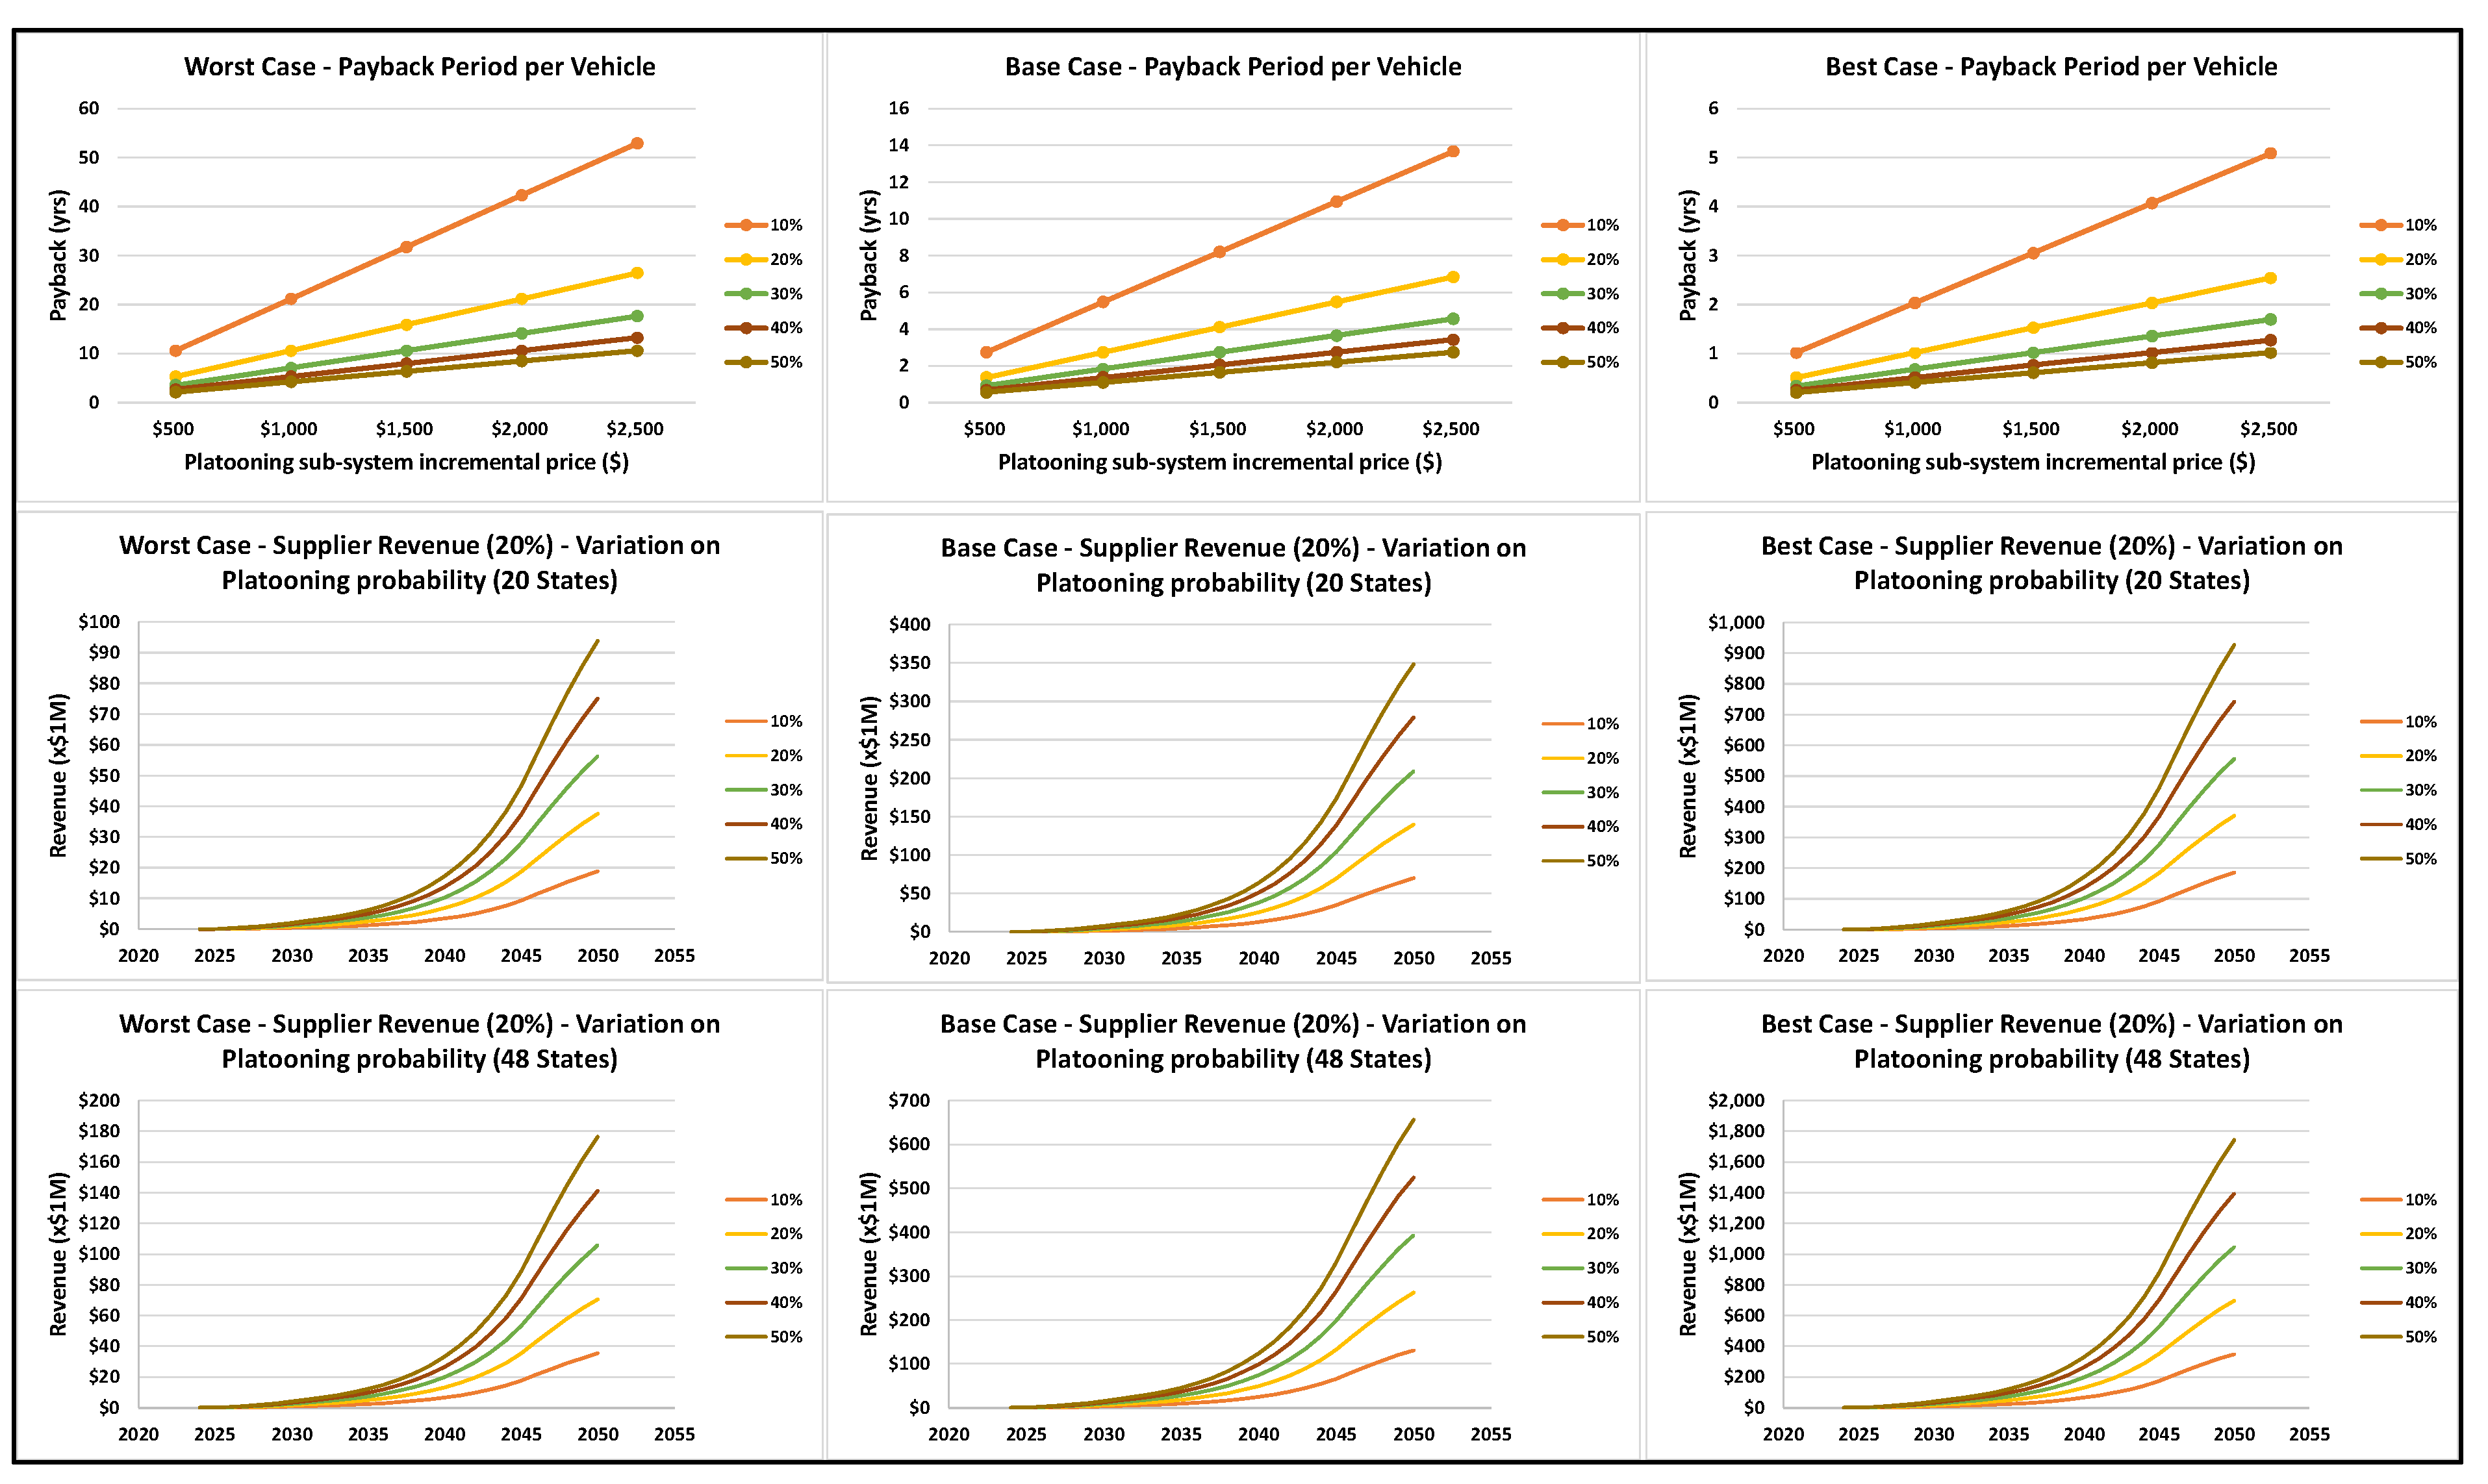
- Diesel payback: In the worst-case scenario, payback exceeds 2.1 years for all of the conditions shown and may not meet NA market expectations (payback periods of ≤ 1.5 years). However, by extrapolating the results, a payback of ≤ 1.5 years occurs if either
- ○
- Technology price is $500 and probability of finding a platooning partner > 63.1%
- ○
- Technology price is $2500 and probability of finding a platooning partner > 88.6%;
- Diesel payback: In the best-case scenario payback of ≤ 1.5 years occurs if either
- ○
- Technology price is $500 and probability of finding a platooning partner > 7.6%
- ○
- Technology price is $2500 and probability of finding a platooning partner > 34%;
- Diesel revenue: In the worst-case scenario, limited by current regulations (20 states), the revenue potential at:
- ○
- 10 years of adoption will range from $0.5 M to $5.1 M
- ○
- 20 years of adoption will range from $3.8 M to $38.3 M;
- Diesel revenue: In the best-case scenario, unlimited by current regulations (48 states), the revenue potential at:
- ○
- 10 years of adoption will range from $10 M to $99.8 M
- ○
- 20 years of adoption will range from $72.2 M to $722.1 M;
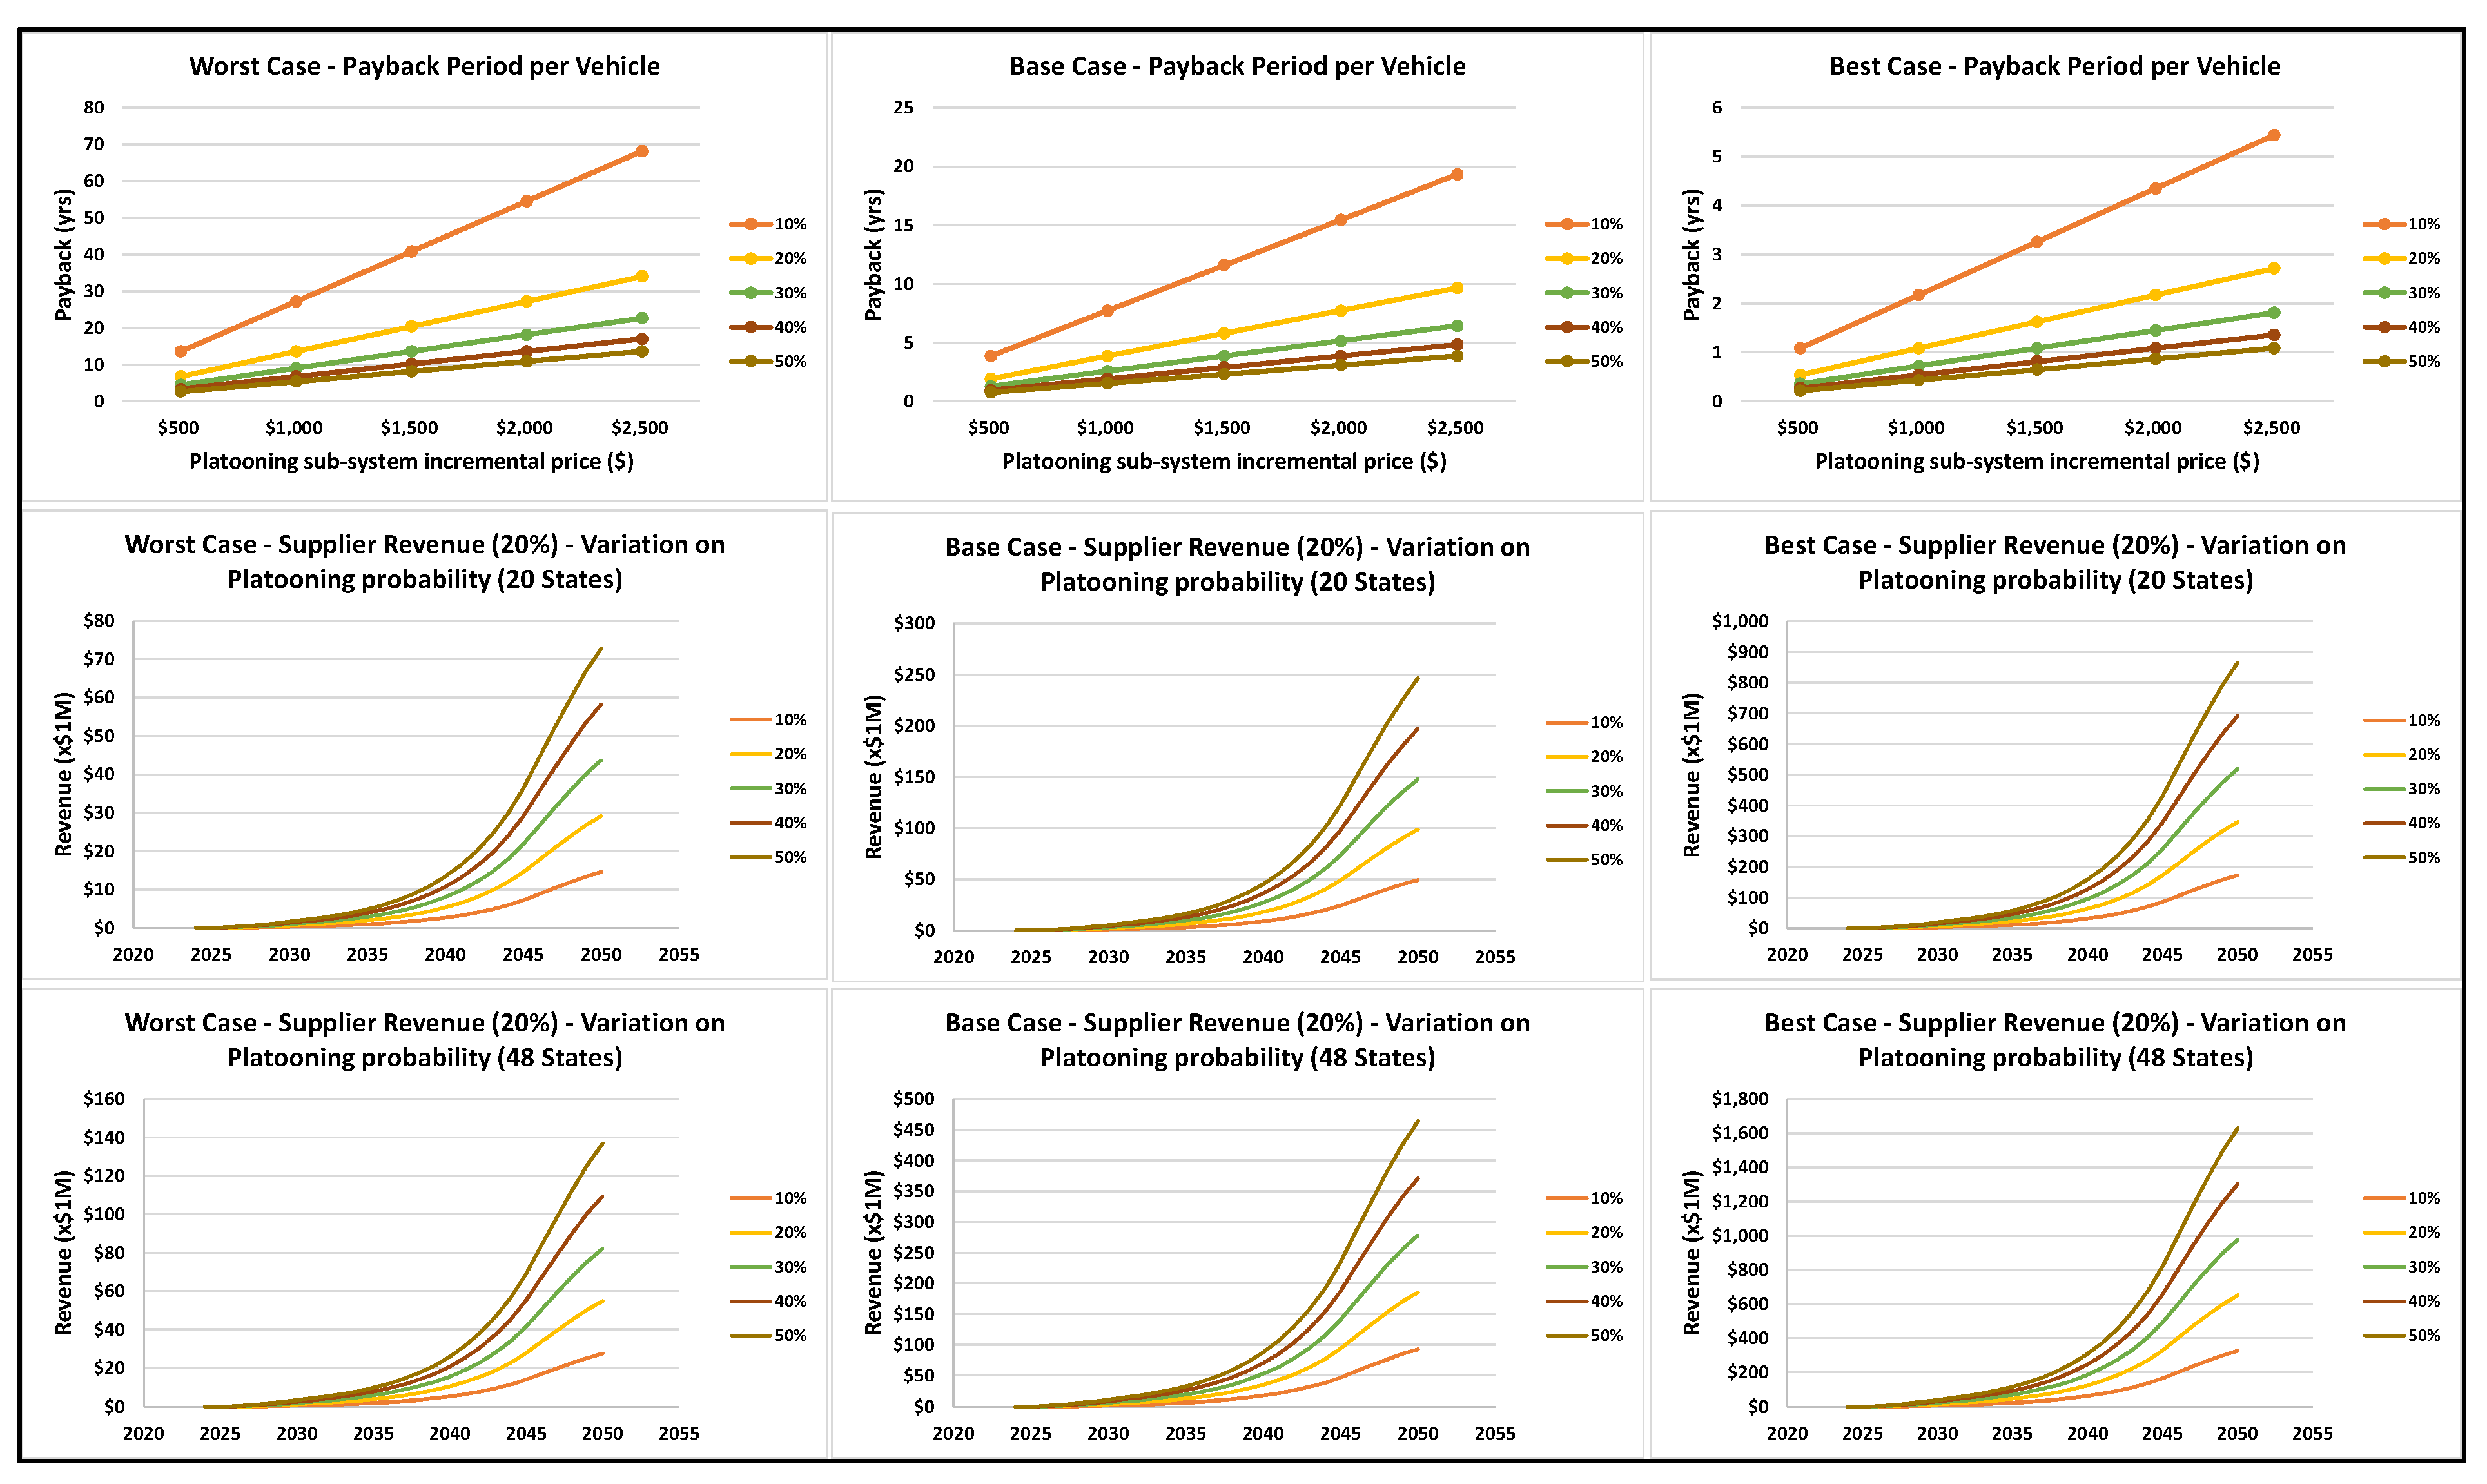
- Electric payback: In the worst-case scenario, payback exceeds 2.1 years for all of the conditions shown and may not meet NA market expectations (payback periods of ≤1.5 years). However, by extrapolating the results, a payback of ≤ 1.5 years occurs if either
- ○
- Technology price is $500 and probability of finding a platooning partner > 70.2%
- ○
- Technology price is $2500 and probability of finding a platooning partner > 90.5%;
- Electric payback: In the best-case scenario, payback of ≤ 1.5 years occurs if either
- ○
- Technology price is $500 and probability of finding a platooning partner > 8.1%
- ○
- Technology price is $2500 and probability of finding a platooning partner > 36.4%;
- Electric revenue: In the worst-case scenario, limited by current regulations (20 states), the revenue potential at:
- ○
- 10 years of adoption will range from $0.4 M to $4 M
- ○
- 20 years of adoption will range from $3 M to $29.7 M;
- Electric revenue: In the best-case scenario, unlimited by current regulations (48 states), the revenue potential at:
- ○
- 10 years of adoption will range from $9.3 M to $93.3 M
- ○
- 20 years of adoption will range from $67.5 M to $675.2 M.
4.2. Scenario 2—Diesel v. BEV—Changed Adoption Model
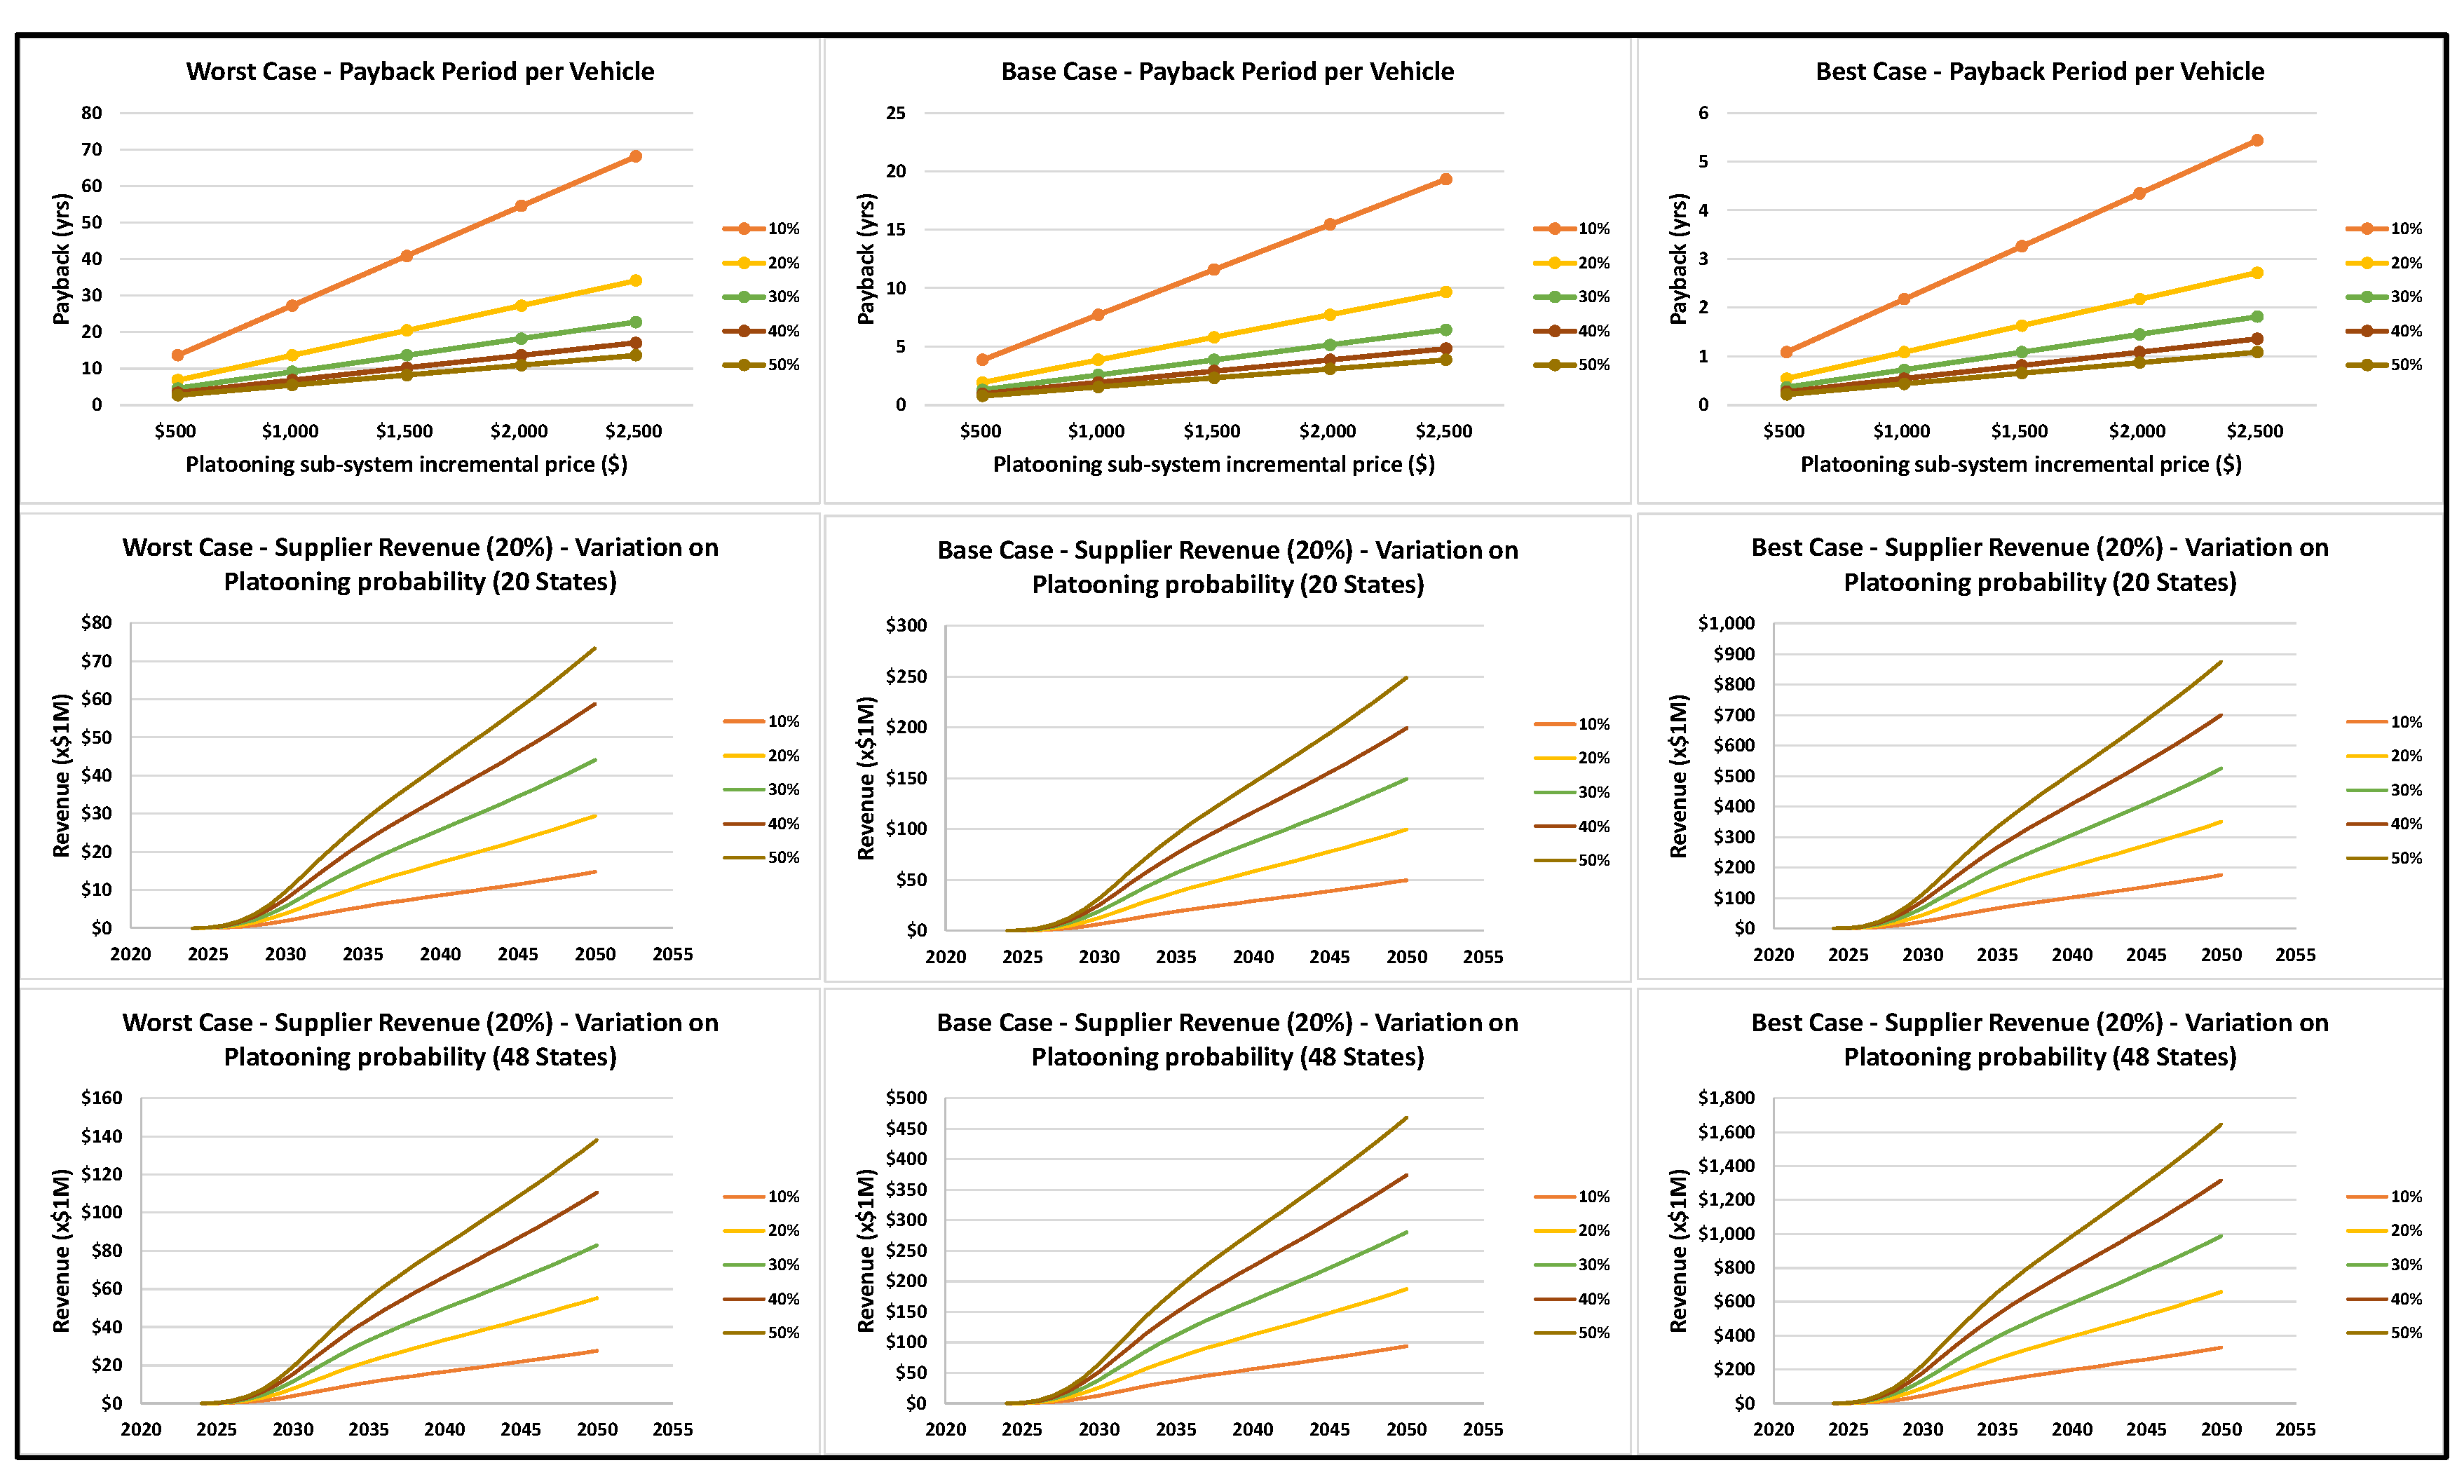
- Diesel payback: Adoption model change does not have any impact to the payback, and these are as previously reported;
- Diesel revenue: In the worst-case scenario, limited by current regulations (20 states), the revenue potential at:
- ○
- 10 years of adoption will range from $3.2 M to $31.7 M
- ○
- 20 years of adoption will range from $7 M to $70.2 M;
- Diesel revenue: In the best-case scenario, unlimited by current regulations (48 states), the revenue potential at:
- ○
- 10 years of adoption will range from $61.9 M to $619 M
- ○
- 20 years of adoption will range from $132.3 M to $1323.1 M;
- Electric payback: Adoption model change does not have any impact to the payback, and these are as previously reported;
- Electric revenue: In the worst-case scenario, limited by current regulations (20 states), the revenue potential at:
- ○
- 10 years of adoption will range from $2.5 M to $24.6 M
- ○
- 20 years of adoption will range from $5.4 M to $54.5 M;
- Electric revenue: In the best-case scenario, unlimited by current regulations (48 states), the revenue potential at:
- ○
- 10 years of adoption will range from $57.9 M to $578.8 M
- ○
- 20 years of adoption will range from $123.7 M to $1237.2 M.
5. Value Proposition of L1–L4 Automation (Following Vehicle)
5.1. Scenario 1—Diesel v. BEV—Driver/Vehicle Hourly Value at Median ($24.09/h)
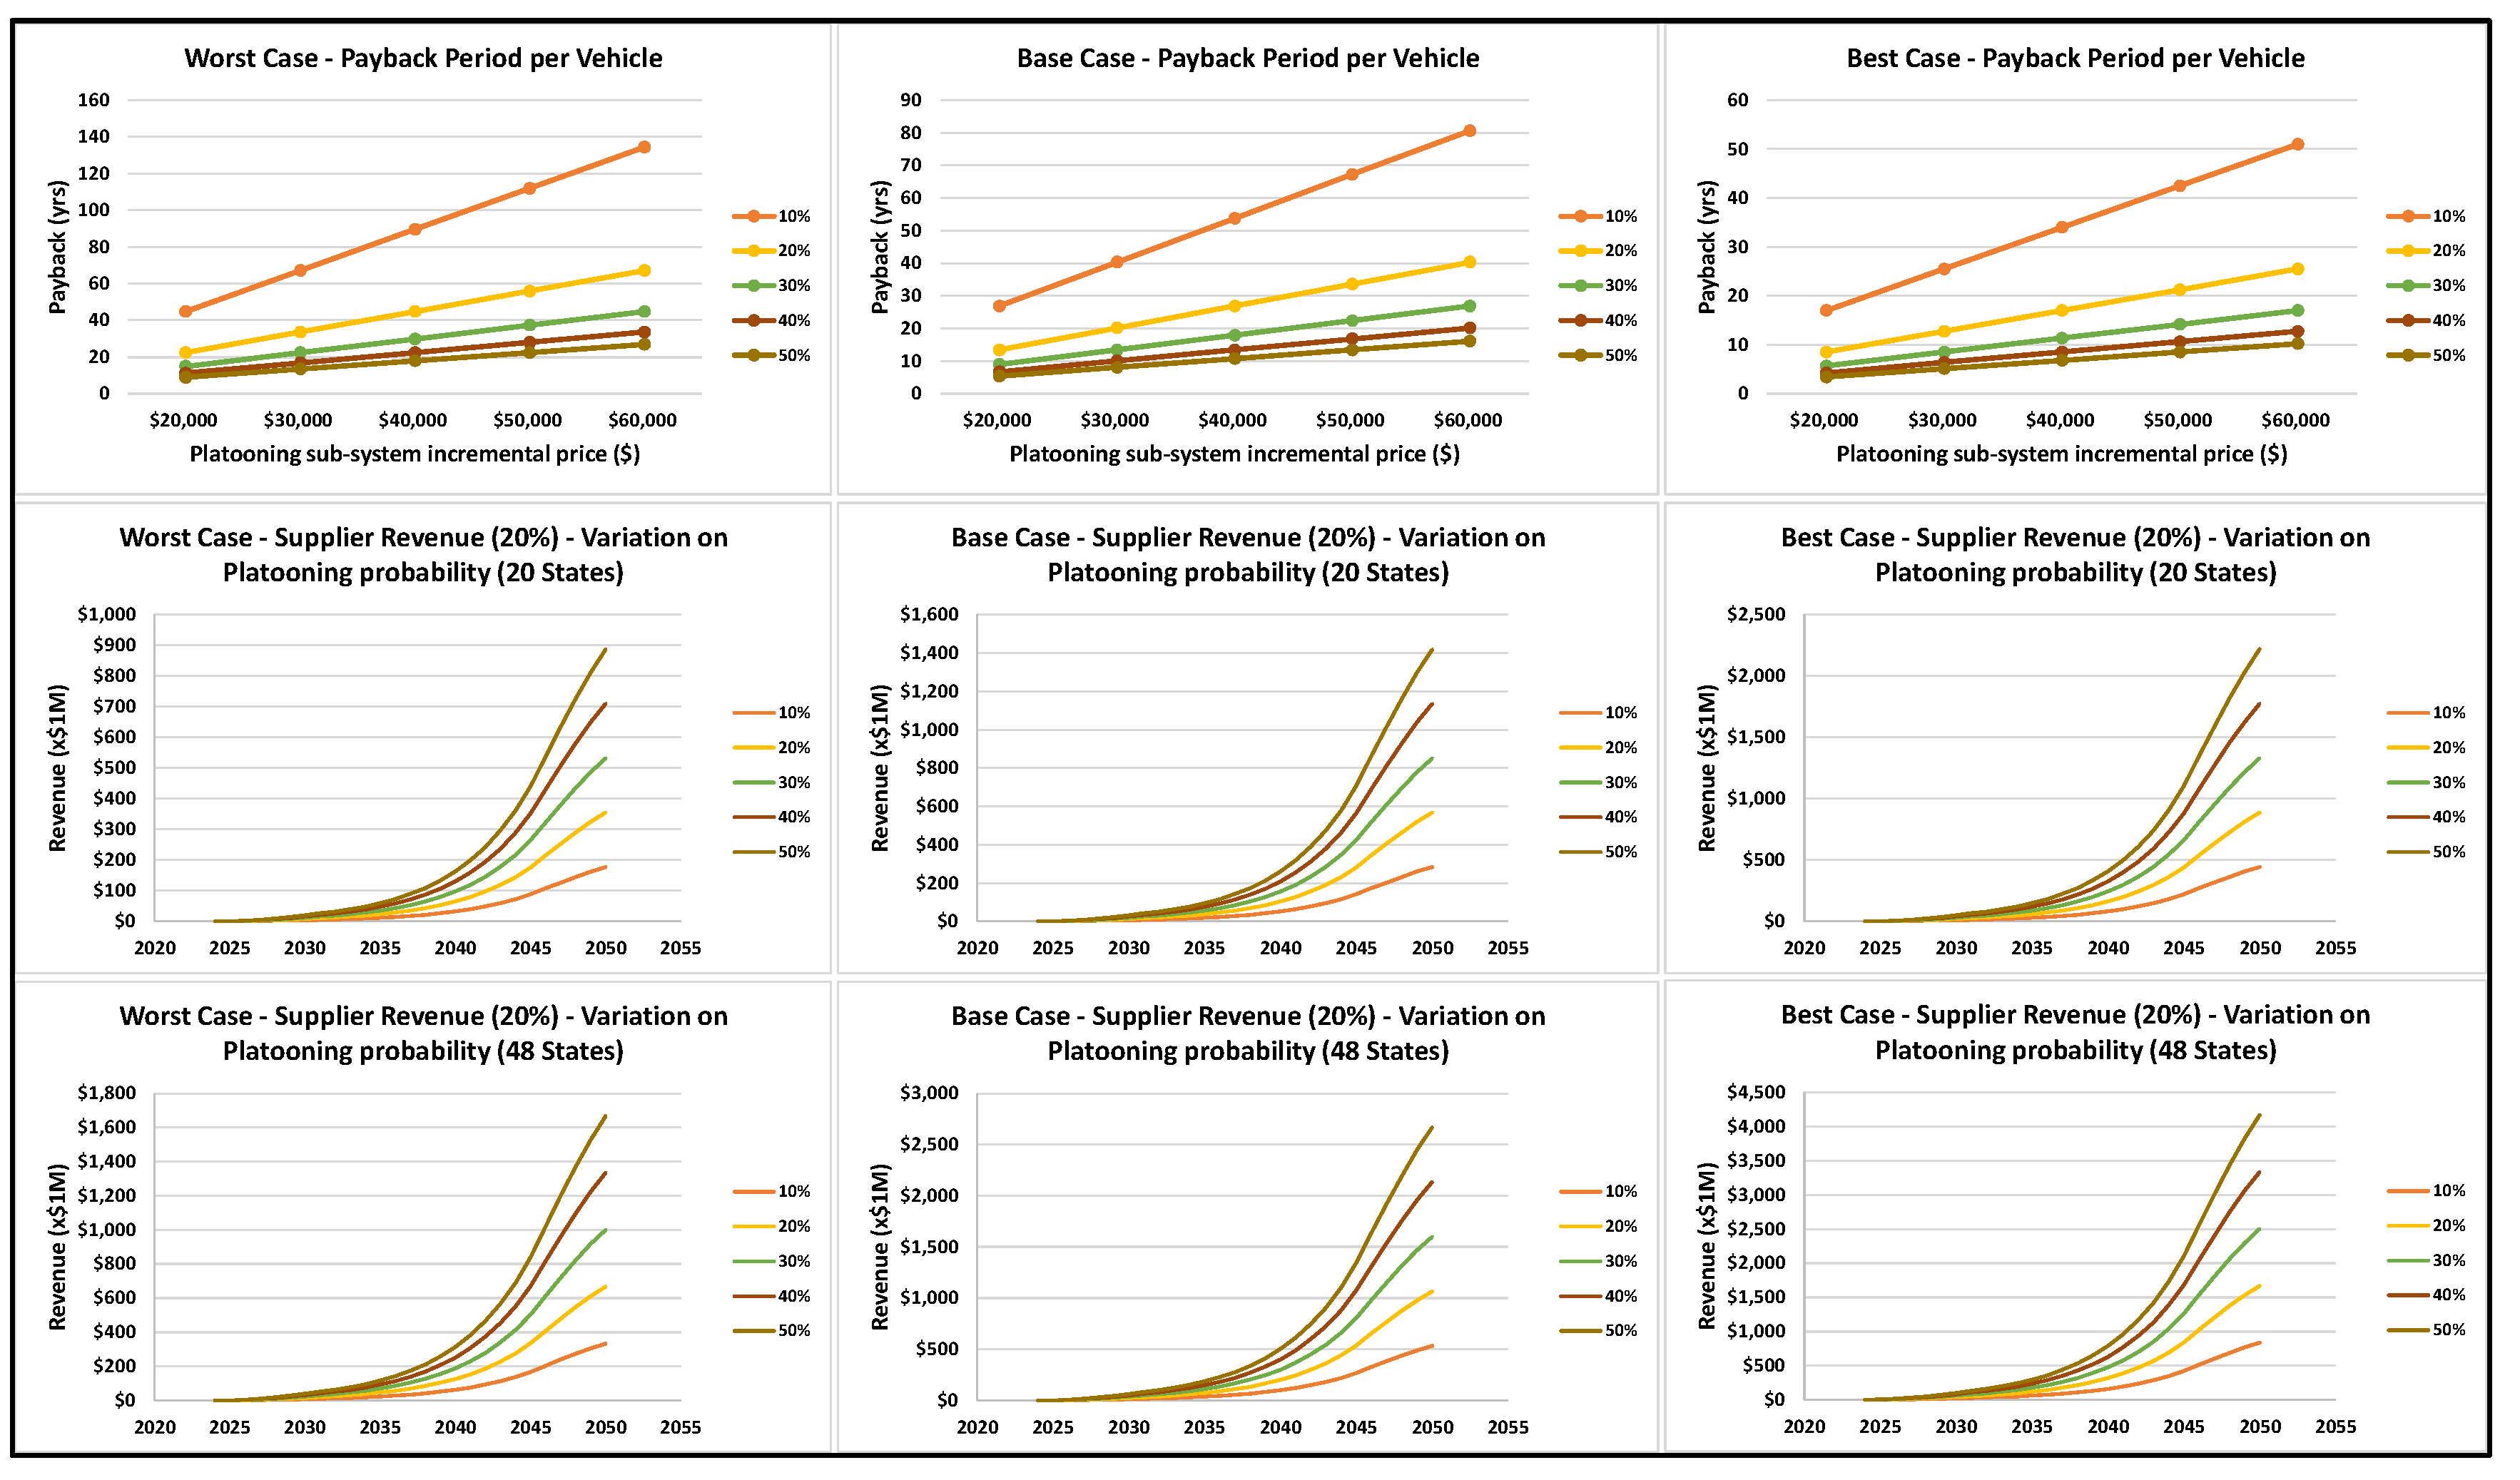
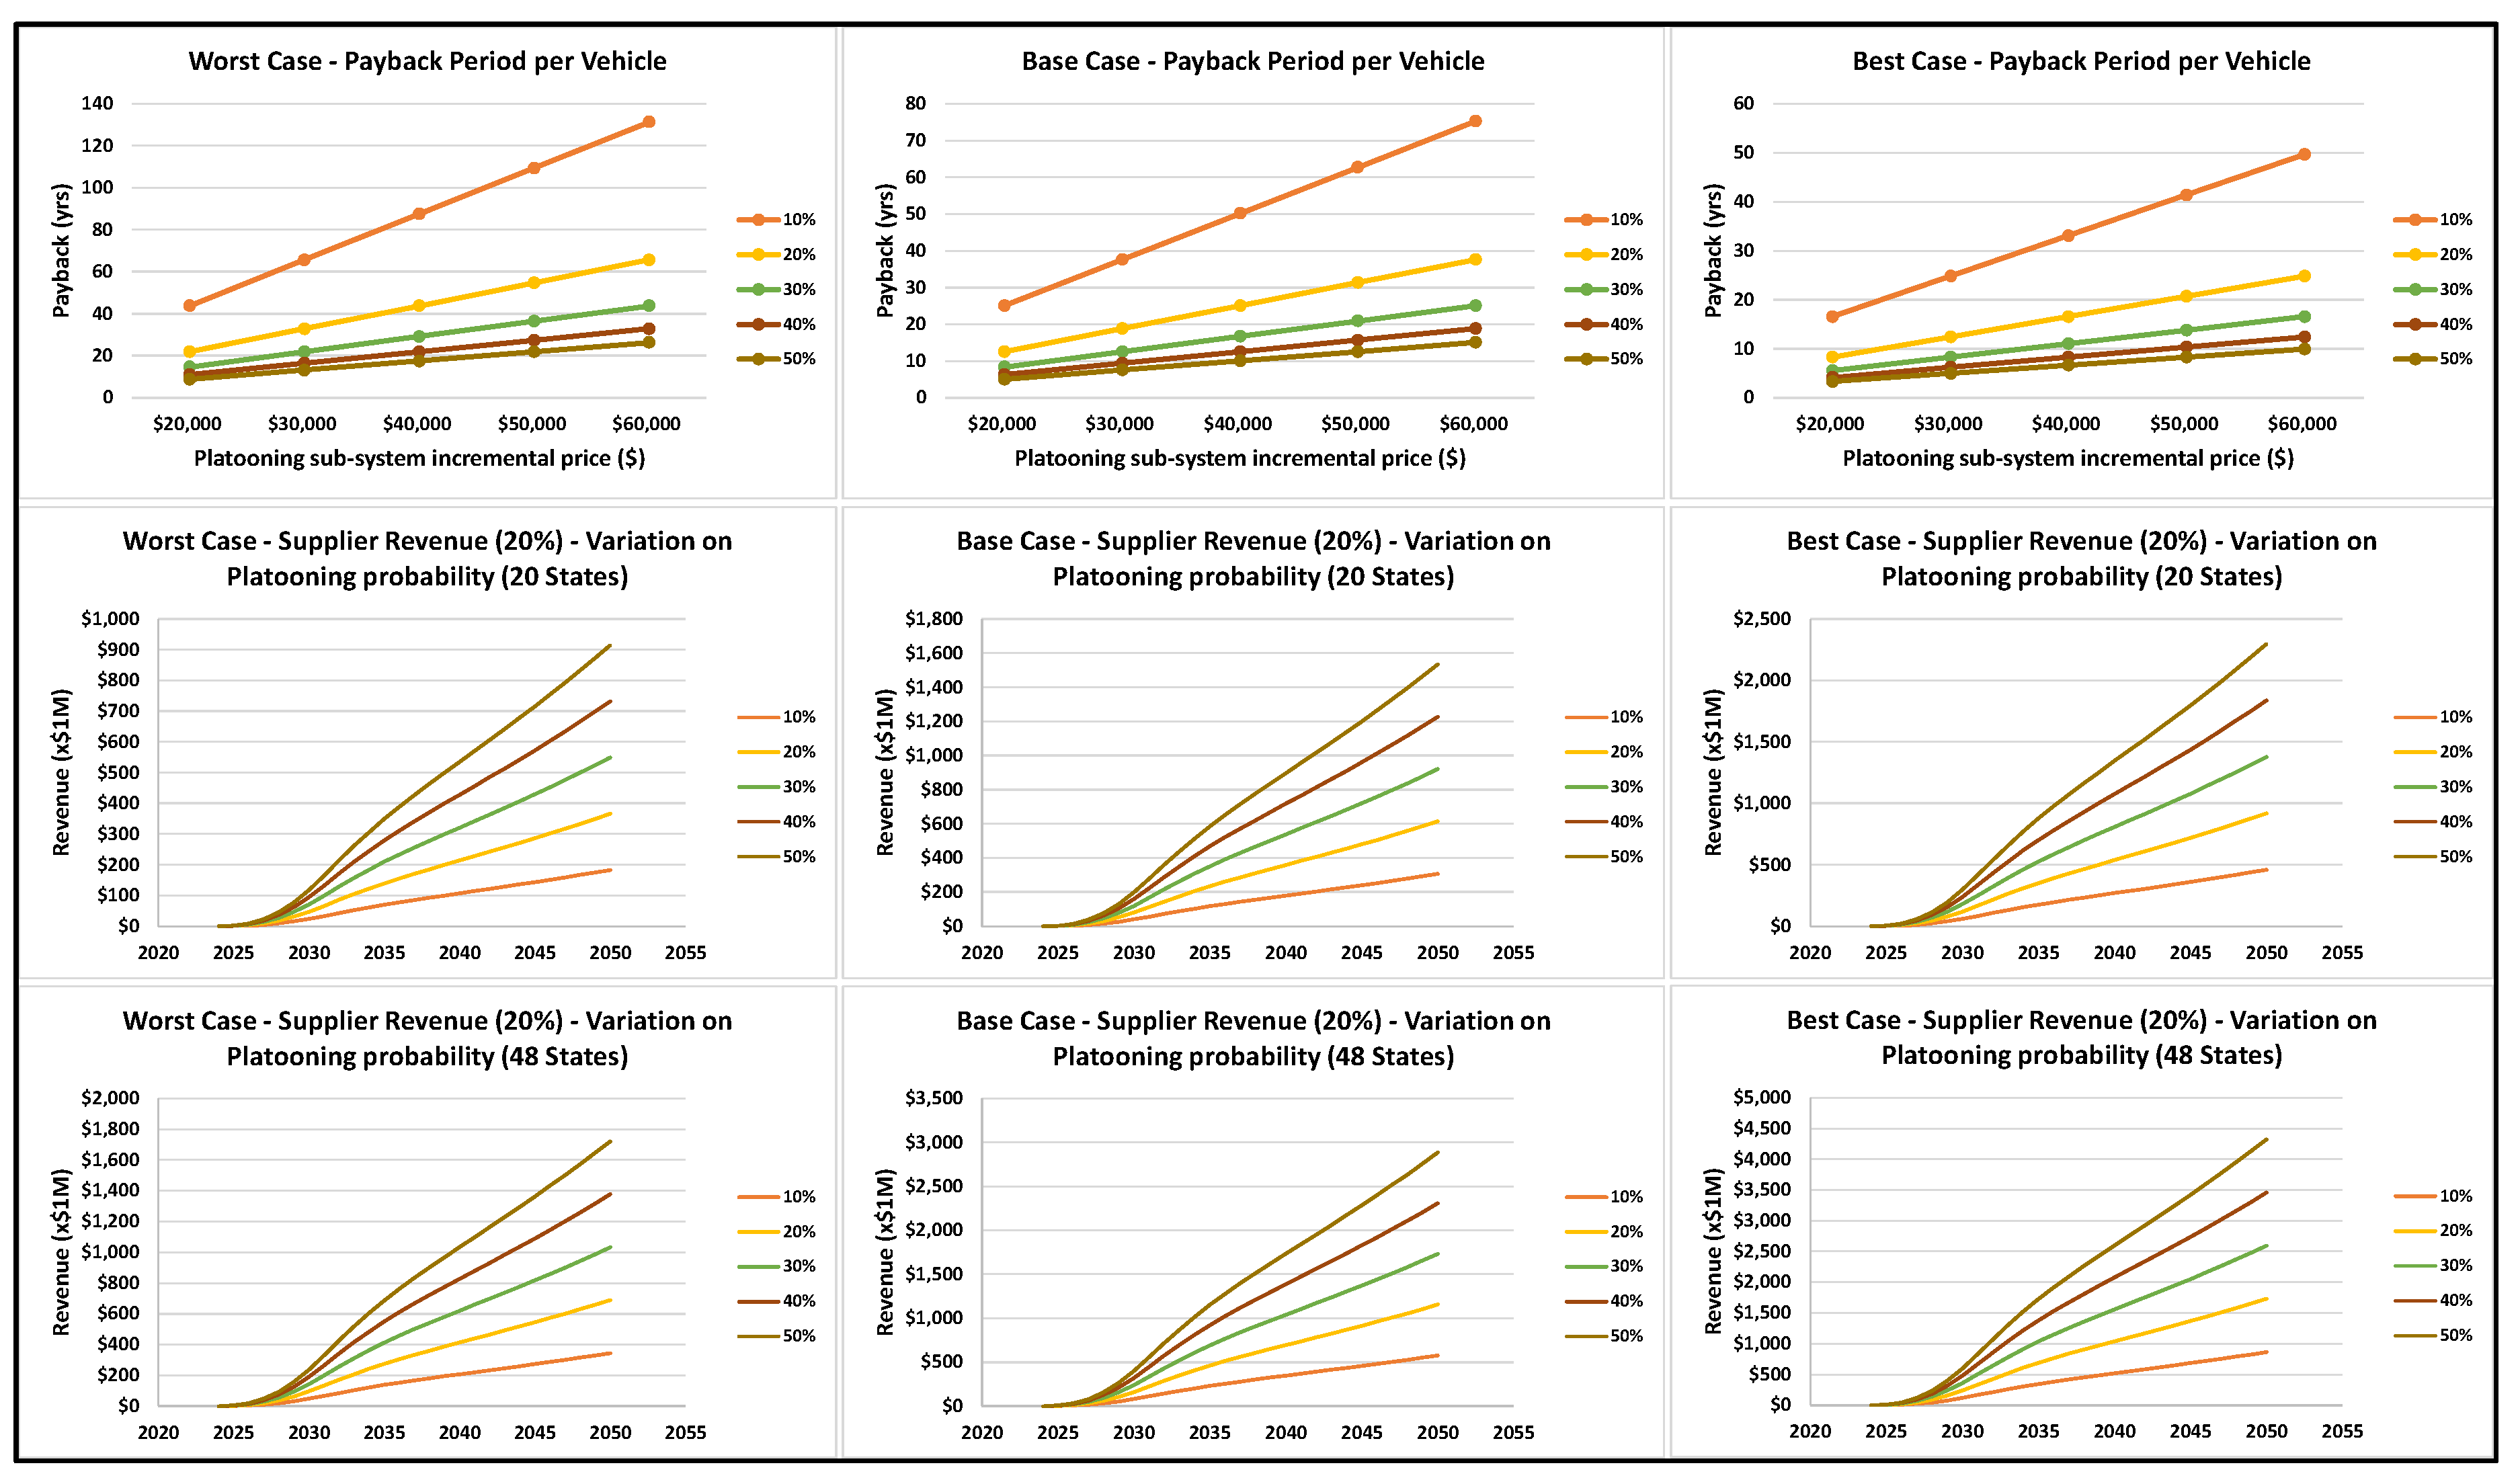
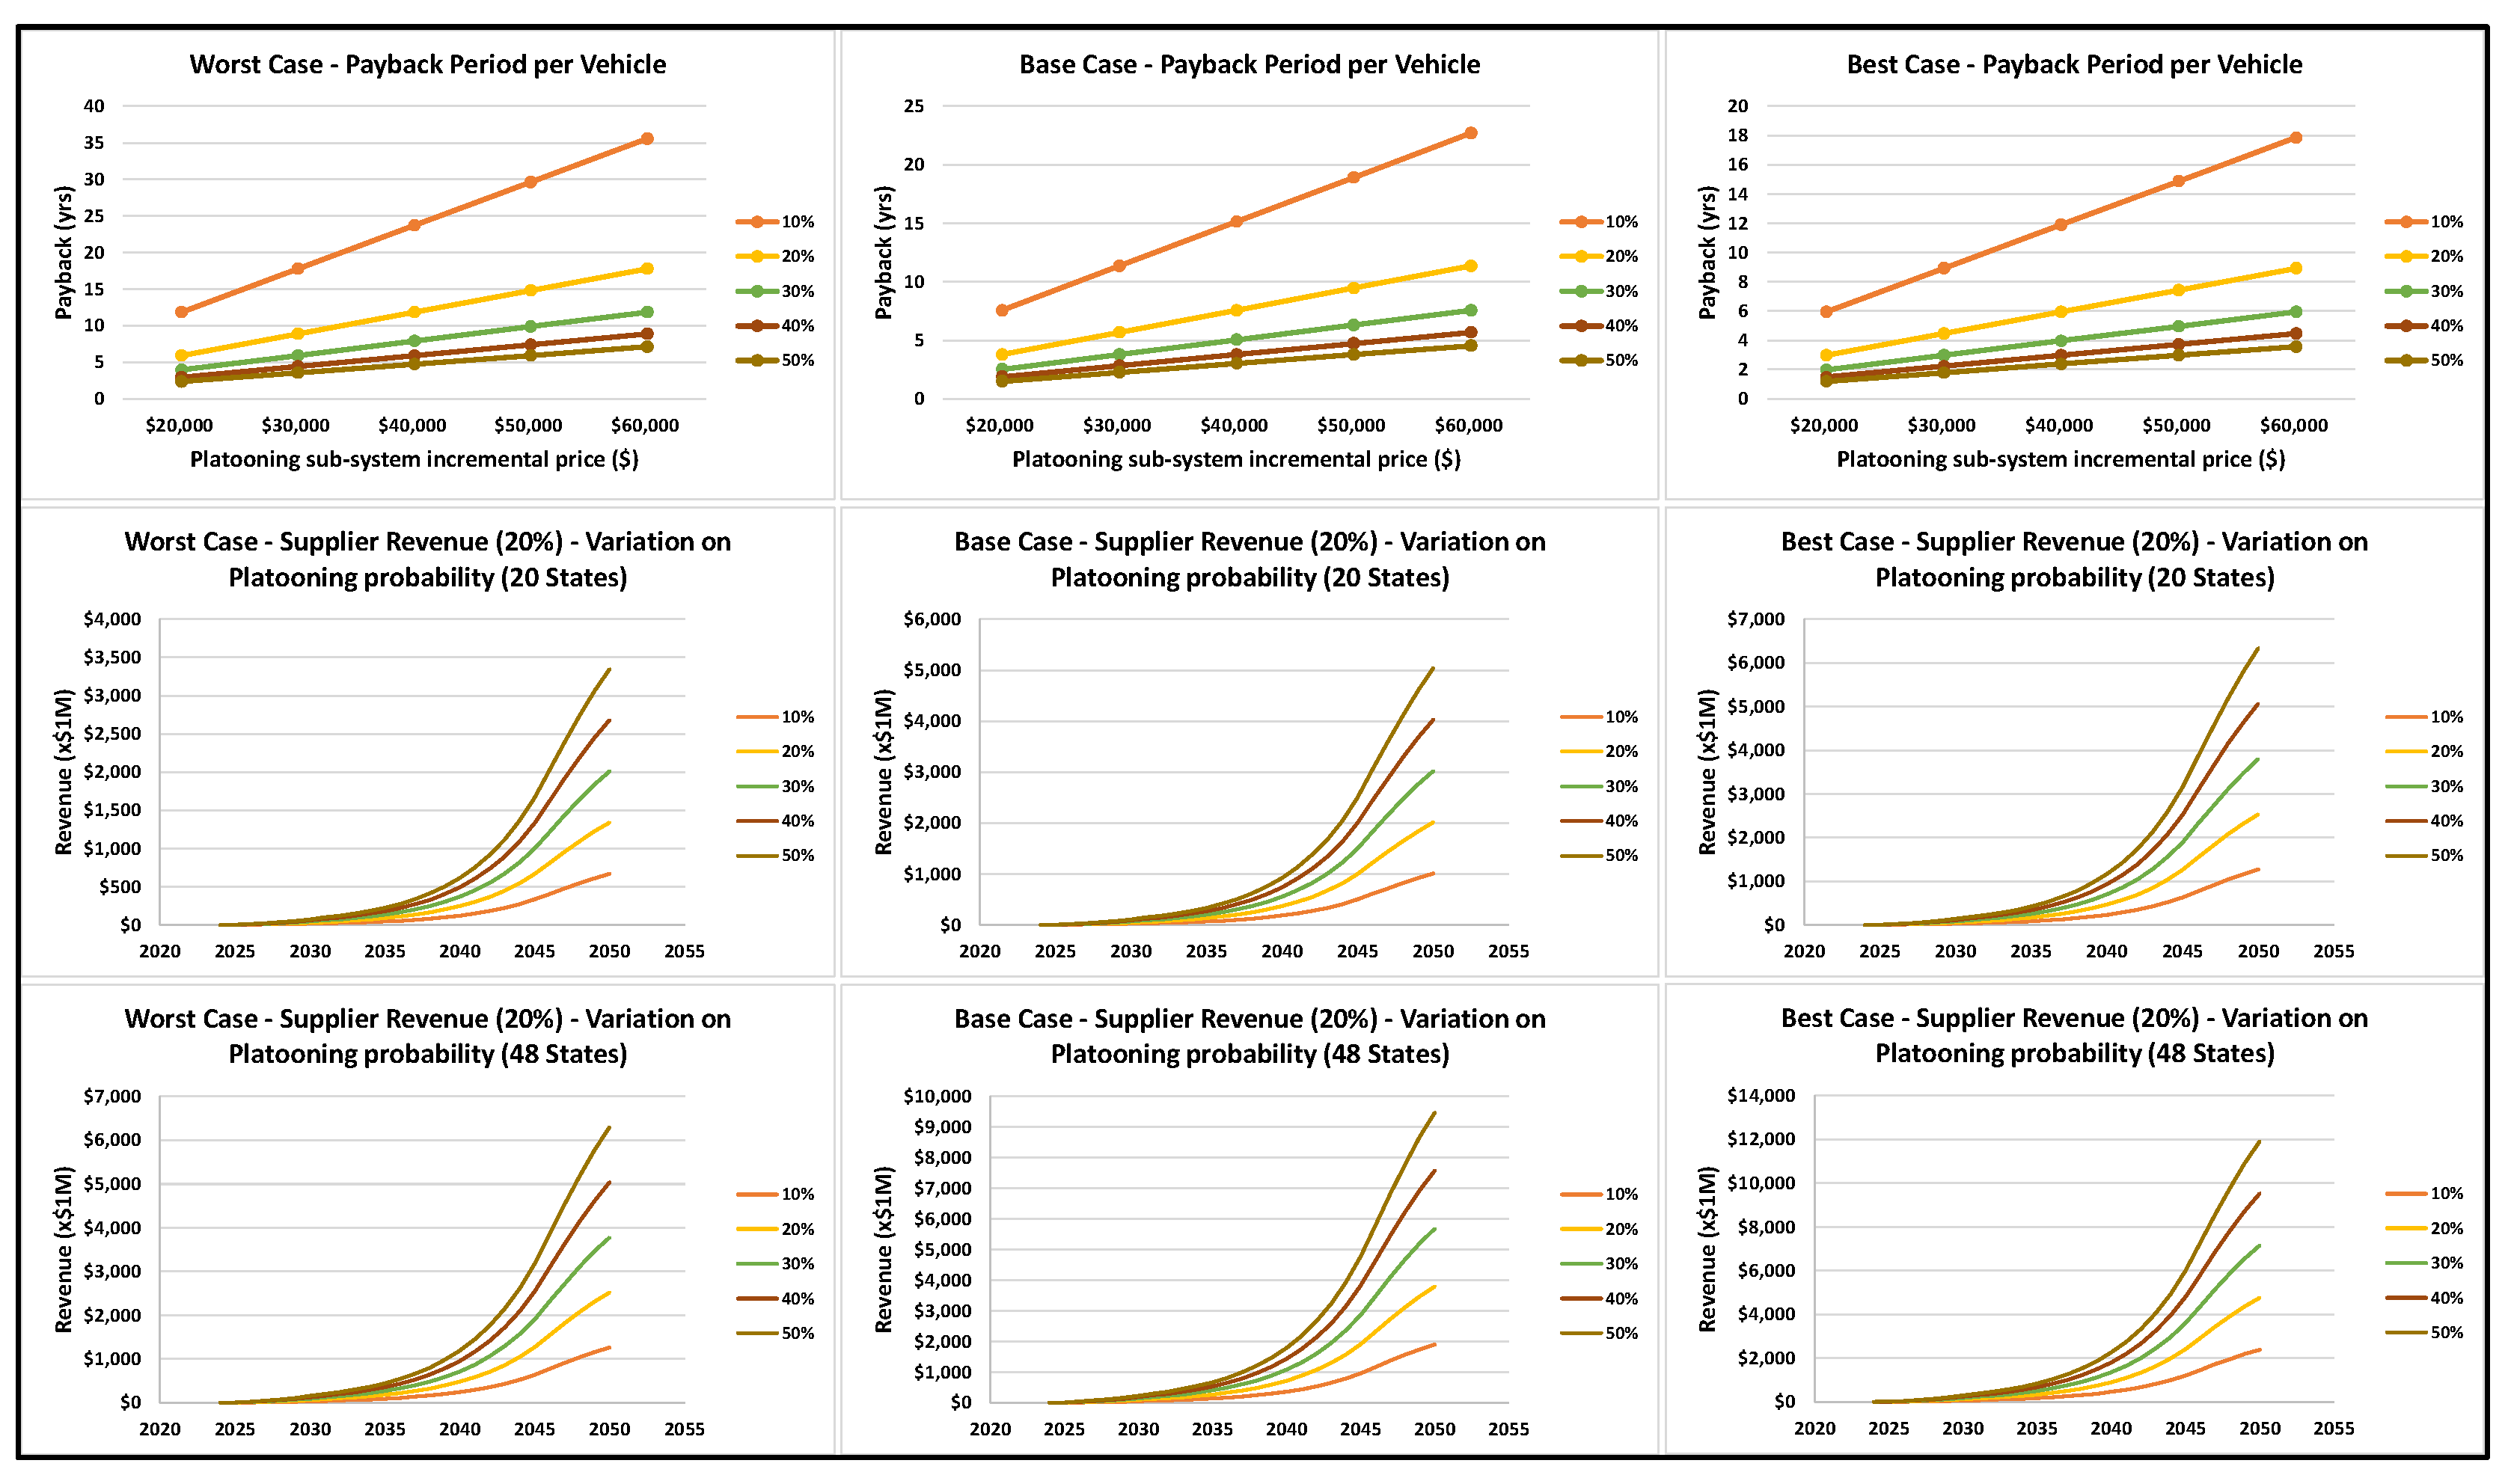
- Diesel payback: In the worst-case scenario, payback of ≤ 1.5 years occurs if either
- ○
- Technology price is $20,000 and probability of finding a platooning partner > 87.3%
- ○
- Technology price is $60,000 and probability of finding a platooning partner > 92.4%;
- Diesel payback: In the best-case scenario, payback of ≤ 1.5 years occurs if either
- ○
- Technology price is $20,000 and probability of finding a platooning partner > 74.6%
- ○
- Technology price is $60,000 and probability of finding a platooning partner > 88.2%;
- Diesel revenue: In the worst-case scenario, limited by current regulations (20 states), the revenue potential at:
- ○
- 10 years of adoption will range from $4.9 M to $49.4 M
- ○
- 20 years of adoption will range from $37 M to $370.3 M;
- Diesel revenue: In the best-case scenario, unlimited by current regulations (48 states) the revenue potential at:
- ○
- 10 years of adoption will range from $24.5 M to $245.3 M
- ○
- 20 years of adoption will range from $177.5 M to $1775.5 M;
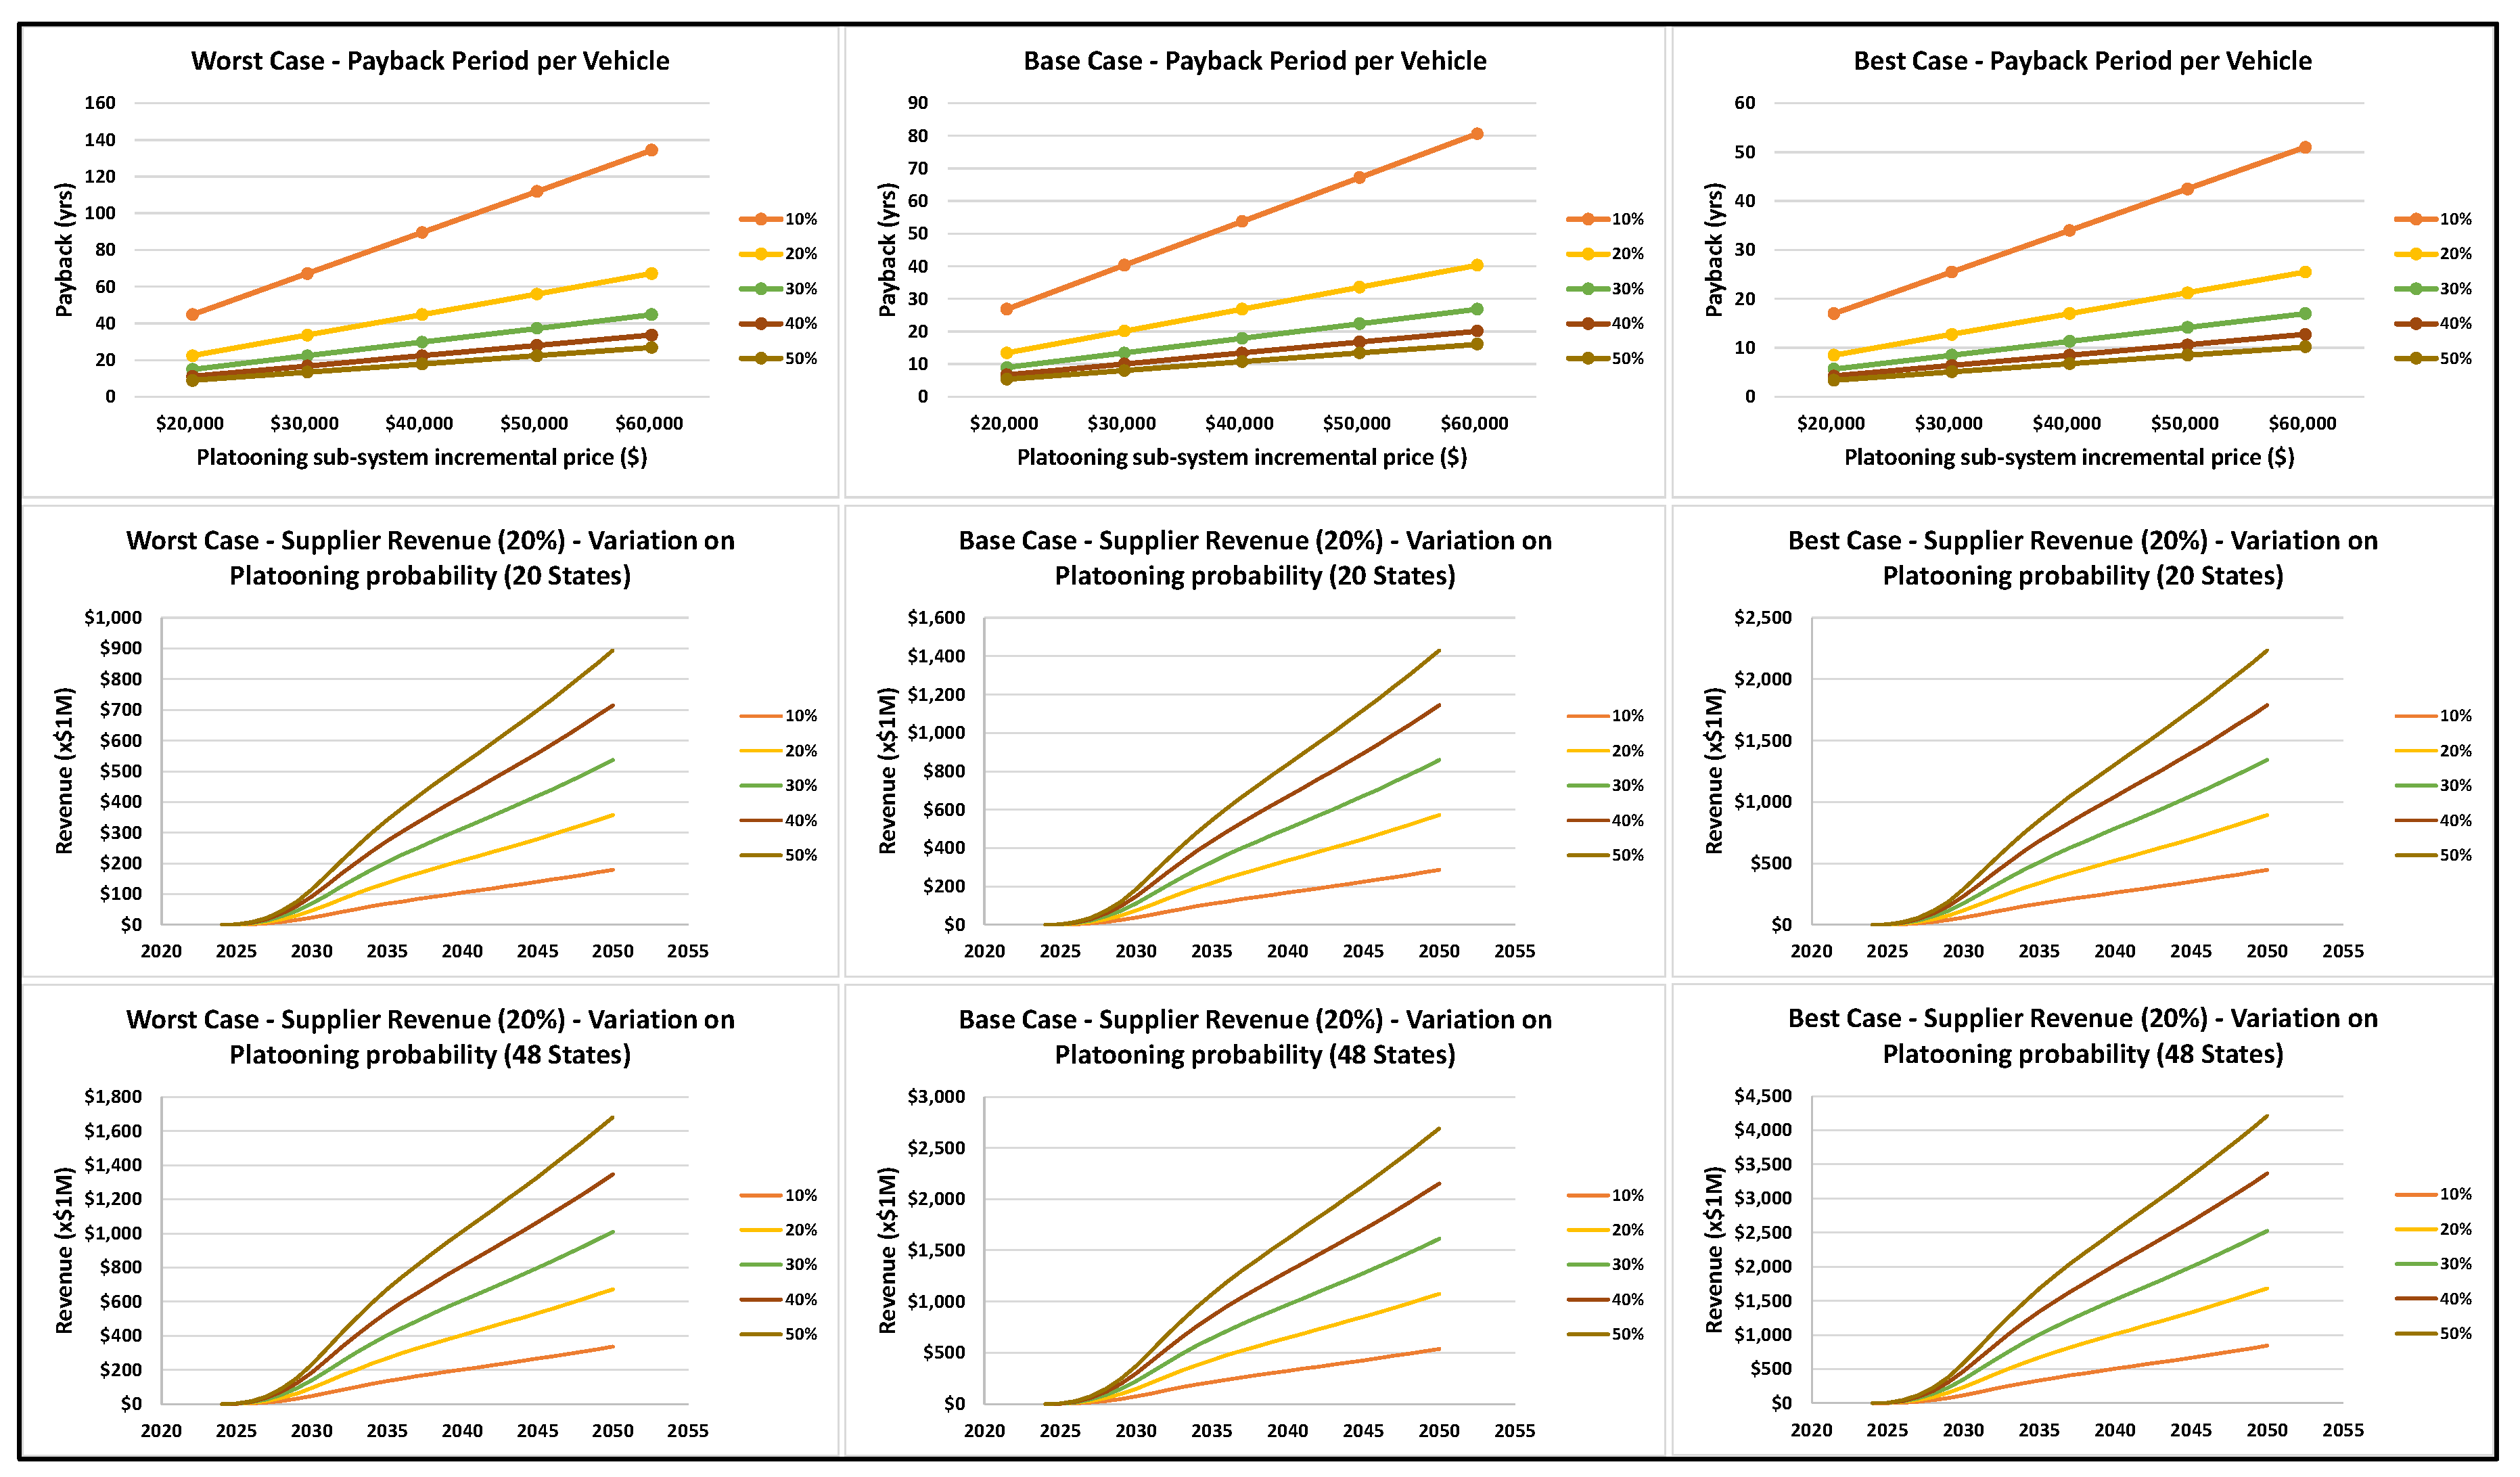
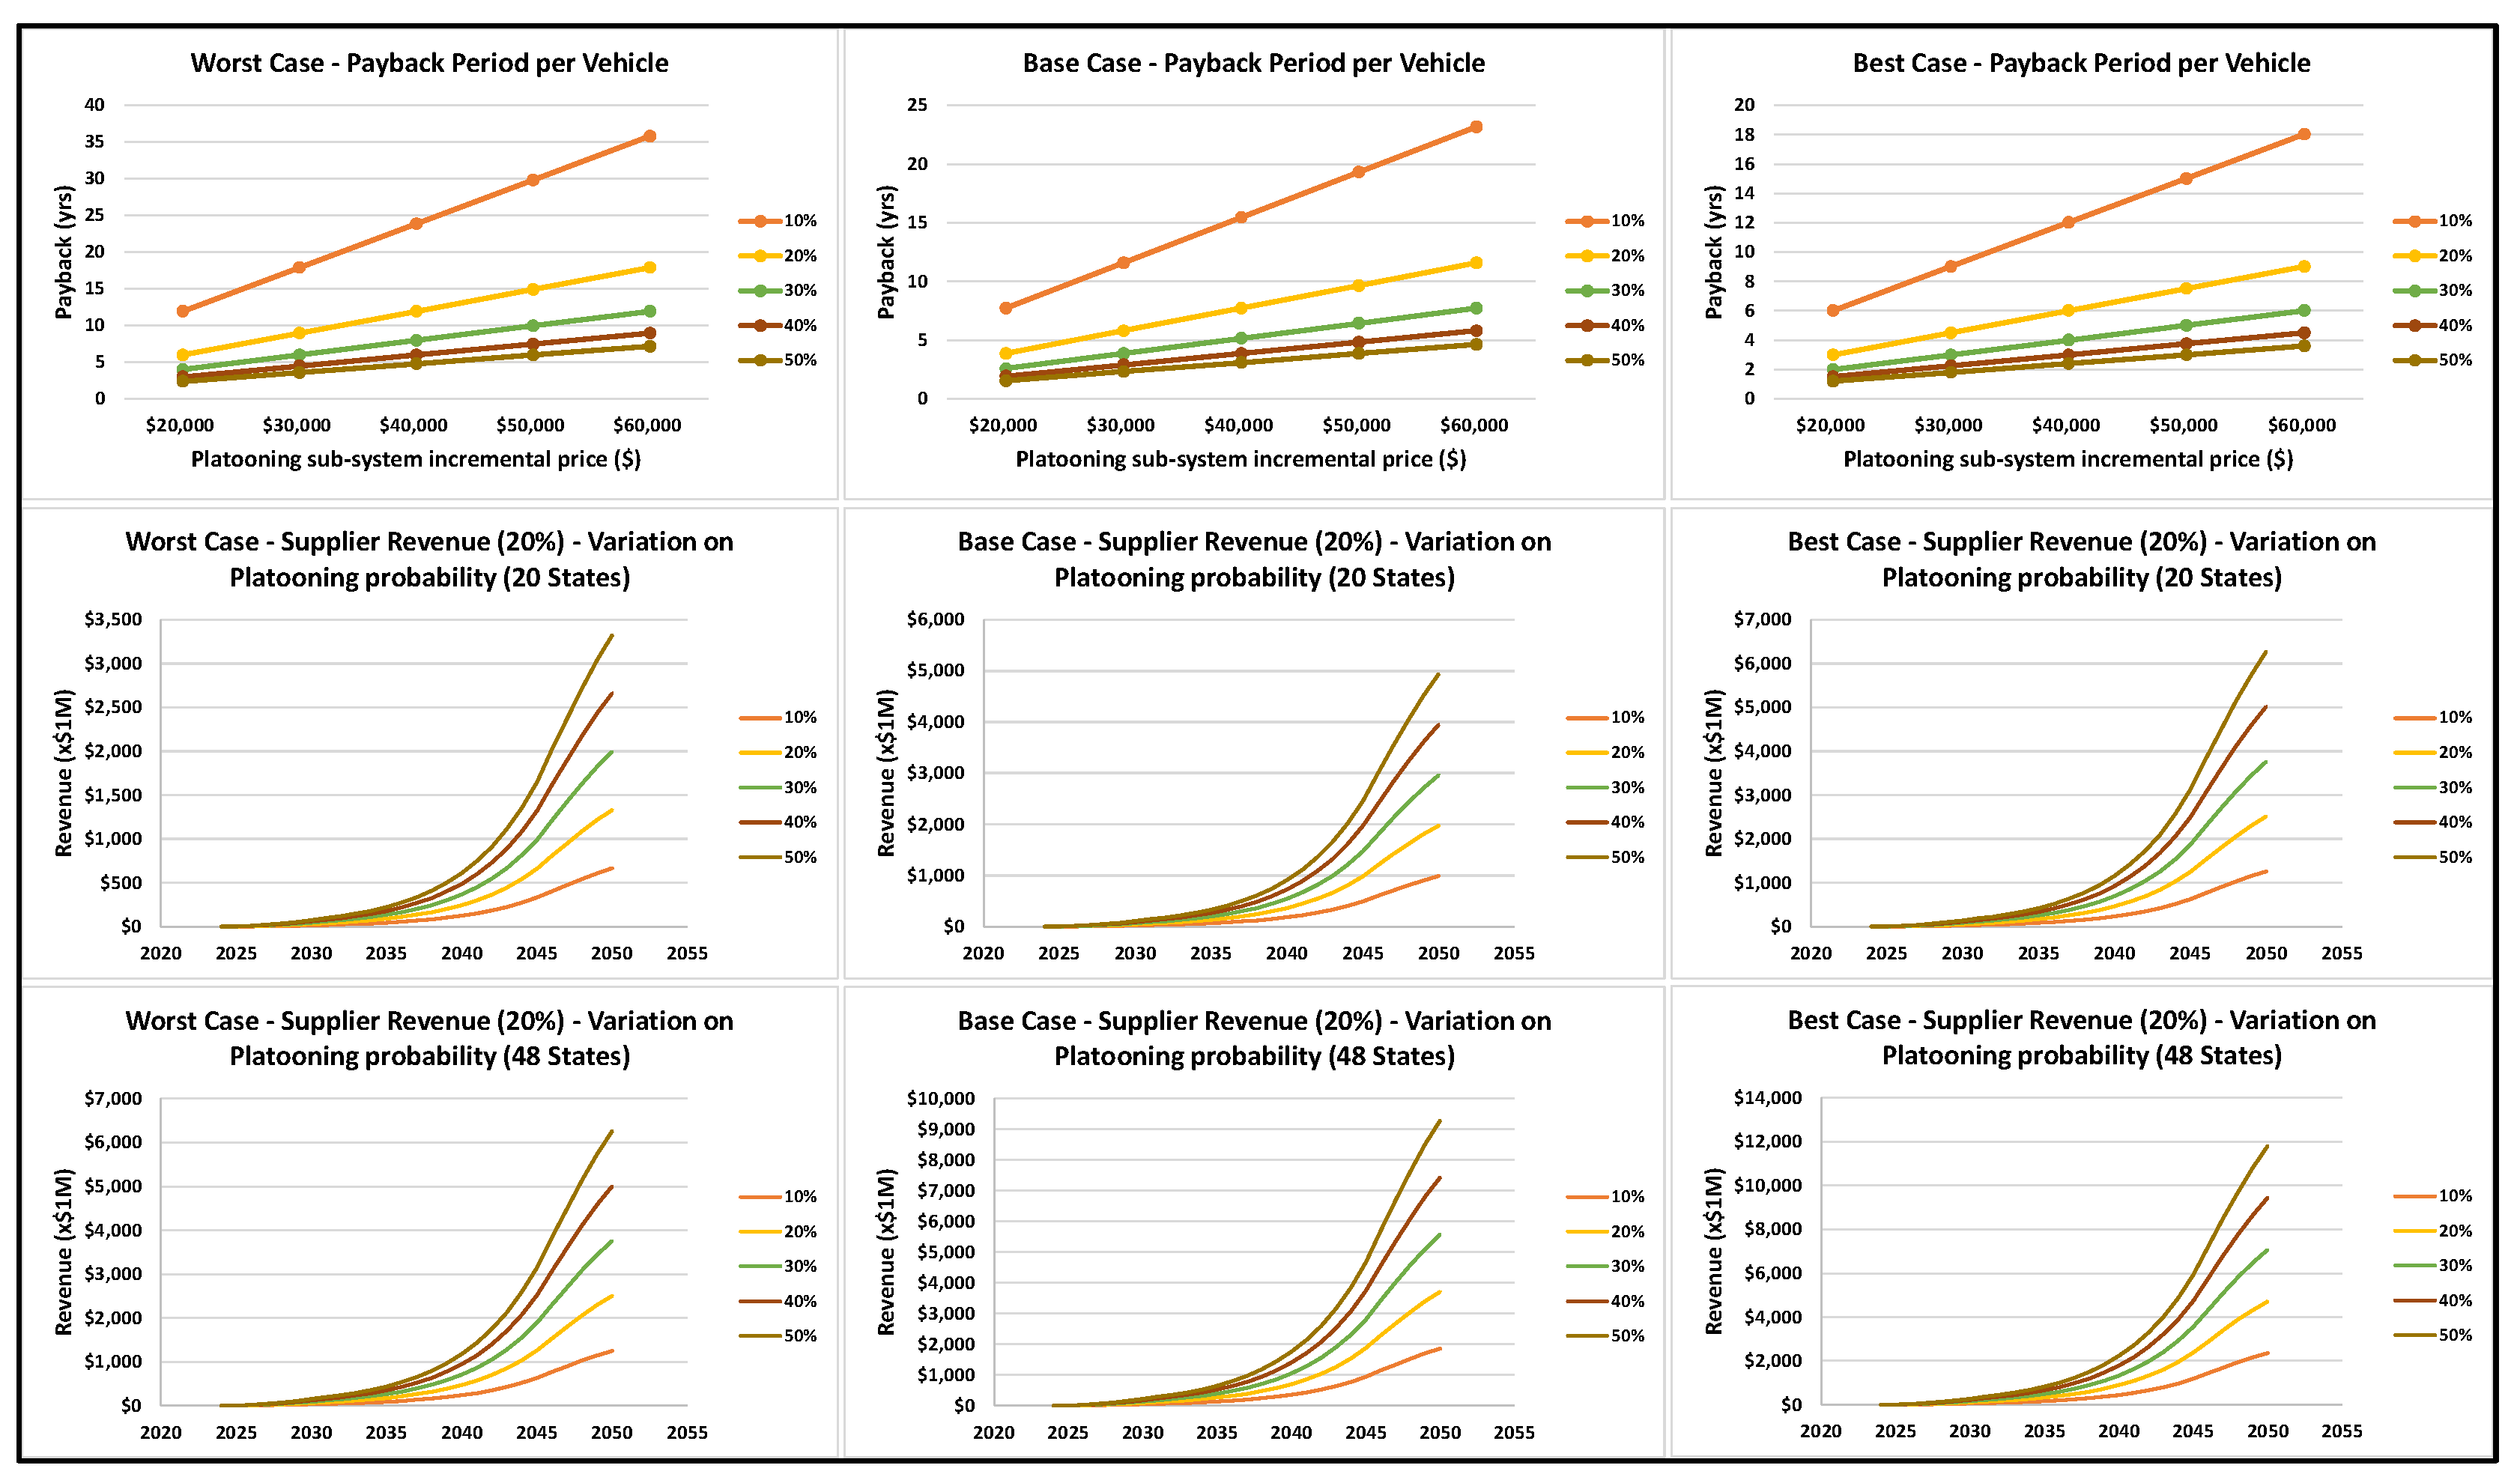
- Electric payback: In the worst-case scenario, payback of ≤1.5 years occurs if either
- ○
- Technology price is $20,000 and probability of finding a platooning partner >87.5%
- ○
- Technology price is $60,000 and probability of finding a platooning partner >92.5%;
- Electric payback: In the best-case scenario, payback of ≤ 1.5 years occurs if either
- ○
- Technology price is $20,000 and probability of finding a platooning partner > 75.1%
- ○
- Technology price is $60,000 and probability of finding a platooning partner > 88.4%;
- Electric revenue: In the worst-case scenario, limited by current regulations (20 states) the revenue potential at:
- ○
- 10 years of adoption will range from $4.8 M to $48.3 M
- ○
- 20 years of adoption will range from $36.2 M to $361.8 M;
- Electric revenue: In the best-case scenario unlimited by current regulations (48 states) the revenue potential at:
- ○
- 10 years of adoption will range from $23.9 M to $238.8 M
- ○
- 20 years of adoption will range from $172.9 M to $1728.6 M.
5.2. Scenario 2—Diesel v. BEV—Changed Adoption Model
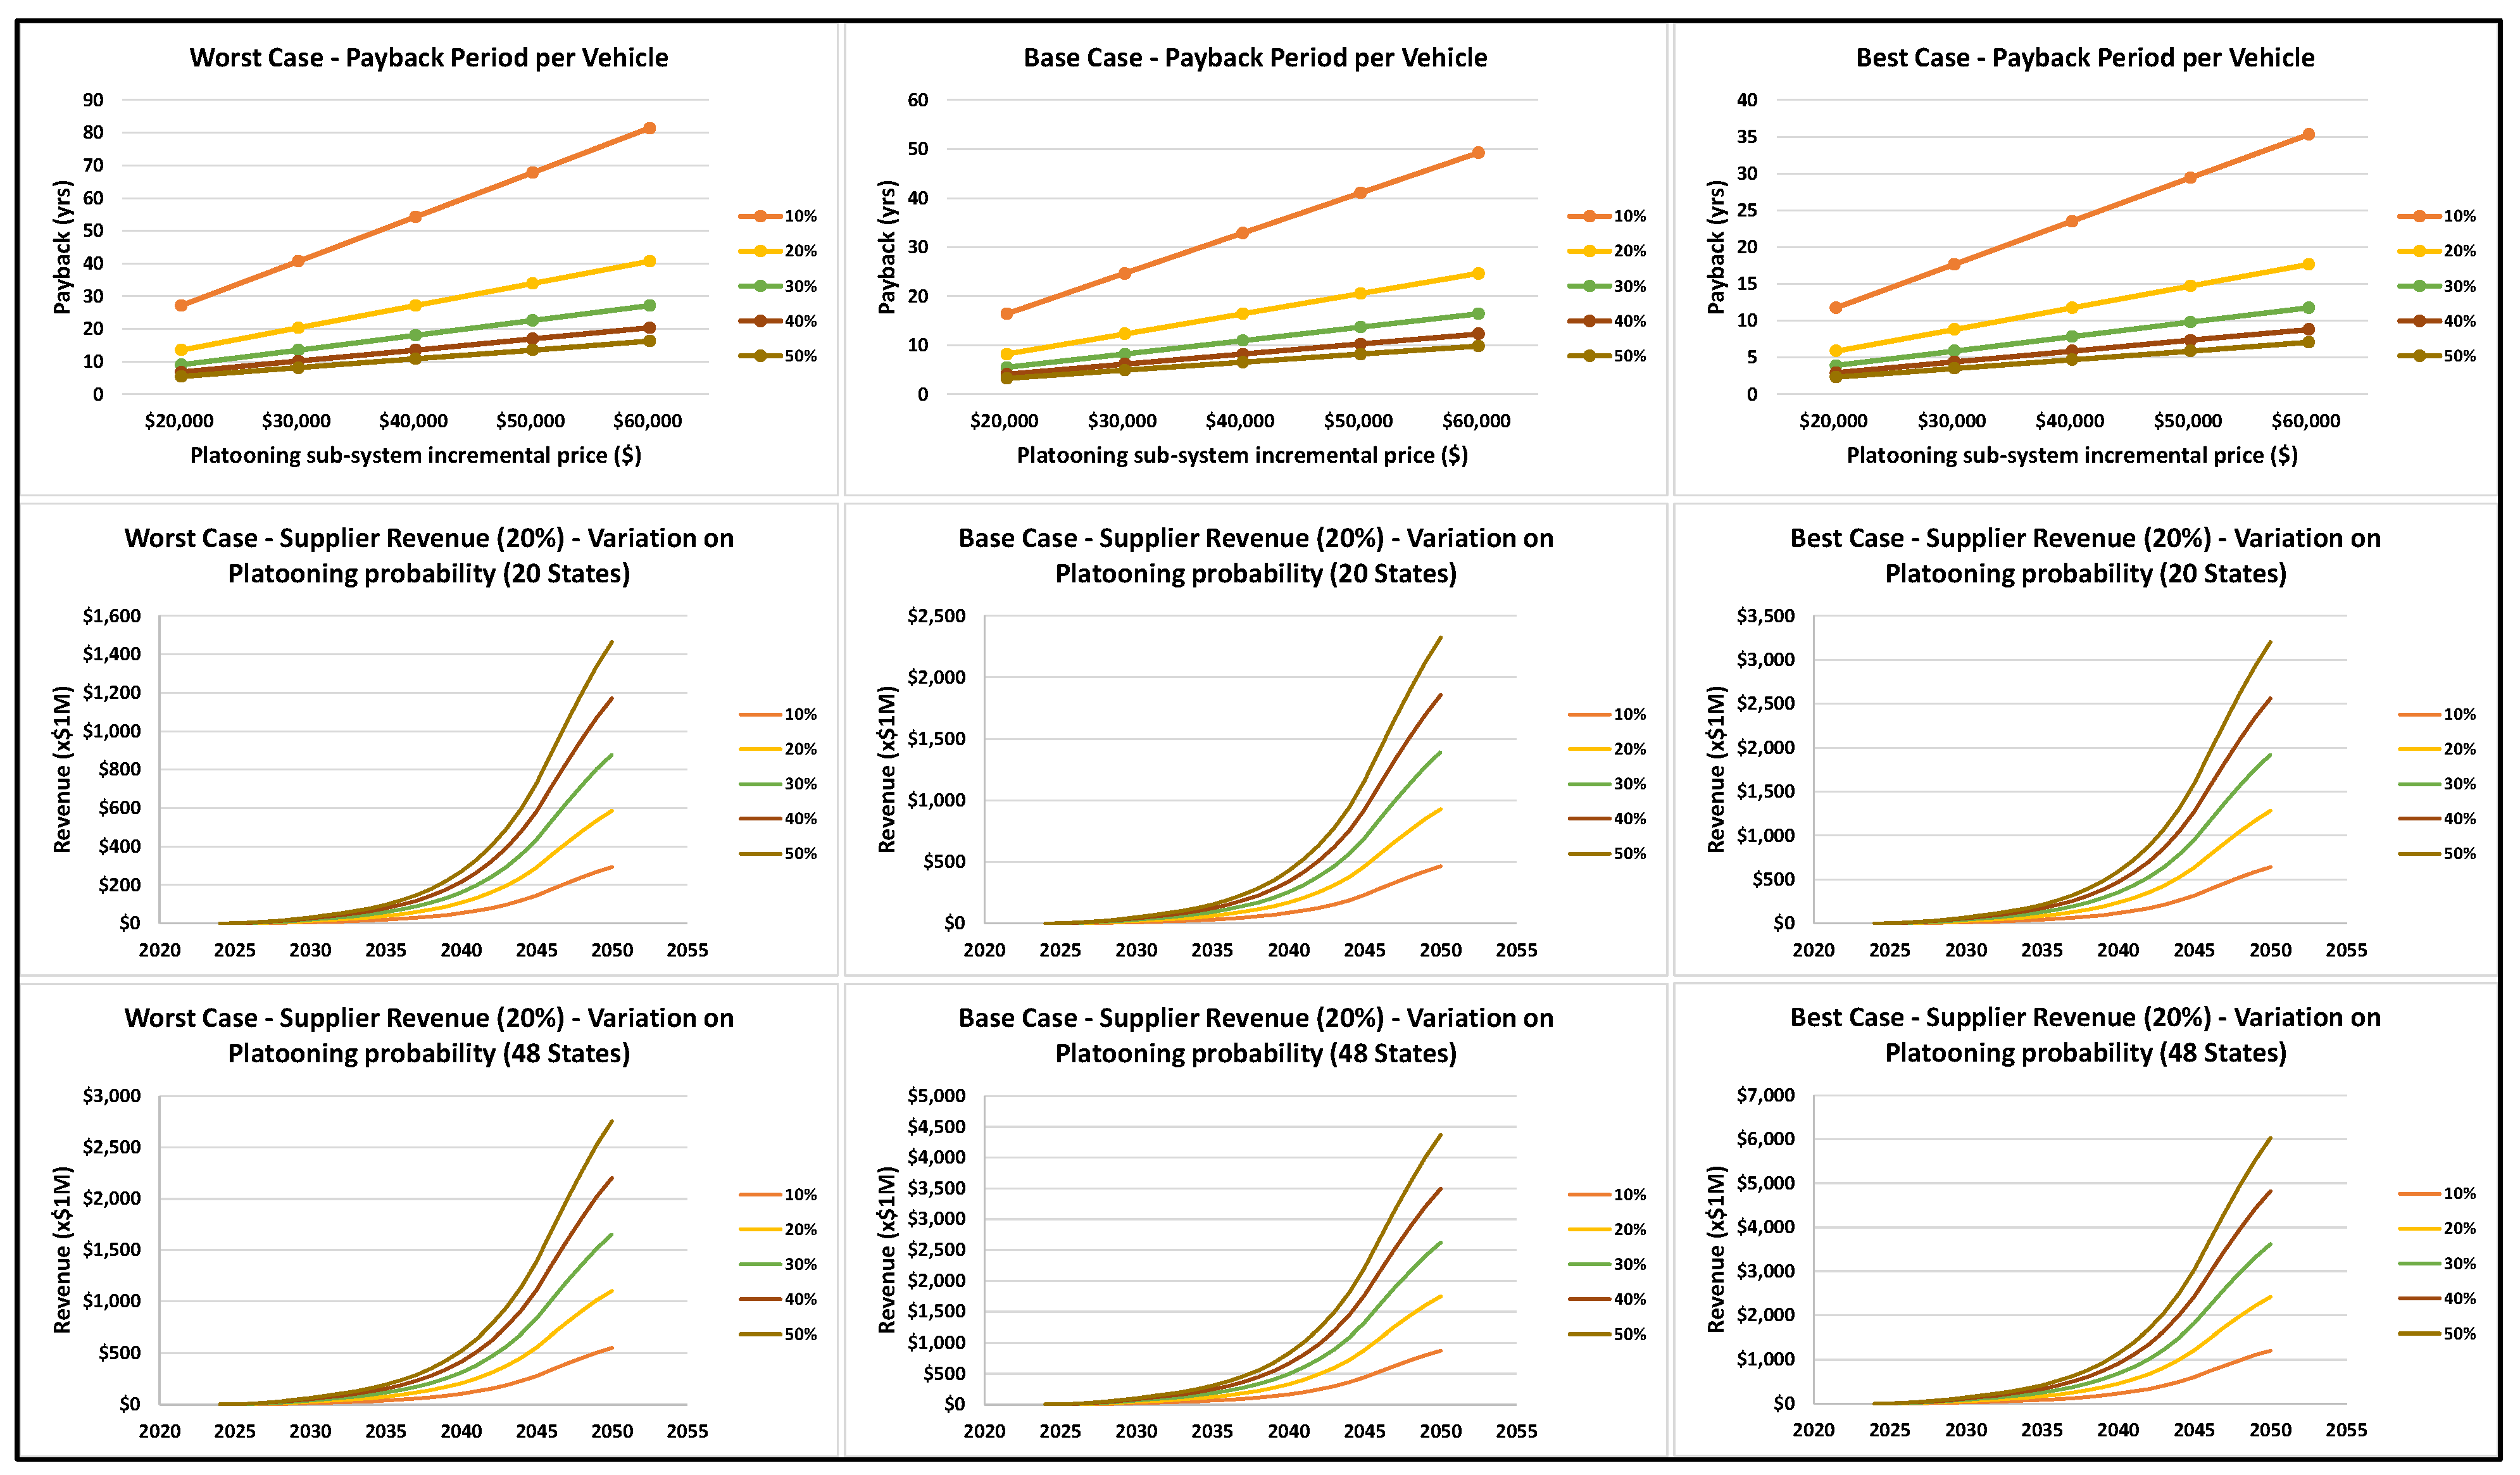
- Diesel payback: Adoption model change does not have any impact to the payback and these are as previously reported;
- Diesel revenue: In the worst-case scenario, limited by current regulations (20 states) the revenue potential at:
- ○
- 10 years of adoption will range from $30.7 M to $306.6 M
- ○
- 20 years of adoption will range from $67.9 M to $678.6 M;
- Diesel revenue: In the best-case scenario, unlimited by current regulations (48 states) the revenue potential at:
- ○
- 10 years of adoption will range from $152.2 M to $1521.9 M
- ○
- 20 years of adoption will range from $325.3 M to $3253.4 M;
- Electric payback: Adoption model change does not have any impact to the payback and these are as previously reported
- Electric revenue: In the worst-case scenario, limited by current regulations (20 states) the revenue potential at:
- ○
- 10 years of adoption will range from $29.9 M to $299.5 M
- ○
- 20 years of adoption will range from $66.3 M to $662.9 M;
- Electric revenue: In the best-case scenario, unlimited by current regulations (48 states) the revenue potential at:
- ○
- 10 years of adoption will range from $148.2 M to $1481.7 M
- ○
- 20 years of adoption will range from $316.7 M to $3167.5 M.
5.3. Scenario 3—Diesel v. BEV—Driver/Vehicle Hourly Value at Mean ($40.56/h)
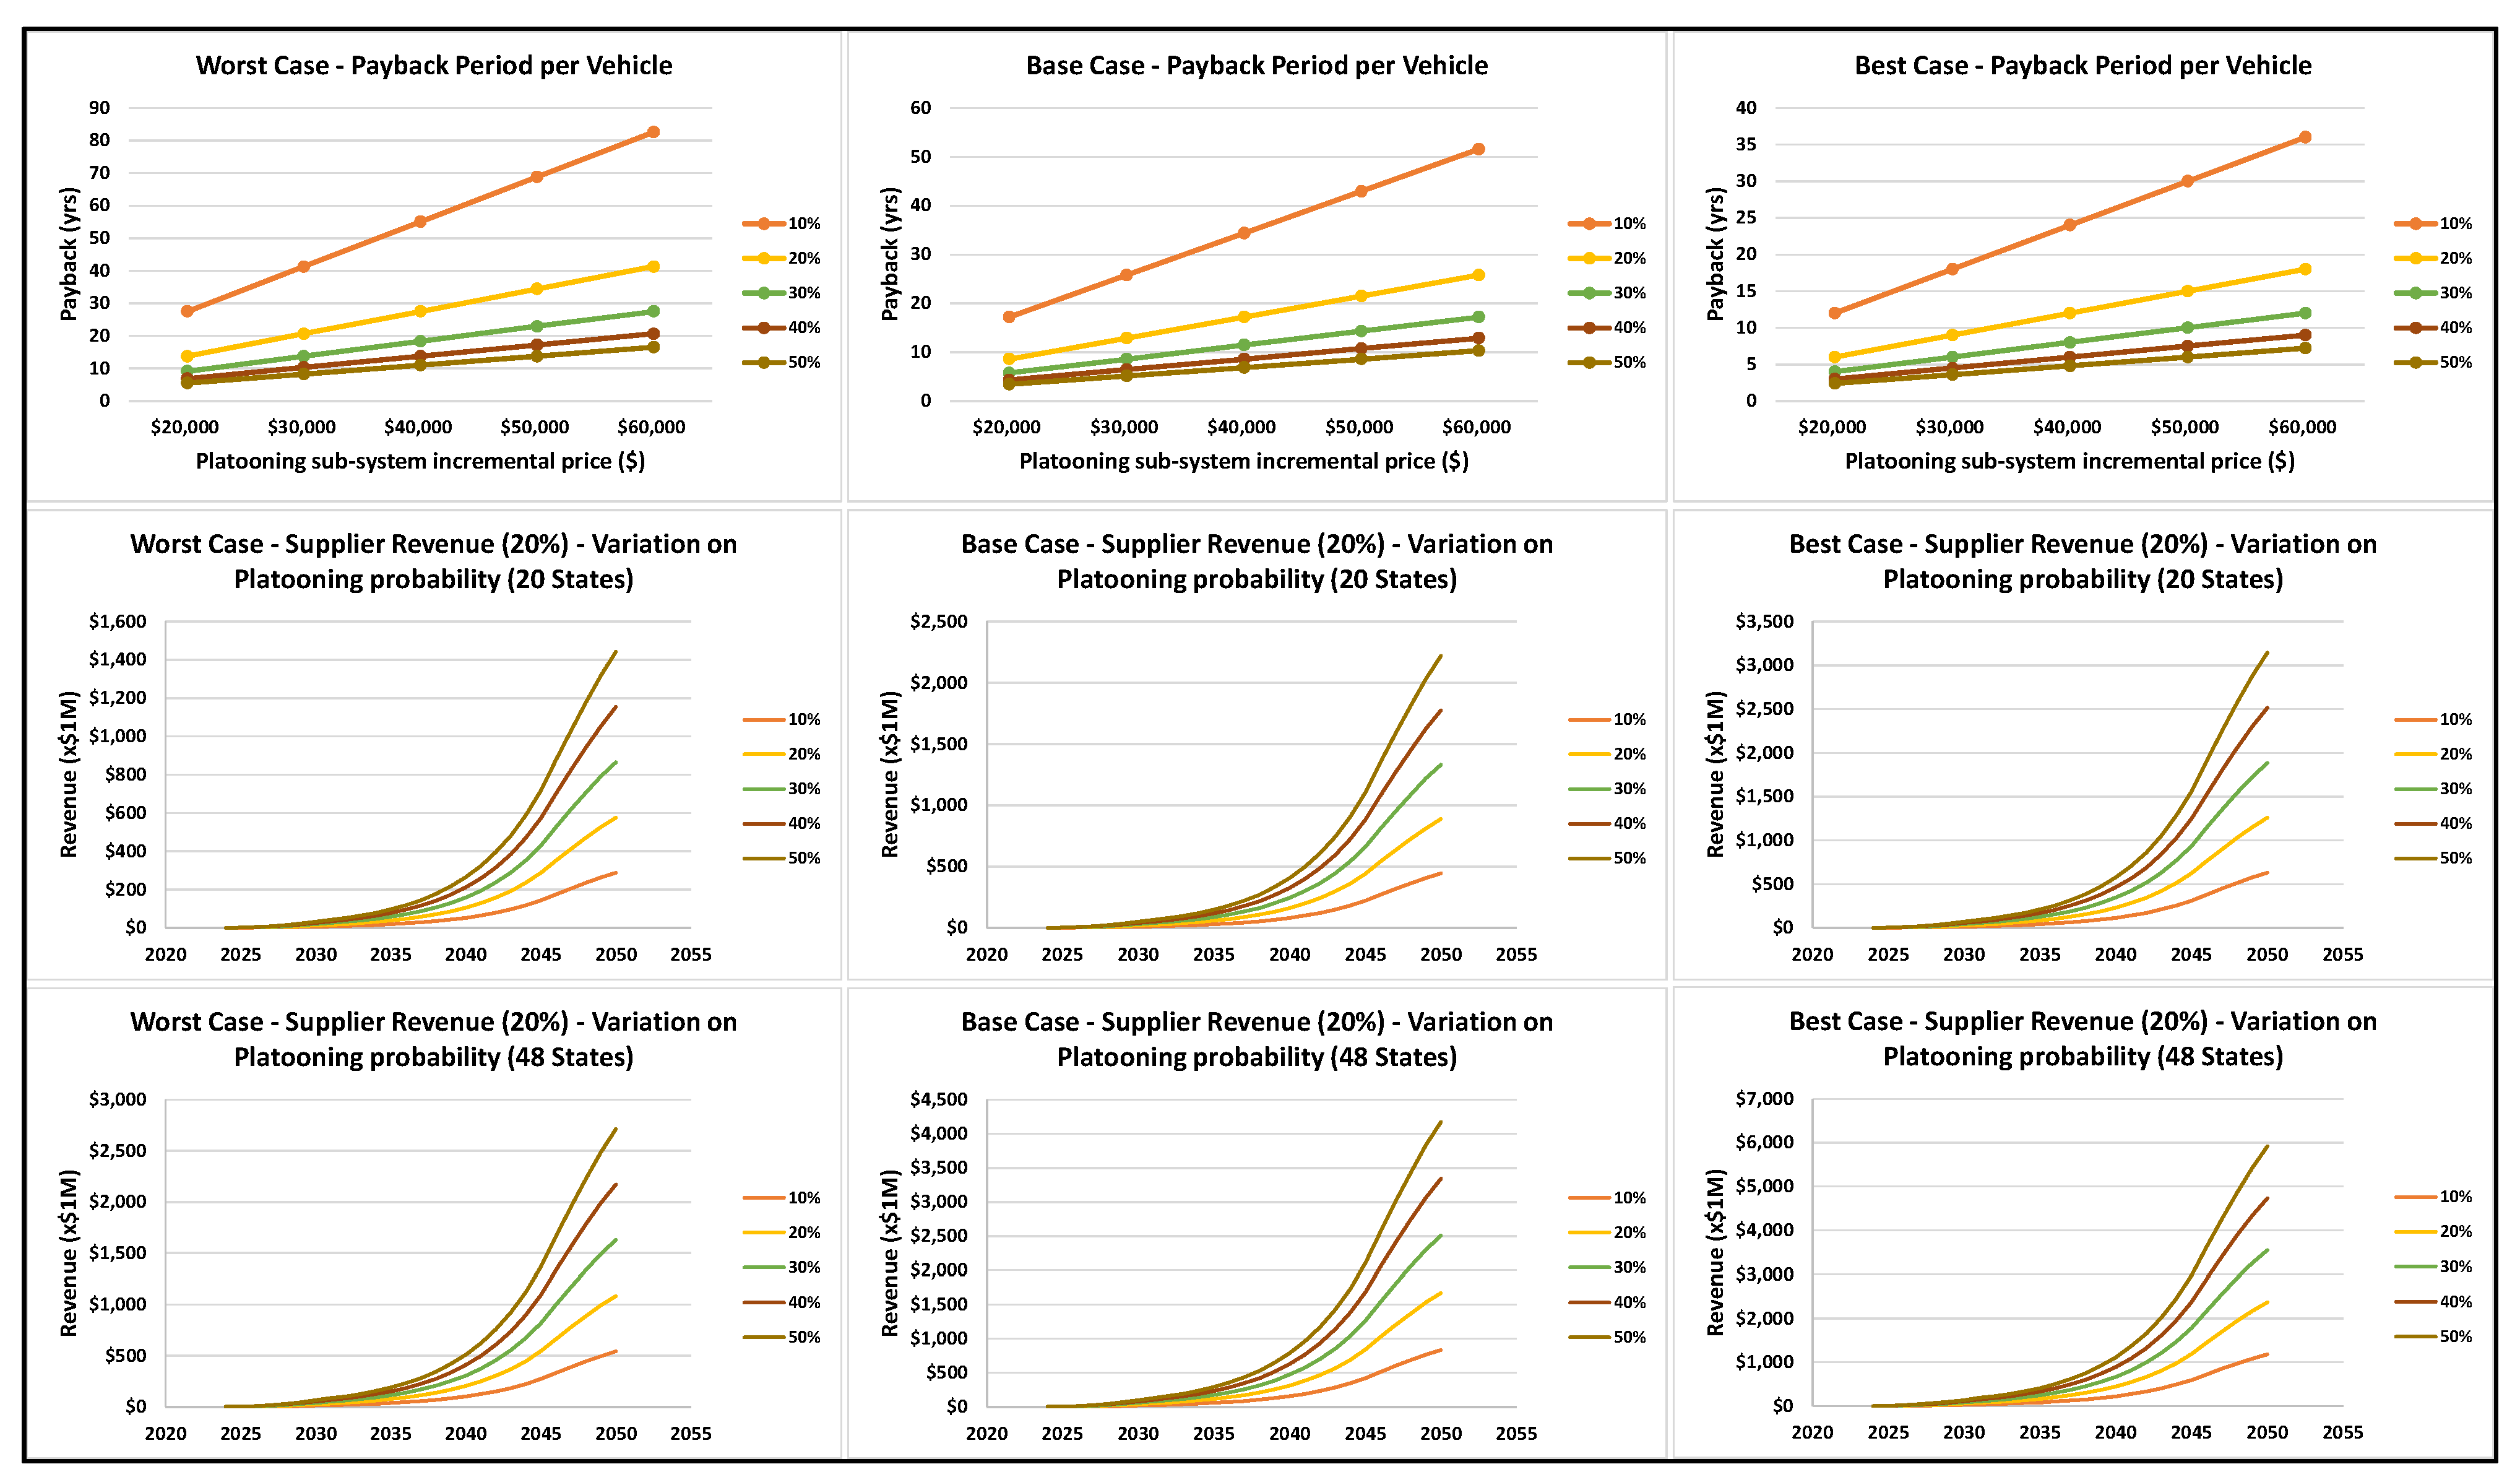
- Diesel payback: In the worst-case scenario, payback of ≤ 1.5 years occurs if either
- ○
- Technology price is $20,000 and probability of finding a platooning partner > 82.6%
- ○
- Technology price is $60,000 and probability of finding a platooning partner > 90.9%;
- Diesel payback: In the best-case scenario, payback of ≤ 1.5 years occurs if either
- ○
- Technology price is $20,000 and probability of finding a platooning partner > 66.3%
- ○
- Technology price is $60,000 and probability of finding a platooning partner > 85.4%;
- Diesel revenue: In the worst-case scenario, limited by current regulations (20 states) the revenue potential at:
- ○
- 10 years of adoption will range from $8.0 M to $79.7 M
- ○
- 20 years of adoption will range from $59.7 M to $597.3 M;
- Diesel revenue: In the best-case scenario, unlimited by current regulations (48 states) the revenue potential at:
- ○
- 10 years of adoption will range from $34.5 M to $344.8 M
- ○
- 20 years of adoption will range from $249.5 M to $2495.4 M;
- Electric payback: In the worst-case scenario, payback of ≤ 1.5 years occurs if either
- ○
- Technology price is $20,000 and probability of finding a platooning partner > 82.7%
- ○
- Technology price is $60,000 and probability of finding a platooning partner > 90.9%;
- Electric payback: In the best-case scenario, payback of ≤ 1.5 years occurs if either
- ○
- Technology price is $20,000 and probability of finding a platooning partner >66.9 %
- ○
- Technology price is $60,000 and probability of finding a platooning partner > 85.6%;
- Electric revenue: In the worst-case scenario, limited by current regulations (20 states) the revenue potential at:
- ○
- 10 years of adoption will range from $7.9 M to $78.5 M
- ○
- 20 years of adoption will range from $58.9 M to $588.7 M;
- Electric revenue: In the best-case scenario, unlimited by current regulations (48 states) the revenue potential at:
- ○
- 10 years of adoption will range from $33.8 M to $338.3 M
- ○
- 20 years of adoption will range from $244.9 M to $2448.5 M.
5.4. Scenario 4—Diesel v. BEV—High HoS Equivalency and Driver/Vehicle Hourly Value at Median ($24.09/h)
- Diesel payback: In the worst-case scenario, payback of ≤ 1.5 years occurs if either
- ○
- Technology price is $20,000 and probability of finding a platooning partner > 66.5%
- ○
- Technology price is $60,000 and probability of finding a platooning partner > 85.5%;
- Diesel payback: In the best-case scenario, payback of ≤ 1.5 years occurs if either
- ○
- Technology price is $20,000 and probability of finding a platooning partner > 39.7%
- ○
- Technology price is $60,000 and probability of finding a platooning partner > 76.1%;
- Diesel revenue: In the worst-case scenario, limited by current regulations (20 states) the revenue potential at:
- ○
- 10 years of adoption will range from $18.2 M to $182.3 M
- ○
- 20 years of adoption will range from $136.6 M to $1366.5 M;
- Diesel revenue: In the best-case scenario, unlimited by current regulations (48 states) the revenue potential at:
- ○
- 10 years of adoption will range from $68.2 M to $681.9 M
- ○
- 20 years of adoption will range from $493.6 M to $4935.7 M;
- Electric payback: In the worst-case scenario, payback of ≤ 1.5 years occurs if either
- ○
- Technology price is $20,000 and probability of finding a platooning partner > 66.7%
- ○
- Technology price is $60,000 and probability of finding a platooning partner > 85.6%;
- Electric payback: In the best-case scenario, payback of ≤ 1.5 years occurs if either
- ○
- Technology price is $20,000 and probability of finding a platooning partner > 40.1%
- ○
- Technology price is $60,000 and probability of finding a platooning partner > 76.3%;
- Electric revenue: In the worst-case scenario, limited by current regulations (20 states) the revenue potential at:
- ○
- 10 years of adoption will range from $18.1 M to $181.2 M
- ○
- 20 years of adoption will range from $135.8 M to $1357.9 M;
- Electric revenue: In the best-case scenario, unlimited by current regulations (48 states) the revenue potential at:
- ○
- 10 years of adoption will range from $67.5 M to $675.4 M
- ○
- 20 years of adoption will range from $488.9 M to $4888.8 M.
6. Summary Table of Key Results
7. Conclusions
Author Contributions
Funding
Institutional Review Board Statement
Informed Consent Statement
Data Availability Statement
Conflicts of Interest
References
- Chadha, P.; Sujan, V. Quantification of Platooning Fuel Economy Benefits across United States Interstates Using Closed-Loop Vehicle Model Simulation. SAE Tech. Pap. 2021. [Google Scholar] [CrossRef]
- Sujan, V.; Vajapeyazula, P.; Kothandaraman, G.; Liu, J.; Follen, K. Platoon System for Vehicles. U.S. Patent 10,943,490, 9 March 2021. [Google Scholar]
- McAuliffe, B.; Lammert, M.; Lu, X.; Shladover, S. Influences on Energy Savings of Heavy Trucks Using Cooperative Adaptive Cruise Control. SAE Tech. Pap. 2018, 1, 1181. [Google Scholar] [CrossRef] [Green Version]
- Lammert, M.; Duran, A.; Diez, J.; Burton, K.; Nicholoson, A. Effect of Platooning on Fuel Consumption of Class 8 Vehicles Over a Range of Speeds, Following Distances, and Mass. SAE Int. J. Commer. Veh. 2014, 7, 626–639. [Google Scholar] [CrossRef] [Green Version]
- Eckerle, W.; Sujan, V.; Salemme, G. Future Challenges for Engine Manufacturers in View of Future Emissions Legislation. SAE Tech. Pap. 2017, 1, 1923. [Google Scholar] [CrossRef]
- Guerrero, A.; Davendralingam, N.; Raz, A.; DeLaurentis, D.; Shaver, G.; Sujan, V.; Jain, N. Projecting adoption of truck powertrain technologies and CO2 emissions in line-haul networks. Transp. Res. Part D Transp. Environ. 2020, 84, 102354. [Google Scholar] [CrossRef]
- Smith, J.; Mihelic, R.; Gifford, B.; Ellis, M. Aerodynamic Impact of Tractor-Trailer in Drafting Configuration. SAE Int. J. Commer. Veh. 2014, 7, 619–625. [Google Scholar] [CrossRef]
- USDOT, Federal Highway Administration. Exploratory Advanced Research (EAR) Program Fact Sheet: Expanding the Freight Capacity of America’s Highways; Report No. FHWA-HRT-17-045. USDOT; Federal Highway Administration: Washington, DC, USA, 2017. [Google Scholar]
- Sujan, V.; Jones, P.T.; Siekmann, A. Heavy Duty Commercial Vehicles Platooning Benefits for Conventional and Electrified Powertrains. In Proceedings of the IEEE International Conference on Connected Vehicles and Expo ICCVE, Lakeland, FL, USA, 7–9 March 2022. [Google Scholar]
- Sujan, V.; Jones, P.T.; Siekmann, A. Characterizing Minimum Admissible Separation Distances in Heavy Duty Vehicle Platoons. In Proceedings of the IEEE International Conference on Connected Vehicles and Expo ICCVE, Lakeland, FL, USA, 7–9 March 2022. [Google Scholar]
- Vahidi, A.; Sciarretta, A. Energy saving potentials of connected and automated vehicles. Transp. Res. C Emerg. Technol. 2018, 95, 822–843. [Google Scholar] [CrossRef]
- Mihelic, R. Fuel and Freight Efficiency–Past, Present and Future Perspectives. SAE Int. J. Commer. Veh. 2016, 9, 120–216. [Google Scholar] [CrossRef]
- Hussein, A.; Rakha, H. Vehicle Platooning Impact on Drag Coefficients and Energy/Fuel Saving Implications. Engineering, Computer Science, Environmental Science. arXiv 2020, arXiv:2001.00560. [Google Scholar]
- Salari, K.; Ortega, J. Experimental Investigation of the Aerodynamic Benefits of Truck Platooning. SAE Pap. 2018, 1, 0732. [Google Scholar] [CrossRef]
- McAuliffe, B.; Smith, P.; Raeesi, A.; Hoffman, M.; Bevly, D. Track-Based Aerodynamic Testing of a Two-Truck Platoon. SAE Int. J. Adv. Curr. Prac. Mobil. 2021, 3, 1450–1472. [Google Scholar]
- Ard, T.; Ashtiani, F.; Vahidi, A.; Borhan, H. Optimizing Gap Tracking Subject to Dynamic Losses via Connected and Anticipative MPC in Truck Platooning. In Proceedings of the 2020 American Control Conference (ACC), Denver, CO, USA, 1–3 July 2020; pp. 2300–2305. [Google Scholar]
- Shladover, S.E.; Nowakowski, C.; Lu, X.-Y. Using Cooperative Adaptive Cruise Control (CACC) to Form High-Performance Vehicle Streams. Definitions Literature Review and Operational Concept Alternatives; UC Berkeley: Berkeley, CA, USA, 2018. [Google Scholar]
- Devika, K.B.; Rohith, G.; Yellapantula, V.R.S.; Subramanian, S.C. A dynamics-based adaptive string stable controller for connected heavy road vehicle platoon safety. IEEE Access 2020, 8, 209. [Google Scholar] [CrossRef]
- Zhai, C.; Chen, X.; Yan, C.; Liu, Y.; Li, H. Ecological cooperative adaptive cruise control for a heterogeneous platoon of heavy-duty vehicles with time delays. IEEE Access 2020, 8, 146208–146219. [Google Scholar] [CrossRef]
- Guo, L.; Gao, B.; Gao, Y.; Chen, H. Optimal Energy Management for HEVs in Eco-Driving Applications Using Bi-Level MPC. IEEE Trans. Intell. Transp. Syst. 2017, 18, 2153–2162. [Google Scholar] [CrossRef]
- Yuniar, D.; Djakfar, L.; Wicaksono, A.; Efendi, A. Truck Driver Behavior and Travel Time Effectiveness Using Smart GPS. Civ. Eng. J. 2020, 6, 724–732. [Google Scholar] [CrossRef]
- Kapeller, H.; Dvorak, D.; Šimić, D. Improvement and Investigation of the Requirements for Electric Vehicles by the use of HVAC Modeling. HighTech Innov. J. 2021, 2, 67–76. [Google Scholar] [CrossRef]
- SAE International. J3016. Surface Vehicle Recommended Practice; SAE International: Warrendale, PA, USA, 1998. [Google Scholar]
- Marinik, A.; Bishop, R.; Fitchett, V.; Morgan, J.; Trimble, T.; Blanco, M. Human Factors Evaluation of Level 2 and Level 3 Automated Driving Concepts: Concepts of Operation; Report No. DOT HS 812 044; National Highway Traffic Safety Administration: Washington, DC, USA, 2015. [Google Scholar]
- U.S. Department of Transportation. Automated Vehicles: Truck Platooning ITS Benefits, Costs, and Lessons Learned: 2018 Update Report; Intelligent Transportation Systems Joint Program Office Report; U.S. Department of Transportation: Washington, DC, USA, 2018. [Google Scholar]
- Arkansas Trucking Association. ATRI Releases Results on Truck Platooning Study; Arkansas Trucking Association: Little Rock, AR, USA, 2015. [Google Scholar]
- U.S. Department of Transportation Federal Highway Administration. FHWA Research and Technology Evaluation: Truck Platooning, Final Report June 2021; Publication No. FHWA-HRT-20-071; U.S. Department of Transportation Federal Highway Administration: Washington, DC, USA, 2021. [Google Scholar]
- Vieth, K. Class 8 Review & Forecast. In Proceedings of the ACT Research Outlook Seminar 65, online, 24–26 August 2021. [Google Scholar]
- U.S. Department of Transportation Federal Highway Administration. FAF4 Network Database and Flow Assignment: 2012 and 2045. Available online: https://ops.fhwa.dot.gov/freight/freight_analysis/faf/faf4/netwkdbflow/index.htm (accessed on 10 October 2021).
- U.S. Department of Transportation—Federal Highway Administration. Available online: https://hepgis.fhwa.dot.gov/fhwagis/ (accessed on 6 January 2022).
- Law, S. Is Autonomous Truck Platooning Legal in Your State? Available online: https://simonlawpc.com/trucking-accident/autonomous-truck-platooning-legal-in-your-state/ (accessed on 31 October 2021).
- U.S. Department of Transportation Federal Highway Administration. Major Freight Corridors Map. Available online: https://ops.fhwa.dot.gov/freight/freight_analysis/nat_freight_stats/tonhwyrrww2012.htm (accessed on 6 January 2022).
- Here. Available online: https://www.here.com/ (accessed on 12 September 2021).
- Car and Driver. Drag Queens: Aerodynamics Compared. Available online: https://www.caranddriver.com/features/a15108689/drag-queens-aerodynamics-compared-comparison-test/ (accessed on 15 September 2021).
- Section 2–Aerodynamics. Available online: http://www.partnumber.com/ev/handbook/aerodynamics.html (accessed on 15 September 2021).
- Bishop, J. Table 2. Available online: https://www.researchgate.net/figure/Coefficient-of-drag-frontal-area-and-effective-drag-for-both-best-selling-and_tbl2_260994029 (accessed on 15 September 2021).
- Rogers, E.M. Diffusion of Innovations, 5th ed.; Free Press: New York, NY, USA, 2003; ISBN 0743222091. OCLC 782119567. [Google Scholar]
- PRNewswire. Truck Platooning Market Growth Opportunities 2016 to 2030 Autonomous Trucking Technologies to Launch Massive Productivity, Safety, and Efficiency Gains in Freight Mobility; Frost & Sullivan: San Antonio, TX, USA, 2016. [Google Scholar]
- Jacobs, J. What Does Disruptive Growth Look Like? Available online: https://www.globalxetfs.com/what-does-disruptive-growth-look-like/ (accessed on 2 November 2021).
- McGrath, R.G. The Pace of Technology Adoption is Speeding Up. Available online: https://hbr.org/2013/11/the-pace-of-technology-adoption-is-speeding-up/ (accessed on 2 November 2021).
- Fleet DNA Project Data. National Renewable Energy Laboratory. Available online: https://www.nrel.gov/fleetdna (accessed on 10 September 2021).
- TIGER/Line® Shapefiles. Available online: https://www.census.gov/cgi-bin/geo/shapefiles (accessed on 30 June 2021).
- Williams, N.; Murray, D. An Analysis of the Operational Costs of Trucking: 2020 Update; American Transportation Research Institute: Arlington, VA, USA, 2020. [Google Scholar]
- U.S. Energy Information Administration (EIA). Available online: https://www.eia.gov/ (accessed on 1 October 2021).
- Mericli, C. Development and Approach in Highly Automated Vehicles: Challenges and Opportunities—Technology Developer Perspective. In Proceedings of the Total Vehicle and Integration Committee, SAE Commercial Vehicles Engineering Congress (COMVEC), Chicago, IL, USA, 14 September 2021. [Google Scholar]
- Bruzelius, N. The Value of Travel Time; Croom Helm: London, UK, 1979. [Google Scholar]
- Haning, C.R.; McFarland, W.F. Value of Time Saved to Commercial Motor Vehicles Through Use of Improved Highways. A Report to the Bureau of Public Roads; Texas Transportation Institute: College Station, TX, USA, 1963. [Google Scholar]
- Adkins, W.G.; Ward, A.; McFarland, W.F. Value of Time Savings of Commercial Vehicles; HRB: Washington, DC, USA, 1967. [Google Scholar]
- Waters, W.G.; Wong, C.; Megale, K. The Value of Commercial Vehicle Time Savings for the Evaluation of Highway Investments: A Resource Saving Approach. J. Transp. Res. Forum 1995, 35, 97–113. [Google Scholar]
- Kawamura, K. Perceived Value of Time for Truck Operators. Transp. Res. Rec. J. Transp. Res. Board 2000, 1725, 31–36. [Google Scholar] [CrossRef]
- Smalkoski, B.; Levinson, D. Value of Time for Commercial Vehicle Operators. J. Transp. Res. Forum 2005, 44, 89–102. [Google Scholar] [CrossRef]
- Inflation Calculator. Available online: https://www.in2013dollars.com/us/inflation/ (accessed on 21 October 2021).
- Litman, T. Autonomous Vehicle Implementation Predictions Implications for Transport Planning. 2021. Available online: https://www.vtpi.org/avip.pdf (accessed on 6 January 2022).








| Worst Case | Base Case | Best Case | |||
|---|---|---|---|---|---|
| Platooning days per year | 286 | 286 | 286 | ||
| Minimum daily miles to platoon (mi/day) | 300 | 300 | 300 | ||
| Full fleet replacement cycle (yrs) | 6 | 6 | 6 | ||
| Avg baseline FE (mpg or mi/kWh) | 9.00 | 7.75 | 6.50 | ||
| Fuel cost ($/gal or $/kWh) | 2.5 | 3.5 | 5 | ||
| Leading truck FE incr (%) | 4.0% | 6.5% | 9.0% | ||
| Trailing truck FE incr (%) | 4.0% | 6.5% | 9.0% | ||
| Fraction of Platoon-able miles (%) | Miles/day | 300 | 30% | 50% | 60% |
| 350 | 35% | 55% | 65% | ||
| 400 | 40% | 60% | 70% | ||
| 450 | 45% | 65% | 75% | ||
| 500 | 50% | 70% | 80% | ||
| Worst Case | Base Case | Best Case | |||
|---|---|---|---|---|---|
| Platooning days per year | 286 | 286 | 286 | ||
| Minimum daily miles to platoon (mi/day) | 300 | 300 | 300 | ||
| Full fleet replacement cycle (yrs) | 6 | 6 | 6 | ||
| Avg baseline FE (mpg or mi/kWh) | 0.44 | 0.38 | 0.32 | ||
| Fuel cost ($/gal or $/kWh) | 0.07 | 0.1 | 0.2 | ||
| Leading truck FE incr (%) | 5.5% | 8.0% | 10.5% | ||
| Trailing truck FE incr (%) | 5.5% | 8.0% | 10.5% | ||
| Fraction of Platoon-able miles (%) | Miles/day | 300 | 30% | 50% | 60% |
| 350 | 35% | 55% | 65% | ||
| 400 | 40% | 60% | 70% | ||
| 450 | 45% | 65% | 75% | ||
| 500 | 50% | 70% | 80% | ||
| Payback Target: 1.5 yrs | |||||||||||||
|---|---|---|---|---|---|---|---|---|---|---|---|---|---|
| Scenario | Required Probability of Finding a Platooning Partner | ||||||||||||
| Lead Vehicle | Following Vehicle | Hourly Value ($/hr) | L4 Operator Resting Equivalency Factor | Adoption Model | Powertrain | Tech Price (LOW) | Worst Case | Base Case | Best Case | Tech Price (HIGH) | Worst Case | Base Case | Best Case |
| L1 | L1 | Diesel | $500 | 63.1% | 18.5% | 7.6% | $2500 | 88.6% | 70.3% | 34.0% | |||
| Electric | $500 | 70.2% | 25.9% | 8.1% | $2500 | 90.0% | 77.5% | 36.4% | |||||
| L1 | L4 | $24.09 | 0.25 | Diesel | $20,000 | 87.3% | 81.5% | 74.6% | $60,000 | 92.4% | 90.5% | 88.2% | |
| Electric | $20,000 | 87.5% | 90.8% | 75.1% | $60,000 | 92.5% | 90.8% | 88.4% | |||||
| $40.56 | Diesel | $20,000 | 82.6% | 74.5% | 66.3% | $60,000 | 90.9% | 88.2% | 85.4% | ||||
| Electric | $20,000 | 82.7% | 88.5% | 66.9% | $60,000 | 90.9% | 88.5% | 85.6% | |||||
| $24.09 | 1.00 | Diesel | $20,000 | 66.5% | 50.4% | 39.7% | $60,000 | 85.5% | 80.1% | 76.1% | |||
| Electric | $20,000 | 66.7% | 80.4% | 40.1% | $60,000 | 85.6% | 80.4% | 76.3% | |||||
| $40.56 | Diesel | $20,000 | 47.6% | 31.0% | 25.1% | $60,000 | 79.2% | 70.7% | 65.1% | ||||
| Electric | $20,000 | 47.8% | 71.0% | 25.3% | $60,000 | 79.3% | 71.0% | 65.3% | |||||
| $96.02 | Diesel | $20,000 | 20.3% | 13.8% | 11.6% | $60,000 | 58.0% | 40.1% | 33.7% | ||||
| Electric | $20,000 | 20.4% | 40.3% | 11.6% | $60,000 | 58.0% | 40.3% | 33.8% | |||||
| Scenario | State Legislations Permit: 20 States | State Legislations Permit: 48 States | ||||||||||||||||
|---|---|---|---|---|---|---|---|---|---|---|---|---|---|---|---|---|---|---|
| Lead Vehicle | Following Vehicle | Hourly Value ($/hr) | L4 Operator Resting Equivalency Factor | Adoption Model | Powertrain | Platooning Probability | Worst Case | Base Case | Best Case | Worst Case | Base Case | Best Case | Worst Case | Base Case | Best Case | Worst Case | Base Case | Best Case |
| % | Revenue Potential @ 10 yrs (x$1,000,000) | Revenue Potential @ 20 yrs (x$1,000,000) | Revenue Potential @ 10 yrs (x$1,000,000) | Revenue Potential @ 20 yrs (x$1,000,000) | ||||||||||||||
| L1 | L1 | F&S | Diesel | 5% | $0.51 | $1.90 | $5.05 | $3.83 | $14.23 | $37.82 | $1.01 | $3.75 | $9.98 | $7.31 | $27.18 | $72.21 | ||
| 50% | $5.11 | $18.99 | $50.46 | $38.28 | $142.34 | $378.19 | $10.10 | $37.55 | $99.76 | $73.10 | $271.76 | $722.07 | ||||||
| Electric | 5% | $0.40 | $1.34 | $4.72 | $2.97 | $10.07 | $35.36 | $0.78 | $2.66 | $9.33 | $5.67 | $19.22 | $67.52 | |||||
| 50% | $3.97 | $13.43 | $47.18 | $29.72 | $100.66 | $353.63 | $7.84 | $26.55 | $93.28 | $56.74 | $192.19 | $675.17 | ||||||
| Rogers | Diesel | 5% | $3.17 | $11.78 | $31.31 | $7.02 | $26.08 | $69.30 | $6.27 | $23.30 | $61.90 | $13.39 | $49.80 | $132.31 | ||||
| 50% | $31.69 | $117.83 | $313.07 | $70.15 | $260.83 | $693.01 | $62.66 | $232.96 | $618.96 | $133.94 | $497.98 | $1323.13 | ||||||
| Electric | 5% | $2.46 | $8.33 | $29.27 | $5.45 | $18.45 | $64.80 | $4.86 | $16.48 | $57.88 | $10.40 | $35.22 | $123.72 | |||||
| 50% | $24.60 | $83.33 | $292.73 | $54.46 | $184.46 | $648.00 | $48.64 | $164.75 | $578.76 | $103.98 | $352.18 | $1237.19 | ||||||
| L1 | L4 | $24.09 | 0.25 | F&S | Diesel | 5% | $4.94 | $8.28 | $12.41 | $37.03 | $62.08 | $92.99 | $9.77 | $16.38 | $24.53 | $70.70 | $118.53 | $177.55 |
| 50% | $49.41 | $82.83 | $124.07 | $370.33 | $620.84 | $929.93 | $97.69 | $163.77 | $245.30 | $707.05 | $1185.35 | $1775.47 | ||||||
| Electric | 5% | $4.83 | $7.73 | $12.08 | $36.18 | $57.92 | $90.54 | $9.54 | $15.28 | $23.88 | $69.07 | $110.58 | $172.86 | |||||
| 50% | $48.27 | $77.27 | $120.79 | $361.76 | $579.17 | $905.37 | $95.43 | $152.77 | $238.82 | $690.70 | $1105.78 | $1728.57 | ||||||
| Rogers | Diesel | 5% | $30.66 | $51.39 | $76.98 | $67.86 | $113.76 | $170.40 | $60.61 | $101.61 | $152.19 | $129.56 | $217.21 | $325.34 | ||||
| 50% | $306.56 | $513.93 | $769.79 | $678.59 | $1137.65 | $1704.02 | $606.08 | $1016.09 | $1521.94 | $1295.61 | $2172.06 | $3253.41 | ||||||
| Electric | 5% | $29.95 | $47.94 | $74.95 | $66.29 | $106.13 | $165.90 | $59.21 | $94.79 | $148.17 | $126.56 | $202.63 | $316.75 | |||||
| 50% | $299.47 | $479.44 | $749.46 | $662.90 | $1061.28 | $1659.01 | $592.07 | $947.88 | $1481.74 | $1265.65 | $2026.26 | $3167.47 | ||||||
| $40.56 | F&S | Diesel | 5% | $7.97 | $12.65 | $17.44 | $59.73 | $94.79 | $130.70 | $15.75 | $25.00 | $34.48 | $114.03 | $180.97 | $249.54 | |||
| 50% | $79.69 | $126.47 | $174.38 | $597.26 | $947.88 | $1307.02 | $157.55 | $250.03 | $344.77 | $1140.33 | $1809.74 | $2495.42 | ||||||
| Electric | 5% | $7.85 | $12.09 | $17.11 | $58.87 | $90.62 | $128.25 | $15.53 | $23.90 | $33.83 | $112.40 | $173.02 | $244.85 | |||||
| 50% | $78.54 | $120.91 | $171.10 | $588.70 | $906.21 | $1282.45 | $155.29 | $239.04 | $338.29 | $1123.97 | $1730.18 | $2448.52 | ||||||
| Rogers | Diesel | 5% | $49.44 | $78.47 | $108.19 | $109.44 | $173.69 | $239.50 | $97.75 | $155.13 | $213.91 | $208.96 | $331.62 | $457.27 | ||||
| 50% | $494.41 | $784.65 | $1081.95 | $1094.44 | $1736.91 | $2395.00 | $977.49 | $1551.32 | $2139.09 | $2089.55 | $3316.21 | $4572.66 | ||||||
| Electric | 5% | $48.73 | $75.02 | $106.16 | $107.87 | $166.05 | $235.00 | $96.35 | $148.31 | $209.89 | $205.96 | $317.04 | $448.67 | |||||
| 50% | $487.32 | $750.16 | $1061.61 | $1078.74 | $1660.55 | $2349.99 | $963.47 | $1483.11 | $2098.88 | $2059.59 | $3170.41 | $4486.72 | ||||||
| $24.09 | 1.00 | F&S | Diesel | 5% | $18.23 | $27.44 | $34.49 | $136.65 | $205.64 | $258.51 | $36.04 | $54.24 | $68.19 | $260.89 | $392.61 | $493.57 | ||
| 50% | $182.31 | $274.36 | $344.91 | $1366.45 | $2056.36 | $2585.14 | $360.44 | $542.43 | $681.91 | $2608.91 | $3926.11 | $4935.68 | ||||||
| Electric | 5% | $18.12 | $26.88 | $34.16 | $135.79 | $201.47 | $256.06 | $35.82 | $53.14 | $67.54 | $259.26 | $384.65 | $488.88 | |||||
| 50% | $181.17 | $268.80 | $341.63 | $1357.89 | $2014.69 | $2560.58 | $358.18 | $531.43 | $675.43 | $2592.55 | $3846.54 | $4888.79 | ||||||
| Rogers | Diesel | 5% | $113.11 | $170.23 | $214.00 | $250.39 | $376.81 | $473.71 | $223.64 | $336.55 | $423.09 | $478.06 | $719.43 | $904.42 | ||||
| 50% | $1131.15 | $1702.25 | $2139.97 | $2503.92 | $3768.11 | $4737.06 | $2236.36 | $3365.48 | $4230.89 | $4780.61 | $7194.28 | $9044.24 | ||||||
| Electric | 5% | $112.41 | $166.78 | $211.96 | $248.82 | $369.17 | $469.20 | $222.23 | $329.73 | $419.07 | $475.06 | $704.85 | $895.83 | |||||
| 50% | $1124.06 | $1667.75 | $2119.64 | $2488.22 | $3691.75 | $4692.05 | $2222.35 | $3297.27 | $4190.68 | $4750.65 | $7048.48 | $8958.30 | ||||||
| $40.56 | F&S | Diesel | 5% | $30.34 | $44.89 | $54.62 | $227.42 | $336.45 | $409.35 | $59.99 | $88.75 | $107.98 | $434.20 | $642.37 | $781.55 | |||
| 50% | $303.42 | $448.89 | $546.15 | $2274.20 | $3364.50 | $4093.48 | $599.89 | $887.49 | $1079.78 | $4342.01 | $6423.69 | $7815.50 | ||||||
| Electric | 5% | $30.23 | $44.33 | $54.29 | $226.56 | $332.28 | $406.89 | $59.76 | $87.65 | $107.33 | $432.57 | $634.41 | $776.86 | |||||
| 50% | $302.28 | $443.33 | $542.87 | $2265.63 | $3322.83 | $4068.92 | $597.63 | $876.50 | $1073.30 | $4325.66 | $6344.12 | $7768.60 | ||||||
| Rogers | Diesel | 5% | $188.26 | $278.51 | $338.86 | $416.73 | $616.52 | $750.10 | $372.20 | $550.64 | $669.95 | $795.64 | $1177.09 | $1432.13 | ||||
| 50% | $1882.58 | $2785.13 | $3388.58 | $4167.28 | $6165.18 | $7500.98 | $3721.99 | $5506.41 | $6699.47 | $7956.39 | $11,770.89 | $14,321.26 | ||||||
| Electric | 5% | $187.55 | $275.06 | $336.82 | $415.16 | $608.88 | $745.60 | $370.80 | $543.82 | $665.93 | $792.64 | $1162.51 | $1423.53 | |||||
| 50% | $1875.49 | $2750.63 | $3368.25 | $4151.59 | $6088.82 | $7455.97 | $3707.97 | $5438.20 | $6659.27 | $7926.43 | $11,625.09 | $14,235.32 | ||||||
| $96.02 | F&S | Diesel | 5% | $71.14 | $103.68 | $122.40 | $533.19 | $777.09 | $917.42 | $140.64 | $204.98 | $242.00 | $1017.99 | $1483.66 | $1751.59 | |||
| 50% | $711.37 | $1036.79 | $1224.02 | $5331.85 | $7770.88 | $9174.23 | $1406.44 | $2049.81 | $2419.98 | $10,179.85 | $14,836.58 | $17,515.91 | ||||||
| Electric | 5% | $71.02 | $103.12 | $122.07 | $532.33 | $772.92 | $914.97 | $140.42 | $203.88 | $241.35 | $1016.35 | $1475.70 | $1746.90 | |||||
| 50% | $710.23 | $1031.23 | $1220.74 | $5323.29 | $7729.21 | $9149.66 | $1404.18 | $2038.81 | $2413.50 | $10,163.50 | $14,757.01 | $17,469.01 | ||||||
| Rogers | Diesel | 5% | $441.37 | $643.27 | $759.44 | $977.02 | $1423.95 | $1681.10 | $872.62 | $1271.80 | $1501.47 | $1865.38 | $2718.68 | $3209.65 | ||||
| 50% | $4413.70 | $6432.73 | $7594.41 | $9770.19 | $14,239.51 | $16,811.02 | $8726.21 | $12,717.97 | $15,014.70 | $18,653.75 | $27,186.83 | $32,096.49 | ||||||
| Electric | 5% | $440.66 | $639.82 | $757.41 | $975.45 | $1416.31 | $1676.60 | $871.22 | $1264.98 | $1497.45 | $1862.38 | $2704.10 | $3201.06 | |||||
| 50% | $4406.61 | $6398.23 | $7574.08 | $9754.49 | $14,163.15 | $16,766.01 | $8712.19 | $12,649.76 | $14,974.50 | $18,623.79 | $27,041.03 | $32,010.55 | ||||||
Publisher’s Note: MDPI stays neutral with regard to jurisdictional claims in published maps and institutional affiliations. |
© 2022 by the authors. Licensee MDPI, Basel, Switzerland. This article is an open access article distributed under the terms and conditions of the Creative Commons Attribution (CC BY) license (https://creativecommons.org/licenses/by/4.0/).
Share and Cite
Sujan, V.; Jones, P.T.; Siekmann, A. Characterizing the Payback and Profitability for Automated Heavy Duty Vehicle Platooning. Sustainability 2022, 14, 2333. https://doi.org/10.3390/su14042333
Sujan V, Jones PT, Siekmann A. Characterizing the Payback and Profitability for Automated Heavy Duty Vehicle Platooning. Sustainability. 2022; 14(4):2333. https://doi.org/10.3390/su14042333
Chicago/Turabian StyleSujan, Vivek, Perry T. Jones, and Adam Siekmann. 2022. "Characterizing the Payback and Profitability for Automated Heavy Duty Vehicle Platooning" Sustainability 14, no. 4: 2333. https://doi.org/10.3390/su14042333
APA StyleSujan, V., Jones, P. T., & Siekmann, A. (2022). Characterizing the Payback and Profitability for Automated Heavy Duty Vehicle Platooning. Sustainability, 14(4), 2333. https://doi.org/10.3390/su14042333


