Article

Characterization of Biochar Derived from Crop Residues for Soil Amendment, Carbon Sequestration and Energy Use

by
Govindarajan Venkatesh
1,*,
Kodigal A. Gopinath
1,
Kotha Sammi Reddy
1,
Baddigam Sanjeeva Reddy
1,
Mathyam Prabhakar
1,
Cherukumalli Srinivasarao
2,
Venugopalan Visha Kumari
1 and
Vinod Kumar Singh
1
1
ICAR—Central Research Institute for Dryland Agriculture (CRIDA), Hyderabad 500 059, India
2
ICAR—National Academy of Agricultural Research Management (NAARM), Hyderabad 500 030, India
*
Author to whom correspondence should be addressed.
Sustainability 2022, 14(4), 2295; https://doi.org/10.3390/su14042295
Submission received: 10 January 2022 / Revised: 10 February 2022 / Accepted: 11 February 2022 / Published: 17 February 2022
(This article belongs to the Special Issue Waste to Biochar for a Sustainable Future)

Abstract

:
The crop residues generated in agricultural fields are mostly considered a burden due to their disposal issues. This study attempts to effectively use pigeon pea stalk (PPS) for biochar production, a promising source as a soil amendment for carbon sequestration and alternative fuel source. PPS was pyrolyzed at different loads and reaction times to optimize the kiln temperature (350–400 °C and 450–500 °C) and changes in physicochemical properties, higher heating value (HHV) and yield were assessed. The results indicated that biochar yield, volatile matter, bulk density, O/C and H/C atomic ratios decreased, whereas fixed carbon, ash content and total porosity increased with increasing kiln temperature across all loads. Biochar produced at 450–500 °C (18 kg load kiln−1) had higher total carbon, nitrogen, phosphorous, recovered total carbon and total nitrogen, total potential carbon and CO2 reduction potential. Biochar produced at 350–400 °C had the maximum cation exchange capability (43.0 cmol kg−1). Biochar has estimated O/C and H/C atomic ratios of 0.07–0.15 and 0.35–0.50, respectively. Biochar exhibited good agronomic characteristics and fulfilled key quality criteria of H/C < 0.7 and O/C < 0.4 for soil carbon sequestration, as described by the European Biochar Certificate and the International Biochar Initiative. The estimated mean residence time and the mass fraction of carbon that would remain after 100 years were consistently greater than 1000 years and 80%, respectively. The biochar produced at 450–500 °C (at 18.0 kg kiln−1) from PPS had higher fixed carbon (65.3%), energy density (1.51), energetic retention efficiency (53%), fuel ratio (4.88), and HHV (25.01 MJ kg−1), as well as lower H/C and O/C ratios, implying that it is suitable for use as an alternative solid fuel.

1. Introduction

Biochar is a versatile, low-cost carbonaceous solid product that results from thermal degradation (slow pyrolysis) of biomass under low temperature, low-oxic or anoxic conditions [1]. Temperatures used for slow pyrolysis are typically in the range of 300 °C to 600 °C. In recent years, the production of biochar via slow pyrolysis technology has piqued interest as a means of managing crop residues, and this conversion is a novel way to potentially add value to crop residues, with additional benefits such as reduced bulkiness, ease of milling, storage, handling, and low transportation costs [2] compared to uncarbonized crop residue. The potential worth of biochar for carbon storage, as well as a high energy material, has become the subject of multi-disciplinary areas of science and engineering research.
Biochar can be used as a soil amendment [3] or a solid fuel akin to low-grade coal [4,5] depending on its physicochemical and energetic qualities. There has been extensive research into using carbon rich biochar to improve soil CEC, water holding capacity, aeration, microbial ecology and to neutralize the pH of acidic soils all while increasing the crop yield [3,6,7]. In addition to these purported benefits, biochar has been recognized for its lower H/C and O/C atomic ratios, with enhanced calorific value and energy density [8]. Furthermore, biochar’s exceptional stability, allows it to store carbon in the soil biosphere for 100 to 1000 years, potentially reducing global warming [9,10]. Forest residues [11], agricultural residues [12,13], and agro-industrial waste [14,15] are only a few examples of organic materials that can be pyrolyzed into biochar. Annually, 511 Mt of crop residues is produced in India [16], of which 141 Mt is estimated to be surplus crop residue [17]. Of this, about 93 Mt of crop residues is burnt each year [18]. According to the Government of India estimate [19], 18.53 Mt of pigeon pea stalks (PPS) is produced in India each year. Due to its low digestibility and high lignin content, PPS is never used as animal feed and is often discarded. Furthermore, because of logistical challenges and limited demand, only a small portion of these PPS has been used as low-cost solid biomass fuel in villages for cooking and heating, and most of the PPS have been left unattended in farm fields. Furthermore, unattended agricultural residues with low bulk density and slow decomposition disrupt soil preparation and crop establishment and are frequently burned directly in open fields, posing a major hazard to the environment, biodiversity, and human health [20]. Farmers can use slow pyrolysis to turn their enormous quantities of leftover crop residues into biochar. Soil inclusion of crop residual biochar provides a novel prospect for efficient residue usage and an enticing alternative to open field burning [20].
Previous studies have demonstrated that the feedstock and production conditions have a significant influence on biochar yield [9,13,21,22], physicochemical characteristics [23,24,25,26,27,28,29,30,31,32,33,34,35]; stability and mean resident time (MRT) [9,25,36,37,38,39,40,41,42,43], total potential carbon (TPC) and CO2 reduction potential [44,45,46], and energy properties [47,48,49,50,51,52]. Thus, detailed information about the complete production process and characterization is a key factor in defining the most appropriate application of biochar, for instance, as highly recalcitrant biochar may function as carbon fixation materials, whereas those rich in elemental compositions or those which have high porosity could be used as amendments to improve soil fertility [3] or those with a higher heating value (HHV) could be exploited to produce solid fuel in the form of briquettes [41] for industrial applications.
However, there is limited information available on the impact of production conditions on biochar’s compositional quality and energy characteristics made from PPS in India. Hence, experimentation with this kind of crop stalk is of great interest and detailed studies are required to optimize the production conditions and characterization of biochar from PPS. Biochar was made from PPS in this experiment using a biochar kiln developed at ICAR-CRIDA in Hyderabad [30,31]. As a result, the primary objective of this research was to evaluate the physicochemical and energy properties of PPS biochar under various production conditions in order to determine its suitability for usage as a soil amendment and an energy alternative. The specific objectives were, (1) to determine biochar’s stability and carbon sequestration potential, and (2) to quantify its energy potential.

2. Materials and Methods

2.1. Feed Stock and Biochar Preparation

The PPS (Cajanus cajan (L.) Millsp.; a leguminous plant) used in the present study was obtained from Hayathnagar Research Farm, ICAR-Central Research Institute for Dryland Agriculture, Hyderabad, India. The raw materials were dried to a moisture level of less than 9% before being chopped into 15–19 cm segments with a diameter of 10–33 mm. To ensure uniformity, the stalk samples were combined and stored in dry conditions. With a C/N ratio of 40.7, the PP stalk had 68.2% volatile matter, 17.0% fixed carbon, 14.9% ash, 460.0 g kg−1 total C, 11.3 g kg−1 total N, 2.9 g kg−1 total P, and 3.0 g kg−1 total K.
The biochar kiln unit and its operations have been described in detail by Venkatesh et al., [31]. The process of biochar made in this study consisted of subjecting the PPS sample to twenty-four test runs (4 replicates (n); 3 load types- 8, 13 and 18 kg kiln−1; two reaction times for each load type; degrees of freedom > 12) in a CRIDA biochar kiln unit with limited air supply. Reaction time is the amount of time taken for the PPS to achieve the necessary thermal conditions for the development of separate end stages (grey and blue colour phases), as well as for approximating kiln temperature. Using a digital clock, the target end stage for each load type was recorded. In this study, we looked at the effect of PPS quantity on reaction time. Two varying reaction times were recorded for the development of end stage in each load group. Blue colour had a longer reaction time than grey colour, which corresponded to a higher kiln temperature. Based on the earlier studies [30,31,53], kiln temperatures of about 350–400 °C and 450–500 °C were ascribed to grey and blue colour phase, respectively, in the text to facilitate inference (Table 1). The temperature ranges of 350–400 °C and 450–500 °C adopted in this study are indicative of typical ranges for slow pyrolysis for higher biochar yield [54]. After cooling by convection and radiation, the biochar was placed in airtight plastic containers until further analyses. Biochar produced in each run were weighed on a mass basis using an electrical balance of having the least count of 0.001 g. Biochar yield (Ybiochar) was calculated as the proportion of the mass of pyrolysis product to the raw stalk as follows:
Ybiochar,ad (wt%.ad) = (Mbiochar/Mstalk) × 100, where Mbiochar was the mass of biochar (kg) and Mstalk was the total mass of the raw stalk (kg) loaded into the kiln and Ybiochar,ad represents the air-dried yield of biochar (%) [55].

2.2. Biochar Characterization

A representative biochar sample in quadruplicates from each combination of kiln load and temperature range were homogenized, grounded to ≤0.21 mm sieve (70 mesh), and oven dried at 105 °C for 24 h prior to characterization using various procedures for determining proximate (volatile matter, ash and fixed carbon content) and ultimate (pH, electrical conductivity, bulk density, total porosity, cation exchange capacity, total carbon, nitrogen, phosphorous and potassium) content

2.2.1. Proximate Analysis

Volatile matter (VM) of the PPS and biochar samples were determined according to ASTM D 1762-84 [56] on an oven dry-weight basis by measurement of weight loss/mass balance from a sequential muffle procedure. The percentage of VM was determined based on the loss in weight of test sample after deducting the loss in weight due to moisture, i.e.,
Volatile matter (%) = (Mbiochar or stalk − MCC/Mbiochar or stalk) × 100
where Mbiochar or stalk was the initial dry mass of biochar/stalk, MCC was dry mass of the carbonized biochar or stalk that remained after heating.
Ash content of the PPS and biochar samples were determined by dry combustion of the carbonized biochar/stalk residue of the VM determination, according to ASTM D 1762-84 [56], i.e.,
Biochar or Stalk ash (%) = (Mash/Mbiochar or stalk) × 100
where Mash was the dry mass of ash remains following dry combustion of the carbonized biochar or stalk, Mbiochar or stalk was the initial dry mass of biochar or stalk.
Fixed carbon (FC) in the PPS and biochar was calculated as follows:
Fixed carbon (FC) (%) = (100 − %VM − %Ash) [55].

2.2.2. Ultimate Analysis

The pH of the biochar was determined by soaking 1 g of biochar in 20 mL of deionized water (1:20 w/v) for 10 min under agitation and was measured using a pH meter (Systronics pH system 362). The electrical conductivity (EC) of the biochar was measured at room temperature in a 1:10 w/v suspension (biochar: deionized water) after 24 h using an EC meter (Systronics conductivity meter 306).
Bulk density (BD) and total porosity of biochar were determined by using the Hilgard or Keen Rackzowski box method [57]. The cation exchange capacity of biochar was determined at pH 7 after displacement by using the 1N ammonium acetate method and then estimated titrimetrically by distillation of ammonium that was displaced by sodium [23]. Total carbon (C) and nitrogen (N) in PPS and biochar were determined directly by dry combustion on a Vario El Cube CHN analyzer (Elementar, Germany). The results of total C and N analysis were used to calculate the C/N ratio. The concentration of total phosphorous (P) and potassium (K) was determined after digesting 0.5 g each of PPS and biochar sample in a di-acid mixture of nitric (HNO3) and perchloric (HClO4) acids (3:1 ratio) [58]. The digests were filtered using Whatman No. 42 filter paper. Total P in the filtrate was analyzed by Vanadomolybdo phosphoric yellow colour method at 420 nm using a spectrophotometer (Genesys 6, Thermo Fischer Scientific, Waltham, MA, USA). The clear digest was then analyzed for total K using a flame photometer.

2.2.3. Recovery of Total Carbon and Nitrogen in Biochar

Recovery of total carbon (C) and nitrogen (N) in the biochar following slow pyrolysis was determined for each pyrolytic run based on the load (kg kiln−1), biochar yield (%), total C and N (%) content of PPS and biochar as follows [59],
Total C or N in raw stalk (g) = [Raw stalk kiln−1 (kg) × total C or N in raw stalk (%)]/100
Biochar yield (kg) = [Biochar yield (%) × raw stalkkiln−1(kg)]/100
Total C or N in biochar (kg) = total C or N in biochar (%)/100
Total C or N loss (kg) = Total C or N in raw stalk (kg) − total C or N in biochar (kg)
Total C or N loss (%) = [Total C or N loss (kg)×100]/Total C or N in raw stalk (kg)
Total C or N recovery (%) = 100-total C or N loss (%)

2.2.4. Biochar Stability

Based on the proximate analysis data, the H/C and O/C atomic ratios for the biochar were estimated by using Equations (1) and (2) [39],
H/C = 0.397 × (VM/FC) + 0.251
O/C = 0.188 × (VM/FC) + 0.035
where FC is the percentage of fixed carbon content and VM is the percentage of volatile matter content in the biochar.
Mean residence time and the percent of carbon that would remain in the soil after 100 years (BC+100)was calculated according to Equations (3) and (4) [37],
MRT = 4501 × e −3.2 × (H/C)
BC+100 = 1.05 − 0.616 × (H/C)
where MRT andBC+100are mean residence time (MRT expressed in years) and the % of carbon that would remain in the soil after 100 years (BC+100), respectively. H/C stand for the atomic ratio of the biochar. The letter ‘e’ represents the term exponential.

2.2.5. Carbon Dioxide Reduction Potential

The total potential carbon ( T P C ) was calculated according to Equation (5) [46],
TPC in biochar (g of C kg−1 of biochar) = Total biochar yield (kg of biochar kg−1 of stalk) × Fixed carbon (kg of FC kg−1 of biochar)
Finally, the carbon di-oxide reduction potential (CO2 eq kg−1 of biochar) was estimated according to Equation (6) [44],
CO2 reduction potential = TPC in biochar (g of C kg−1 of biochar) × (80/100) × (44/12)

2.2.6. Fuel Properties

Based on the result of the proximate analysis, the elemental composition of common organic elements such as hydrogen (H), and oxygen (O) for the PPS were estimated using empirical correlation Equations (7) and (8) developed by Parik et al., [52],
H (%) = 0.052 × FC + 0.062 × VM
O (%) = 0.304 × FC + 0.476 × VM
where FC is the percentage of fixed carbon content and VM is the percentage of volatile matter content in the PPS.
The calorific or higher heating value (HHV) of samples of the PPS and biochar was calculated using the correlation expressed in Equation (9).
HHV (MJ kg−1) = 0.3536 × FC + 0.1559 × VM − 0.0078 × Ash
where FC is the percentage of fixed carbon content, VM is the percentage of volatile matter content and Ash is the percentage of ash content in the PPS and biochar, respectively [52].
The data of product yield and proximate analysis associated with the biochar were used to calculate energy densification (Ed), energetic retention efficiency (ERE), HHV improvement (HHVi), FC densification (FCd), FC recovery efficiency (FCre) and fuel ratio (Fr) of biochar according to Equations (10)–(15) [48,51],
Energy densification (Ed) = HHV of dried biochar/HHV of dried PPS
Energy retention efficiency (ERE) (%) = Ed × biochar yield
HHV improvement (HHVi) = (HHV of dried biochar − HHV of dried PPS)/HHV of dried PPS
Fixed carbon densification (FCd) = FC of dried biochar/FC of dried PPS
Fixed carbon recovery efficiency (FCre) (%) = FCd × Biochar yield
Fuel ratio (Fr) = Fixed carbon of biochar/Volatile matter of biochar

2.2.7. Statistical Analyses

Results were expressed as means of the four replicates (n) ± standard deviation. Data (treatments 06; replications 04; degrees of freedom >12) were statistically analysed using SAS Version 9.2 (SAS Institute Inc., Cary, NC, USA) with ANOVA. To elucidate significant differences between means (p < 0.05), post hoc comparisons were made using Tukey’s HSD.

3. Results and Discussion

3.1. Biochar Yield

The pyrolysis parameters, such as temperature and reaction time, have a significant impact on biochar output [60]. According to the findings, the yield of biochar from PPS decreased significantly when the kiln temperature increased from 350–400 °C to 450–500 °C among three loads of PPS (Table 2). The biochar yield significantly varied from 36.1 to 13.5% (DW basis). The lowest biochar mass yield (13.5%) was observed at the temperature of 450–500 °C (13.0 kg load kiln−1; reaction time of 13.0 min). The yield reduction with increase in temperature may be due to complete decomposition of hemicellulose at 220–315 °C and cellulose at 315–400 °C [33] compared to incomplete and slow thermal degradation of lignin at 500 °C [22]. We observed significantly higher biochar yield at the lower temperature range (350–400 °C), due to negligible condensation and volatilization of organic substances in the feedstock [21].

3.2. Proximate Analysis

Variations in results for fixed carbon, ash and volatile matter contents of the biochar (Table 2) obtained with increasing temperature were in accordance with general trends reported [29,55]. Fixed carbon and ash contents of biochar increased significantly from 41.1 to 65.3% and 21.3 to 41.7% per unit dry weight in all loads as the temperature increased from 350–400 °C to 450–500 °C, whereas VM content decreased significantly from 26.0 to 11.8% per unit dry weight as the temperature increased in each load. PPS pyrolyzed at 450–500 °C (at 18 kg load kiln−1) had the highest fixed carbon content (65.3% per unit dry weight), owing to the presence of higher carbon content in the PPS (460 g kg−1). When pyrolyzed at 450–500 °C (at 13 kg load kiln−1), biochar had significantly higher ash content (41.7% per unit dry weight). Enders et al., [25] observed that during biomass pyrolysis, interactions between organic and inorganic elements may favour high ash content in biochar. We also noticed a reduction in volatile matter content in the biochar with an increase in the temperature. With an increase in carbonization temperature from 350–400 °C to 450–500 °C, the maximum reduction in volatiles (36.0%) was observed in biochar produced at 8 kg load kiln−1 while the lowest was (20.7%) in biochar produced from 18 kg load kiln−1. This finding showed that the higher the temperature, the higher will be the biochar stability [31]. Regardless of the ash contents, the VM/FC ratio decreased significantly to 0.21 with an increase in kiln temperature indicating its resistance to further decomposition, biological as well as thermal [54].

3.3. Ultimate Analysis

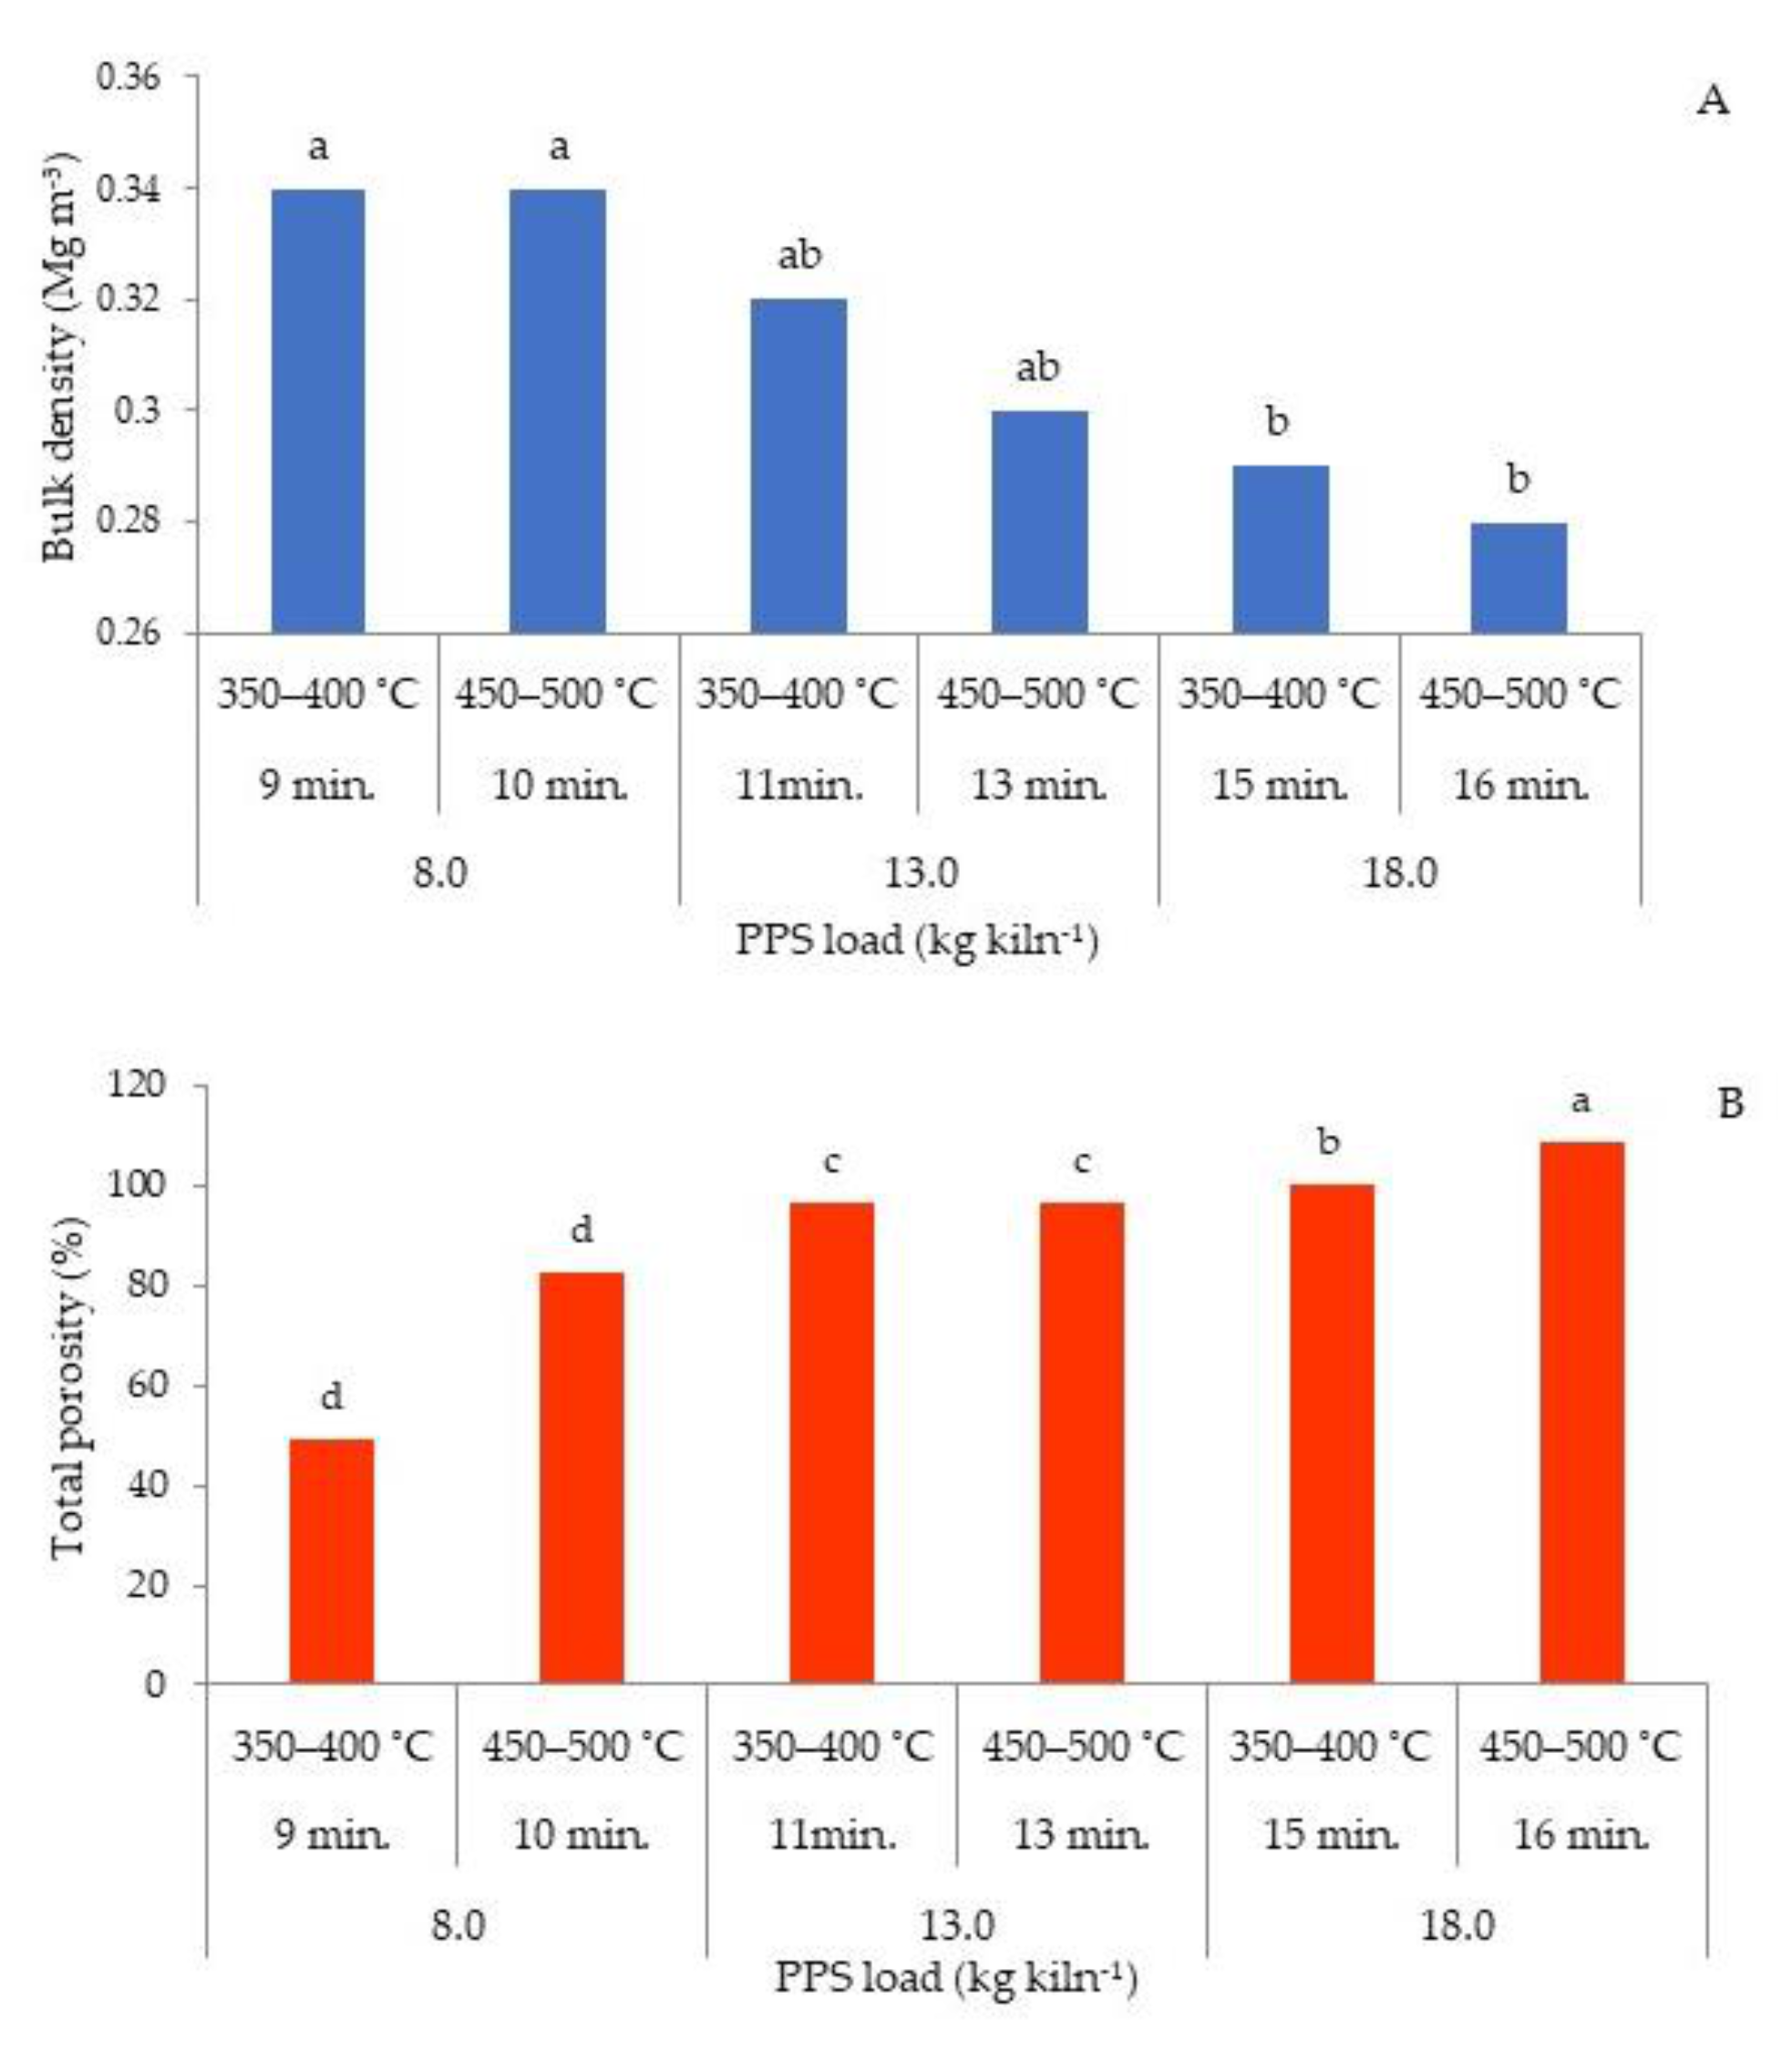
3.3.1. Bulk Density and Total Porosity

The purpose of carbonization through slow pyrolysis was to enrich the carbon content and to create a porous and less dense biochar from PPS. The total porosity and bulk density values of PPS biochar indicate that the resultant physical structure had changed after carbonization. There was a decrease in bulk density and an increase in total porosity of biochar across all loads with the increase in the kiln temperature from 350–400 °C to 450–500 °C (Figure 1). Bulk density of biochar dropped significantly from 0.34 to 0.28 Mg m−3, while the corresponding total porosity values of the biochar significantly increased from 49.1 to 108.5% (at 8, 13 and 18 kg load kiln−1), respectively. The drop in bulk density of biochar may be attributed to the organic matter decomposition leading to the transformation of biomass matrices into a lighter and porous structure [34]. Increased pyrolysis temperature results in dramatic rise in porosity [9] due to increases in dehydroxylation of water molecules, thereby resulting in the formation of pores on the surface of biochar [35]. Lower bulk density of 0.28 Mg m−3 was related to maximum total porosity of 108.5% for the biochar with 18 kg load kiln−1 at 450–500 °C. Higher pyrolysis temperatures lead to the formation of low density biochar with high internal porosity [34]. Soil application of low bulk density biochar with high total porosity is particularly helpful in improving soil aeration, water holding capacity, nutrient retention, harbouring of micro-organisms, increasing the fertiliser use efficiency of soil, soil workability and plant growth [2,61].

3.3.2. pH and Electrical Conductivity

Across the three loads of PPS, the pH and electrical conductivity (EC) of biochar generated at temperatures of 350–400 °C and 450–500 °C ranged from 7.4 to 7.8 and 0.01 to 0.05 dS m−1, respectively (Table 3). All of the biochar samples had a mildly alkaline pH (pH 7.4–7.8). However, the loading rate and temperature had no significant effect on biochar pH. The pH value of the biochar increased with a concomitant increase in temperature range within each load, a characteristic that was found associated with an increase in temperature [26]. Higher pH of biochar at 450–500 °C was probably due to a decrease in acid functional groups at higher temperature as indicated by the higher CEC (indicative of carboxyl groups) of lower pH biochar produced under 350–400 °C. The presence of carbonates, inorganic alkalis and increased ash residue portion due to dihydroxylation of inorganic and organic matrices explains well the high pH value at 450–500 °C than at 350–400 °C [26]. The alkalinity of PPS biochar can be potentially employed as a soil amendment for the amelioration of acidic soils through a liming effect [29].
All of the biochars studied were non-saline (0–2.0 dS m−1) in nature, with electrical conductivity values ranging from 0.01 to 0.05 dS m−1. Contrary to pH, biochar had lower electrical conductivity values (0.01–0.05 dS m−1). The highest electrical conductivity values (0.05 dS m−1) were observed for biochar produced at 450–500 °C (at 18.0 kg kiln−1). The rise in biochar EC values could be attributed to a rise in temperature. The findings are similar to those of Kloss et al., [27]. Based on the findings, it is possible that biochar produced in this study, due to its lower EC values, will not have an unfavourable influence on soil EC when used as a soil amendment. As the EC value of the biochar change influence the nutrient availability in the soil, the quantity and frequency of its application should be carefully determined for various soil types.

3.3.3. Cation Exchange Capacity

Cation exchange capacity (CEC) of biochar is indicative of the capacity of biochar to retain key nutrient cations in a plant-available form [32]. A kiln temperature increase from 350–400 °C to 450–500 °C induced a significant reduction in the CEC of biochar from 43.0 to 14.0 cmol kg−1 across the loads (Table 3). This finding agrees with those of Gaskin et al., [23] and Singh et al., [62]. A decrease in surface acidic functional groups with an increase in temperature range [63,64] might have contributed to the lower CEC values associated with the biochar in the present study. Significantly higher CEC (43.0 cmol kg−1) in biochar was observed with 18.0 kg load kiln−1 at 350–400 °C, which supports the relationship between functional groups and biochar CEC [29,32]. The presence of negatively charged functional groups on the biochar surface gives biochar its ability to attract, retain and exchange basic cations [28]. Low CEC values of the biochar produced at the higher temperature of 450–500 °C do not seem to have strong nutrient retention potential if applied fresh in soil.

3.3.4. Total Carbon (C), Nitrogen (N), Phosphorous (P) and Potassium (K)

The total C, N and P composition of biochar was strongly influenced by the PPS composition and kiln temperature (Table 3). Significantly higher total C (756.5 g kg−1), total N (17.0 g kg−1) and total P (8.0 g kg−1) concentration in the biochar was recorded at a load of 18 kg kiln−1 (450–500 °C). The effect of kiln temperature on the total K concentration of biochar was non-significant.
Total C content in biochar increased with an increase in the kiln temperature [22]. Total C content changed in the range of 665.7 to 666.4%, 719.0 to 730.0%, 740.0% to 756.5% with an increase in the kiln temperature from 350–400 to 450–500 °C, respectively, in each of 8.0, 13.0 and 18.0 kg load kiln−1. PPS biochar had a total C enrichment of 1.6 times that of PPS [29] and could be an effective source of soil carbon sequestration. Increasing temperature, enrichment through dehydration, condensation, polymerization and aromatization effectively favoured the total C content in PPS biochar [22,29].
Similarly, with an increase in temperature at different loading rates, the total N content in biochar was 1.18–1.82 times higher than that of the PPS. Aromatization [23] is largely responsible for the incorporation of N into heterocyclic structures such as pyridines or pyrrols [24]. This could explain the enrichment of total N in PPS biochar relative to the original feedstock [29] with the increase in kiln temperature. The biochar C/N ratios ranged between 44.5 and 65.8 and were found to decrease with increasing temperature [31]. Generally, higher C/N ratios are reported to result in inorganic N immobilization by microbes which induce N unavailability for plants [28]. Even though our results suggest wider C/N ratios, the recalcitrance nature of biochar may resist microbial decay to an extent suggesting that biochar as a soil amendment has little influence on soil N immobilization [65].
The results of the present study showed that similarly to total N, the total concentrations of essential nutrients (total K and P) in biochar were higher compared to PPS, suggesting that the principal chemical components were concentrated in the biochar during the slow pyrolysis of stalks [24]. The total concentrations of K and P in biochar were 2.8 and 1.7 times higher than those in PPS which could explain the nutrient enrichment during conversion. These results are consistent with an earlier study reported for castor stalk biochar [30] which found that the nutrient concentrations of stalk and kiln temperature can strongly influence biochar contents. The K and P need a charring temperature above 760 °C and 800 °C, respectively, to vaporize [66,67] during slow pyrolysis whereas the higher limit adopted in the present study was 450–500 °C. Therefore, initial nutrient concentrations of the stalk and reduced volatilization losses might have contributed to the effective retention of nutrients in biochar [24].

3.3.5. Recovery of Total Carbon and Nitrogen

The amount of total carbon (C) and nitrogen (N) recovered in the PPS biochar varied depending upon the respective ash content and temperature range (Table 4). The recovered total C and N in the biochar reduced with the increase in temperature from 350–400 °C to 450–500 °C in all three loads. The recovered total C and N ranged from 58.1 to 21.4% and 52.5 to 16.7% in the biochar produced from PPS at a temperature of 350–400 °C and 450–500 °C, respectively. A significantly higher amount of total C (58.1%) and total N (52.5%) was recovered in the biochar produced with 18 kg load kiln−1 at 350–400 °C and 450–500 °C, respectively. At different temperatures within each load, the recovered total C in biochar was inversely proportional to the ash content of the corresponding biochars. Significant changes in the amount of total C recovered with an increase in the production temperature range might have been related to the original feedstock concentrations of ash, lignin, cellulose, and hemicellulose and the pyrolysis temperature [60]. Present results on the amount of total C recovered in biochar might have been influenced due to the volatilization of carbon elements bonded with volatile chemicals constituents compared to less volatile elements that concentrated during carbonization [27]. However, the recovered total N in the biochar was inversely proportional to an increase in the temperature range within each load. Novak et al., [24] ascribed the variation in the recovery of total N to condensation of N-containing structures in the biochar into recalcitrant heterocyclic N rather than the more bioavailable amine N. Furthermore, N volatilization in gaseous form at low temperatures could have resulted in lower total N recovery in the current study [25].

3.3.6. Biochar Stability

The VM, FC and Ash composition of the biochar was used to calculate the O/C and H/C atomic ratios by using Equations (1) and (2) which is likely to be an indicative measure of the degree of biochar stability in the soil.
The data in Table 5 showed that the ratios in all biochars declined steadily as the kiln temperature increased, indicating the loss of degradable polar contents [9,39,42] with a higher degree of condensation and aromatisation reactions with increasing temperature [38]. The O/C and H/C atomic ratios of PPS biochar ranged between 0.07–0.15 and 0.35–0.50, respectively. O/C and H/C atomic ratios decreased with the increase in temperature from 350–400 °C to 450–500 °C in all three loads suggesting that the lower the O/C and H/C atomic ratios, the higher degree of aromaticity and stability with increasing kiln temperature [36]. The reduction in H/C atomic ratio suggests higher structural stability in PPS biochars due to increased aromatisation [41]. The reduction in ratio can be attributed to the removal of hydrogen through dehydration and dehydrogenation reactions and the cleavage and cracking of weak hydrogen bonds during conversion within the biochar, similar to the observations of Qian et al., [68]. Whereas the decreased O/C atomic ratio implies that the higher degree of carbonization occurred by removal of oxygen through dehydration and decarboxylation reactions during conversion [40,41]. These characteristics give biochar long-term chemical stability against microbial degradation [36], allowing it to persist in soil for hundreds of years [43]. The results of previous research suggested that the aromaticity of biochar formed at higher pyrolysis temperatures was stronger and had lower H/C and O/C atomic ratios than biochar prepared at lower temperatures [10]. The data proved that pyrolysis studies conducted in this study were successful in converting PPS into biochar with decreasing H/C and O/C atomic ratios with increasing temperature in all three loads, indicative of improved fuel properties comparable to lignite, sub-bituminous bituminous coal with higher heating values.
In a comprehensive review by Lehmann et al., [37], two equations, Equations (3) and (4), were suggested to estimate MRT (years)and the mass fraction of carbon that would remain after 100 years (BC+100). With an increase in kiln temperature from 350–400 °C to 450–500 °C in all three loads, the MRT and the mass fraction of carbon that would remain after 100 years (Table 5) increased. Values of MRT and (BC+100) ranged from 903.6 to 1553.58 years. and 74.0 to 84.5%, respectively. The estimated MRT and the mass fraction of carbon that would remain after 100 years were greater than 1000 years and 80%, respectively, for biochar with a H/C ratio of 0.33 to 0.40 [25,37]. As per IBI Guidelines [69] and European biochar certificate [70], biochar with H/C < 0.7 and O/C < 0.4 will be effective in sequestering carbon when incorporated in the soil. Hence, the biochar developed in this study could be used in carbon-deficient soils with the added benefit of long-term carbon storage.

3.3.7. CO2 Reduction Potential

The amount of TPC (Equation (5)) and CO2 reduction potential (Equation (6)) of the biochar produced at varying production conditions decreased with an increase in temperature under 8 and 13 kg load kiln−1 (Table 5). This is due to the reduction in biochar yield as the kiln temperature increases [46]. Even though the reduction in biochar yield was observed with an increase in temperature from 350–400 °C to 450–500 °C, biochar produced from 18 kg load kiln−1 recorded the highest TPC (228.66 g kg−1) and CO2 reduction potential (67.07 CO2 eq kg−1). The conversion of PPS using this protocol resulted in a more stable form of carbon (biochar) that can withstand microbial decomposition and therefore can store atmospheric CO2 in soil. This unstable carbon in crop waste would have otherwise been rapidly mineralized to carbon dioxide if either left to decompose naturally or burned in-situ. The findings also indicate that PPS biochar produced at 450–500 °C under 18 kg load kiln−1 with the highest organic carbon (756.5 g kg−1) could be exploited as an agent for long term carbon storage in soil as a climate change mitigation option. This could be due to the large quantity of atmospheric carbon dioxide (to the tune of 67.07 CO2 eq kg−1) converted into a more stable form of carbon that is resistant to degradation and persists in soil for a longer time [71].
Production data collected by the Ministry of Agriculture & Farmers Welfare, Government of India, during 2016–2017 indicated that India produced 18.53 Mt yr−1 of PPS from a gross cropped area of 5.34 M ha (residue crop ratio: 3.8 t t−1 and an average yield of the pigeon pea crop: 0.913 t ha−1) [19]. Based on the present results of 35% biochar yield at 450–500 °C with 65% FC content in PP stalk biochar, the estimated biochar production potential (Mt yr−1), TPC (Mt yr−1) and CO2 reduction potential (Mt C CO2 eq yr−1) of biochar from PPS in India is 6.48, 4.23 and 12.42, respectively. Application of PPS biochar in agricultural soils can sequester about 3.39 Mt yr−1 of carbon, making it a carbon sequestering process.

3.3.8. Energy Related Properties

Table 6 presents the estimated values of energy-related properties of biochar produced at different conditions from PPS including fuel ratio (Fr), energy retention efficiency, energy densification (Ed), HHV, HHV improvement (HHVi), FC densification (FCd), FC recovery efficiency (FCre). These parameters are considered the basis for evaluating the quality of biochar as an energy source. The energy properties of biochar improved via chemical dehydration and decarboxylation reactions that release H2O and CO2 [72]. Along with a loss in weight, these reactions cause a decrease in the volatile matter and an increase in carbon content in the biochar as compared to the raw PPS [48]. These results suggest that longer reaction times and higher temperature ranges may provide greater potential energy recovery in PPS biochar. The FC content and FC densification of the PPS biochar increased with reaction times and temperature range (Table 1 and Table 6). Increases in FC densification with temperature have also been observed in other studies [47]. FC densification has important energy-related implications [47,73].
The energetic retention efficiency is an important parameter to assess the effect of production conditions of biochar as an alternative solid fuel. The energetic retention efficiency is a measure of the fraction of PPS energy retained within the biochar, was s greater at 350–400 °C and 450–500 °C (at 18.0 kg kiln−1) than that at other loading rates, as biochar yield was higher at that temperature. The energetic retention efficiency at 350–400 °C and 450–500 °C (at 8.0 and 13.0 kg kiln−1) decreased slightly with reaction times because of the decreases in biochar yield. These results suggest that the optimum temperature for the production of energy-rich biochar is approximately 450–500 °C.
The energy densification was similar at 350–400 °C and 450–500 °C (at 8.0 and 13.0 kg kiln−1). Energy densification increased with reaction time and was slightly higher at 350–400 °C and 450–500 °C (at 18.0 kg kiln−1). Energy densification in biochar has been reported for a variety of crop residues [47,74].
The HHV, which describes the energy content of biochar, is one of the most essential metrics for determining its potential fuel value. The higher heating value of any fuel is defined as “the energy released per unit mass or per unit volume of the fuel after complete combustion, including all the released energy during combustion in addition to the energy carried away with water vaporization [75]. The HHV of biochar were ranged from 18.3 to 25.01 MJ kg−1 (Table 6). The HHV for each biochar sample increased with higher temperature (350–400 °C to 450–500 °C at 13.0 and 18.0 kg kiln−1) with a larger increase occurring at 350–400 °C to 450–500 °C at 18.0 kg kiln−1. Differences in HHV of the biochar are attributable to relative ash contents [50]. The HHV of PPS biochar (20.74 MJ kg−1) at 350–400 °C (at 18.0 kg kiln−1) was slightly lower than that of lignite (20.89 MJ kg−1) [76], whereas the HHV of biochar (25.01MJ kg−1) at 450–500 °C (at 18.0 kg kiln−1) was higher than that of sub-bituminous coal (24.30 MJ kg−1) [5] and slightly lower than that of bituminous coal (25.84 MJ kg−1) [4] that showed their high energy potentials. The evaporation of low-energy elements like oxygen, hydrogen, and nitrogen to leave high-energy carbon resulted in an increase in HHV [49]. The higher FC (65.3%), energy density (1.51), energetic retention efficiency (53%), fuel ratio (4.88) and HHV (25.01 MJ kg−1), as well as the lower H/C and O/C ratios indicate that the biochar produced at 450–500 °C (at 18.0 kg kiln−1) from PPS can be used as an alternative solid fuel [77].

4. Conclusions

This study presented the feasibility of producing biochar from PPS under varying production conditions, which could be immensely useful for the efficient management of surplus crop waste. Fixed carbon, ash, total carbon, total N, P and porosity in the PPS biochar increased, whereas the biochar yield, volatile matter, cation exchange capacity and recovered total C and N decreased with an increase in the kiln temperature from 350–400 °C to 450–500 °C. PPS biochar having lower bulk density, higher total C and recovered C and N with low H/C and O/C atomic ratios could be useful for restoration of degraded poor agricultural soils through enhanced carbon sequestration. Biochar produced from PPS exhibited good agronomic properties and fulfilled key quality criteria of H/C < 0.7 and O/C < 0.4 for soil carbon sequestration, as described by the European Biochar Certificate (EBC) and the International Biochar Initiative (IBI). Maximum TPC (228.66 g kg−1) and CO2 reduction potential (67.07 CO2 eq kg−1) were observed in the PPS biochar produced at 450–500 °C and 18 kg load kiln−1. The estimated mean residence time (MRT) and the mass fraction of carbon that would remain after 100 years were greater than 1000 years and 80%, respectively, for PPS biochar with a H/C atomic ratio from 0.33 to 0.40. This study provides information on optimized procedures for biochar production from PPS with properties suitable for long term storage of carbon in agricultural soil, viz., higher aromatic character, high carbon concentration, low H/C atomic ratio. The biochar also had higher HHVs and fixed carbon contents, which can be considered as a suitable alternative solid fuel for energy applications.

Author Contributions

Conceptualization, G.V.; methodology, G.V. and K.A.G.; formal analysis, G.V. and K.A.G.; investigation, G.V. and B.S.R.; resources, B.S.R. and M.P.; data curation, K.S.R. and C.S.; writing—G.V.; writing—review and editing, G.V., K.A.G. and V.V.K.; supervision, K.S.R. and K.A.G.; project administration, V.K.S. All authors have read and agreed to the published version of the manuscript.

Funding

This work was financially supported by grants from the Indian Council of Agricultural Research (ICAR), New Delhi in the form of the National Innovations in Climate Resilient Agriculture (NICRA) Project (Grant number:2–2(201)/17–18/NICRA).

Institutional Review Board Statement

Not applicable.

Informed Consent Statement

Not applicable.

Data Availability Statement

The data is available on request from the corresponding author for reasonable reasons.

Conflicts of Interest

The authors declare no conflict of interest.

References

  1. Gul, S.; Whalen, J.K.; Thomas, B.W.; Sachdeva, V.; Deng, H. Physico-chemical properties and microbial responses in biochar-amended soils: Mechanisms and future directions. Agric. Ecosyst. Environ. 2015, 206, 46–59. [Google Scholar]
  2. Masto, R.E.; Kumar, S.; Rout, T.K.; Sarkar, P.; George, J.; Ram, L.C. Biochar from water hyacinth (Eichornia crassipes) and its impact on soil biological activity. Catena 2013, 111, 64–71. [Google Scholar] [CrossRef]
  3. Sohi, S.; Krull, E.; Capel, E.L.; Bol, R. A review of biochar and its use and function in soil. Adv. Agron. 2010, 105, 47–82. [Google Scholar]
  4. Geng, C.; Li, S.; Yue, C.; Ma, Y. Pyrolysis characteristics of bituminous coal. J. Energy Inst. 2015, 89, 725–730. [Google Scholar] [CrossRef]
  5. Valde´s, C.F.; Chejne, F.; Marrugo, G.; Macias, R.J.; Go´mez, C.A.; Montoya, J.I.; Londoño, C.A.; Cruz, J.D.L.; Arenas, E. Co-gasification of subbituminous coal with palm kernel shell in fluidized bed coupled to a ceramic industry process. Appl. Therm. Eng. 2016, 107, 1201–1209. [Google Scholar] [CrossRef]
  6. Ajayi, A.E.; Horn, R. Modification of chemical andhydro physical properties of two texturally differentiated soils due to varying magnitudes of added biochar. Soil Tillage Res. 2016, 164, 34–44. [Google Scholar] [CrossRef]
  7. Laghari, M.; Hu, Z.; Mirjat, M.S.; Xiao, B.; Tagar, A.A.; Hu, M. Fast pyrolysis biochar from sawdust improves the quality of desert soils and enhances plant growth. J. Sci. Food Agric. 2016, 96, 199–206. [Google Scholar]
  8. Phanphanich, M.; Sudhagar Mani, S. Impact of torrefaction on the grindability and fuel characteristics of forest biomass. Bioresour. Technol. 2011, 102, 1246–1253. [Google Scholar] [CrossRef] [PubMed]
  9. Keiluweit, M.; Nico, P.S.; Johnson, M.G.; Kleber, M. Dynamic molecular structure of plant biomass-derived black carbon (biochar). Environ. Sci. Technol. 2010, 44, 1247–1253. [Google Scholar] [CrossRef] [PubMed] [Green Version]
  10. Wei, S.; Zhu, M.; Song, J.; Peng, P.A. Comprehensive characterization of biochars produced from three major crop straws of China. Bioresources 2017, 12, 3316–3330. [Google Scholar] [CrossRef] [Green Version]
  11. Xu, T.; Lou, L.; Luo, L.; Cao, R.; Duan, D.; Chen, Y. Effect of bamboo biochar on pentachlorophenol leachability and bioavailability in agricultural soil. Sci. Total Environ. 2012, 414, 727–731. [Google Scholar] [PubMed]
  12. Prabha, B.; Pugalendhi, S.; Subramanian, P. Design and development of semi-indirect non-electric pyrolytic reactor for biochar production from farm waste. Indian J. Agric. Sci. 2015, 85, 585–591. [Google Scholar]
  13. Purakayastha, T.J.; Kumari, S.; Pathak, H. Characterization, stability, and microbial effects of four biochars produced from crop residues. Geoderma 2015, 239–240, 293–303. [Google Scholar] [CrossRef]
  14. Jothiprakash, G.; Palaniappan, V. Development and optimization of pyrolysis unit for producing charcoal. Int. J. Agric. Environ. Biotechnol. 2014, 7, 863–868. [Google Scholar] [CrossRef]
  15. Munongo, M.E.; Nkeng, G.E.; Njukeng, J.N. Production and characterization of compost manure and biochar from cocoa pod husks. Int. J. Adv. Scient. Res. Manag. 2017, 2, 26–31. [Google Scholar]
  16. Ministry of New and Renewable Energy Resources. National Biomass Resource. Atlas; 2009. Available online: https://biomasspower.gov.in/biomass-info-asa-fuel-resources.php (accessed on 12 January 2020).
  17. Kaur, A. Crop residue in Punjab agriculture- Status and constraints. J. Krishi Vigyan 2017, 5, 22–26. [Google Scholar] [CrossRef]
  18. IARI. Crop Residues Management with Conservation Agriculture: Potential, Constraints and Policy Needs; Indian Agricultural Research Institute: New Delhi, India, 2012; p. 32. [Google Scholar]
  19. Government of India. Agricultural Statistics at a Glance 2018. Directorate of Economics and Statistics, Ministry of Agriculture and Farmers Welfare, Department of Agriculture, Cooperation and Farmers Welfare, Government of India. 2019. Available online: https://eands.dacnet.nic.in/PDF/Agricultural%20Statistics%20at%20a%20Glance%202018.pdf (accessed on 1 February 2020).
  20. Venkatesh, G.; Gopinath, K.A.; Reddy, K.S.; Reddy, B.S.; Prasad, J.V.N.S.; Rao, G.R.; Pratibha, G.; Srinivasarao, C.; Chary, G.R.; Prabhakar, M.; et al. Biochar Production and its Use in Rainfed Agriculture: Experiences from CRIDA; CRIDA-NICRA Research Bulletin 02/2018; ICAR—Central Research Institute for Dryland Agriculture: Hyderabad, India, 2018; p. 50. [Google Scholar]
  21. Uzoma, K.C.; Inoue, M.; Andry, H.; Fujimaki, H.; Zahoor, A.; Nishihara, E. Effect of cow manure biochar on maize productivity under sandy soil condition. Soil Use Manag. 2011, 27, 205–212. [Google Scholar]
  22. Gonzalez, M.E.; Cea, M.; Sangaletti, N.; Gonzalez, A.; Toro, C.; Diez, M.C.; Moreno, N.; Querol, X.; Navia, R. Biochar derived from agricultural and forestry residual biomass: Characterization and potential application for enzymes immobilization. J. Biobased Mater. Bioenerg. 2013, 7, 724–732. [Google Scholar] [CrossRef]
  23. Gaskin, J.W.; Steiner, C.; Harris, K.; Das, K.C.; Bibens, B. Effect of low temperature pyrolysis conditions on biochar for agricultural use. Tran. Am. Soc. Agric. Biol. Eng. 2008, 51, 2061–2069. [Google Scholar]
  24. Novak, J.M.; Lima, I.; Xing, B.; Gaskin, J.W.; Steiner, C.; Das, K.C.; Ahmedna, M.; Rehrah, D.; Watts, D.W.; Busscher, W.J.; et al. Characterization of designer biochar produced at different temperatures and their effects on a loamy sand. Ann. Environ. Sci. 2009, 3, 195–206. [Google Scholar]
  25. Enders, A.; Hanley, K.; Whitman, T.; Joseph, S.; Lehmann, J. Characterization of biochars to evaluate recalcitrance and agronomic performance. Bioresour. Technol. 2012, 114, 644–653. [Google Scholar] [PubMed]
  26. Hass, A.; Gonzalez, J.M.; Lima, I.M.; Godwin, H.W.; Halvorson, J.J.; Boyer, D.G. Chicken manure biochar as liming and nutrient source for acid Appalachian soil. J. Environ. Qual. 2012, 41, 1096–1106. [Google Scholar] [PubMed]
  27. Kloss, S.; Zehetner, F.; Dellantonio, A.; Hamid, R.; Ottner, F.; Liedtke, V.; Schwanninger, M.; Gerzabek, M.H.; Soja, G. Characterization of slow pyrolysis biochars: Effects of feedstocks and pyrolysis temperature on biochar properties. J. Environ. Qual. 2012, 41, 990–1000. [Google Scholar] [PubMed]
  28. Uras, U.; Carrier, M.; Hardie, A.G.; Knoetze, J.H. Physico-chemical characterization of biochars from vacuum pyrolysis of South African agricultural wastes for application as soil amendments. J. Anal. Appl. Pyrol. 2012, 98, 207–213. [Google Scholar] [CrossRef]
  29. Wu, W.; Yang, M.; Feng, Q.; McGrouther, K.; Wang, H.; Lu, H.; Chen, Y. Chemical characterization of rice straw-derived biochar for soil amendment. Biomass Bioenerg. 2012, 47, 268–276. [Google Scholar]
  30. Venkatesh, G.; Srinivasarao, C.; Venkateswarlu, B.; Gopinath, K.A.; Prasad, J.V.N.S.; Reddy, B.S.; Sasikala, C.; Rao, G.; Babu, P.V.R. Operational process for biochar preparation from castor bean stalk and its characterization for soil application. Indian J. Dryland Agric. Res. Dev. 2013, 28, 21–26. [Google Scholar]
  31. Venkatesh, G.; Venkateswarlu, B.; Gopinath, K.A.; Srinivasrao, C.; Korwar, G.R.; Reddy, B.S.; Prasad, J.V.N.S.; Grover, M.; Raju, B.M.K.; Sasikala, C.; et al. Biochar production technology for conversion of cotton stalk bioresidue into biochar and its characterization for soil amendment qualities. Indian J. Dryland Agric. Res. Dev. 2013, 28, 48–57. [Google Scholar]
  32. Naeem, M.A.; Khalid, M.; Arshad, M.; Ahmad, R. Yield and nutrient composition of biochar produced from different feedstocks at varying pyrolytic temperatures. Pak. J. Agric. Sci. 2014, 51, 75–82. [Google Scholar]
  33. Xiong, S.; Zhang, S.; Wu, Q.; Guo, X.; Dong, A.; Chen, C. Investigation on cotton stalk and bamboo sawdust carbonization for barbecue charcoal preparation. Bioresour. Technol. 2014, 152, 86–92. [Google Scholar] [PubMed]
  34. Anupam, K.; Sharma, A.K.; Lal, P.S.; Dutta, S.; Maity, S. Preparation, characterization and optimization for upgrading Leucaena leucocephala bark to biochar fuel with high energy yielding. Energy 2016, 106, 743–756. [Google Scholar]
  35. Narzari, R.; Bordoloi, N.; Chutia, R.S.; Borkotoki, B.; Gogoi, N.; Bora, A.; Kataki, R. Biochar: An Overview on its Production, Properties and Potential Benefits. In Biology, Biotechnology and Sustainable Development, Research; Choudhury, H., Ed.; India Publications: New Delhi, India, 2015; pp. 13–39. [Google Scholar]
  36. Kookana, R.S.; Sarmah, A.K.; Van Zwieten, L.; Krull, E.; Singh, B. Biochar application to soil: Agronomic and environmental benefits and unintended consequences. Adv. Agron. 2011, 112, 103–143. [Google Scholar]
  37. Lehmann, J.; Abiven, S.; Kleber, M.; Pan, G.; Singh, B.P.; Sohi, S.P.; Zimmerman, A.R. Persistence of biochar in soil. In Biochar for Environmental Management: Science, Technology, and Implementation, 2nd ed.; Lehmann, J., Joseph, S., Eds.; Routledge: New York, NY, USA, 2015; pp. 235–283. [Google Scholar]
  38. Usman, A.R.A.; Abduljabbar, A.; Vithanage, M.; Ok, Y.S.; Ahmad, M.; Ahmad, M.; Elfaki, J.; Abdulazeem, S.S.; Al-Wabel, M.I. Biochar production from date palm waste: Charring temperature induced changes in composition and surface chemistry. J. Anal. Appl. Pyrol. 2015, 115, 392–400. [Google Scholar]
  39. Klasson, K.T. Biochar characterization and a method for estimating biochar quality from proximate analysis results. Biomass Bioenerg. 2017, 96, 50–58. [Google Scholar]
  40. Shen, Y.; Yu, S.; Ge, S.; Chen, X.; Ge, X.; Chen, M. Hydrothermal carbonization of medical wastes and lignocellulosic biomass for solid fuel production from lab-scale to pilot-scale. Energy 2017, 118, 312–323. [Google Scholar]
  41. Kaewtrakulchai, N.; Fuji, M.; Eiad-ua, A. Investigation of parametric effects on fuel characteristics of biochar obtained from agricultural wastes pyrolysis. J. Material. Sci. Appl. Energ. 2018, 7, 333–339. [Google Scholar]
  42. Wei, S.; Zhu, M.; Fan, X.; Song, J.; Peng, P.; Li, K.; Jia, W.; Song, H. Influence of pyrolysis temperature and feedstock on carbon fractions of biochar produced from pyrolysis of rice straw, pine wood, pig manure and sewage sludge. Chemosphere 2019, 218, 624–631. [Google Scholar] [PubMed]
  43. Wijitkosum, S.; Jiwnok, P. Elemental composition of biochar obtained from agricultural waste for soil amendment and carbon sequestration. Appl. Sci. 2019, 9, 3980. [Google Scholar] [CrossRef] [Green Version]
  44. Allyson, S. Biochar Production for Carbon Sequestration. Bachelor’s Thesis, Worcester Polytechnique Institute, Worcester, MA, USA, 2011. [Google Scholar]
  45. Gangil, S.; Wakudkar, H.M. Generation of bio-char from crop residues. Int. J. Emerging Technol. Adv. Eng. 2013, 3, 566–570. [Google Scholar]
  46. Tesfamichael, B.; Gesesse, N.; Jabasingh, S.A. Application of rice husk and maize straw biochar for carbon sequestration and nitrous oxide emission impedement. J. Sci. Ind. Res. 2018, 77, 587–591. [Google Scholar]
  47. Lu, X.; Pellechia, P.J.; Flora, J.R.V.; Berge, N.D. Influence of reaction time and temperature on product formation and characteristics associated with the hydrothermal carbonization of cellulose. Bioresour. Technol. 2013, 138, 180–190. [Google Scholar] [CrossRef]
  48. Kim, D.; Lee, K.; Park, K.Y. Upgrading the characteristics of biochar from cellulose, lignin, and xylan for solid biofuel production from biomass by hydrothermal carbonization. J Ind. Eng. Chem. 2016, 42, 95–100. [Google Scholar]
  49. Yang, W.; Wang, H.; Zhang, M.; Zhu, J.; Zhou, J.; Wu, S. Fuel properties and combustion kinetics of hydrochar prepared by hydrothermal carbonization of bamboo. Bioresour. Technol. 2016, 205, 199–204. [Google Scholar] [CrossRef] [PubMed]
  50. Ronsse, F.; van Hecke, S.; Dickinson, D.; Prins, W. Production and characterization of slow pyrolysis biochar: Influence of feedstock type and pyrolysis conditions. GCB Bioenergy 2013, 5, 104–115. [Google Scholar]
  51. Nakason, K.; Pathomrotsakun, J.; Kraithong, W.; Khemthong, P.; Panyapinyopol, B. Torrefaction of Agricultural Wastes: Influence of Lignocellulosic Types and Treatment Temperature on Fuel Properties of Biochar. Int. Energy J. 2019, 19, 253–266. [Google Scholar]
  52. Parikh, J.; Channiwala, S.A.; Ghosal, G.K. A correlation for calculating elemental composition from proximate analysis of biomass materials. Fuel 2007, 86, 1710–1719. [Google Scholar]
  53. Tillman, D.; Rossi, A.J.; William, D.K. Wood Combustion: Principles, Processes, and Economics; Academic Press: New York, NY, USA, 1981; p. 280. [Google Scholar]
  54. Lee, Y.; Park, J.; Ryu, C.; Gang, K.S.; Yang, W.; Park, Y.K.; Jung, J.; Hyun, S. Comparison of biochar properties from biomass residues produced by slow pyrolysis at 500 °C. Bioresour. Technol. 2013, 148, 196–201. [Google Scholar] [PubMed]
  55. Antal, M.J.; Gronli, M. The art, science, and technology of charcoal production. Ind. Eng. Chem. Res. 2003, 42, 1619–1640. [Google Scholar]
  56. ASTM. Standard Test Method for Chemical Analysis of Wood Charcoal D 1762-84; American Society for Testing and Material: West Conshohocken, PA, USA, 2013. [Google Scholar]
  57. Baruah, T.C.; Barthakur, H.P. A Text Book of Soil Analysis; Vikas Publishing House Pvt. Ltd.: New Delhi, India, 1997; p. 234. [Google Scholar]
  58. Miller, R. Nitric-per Chloric Acid Wet Digestion in an Open Vessel. In Hand Book of Reference Methods for Plant Analysis; Kalra, Y.P., Ed.; CRC Press: New York, NY, USA, 1998; pp. 57–61. [Google Scholar]
  59. Streubel, J.D.; Collins, H.P.; Perez, M.G.; Tarara, J.; Granatstein, D.; Kruger, C.E. Influence of contrasting biochar types on five soils at increasing rates of application. Soil Sci. Soc. Am. J. 2011, 75, 1402–1413. [Google Scholar]
  60. Demirbas, A. Effects of temperature and particle size on bio-char yield from pyrolysis of agricultural residues. J. Anal. Appl. Pyrolysis. 2004, 72, 243–248. [Google Scholar]
  61. Downie, A.; Crosky, A.; Munroe, P. Physical Properties of Biochar. In Biochar for Environmental Management: Science, Technology, and Implementation, 1st ed.; Lehmann, J., Joseph, S., Eds.; Earth Scan: London, UK, 2009; pp. 12–13. [Google Scholar]
  62. Singh, B.; Singh, B.P.; Cowie, A.L. Characterization and evaluation of biochars and their application as a soil amendment. Aust. J. Soil. Res. 2010, 48, 516–525. [Google Scholar]
  63. Harvey, O.R.; Herbert, B.E.; Kuo, L.J.; Louchouarn, P. Generalized two- dimensional perturbation correlation infrared spectroscopy reveals mechanisms for the development of surface charge and recalcitrance in plant-derived biochars. Environ. Sci. Technol. 2012, 46, 10641–10650. [Google Scholar] [CrossRef] [PubMed]
  64. Spokas, K. Review of the stability of biochar in soils: Predictability of O:C molar ratios. Carbon Manag. 2010, 1, 289–303. [Google Scholar]
  65. Kimetu, J.M.; Lehmann, J.; Ngoze, O.S.; Mugendi, N.D.; Kinyangi, M.J.; Riha, S.; Verchot, L.; Recha, W.J.; Pell, N.A. Reversibility of soil productivity decline with organic matter of differing quality along a degradation gradient. Ecosystems 2008, 11, 726–739. [Google Scholar]
  66. Knoepp, J.D.; Debano, L.F.; Neary, D.G. Soil Chemistry; US Department of Agriculture, Forest Service, Rocky Mountain Research Station: Ogden, UT, USA, 2005.
  67. Knicker, H. How does fire affect the nature and stability of soil organic nitrogen and carbon? A review. Biogeochemistry 2007, 85, 91–118. [Google Scholar]
  68. Qian, K.; Kumar, A.; Patil, K.; Bellme, D.; Wang, D.; Yuan, W.; Huhnke, R.L. Effects of Biomass Feedstocks and Gasification Conditions on the Physiochemical Properties of Char. Energies 2013, 6, 3972–3986. [Google Scholar] [CrossRef]
  69. IBI Guidelines. Standardized Product Definition and Product Testing Guidelines for Biochar That Is Used in Soil. 2012. Available online: http://www.biocharnternational.org/sites/default/files/Guidelines_for_Biochar_That_Is_Used_in_Soil_Final.pdf (accessed on 11 October 2015).
  70. EBC. European Biochar Certificate—Guidelines for a Sustainable Production of Biochar. European Biochar Foundation (EBC): Arbaz, Switzerland, 2012. Available online: http://www.europeanbiochar.org/en/download (accessed on 1 January 2020).
  71. Guo, J.; Chen, B. Insights on the molecular mechanism for the recalcitrance of biochar: Interactive effects of carbon and silicon components. Environ. Sci. Technol. 2014, 48, 9103–9112. [Google Scholar]
  72. Libra, J.A.; Ro, K.S.; Kammann, C.; Funke, A.; Berge, N.D.; Neubauer, Y.; Titirici, M.M.; Fuhner, C.; Bens, O.; Jurgen, K.; et al. Hydrothermal carbonization of biomass residuals: A comparative review of the chemistry, processes and applications of wet and dry pyrolysis. Biofuels 2011, 2, 89–124. [Google Scholar]
  73. Channiwala, S.A.; Parikh, P.P. A unified correlation for estimating HHV of solid, liquid and gaseous fuels. Fuel 2002, 81, 1051–1063. [Google Scholar]
  74. Hoekman, S.K.; Broch, A.; Robbins, C. Hydrothermal carbonization (HTC) of lignocellulosic biomass. Energy Fuels 2011, 25, 1802–1810. [Google Scholar] [CrossRef]
  75. Ghugare, S.B.; Tiwary, S.; Elangovan, V.; Tambe, S.S. Prediction of higher heating value of solid biomass fuels using artificial intelligence formalisms. Bioenergy Res. 2013, 7, 681–692. [Google Scholar]
  76. An, Y.; Tahmasebi, A.; Yu, J. Mechanism of synergy effect during microwave co-pyrolysis of biomass and lignite. J. Anal. Appl. Pyrol. 2017, 128, 75–82. [Google Scholar] [CrossRef]
  77. Abdullah, H.; Wu, H. Biochar as a fuel: 1. Properties and grindability of biochars produced from the pyrolysis of mallee wood under slow-heating conditions. Energy Fuels 2009, 23, 4174–4181. [Google Scholar]
Figure 1. Bulk density (A) and total porosity (B) of biochar produced from PPS. Different letters above bars indicate significant differences (p < 0.05; n = 4; ANOVA; Tukey’s HSD test).
Sustainability 14 02295 g001
Table 1. Colour phase correlation with temperature range for different PPS load and reaction time during conversion process.
Load (kgkiln−1)Reaction Time (min)Color Phase DevelopmentCorresponding Temperature Range (°C)
89Grey350–400
810Blue450–500
1311Grey350–400
1313Blue450–500
1815Grey350–400
1816Blue450–500
Table 2. Effect of process parameters on yield, ash, volatile matter and fixed carbon of biochar produced from PPS.
Load (kgkiln−1)Reaction Time (min)Temp. Range (°C)Biochar Yield 1 (%)Ash 2 (%)VM 2 (%)FC 2 (%)
89350–40021.3 ± 1.0 b32.9 ± 0.9 b26.0 ± 2.0 a41.1 ± 0.9 d
810450–50018.5 ± 0.3 c40.1 ± 0.9 a16.7 ± 0.5 b43.1 ± 0.6 d
1311350–40021.6 ± 1.0 b40.4 ± 0.4 a15.8 ± 0.4 b43.8 ± 0.7 d
1313450–50013.5 ± 0.3 d41.7 ± 0.5 a11.8 ± 0.5 c46.7 ± 1.0 c
1815350–40036.1 ± 0.8 a31.2 ± 0.7 b16.9 ± 0.9 b51.9 ± 0.7 b
1816450–50035.0 ± 0.6 a21.3 ± 1.0 c13.4 ± 0.9 c65.3 ± 3.0 a
Value is the mean ± standard deviation; Mean values followed by different letters within the same column are significantly different (p < 0.05; n = 4; ANOVA; Tukey’s HSD test); 1 Biochar yield expressed on air-dried weight basis; 2 Ash, volatile matter (VM) and fixed carbon (FC) content were expressed on dry weight basis.
Table 3. Effect of process parameters on chemical properties of biochar produced from PPS.
Load
(kg kiln−1)
Reaction Time
(min.)
Temp. Range
(°C)
pHEC
(dS m−1)
CEC
(cmol kg−1)
Total Concentration (g kg−1)C/N Ratio
NPKC
89350–4007.4 ± 0.22 a0.01 ± 0.0 b17.0 ± 1.0 c11.1 ± 0.7 d3.3 ± 0.2 e4.0 ± 0.6 a665.7 ± 0.8 e60.5
810450–5007.4 ± 0.08 a0.02 ± 0.01 ab14.0 ± 3.0 c13.0 ± 1.0 bc4.0 ± 0.2 de4.0 ± 0.6 a666.4 ± 6.0 e51.3
1311350–4007.5 ± 0.08 a0.03 ± 0.01 ab39.0 ± 3.0 a11.0 ± 0.5 d5.0 ± 0.2 c4.1 ± 0.3 a719.0 ± 4.0 d65.4
1313450–5007.7 ± 0.08 a0.04 ± 0.01 ab33.0 ± 0.9 b14.0 ± 1.0 b6.0 ± 0.2 b4.0 ± 0.3 a730.0 ± 4.0 c52.1
1815350–4007.6 ± 0.22 a0.05 ± 0.01 a43.0 ± 1.0 a11.3 ± 0.3 cd3.8 ± 0.3 de4.1 ± 0.2 a740.0 ± 2.0 b65.8
1816450–5007.8 ± 0.08 a0.05 ± 0.01 a40.0 ± 1.0 a17.0 ± 0.6 a8.0 ± 0.3 a4.0 ± 0.6 a756.5 ± 1.0 a44.5
Value is the mean ± standard deviation; mean values followed by different letters within the same column are significantly different (p < 0.05; n = 4; ANOVA; Tukey’s HSD test).
Table 4. Changes in total carbon (C) and nitrogen (N) levels during conversion of PPS to biochar.
Load
(kg kiln−1)
Reaction Time
(min.)
Temp. Range
(°C)
Biochar Yield
(kg)
Total C in PPS
(kg)
Total C
in Biochar (kg)
C Recovery
in Biochar #
(%)
Total N
in PPS
(kg)
Total N
in Biochar
(kg)
N Recovery in Biochar #
(%)
89350–4001.73.71.130.8 ± 0.04 a0.100.0220.7 ± 1.3 a
810450–5001.53.71.026.8 ± 0.23 b0.100.0221.2 ± 1.6 b
1311350–4002.86.02.033.8 ± 0.20 c0.100.0321.0 ± 1.0 c
1313450–5001.86.01.321.4 ± 0.11 d0.100.0216.7 ± 1.1 c
1815350–4006.58.34.858.1 ± 0.12 e0.200.0736.0 ± 0.9 c
1816450–5006.38.34.857.6 ± 0.10 f0.200.1152.5 ± 1.8 d
PPS: pigeon pea stalk; # value is the mean ± standard deviation; mean values followed by different letters within the same column are significantly different (p < 0.05; n = 4; ANOVA; Tukey’s HSD test).
Table 5. Estimates of H, O, O/C and H/C atomic ratios, total potential carbon and CO2 reduction potential of PPS biochar.
ParametersBiochar Production Conditions
Load (kg kiln−1)81318
Reaction time (min.)91011131516
Temp. range (°C)350–400450–500350–400450–500350–400450–500
Biochar stability
H 2.381.731.681.421.861.76
O10.335.505.063.126.295.47
O/C atomic ratio0.150.110.100.080.100.07
H/C atomic ratio0.500.400.390.350.380.33
Mean resident time (years)903.601231.661274.781462.751333.411553.58
BC+100 (%)74.0880.0580.7283.3681.5884.52
CO2 reduction potential
Total potential carbon (g kg−1)87.5679.5894.3762.93187.07228.66
CO2 reduction potential (CO2 eq kg−1) 25.6923.3427.6818.4654.8767.07
Table 6. Estimates of fuel properties of PPS biochar.
ParametersBiochar Production Conditions
Load (kgkiln−1)81318
Reaction time (min.)91011131516
Temp. range (°C)350–400450–500350–400450–500350–400450–500
Fuel Properties
Fuel ratio1.62.62.83.963.084.88
Energetic retention efficiency (%)23.619.623.014.745.253.0
Energy densification1.11.061.11.091.251.51
HHV (MJ kg−1)18.317.5317.618.0220.7425.01
HHV improvement0.10.060.10.090.250.51
FC densification2.422.532.582.753.053.84
FC recovery efficiency (%)51.5146.8155.5137.02110.04134.50
Publisher’s Note: MDPI stays neutral with regard to jurisdictional claims in published maps and institutional affiliations.

